Estimated effectiveness of symptom and risk screening to prevent the spread of COVID-19
- Department of Ecology and Evolution, University of Chicago, United States
- Department of Ecology and Evolutionary Biology, University of California, Los Angeles, United States
- Department of Infectious Disease Epidemiology, London School of Tropical Hygiene and Medicine, United Kingdom
- Fogarty International Center, National Institutes of Health, United States
Figures
Figure 1
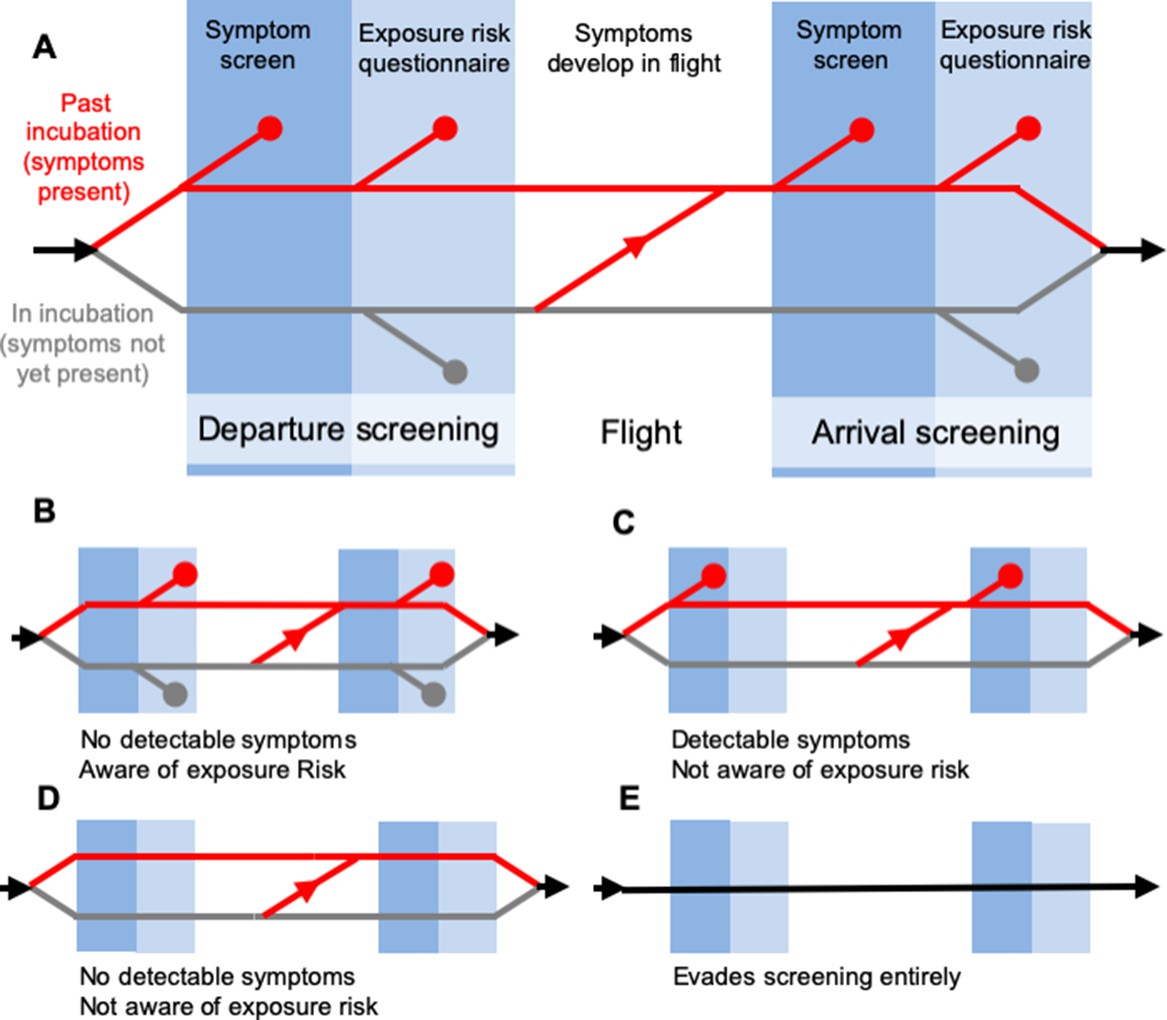
Model of traveller screening process, adapted from Gostic et al. (2015).
Infected travellers fall into one of five categories: (A) Cases aware of exposure risk and with fever or cough are detectable in both symptom screening and questionnaire-based risk screening. (B) Cases aware of exposure risk, but without fever or cough are only detectable using risk screening. (C) Cases with fever or cough, but unaware of exposure to SARS-CoV-2 are only detectable in symptom screening. (D–E) Subclinical cases who are unaware of exposure risk, and individuals that evade screening, are fundamentally undetectable.
Figure 2 with 2 supplements

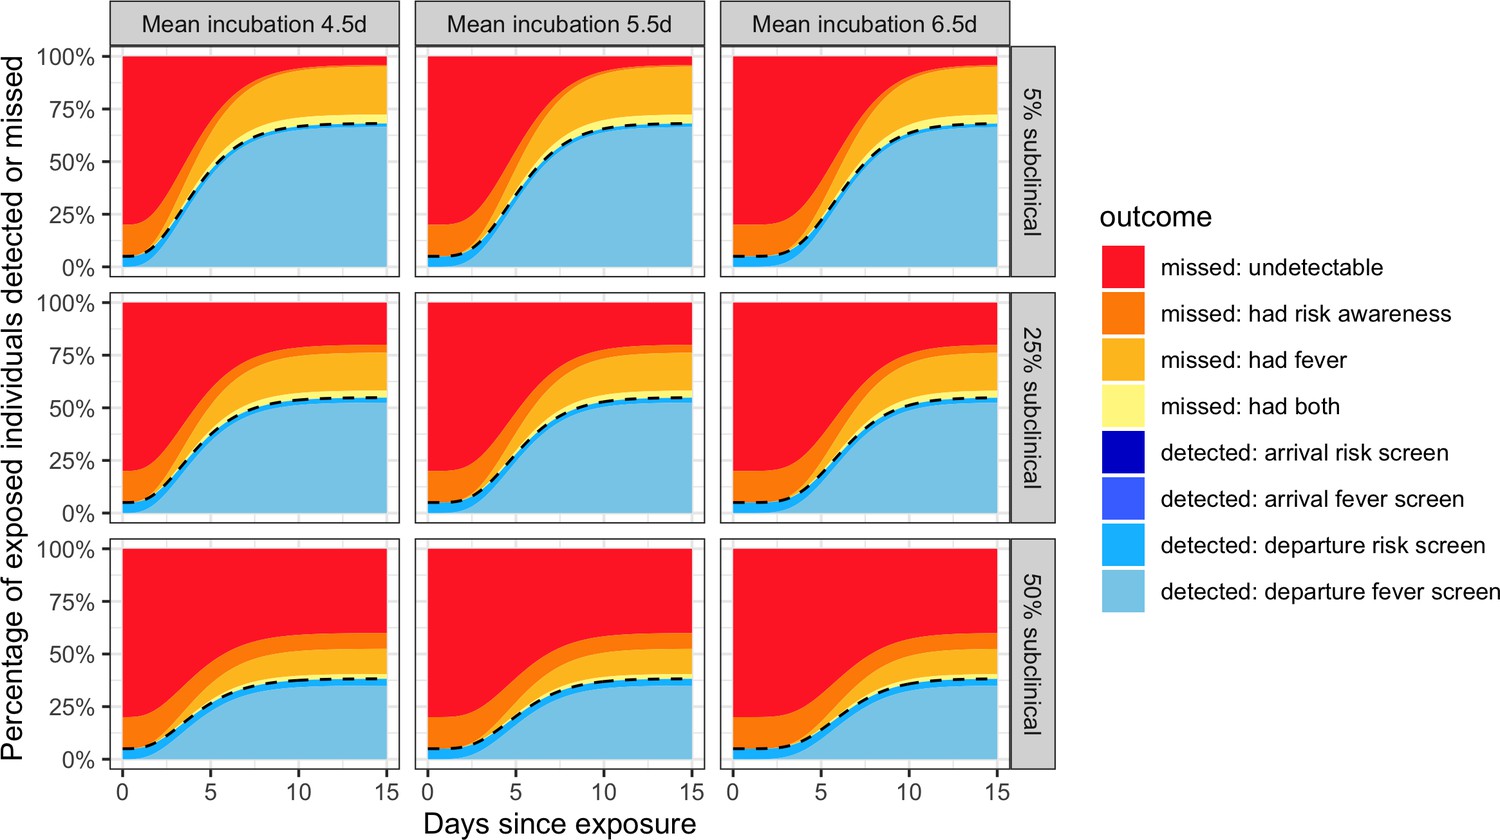
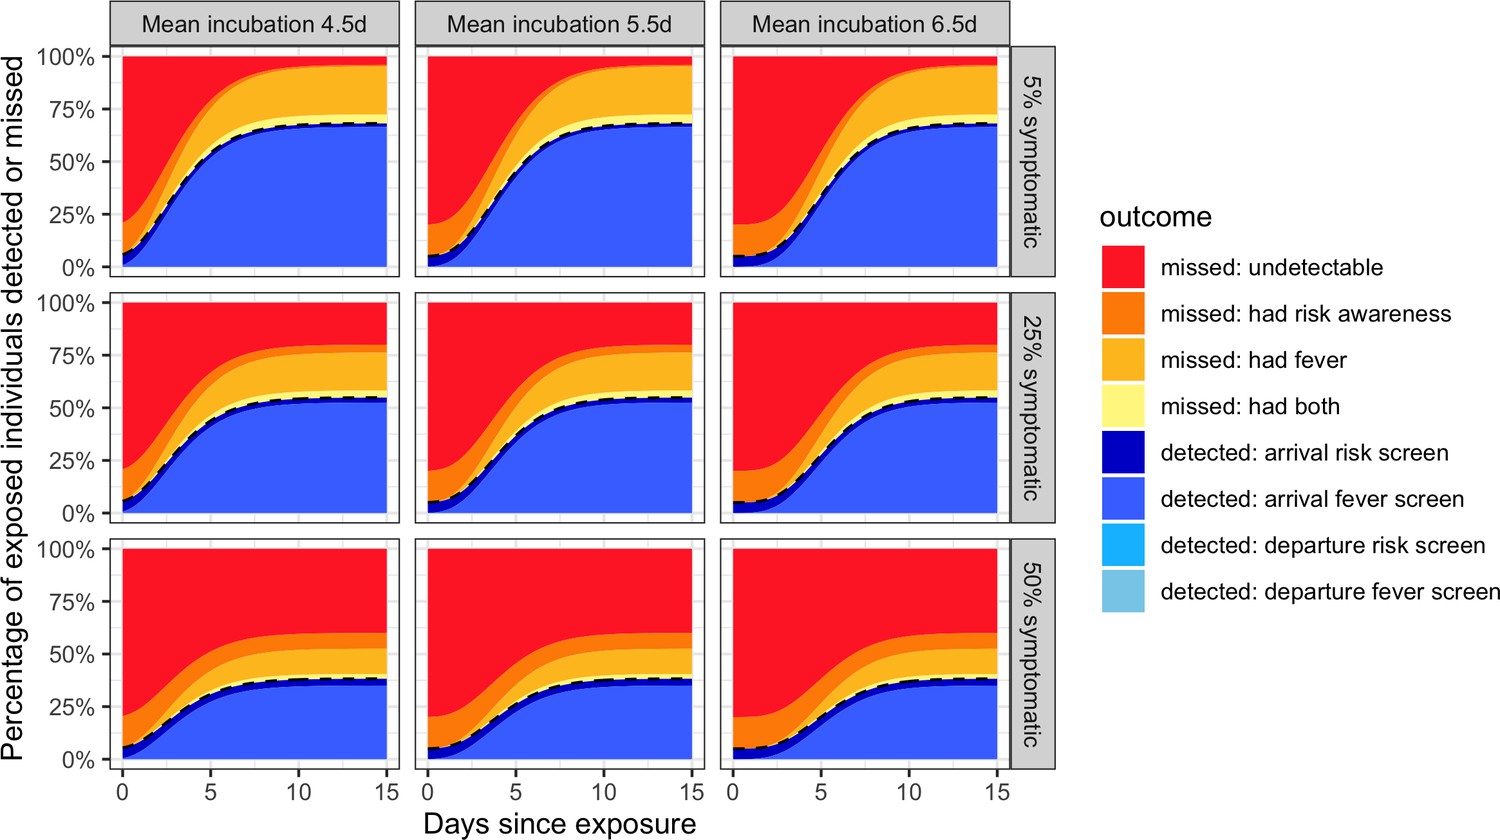
Individual outcome probabilities for travellers who screened at given time since infection.
Columns show three possible mean incubation periods, and rows show best-case, middle-case and worst-case estimates of the fraction of subclinical cases. Here, we assume screening occurs at both arrival and departure; see Figure 2—figure supplement 1 and Figure 2—figure supplement 2 for departure or arrival screening only. The black dashed lines separate detected cases (below) from missed cases (above). Here, we assume flight duration = 24 hr, the probability that an individual is aware of exposure risk is 0.2, the sensitivity of fever scanners is 0.7, and the probability that an individual will truthfully self-report on risk questionnaires is 0.25. Table 1 lists all other input values.
-
Figure 2—source data 1
Source data for Figure 2.
Raw, simulated data, and source data for Figure 2—figures supplement 1, 2 can be found as. RData or. csv files in the supplementary code.
- https://cdn.elifesciences.org/articles/55570/elife-55570-fig2-data1-v2.csv
Figure 2—figure supplement 1
Departure screening only.
Figure 2—figure supplement 2
Arrival screening only.
Figure 3 with 2 supplements
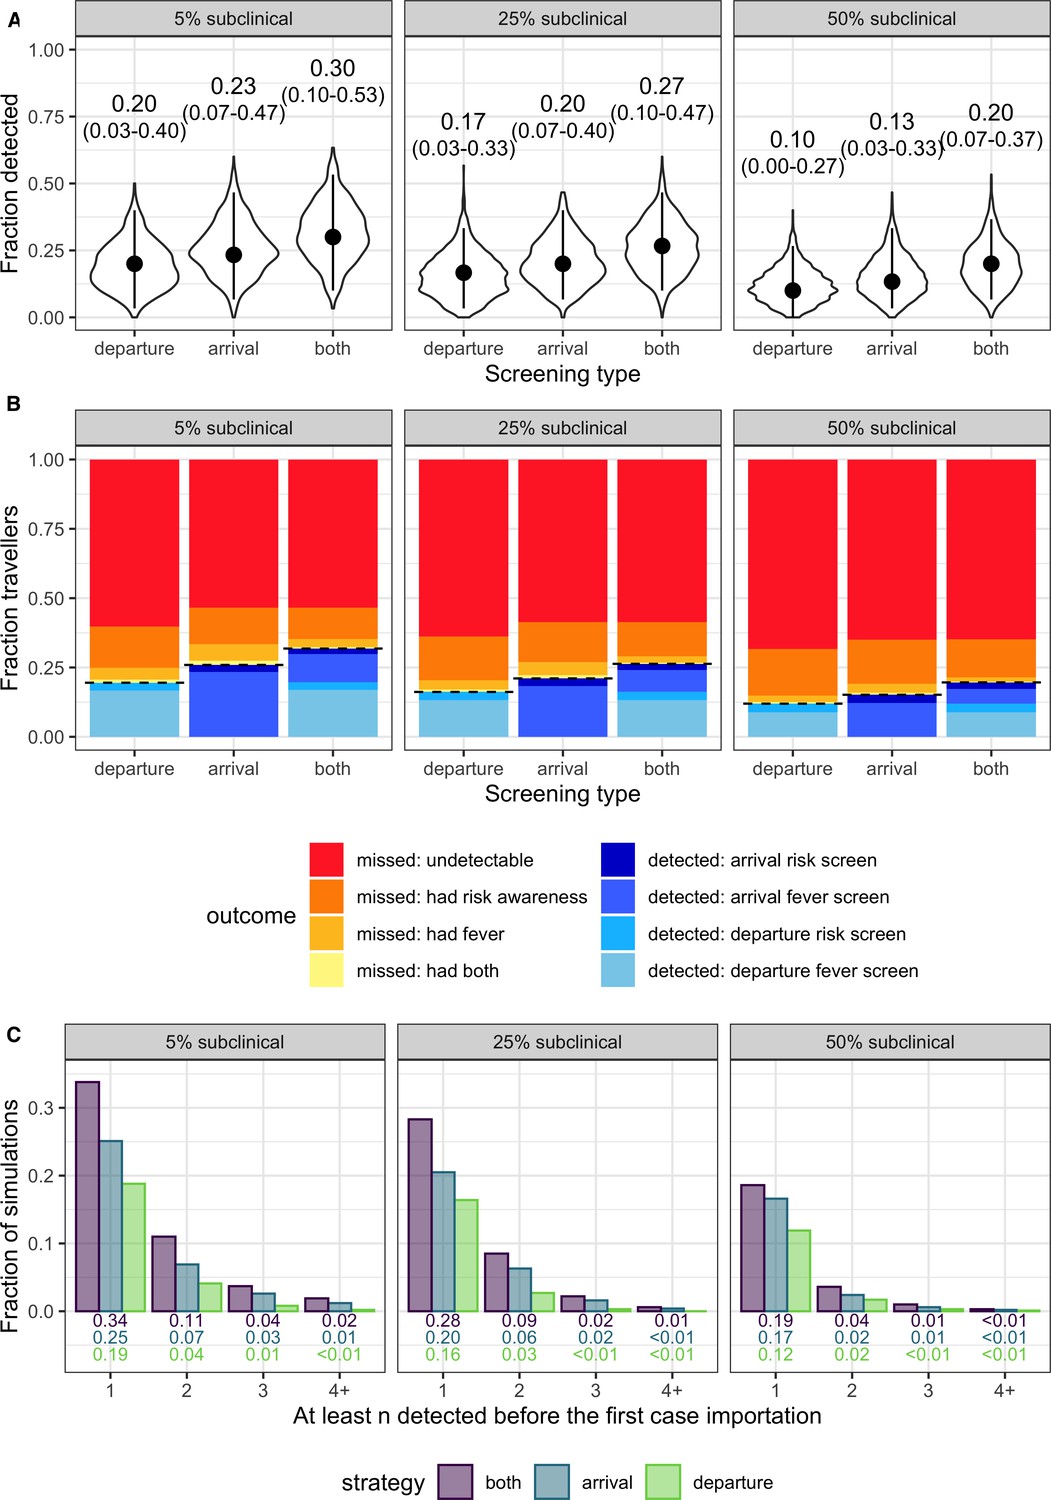
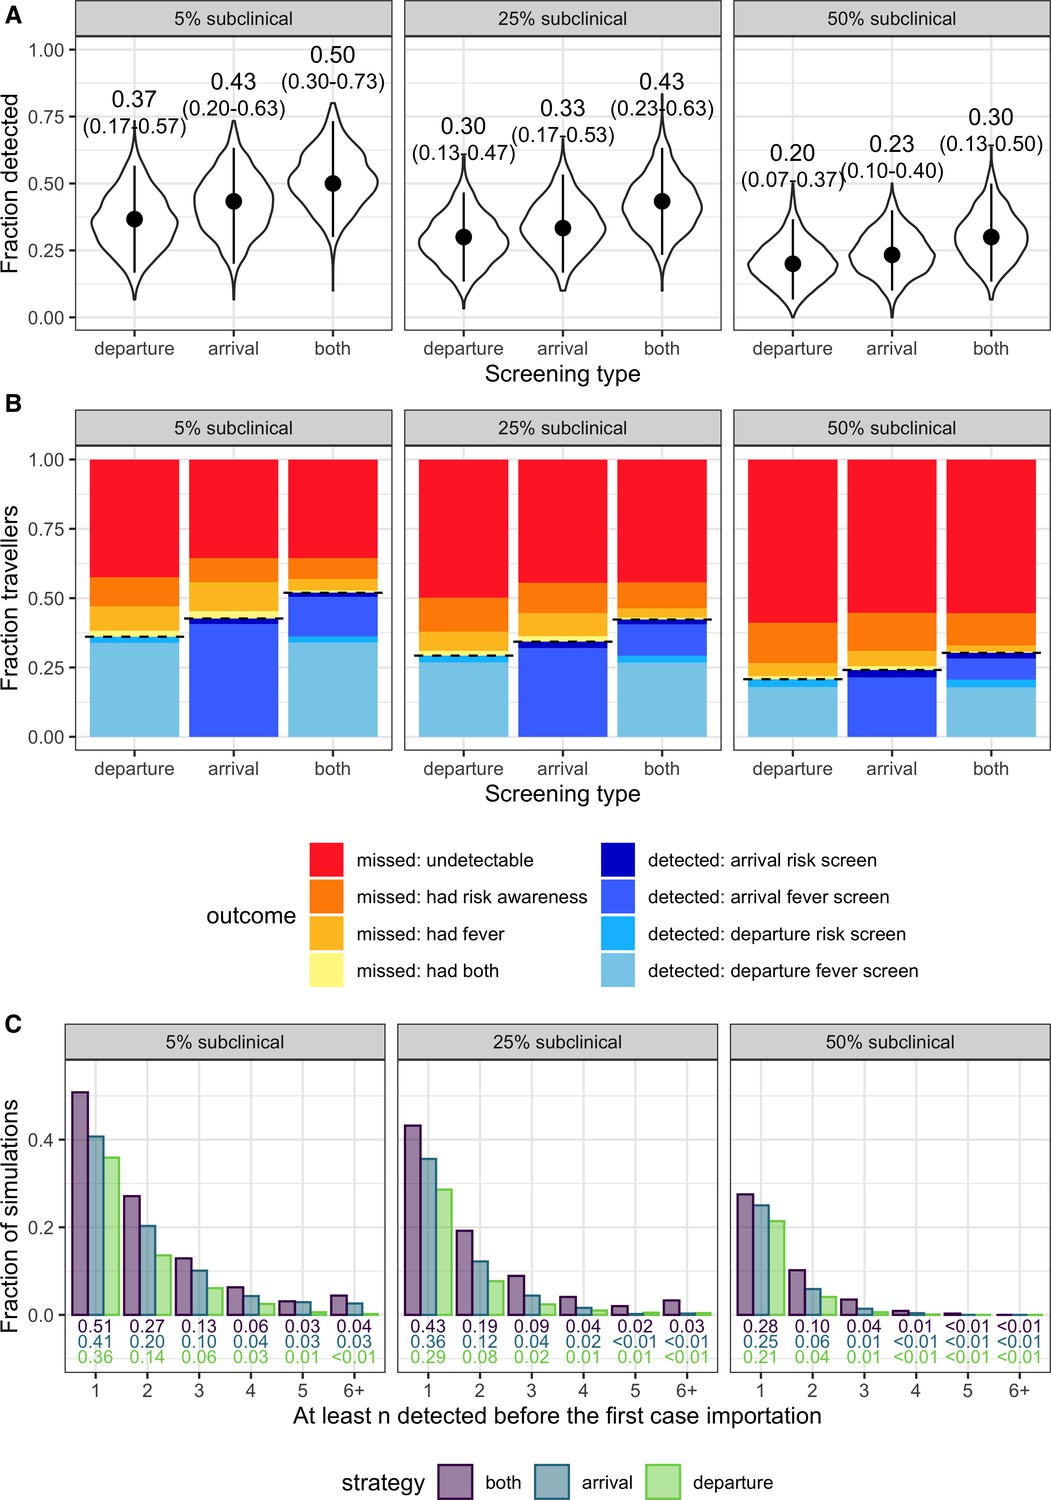
Population-level outcomes of screening programs in a growing epidemic.
(A) Violin plots of the fraction of infected travellers detected, accounting for current uncertainties by running 1000 simulations using parameter sets randomly drawn from the ranges shown in Table 1. Dots and vertical line segments show the median and central 95%, respectively. Text above each violin shows the median and central 95% fraction detected. (B) Mean fraction of travellers with each screening outcome. The black dashed lines separate detected cases (below) from missed cases (above). (C) Fraction of simulations in which screening successfully detects at least n cases before the first infected traveller is missed.
-
Figure 3—source data 1
Source data for Figure 3A.
Raw, simulated data, and source data for Figure 3—figures supplement 1, 2 can be found as. Rdata or. csv files in the supplementary code.
- https://cdn.elifesciences.org/articles/55570/elife-55570-fig3-data1-v2.csv
-
Figure 3—source data 2
Source data for Figure 3B.
- https://cdn.elifesciences.org/articles/55570/elife-55570-fig3-data2-v2.csv
-
Figure 3—source data 3
Source data for Figure 3C.
- https://cdn.elifesciences.org/articles/55570/elife-55570-fig3-data3-v2.csv
Figure 3—figure supplement 1
Population-level screening outcomes given that the source epidemic is no longer growing.
(A-C) are as dscribed in Figure 3.
Figure 3—figure supplement 2

Plausible incubation period distributions underlying the analyses in Figure 3.
Each line shows the probability density function of the gamma distribution with different plausible means and a standard deviation of 2.25. The parameter values were picked based on the best-fit gamma distributions reported in Backer et al. (2020) and Lauer et al. (2020).
Figure 4 with 2 supplements

Sensitivity analysis showing partial rank correlation coefficient (PRCC) between each parameter and the fraction (per-simulation) of 30 infected travellers detected.
Outcomes were obtained from 1000 simulations, each using a candidate parameter sets drawn using Latin hypercube sampling. Text shows PRCC estimate, and * indicates statistical significance after Bonferroni correction (threshold = 9e-4 for 54 comparisons).
-
Figure 4—source data 1
Source data for Figure 4, and Figure 4—figures supplement 1.
Source data for Figure 4—figures supplement 2 can be found as a. csv file in the supplementary code.
- https://cdn.elifesciences.org/articles/55570/elife-55570-fig4-data1-v2.csv
Figure 4—figure supplement 1
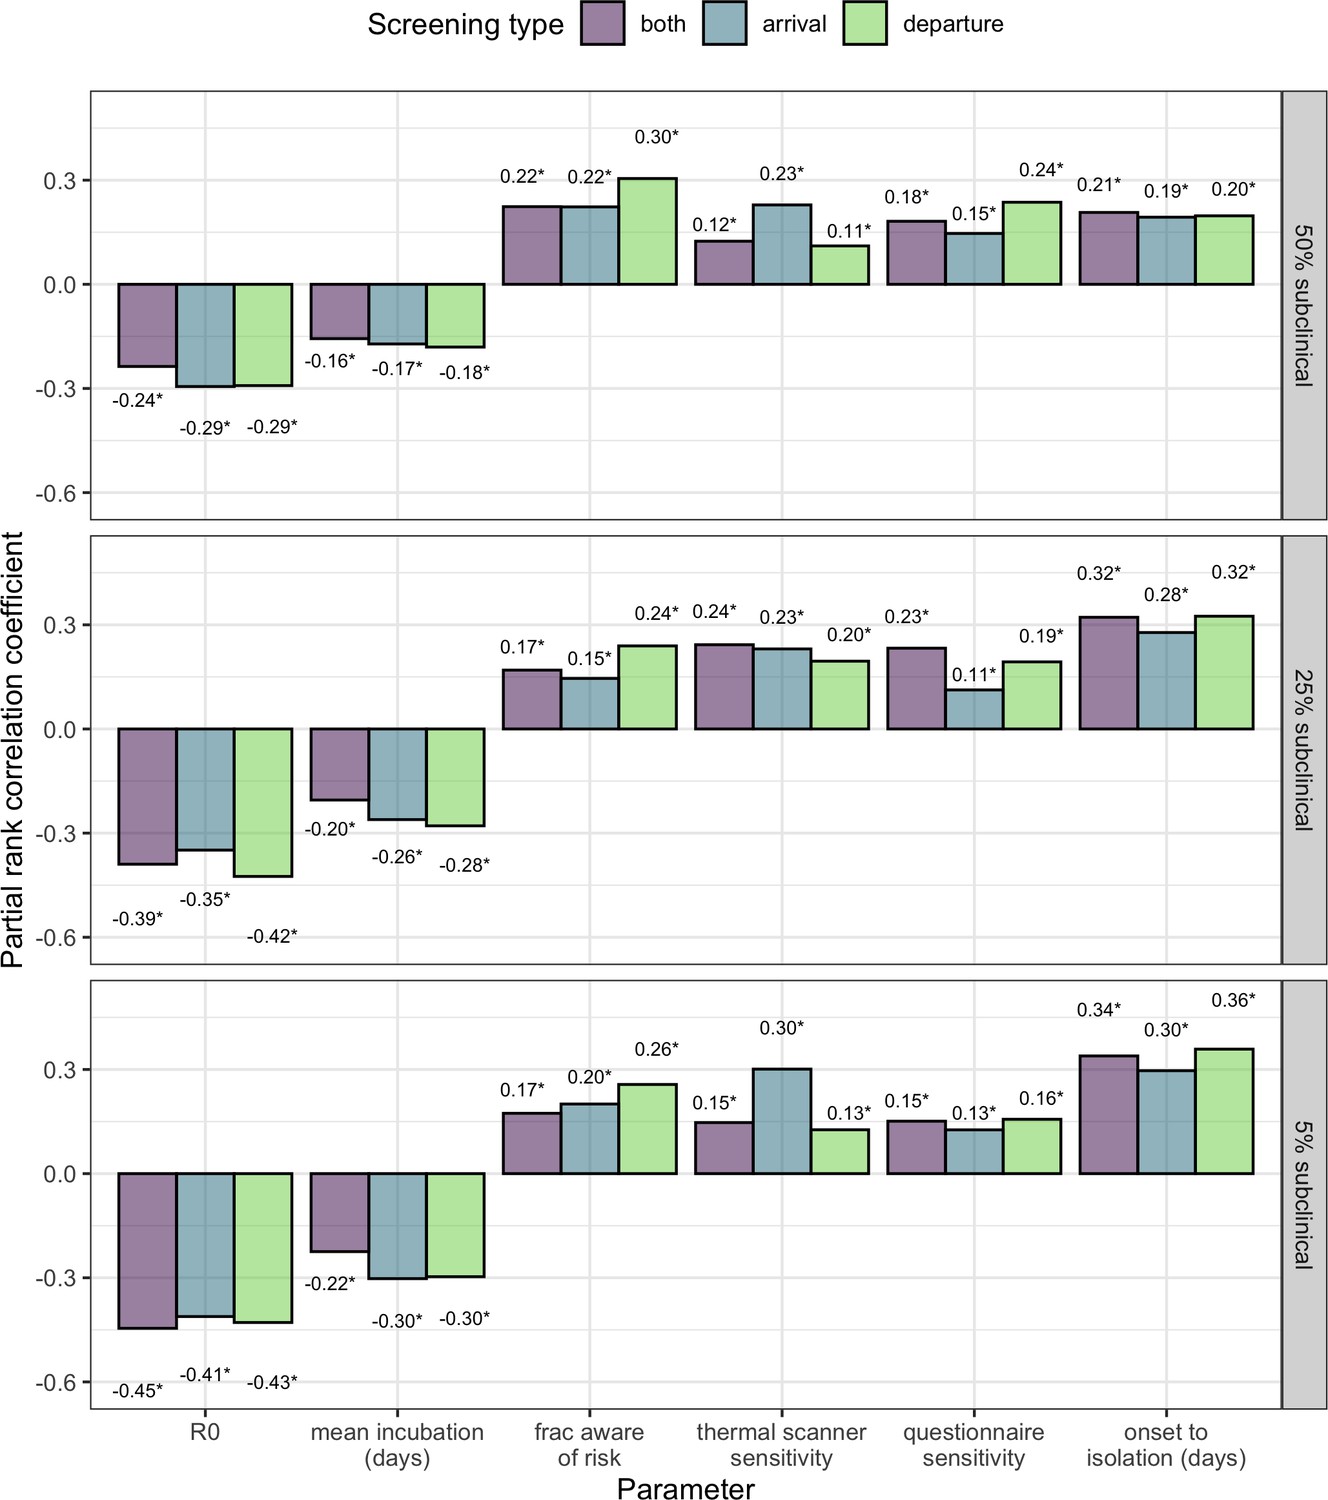
PRCC analysis comparing cases where 5%, 25% or 50% of cases are subclinical.
(Middle panel is identical to Figure 4, but repeated for ease of comparison).
Figure 4—figure supplement 2
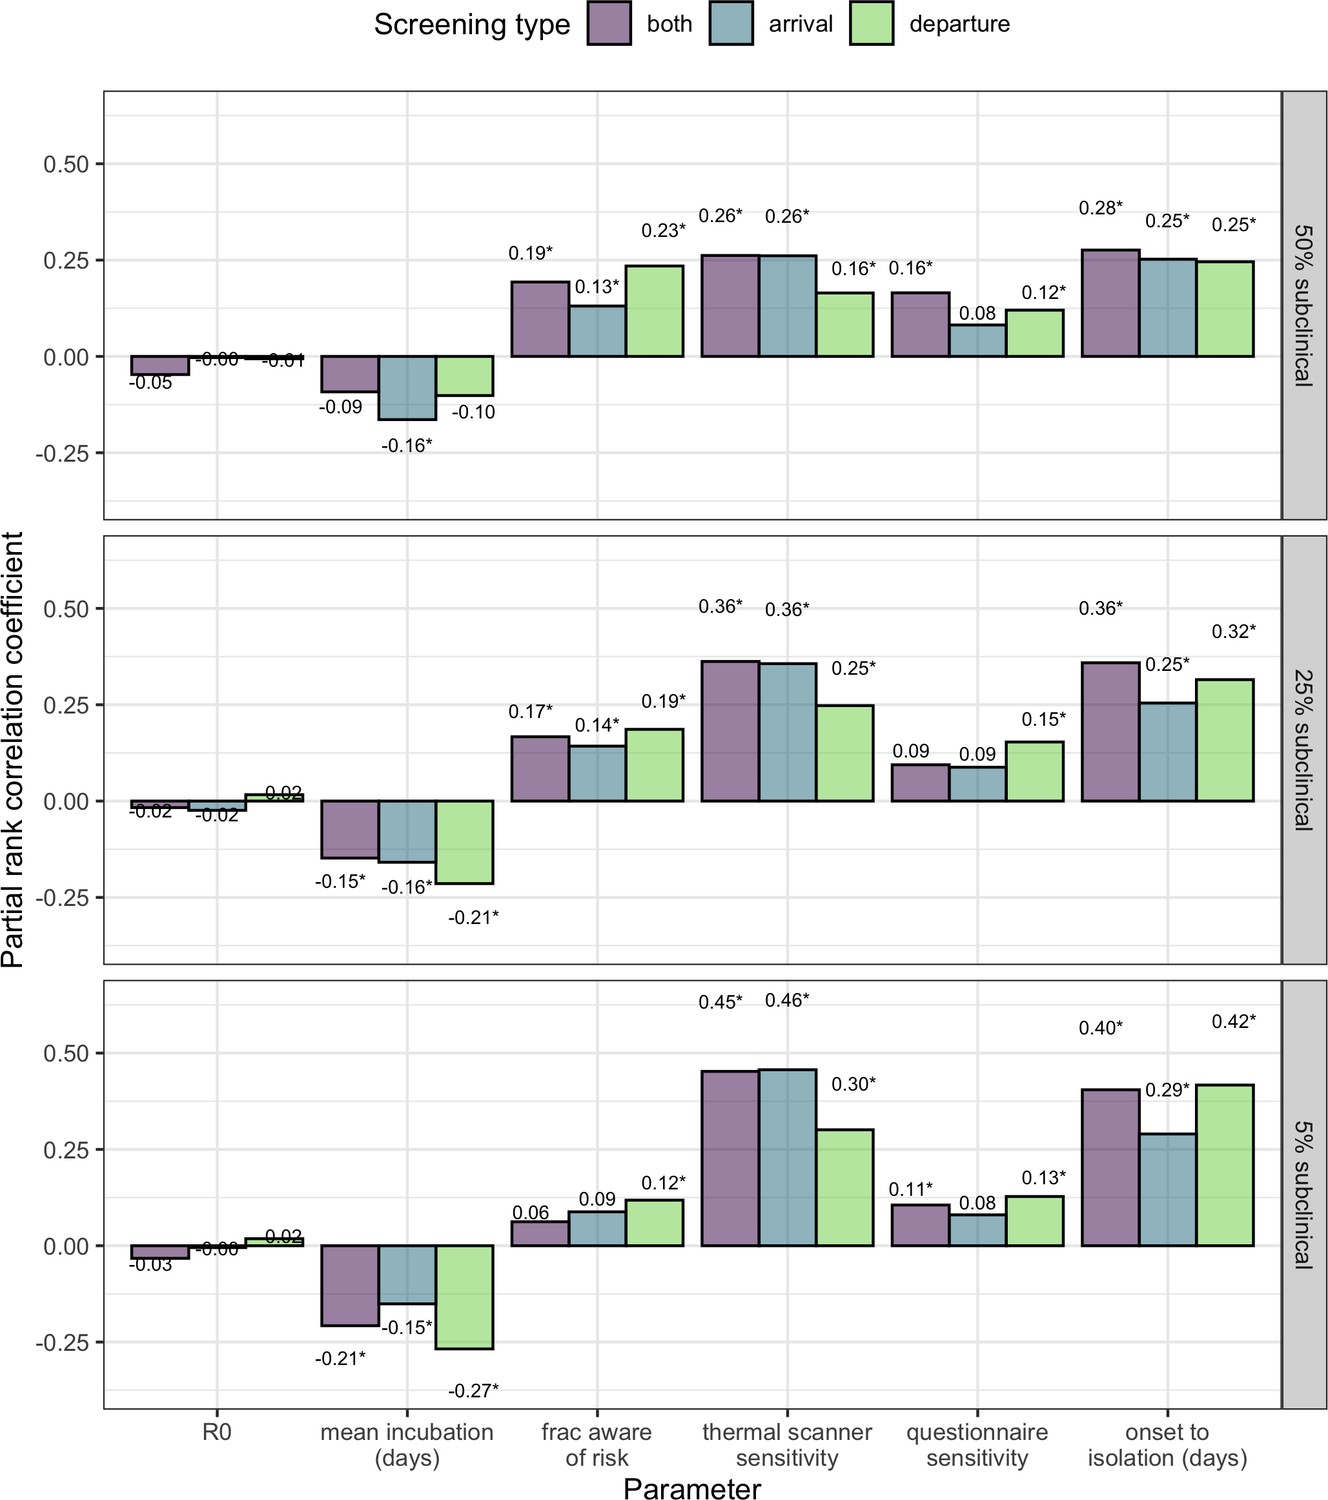
PRCC analysis assuming the source epidemic is no longer growing.
By construction, R0 has no impact in a flat epidemic. Small PRCC estimates for R0 arise from stochasticity in simulated outcomes, but are never significantly different from zero.
Tables
Table 1
Parameter values estimated in currently available studies, along with accompanying uncertainties and assumptions.
Ranges in the final column reflect confidence interval, credible interval, standard error or range reported by each study referenced.
| Parameter | Best estimate (Used in Figure 2) | Plausible range (Used in Figure 3) | References and notes |
|---|---|---|---|
| Mean incubation period | 5.5 days Sensitivity: 4.5 or 6.5 days | 4.5–6.5 days | 3–6 days, n = 4 (Chan et al., 2020)* 5.2 (4.1–7.0) days, n < 425 (Li et al., 2020)† 5.2 (4.4–6.0) days, n = 101 (Lauer et al., 2020)† 6.5 (5.6–7.9) days, n = 88 (Backer et al., 2020)† |
| Incubation period distribution | Gamma distribution with mean as above, and standard deviation = 2.25 | ||
| Percent of cases subclinical (No fever or cough) | Best case scenario: 5% Middle case scenario: 25% Worst case scenario: 50% | Clinical data: 83% fever, 67% cough, n = 6 (Chan et al., 2020) 83% fever, 82% cough, n = 99 (Chen et al., 2020) 98% fever, 76% cough, n = 41 (Huang et al., 2020) 43.8% fever at hospital admission, 88.7% fever during hospitalization, n = 1099 (Guan et al., 2020) Active monitoring after repatriation flights or on cruise ships: % asymptomatic at diagnosis 31.2% (111/355) (Japan Ministry of Health, Labor and Welfare, 2020) 65.2% (5 of 8) (Nishiura et al., 2020) 70.0% (7 of 10) (Dorigatti et al., 2020) | |
| R0 | No effect in individual-level analysis. | 1.5–4.0 | 2.2 (1.4–3.8) (Riou and Althaus, 2020) 2.2 (1.4–3.9) (Li et al., 2020) 2.6 (1.5–3.5) (Imai et al., 2020) 2.7 (2.5–2.9) (Wu et al., 2020) 4.5 (4.4-4.6) (Liu et al., 2020) 3.8 (3.6-4.0) (Read et al., 2020) 4.08 (3.37–4.77) (Cao et al., 2020) 4.7 (2.8–7.6) (Sanche et al., 2020) 6.3 (3.3-11.3) (Sanche et al., 2020) 6.47 (5.71–7.23) (Tang et al., 2020) |
| Percent of travellers aware of exposure risk | 20% | 5–40% | We assume a low percentage, as no specific risk factors have been identified, and known times or sources of exposure are rarely reported in existing line lists. |
| Sensitivity of infrared thermal scanners for fever | 70% | 60–90% | Most studies estimated sensitivity between 60–88% (Bitar et al., 2009; Priest et al., 2011; Tay et al., 2015). But a handful of studies estimated very low sensitivity (4–30%). In general, sensitivity depended on the device used, body area targeted and ambient temperature. |
| Probability that travellers self-report exposure risk | 25% | 5–25% | 25% is an upper-bound estimate based on outcomes of past screening initiatives. (Gostic et al., 2015) |
| Time from symptom onset to patient isolation (After which we assume travel is not possible) | No effect in individual-level analysis. | 3–7 days | Median 7 days from onset to hospitalization (n = 6) (Chan et al., 2020) Mean 2.9 days onset to patient isolation (n = 164) (Liu et al., 2020) Median 7 days from onset to hospitalization (n = 41) (Huang et al., 2020) As awareness increases, times to isolation may decline. |
-
* From family cluster.
† Parametric distributions fit to cases with known dates of exposure or travel to and from Wuhan.
Additional files
Download links
A two-part list of links to download the article, or parts of the article, in various formats.
Downloads (link to download the article as PDF)
Open citations (links to open the citations from this article in various online reference manager services)
Cite this article (links to download the citations from this article in formats compatible with various reference manager tools)
Estimated effectiveness of symptom and risk screening to prevent the spread of COVID-19
eLife 9:e55570.
https://doi.org/10.7554/eLife.55570


