A systematic review of population-based studies on lipid profiles in Latin America and the Caribbean
- Department of Epidemiology and Biostatistics, School of Public Health, Imperial College London, United Kingdom
- CRONICAS Centre of Excellence in Chronic Diseases, Universidad Peruana Cayetano Heredia, Peru
- Universidad Católica Los Ángeles de Chimbote, Instituto de Investigación, Peru
- Facultad de Medicina de la Universidad Nacional de Trujillo, Peru
- Sociedad Científica de Estudiantes de Medicina de la Universidad Nacional de Trujillo-SOCEMUNT, Peru
- Universidad Científica del Sur, Peru
Figures
Figure 1 with 1 supplement
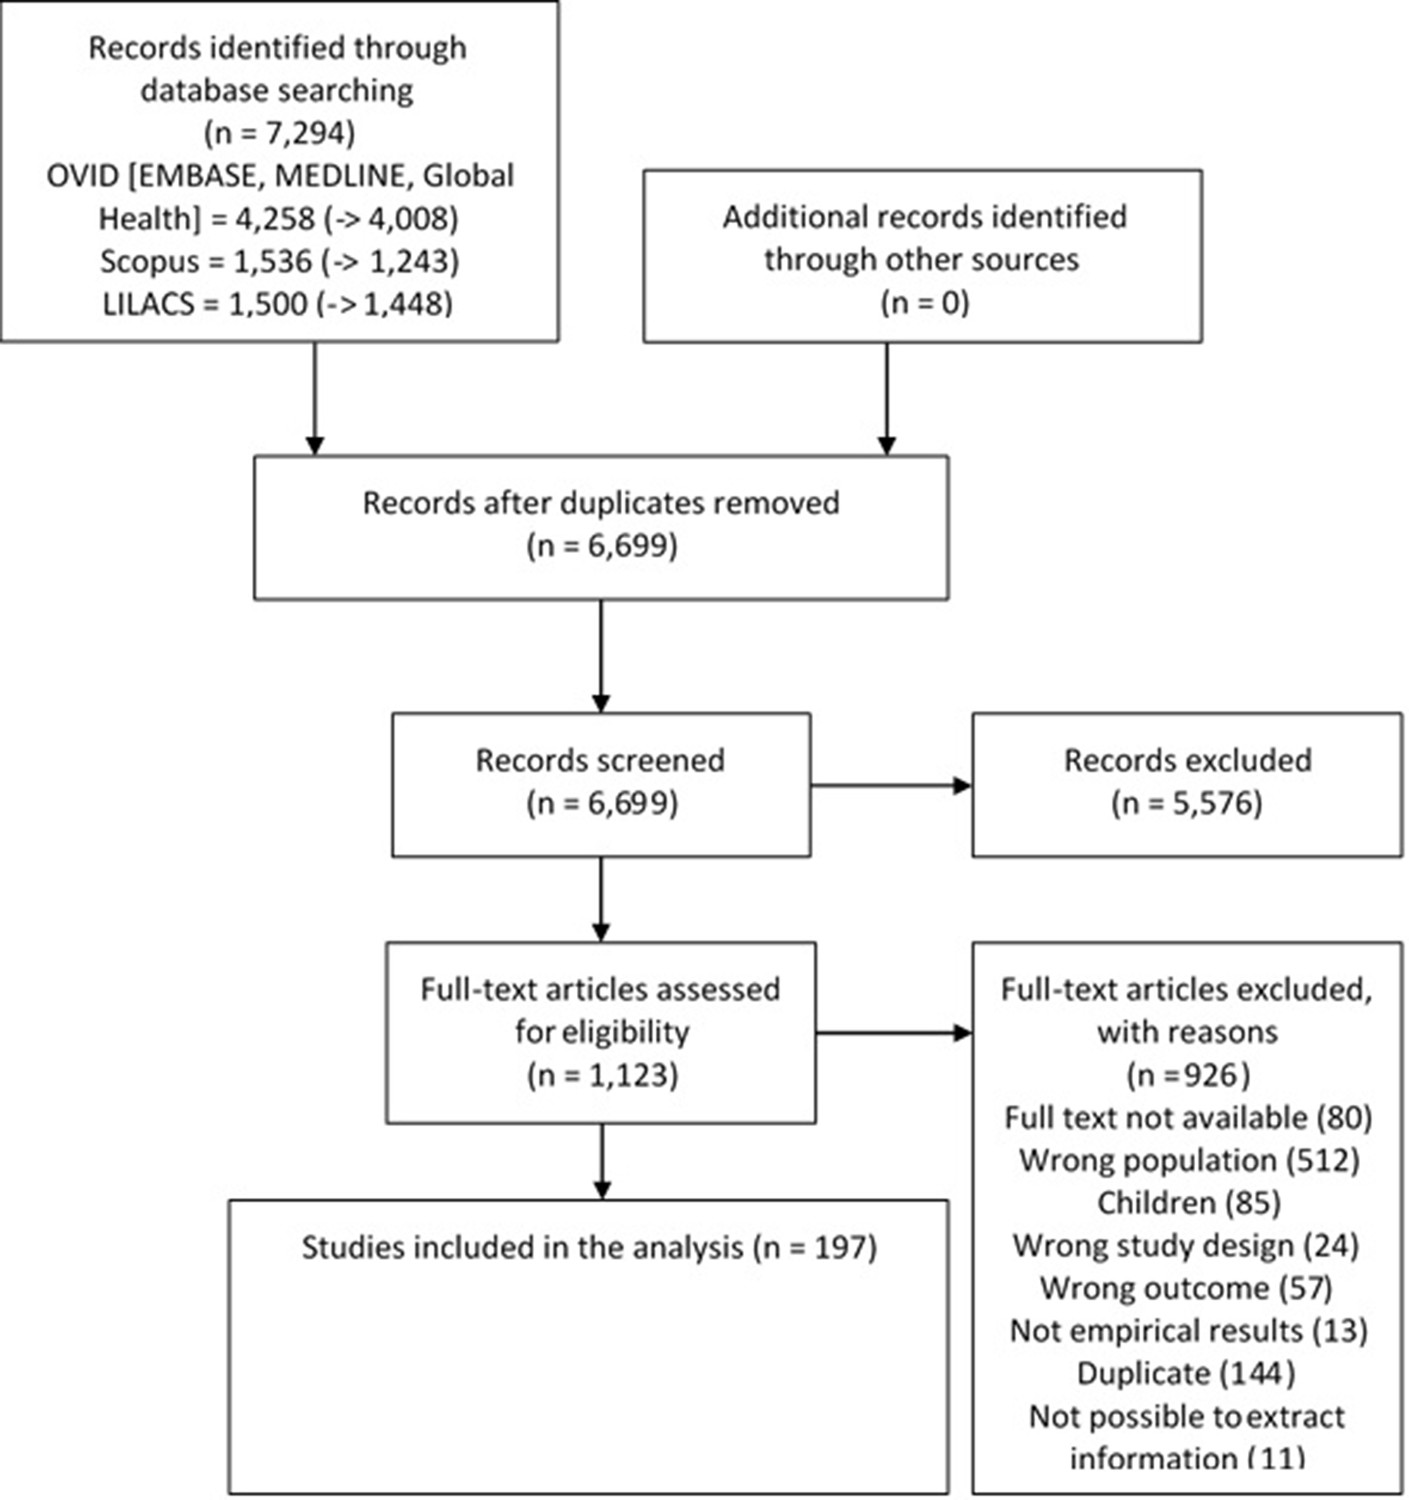
Study selection process.
Figure 1—figure supplement 1
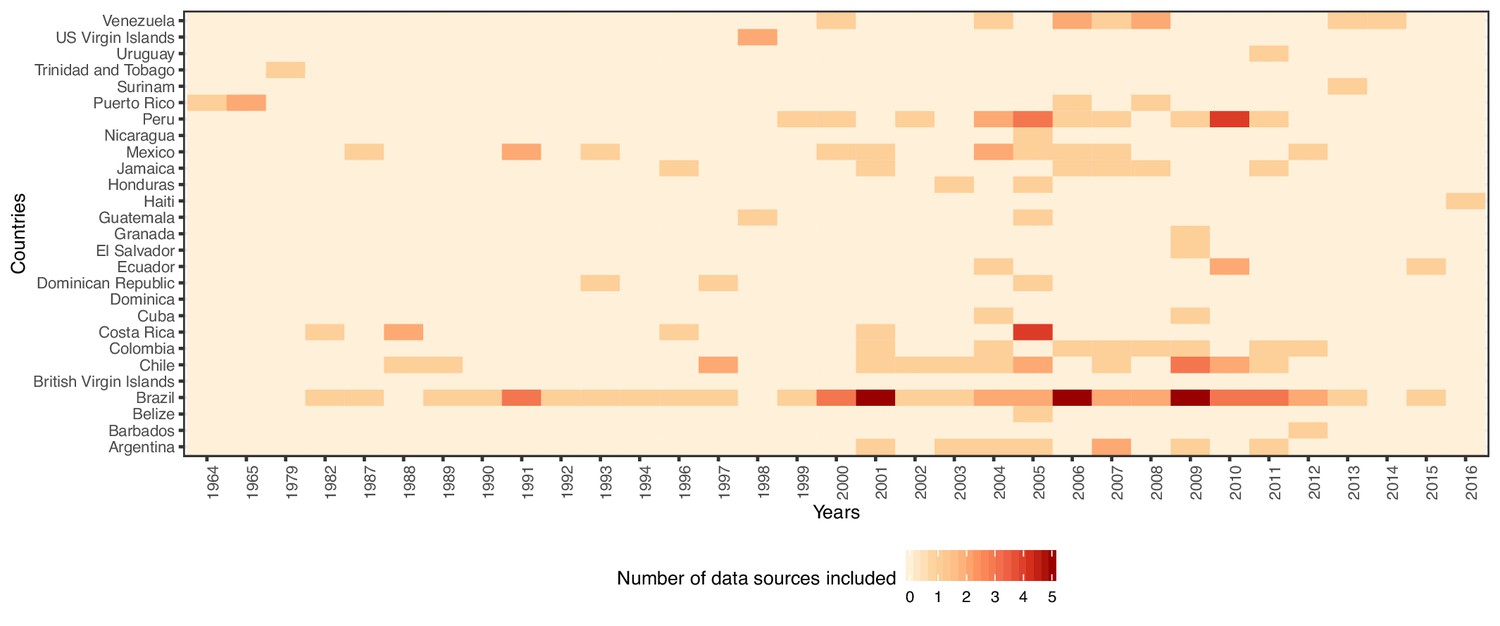
Selection process and number of data sources per year.
In this figure supplement, we show the number of data sources by country and year of data collection.
Figure 2
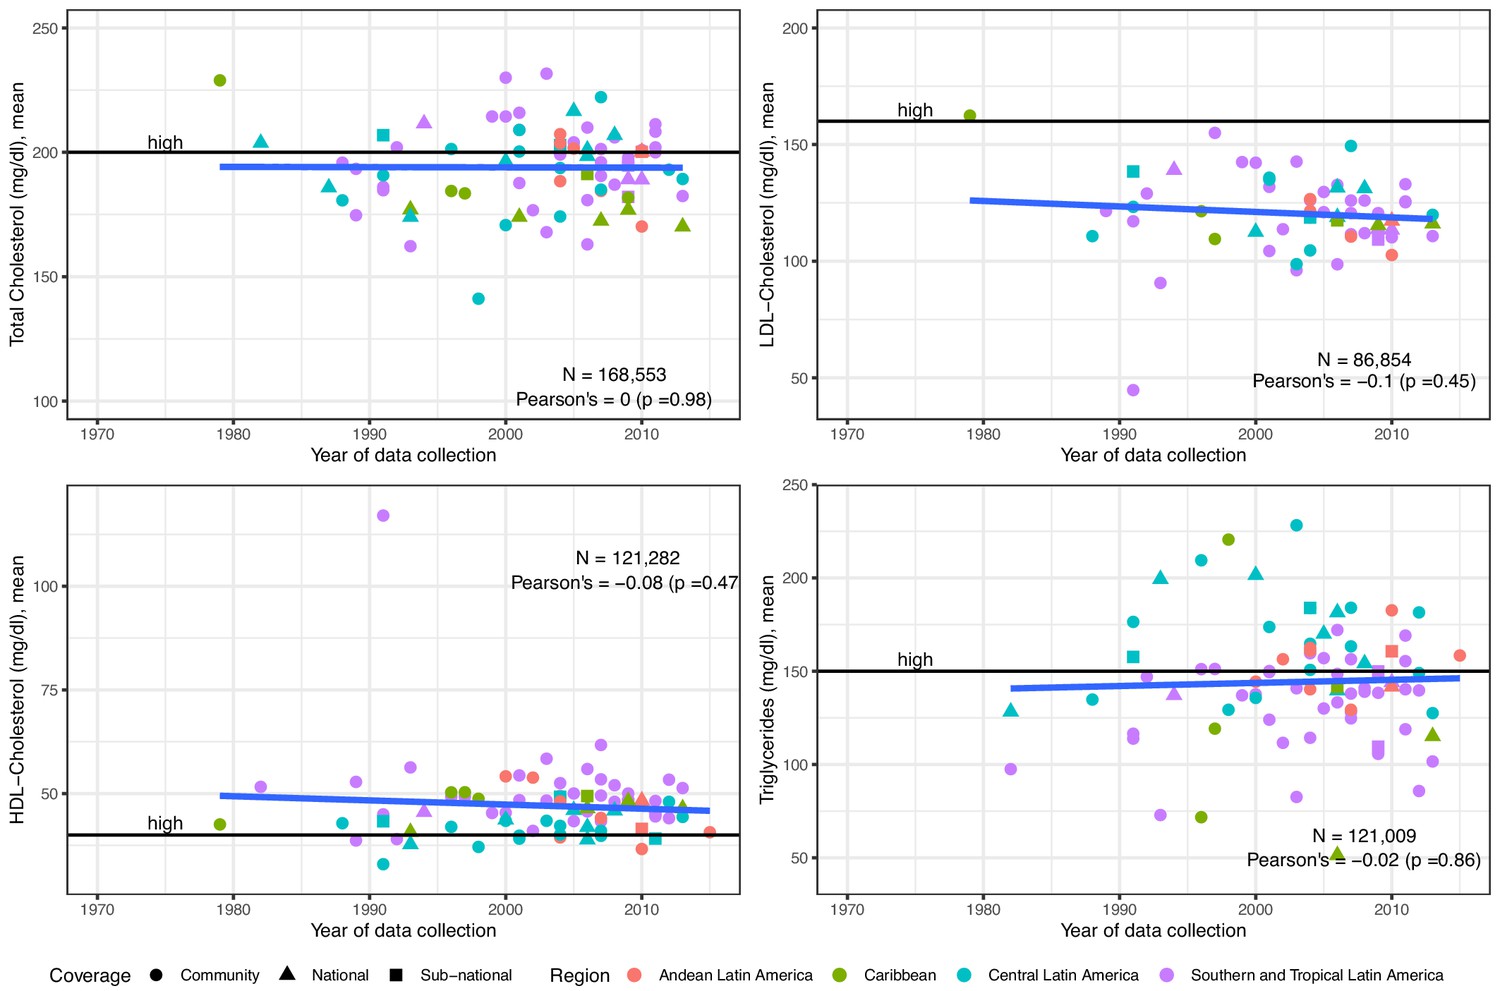
Trends in mean total cholesterol, LDL-Cholesterol, HDL-Cholesterol and triglycerides in Latin America and the Caribbean.
The solid blue line represents a linear regression trend. Year in the x-axis refers to data collection year. Countries within sub-regions are shown in Supplementary file 1, Table 5. Individual estimates are shown in Supplementary file 1, Table 2.
Figure 3
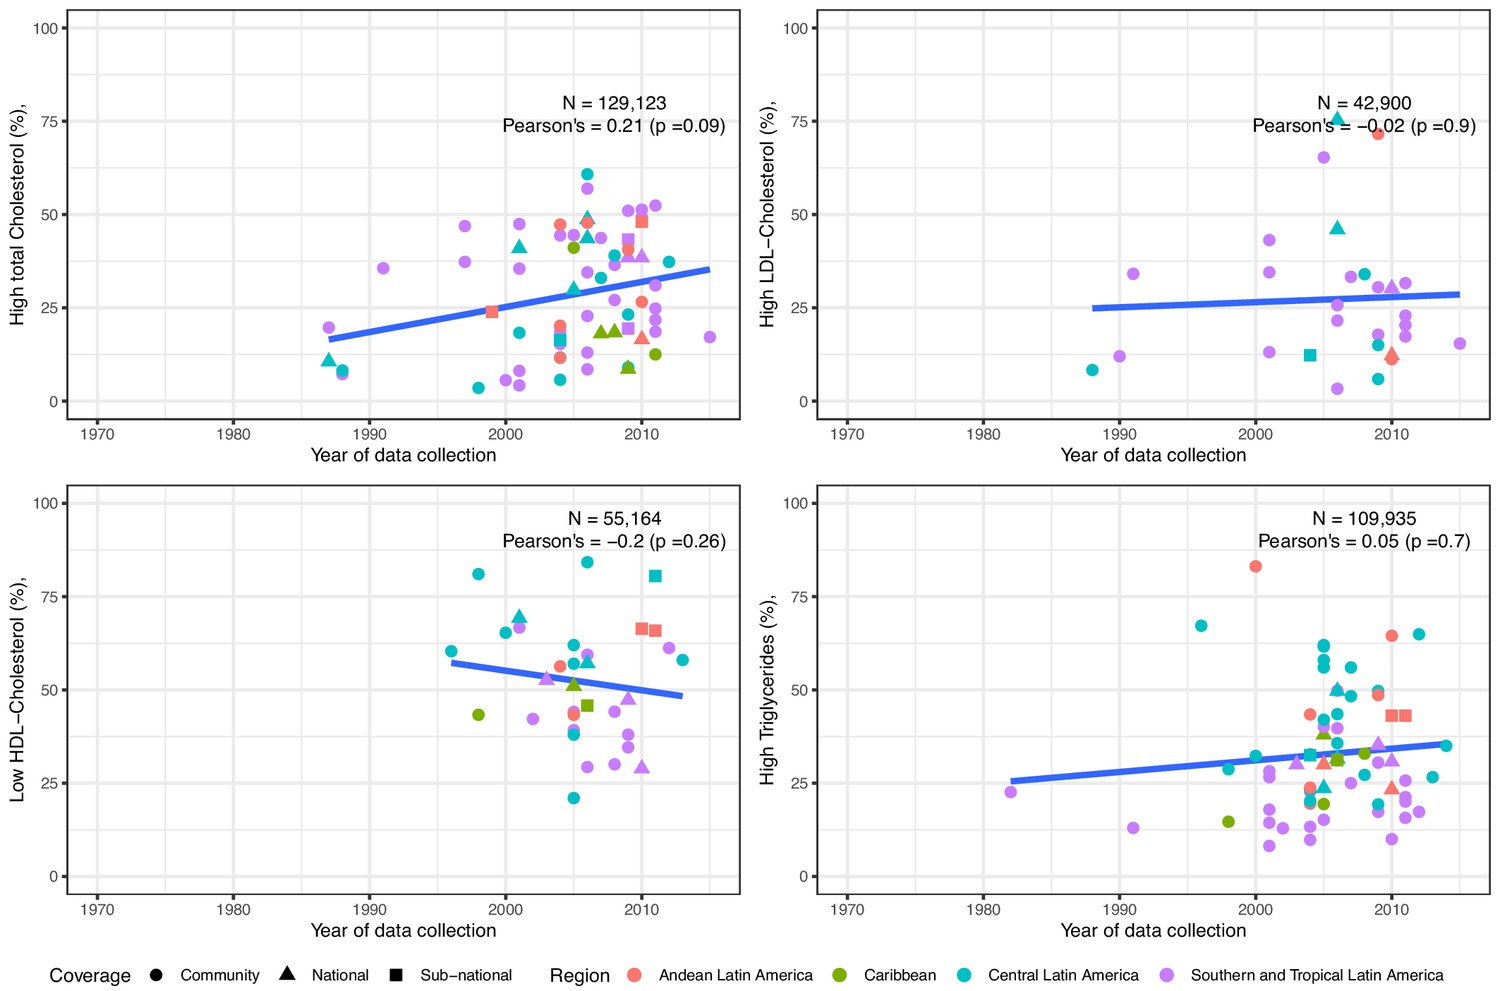
Trends in prevalence of high total cholesterol, high LDL-Cholesterol, low HDL-Cholesterol and high triglycerides in Latin America and the Caribbean. The solid blue line represents a linear regression trend.
Year in the x-axis refers to data collection year. Countries within sub-regions are shown in Supplementary file 1, Table 5. Studies included in this graphics are those with standard clinically relevant definitions. I.e., total cholesterol ≥150 mg/dl,≥200 mg/dl, or ≥240 mg/dl; LDL-Cholesterol ≥100 mg/dl,≥130 mg/dl, or ≥160 mg/dl; HDL-Cholesterol ≤40 mg/dl in men and ≤50 mg/dl in women; triglycerides ≥ 100 mg/dl,≥130 mg/dl,≥150 mg/dl, or ≥200 mg/dl. That is, prevalence estimates based on other definitions were excluded. Individual estimates are shown in Supplementary file 1, Table 3.
Tables
Table 1
Pooled mean and pooled prevalence estimates since 2005, random-effects meta-analysis.
| Mean (mg/dl) | Lower 95% confidence interval | Upper 95% confidence interval | |
|---|---|---|---|
| Total cholesterol (37 studies) | 193.39 | 189.10 | 197.68 |
| LDL-Cholesterol (30 studies) | 119.98 | 116.08 | 123.88 |
| HDL-Cholesterol (42 studies) | 46.55 | 44.99 | 48.12 |
| Triglycerides (39 studies) | 139.27 | 130.57 | 147.98 |
| Prevalence (%) | Lower 95% confidence interval | Upper 95% confidence interval | |
| High total cholesterol - ≥ 200 mg/dl (six studies) | 34.04 | 19.04 | 49.04 |
| High total cholesterol - ≥ 240 mg/dl (five studies) | 20.97 | 13.51 | 28.43 |
| High LDL-Cholesterol - ≥ 130 mg/dl (two studies) | 40.41 | 29.05 | 51.78 |
| High LDL-Cholesterol - ≥ 160 mg/dl (five studies) | 19.73 | 11.57 | 27.89 |
| Low HDL-Cholesterol ≤ 40(men) and ≤50(women) (nine studies) | 48.27 | 36.31 | 60.22 |
| High Triglycerides ≥ 150 mg/dl (12 studies) | 43.12 | 35.40 | 50.85 |
| High Triglycerides ≥ 200 mg/dl (four studies) | 20.48 | 16.28 | 24.69 |
Additional files
-
Supplementary file 1
Word document with checklist for reporting of systematic reviews; search terms used; risk of bias assessment and rationale; table describing the selected studies along with references; table with the mean levels by selected study; table with prevalence estimates by selected study.
- https://cdn.elifesciences.org/articles/57980/elife-57980-supp1-v1.docx
-
Transparent reporting form
- https://cdn.elifesciences.org/articles/57980/elife-57980-transrepform-v1.docx
Download links
A two-part list of links to download the article, or parts of the article, in various formats.
Downloads (link to download the article as PDF)
Open citations (links to open the citations from this article in various online reference manager services)
Cite this article (links to download the citations from this article in formats compatible with various reference manager tools)
A systematic review of population-based studies on lipid profiles in Latin America and the Caribbean
eLife 9:e57980.
https://doi.org/10.7554/eLife.57980


