Hepatoenteric recycling is a new disposition mechanism for orally administered phenolic drugs and phytochemicals in rats
- Department of Pharmacological and Pharmaceutical Sciences, College of Pharmacy, University of Houston, United States
- Department of Pharmaceutical Sciences, College of Pharmacy, Texas Southern University, United States
Figures
Figure 1
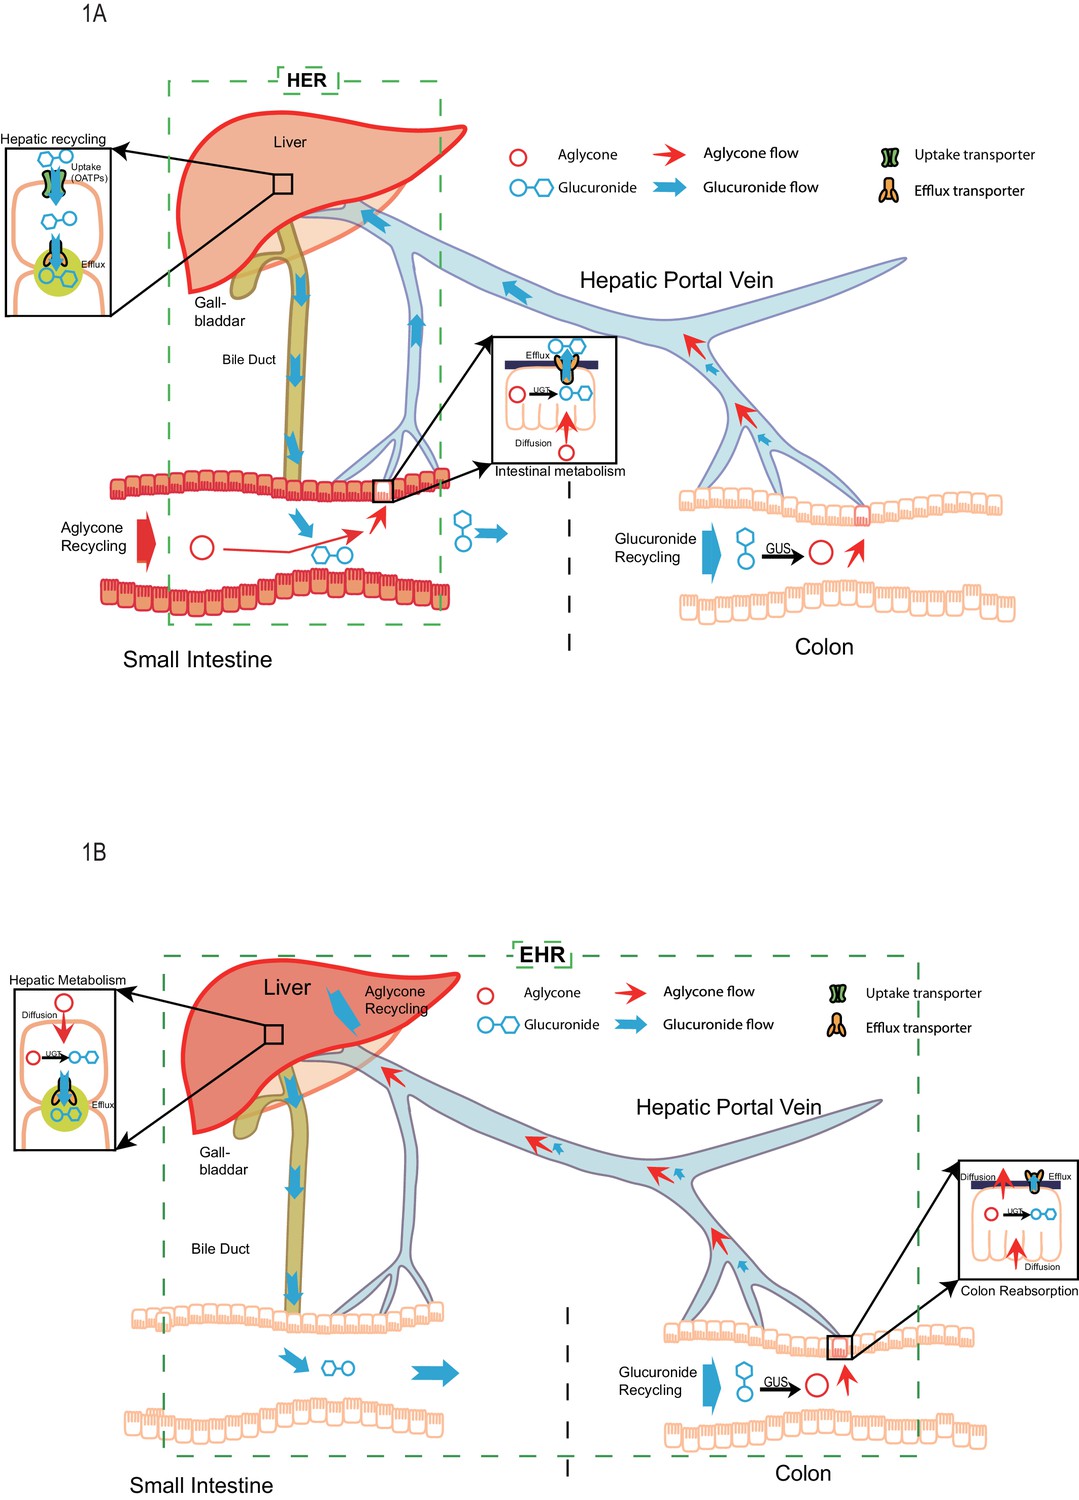
The pictorial representation of the newly proposed mechanism of hepatoenteric (HER) recycling and conventional mechanism of enterohepatic recycling/recirculation (EHR).
(A). HER starts from intestinal glucuronidation of orally dosed aglycones. The glucuronides are taken up into the hepatocytes via portal vein using hepatic uptake transporter OATPs, and then excreted back into bile by apical hepatic efflux transporters, allowing them to return to the small intestine. For biliary glucuronides, the gut microflora β-glucuronides (GUS) will hydrolyze them back into the aglycone form, which are then reabsorbed in colon to complete the recycling. (B) EHR starts from the hepatic metabolism of an aglycone entering liver (from intestinal absorption or blood circulation) into its phase II metabolites (mostly glucuronides). The glucuronides formed in the liver are excreted into bile by the apical hepatic efflux transporters,returned to the small intestine and then moved to colon, where the gut microflora GUS hydrolyze them back into the aglycone form. The aglycone is then re-absorbed from colon and reached the liver again to complete the EHR.
Figure 2 with 3 supplements
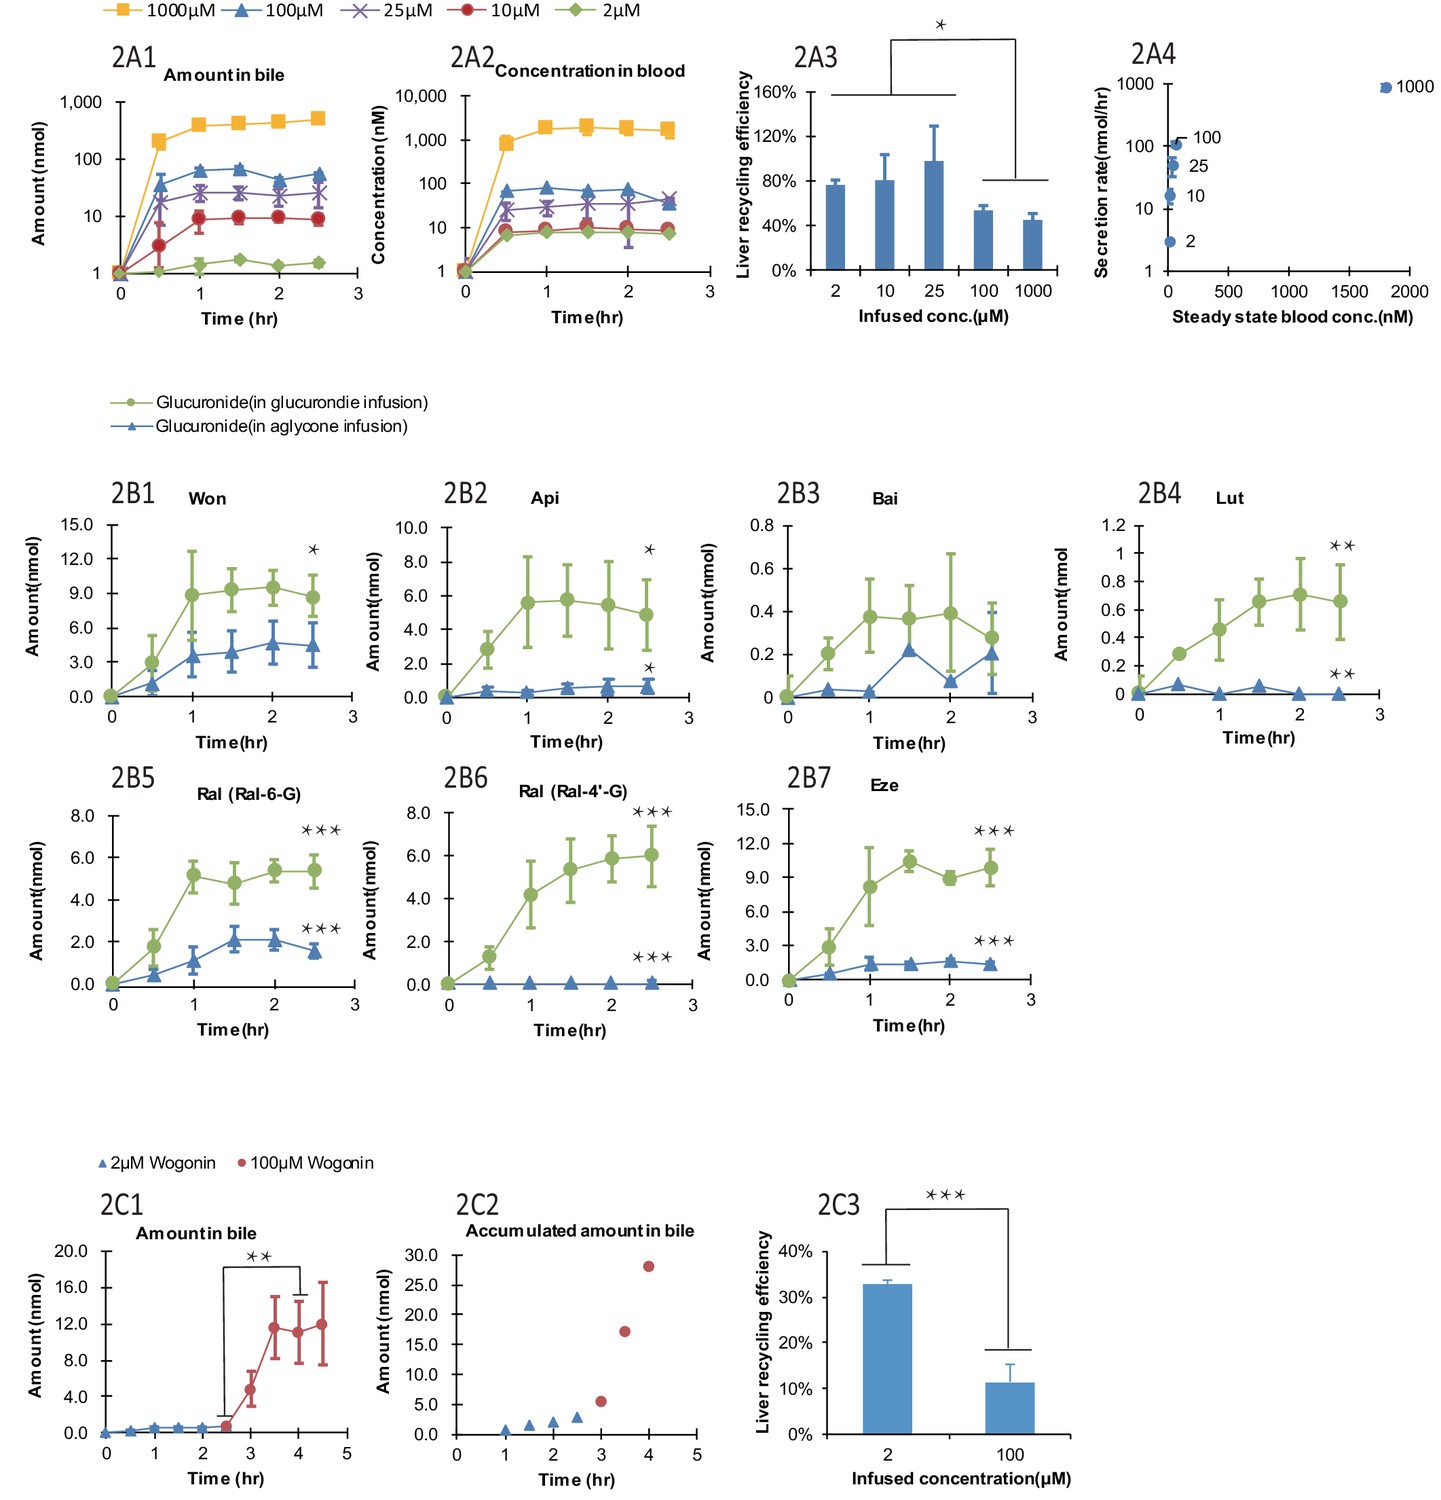
Effect of the glucuronide concentrations, aglycone structures, and aglycone concentrations on the biliary secretion, systemic exposure and liver recycling efficiency (LRE%) in a rat portal vein infusion model.
Following portal vein infusion of Won-7-G at various concentrations (2–1000 μM), amounts of glucuronide excreted into bile (A1), concentrations of glucuronide in blood (A2) and LRE% (A3) were determined, and then the biliary secretion rates of glucuronides were plotted against their steady-state blood concentrations (A4). After the hepatic infusion of seven different aglycones [Won; Api; Bai; Lut; Ral; and Eze] and their corresponding glucuronides [Won-7-G; Api-7-G; Bai-7-G; Lut-3’-G; Ral-6-G; Ral-4’-G and Eze-4’-G] at 10 μM concentration, amount of the glucuronides secreted in bile during portal vein infusion of aglycones versus glucuronides were determined (B1–B7). Following the portal vein infusion of Won at 2 μM for the first 2.5 hr and at 100 μM for next 2 hr, the amount of Won-7-G secreted in bile (C1), the accumulated amount of Won-7-G secreted in bile (C2), and LRE% (C3) at low (2 μM) and high (100 μM) concentrations of Won were compared to study the effect of protein binding of Won on its liver uptake. The liver concentrations of Won and Won-7-G could be found in Appendix 2—table 2. 4. Four male Wistar rats were used in each experimental group. Statistical significance was calculated using student t test ('*', '**', and '***' indicates p<0.05, p<0.01, and p<0.001, respectively).
Figure 2—figure supplement 1
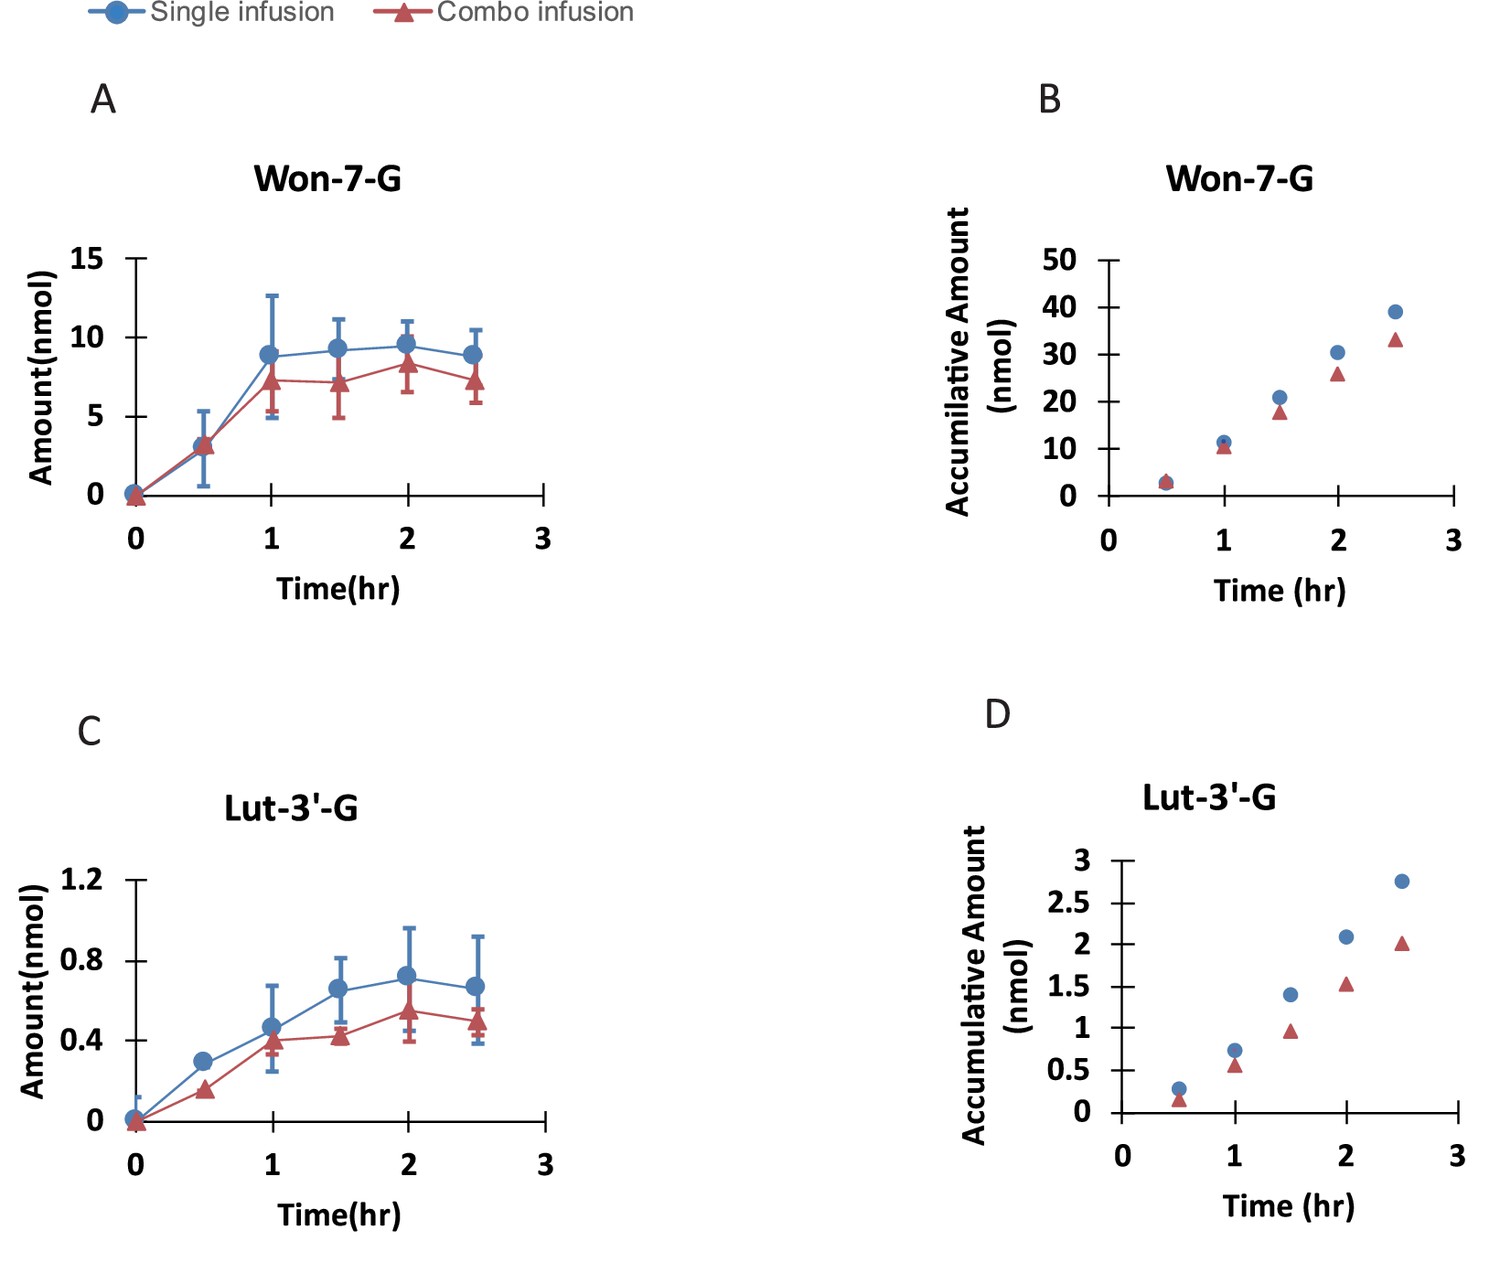
The bile amount and accumulative bile amount of Won-7-G.
(A,B) and Lut-3’-G (C,D) obtained from single infusion and combo infusion (four compounds infused simultaneously at 10 μM) were summarized. N = 4 in each experimental group. Student t test was applied and no statistical significance exists between single infusion group and combo infusion group.
Figure 2—figure supplement 2
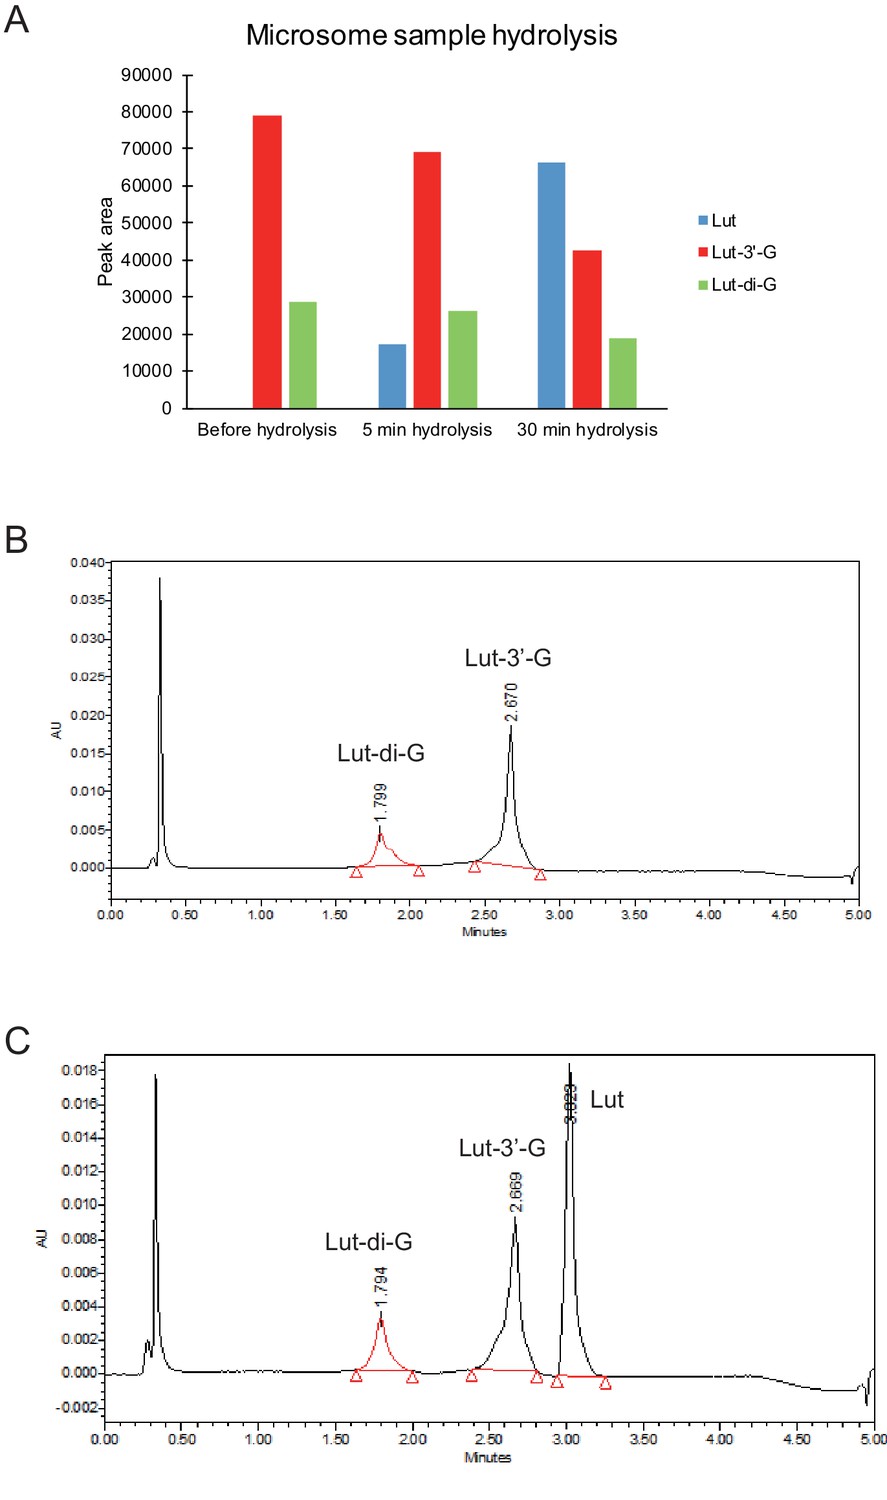
The microsome incubation and hydrolysis of Lut and its glucuronides.
(A) The hydrolysis of microsome incubation samples was summarized in Fig. 2 supplement figure S2. After incubating the microsome samples with β-glucuronidase, the peak of Lut-3’-G and Lut-di-G decreased and the peak of Lut increased.Appendix 5—table 1 The results comfirmed the existing of di-glucuronidation metabolite. (B) The UV spectrum of Lut-3’-G after incubation with microsome. (C) The UV spectrum of Lut-3’-G microsome sample after 30 min of hydrolysis.
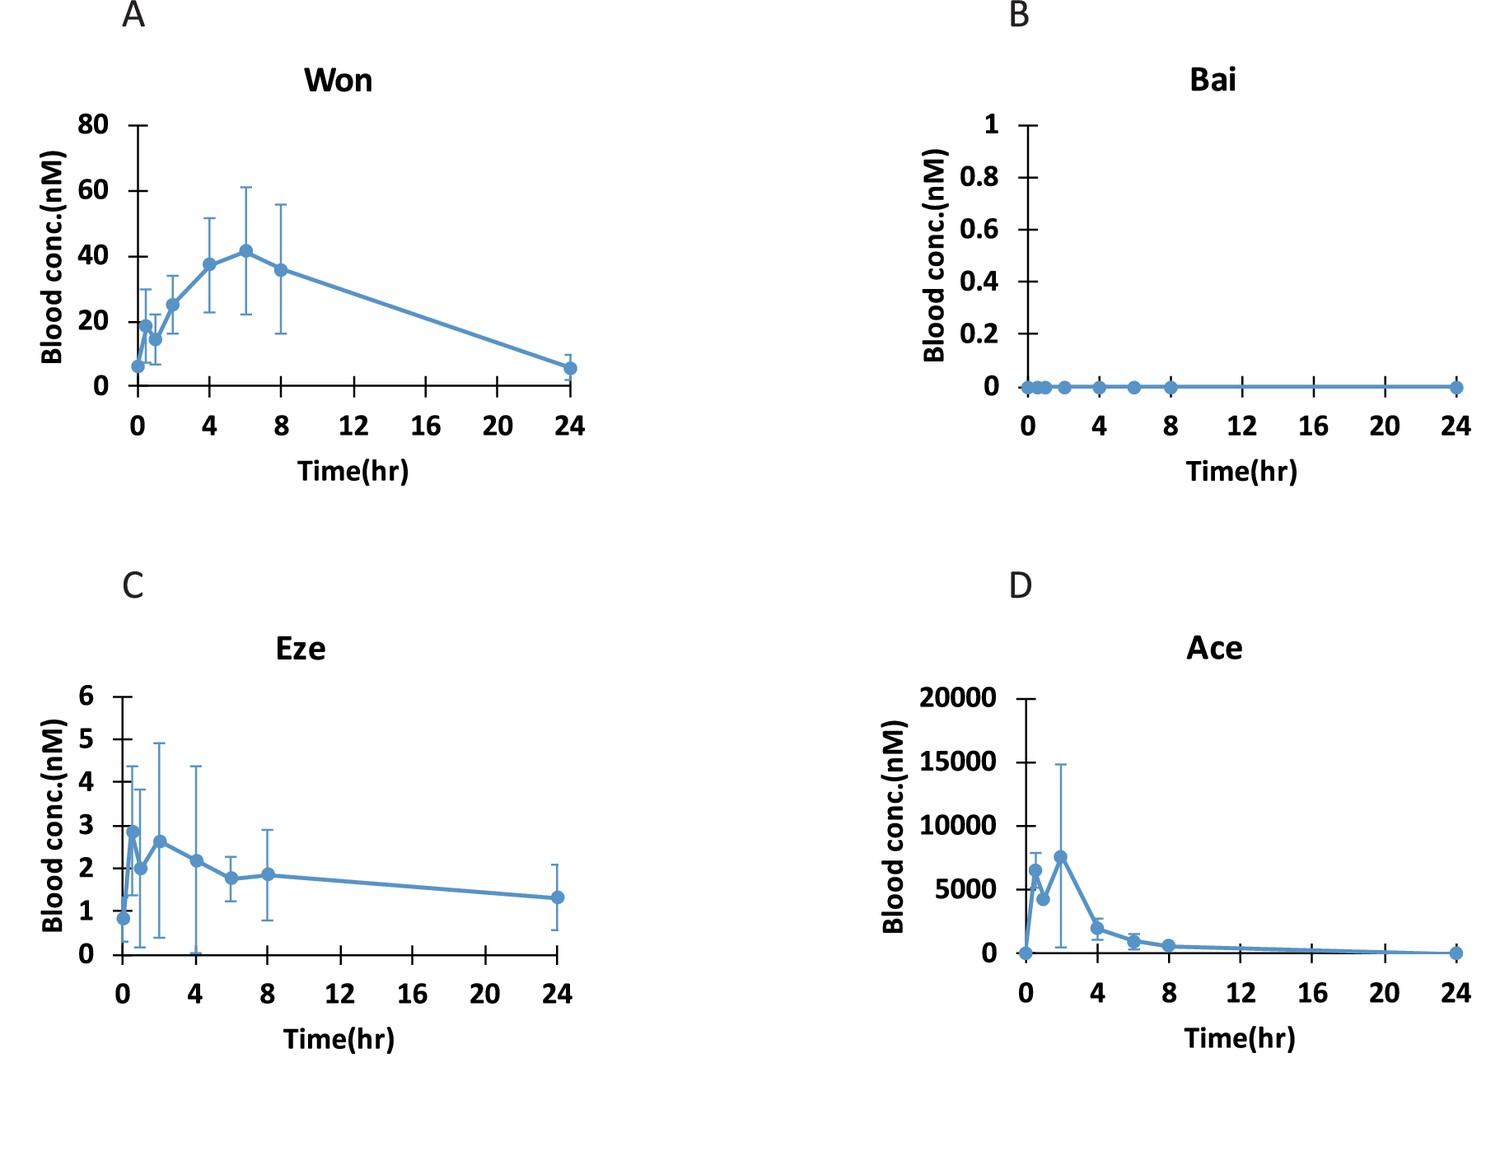
Figure 2—figure supplement 3
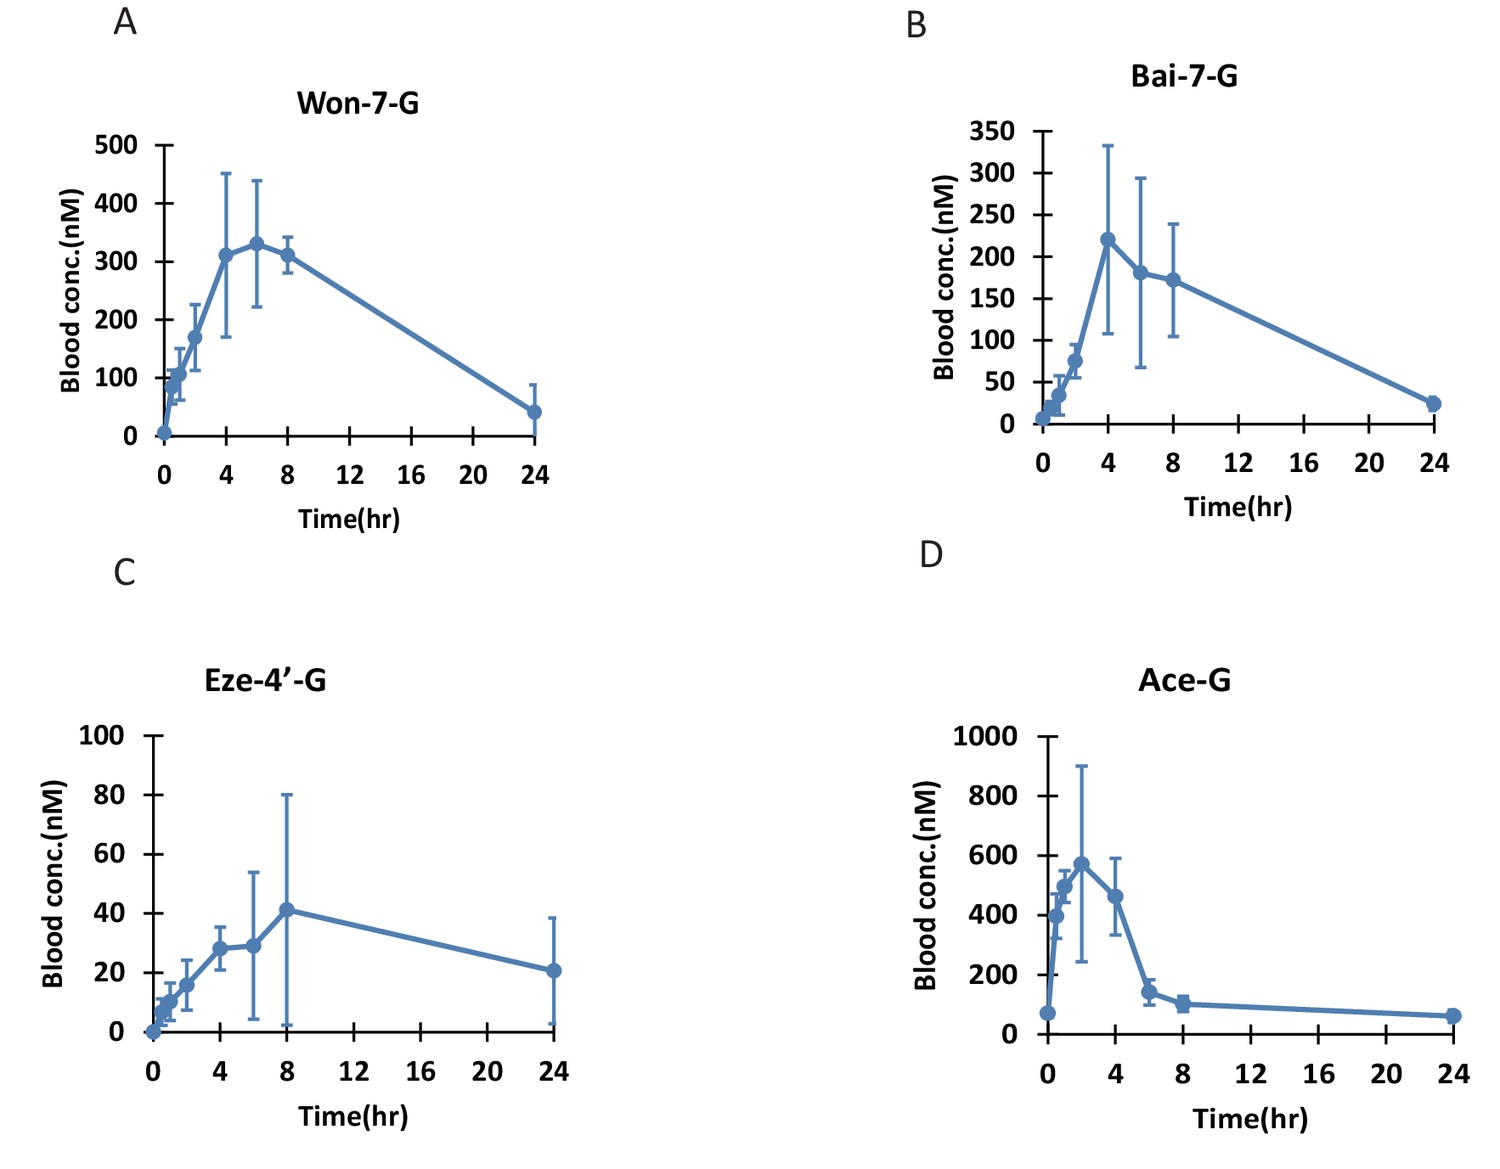
The blood concentration-time curve of Won-7-G(A), Bai-7-G(B), Eze-4’-G(C) and Ace-G(D) after orally administration of their corresponding aglycones, n = 4.
The compounds were given at 30 mg/kg by oral gavage. Blood samples were taken at 0, 0.5, 1, 2, 4, 6, 8, and 24 hr after compound administration.
Figure 3
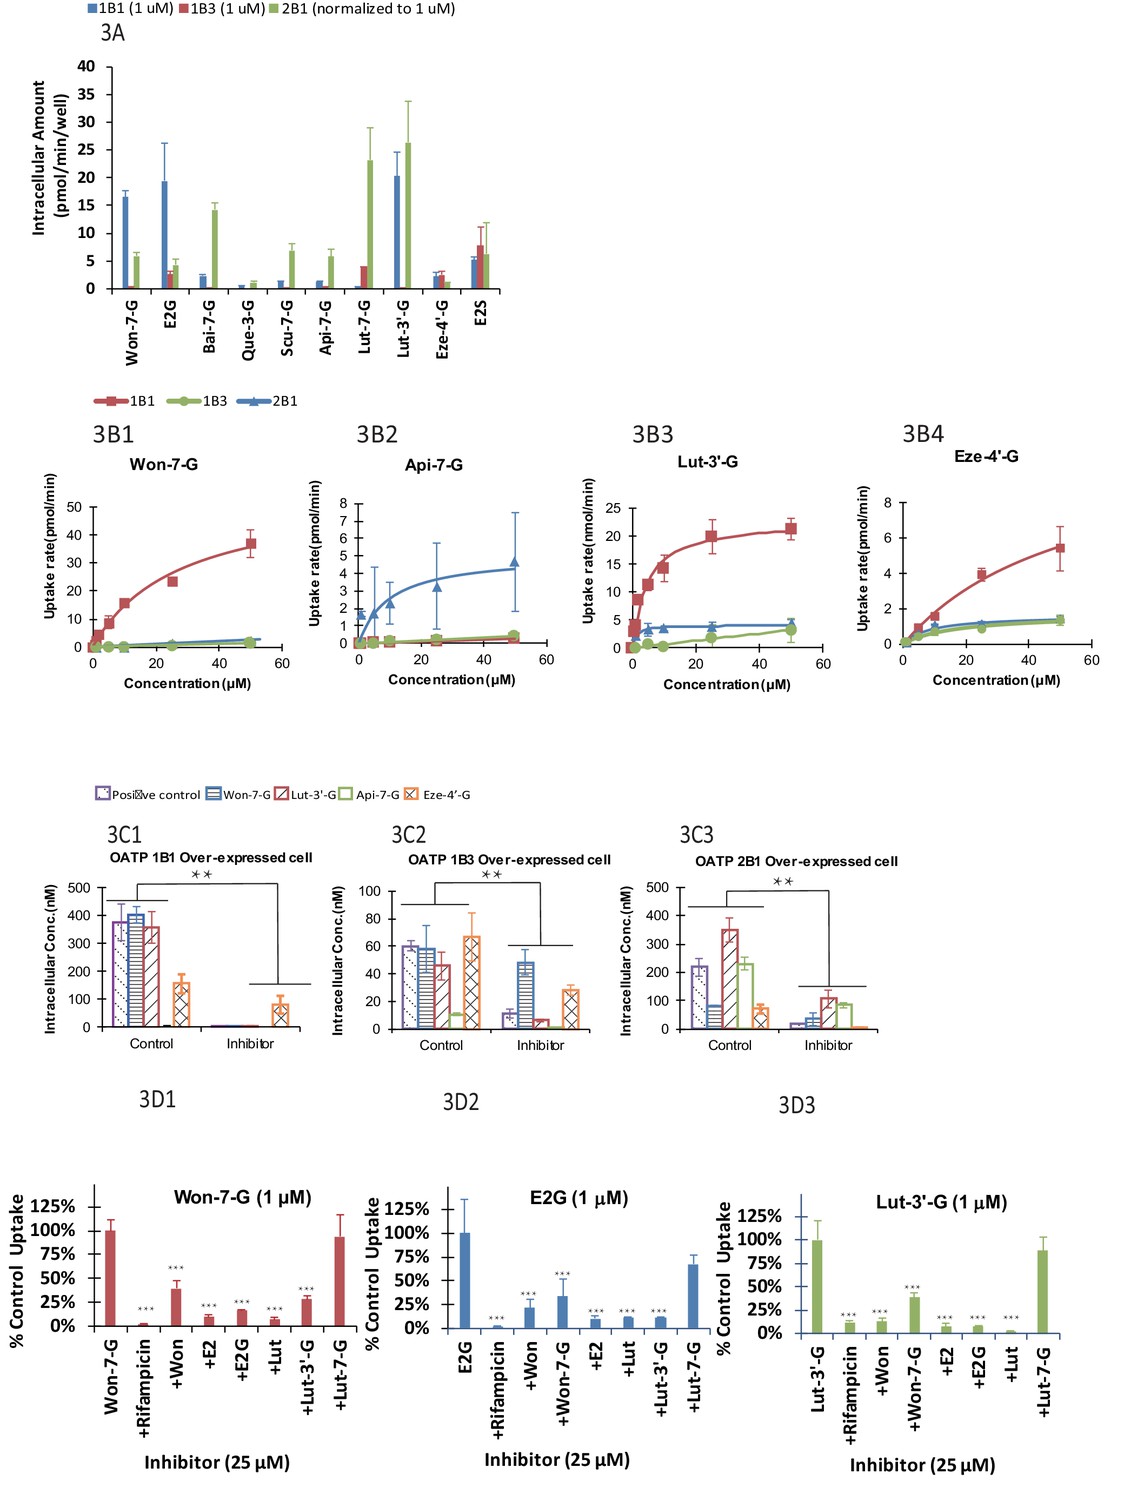
The OATP uptake kinetics, and the effect of glucuronide structures and uptake inhibitors on the hepatic uptake of glucuronides by OATP1B1/1B3/2B1 in over-expressed cell lines.
Intracellular concentration of glucuronides obtained using 1 μM of 10 different glucuronides [Won-7-G; E2G; Bai-7-G; Que-3-G; Scu-7-G; Api-7-G; Lut-7-G; Lut-3’-G; Eze-4’-G; and E2S] (A) was determined (10 μM was used in OATP 2B1 but results were normalized to 1 μM). Uptake kinetics of Won-7-G (B1), Api-7-G (B2), Lut-3’-G (B3) and Eze-4’-G (B4) in the concentration range of 0.5–50 µM in OATP1B1/1B3/2B1 over-expressed cell lines were determined. Km and Vmax values were calculated using Michaelis-Menten kinetics and summarized in Appendix 2—table 7. Effect of OATP inhibitors (50 μM rifampicin as OATP1B1/1B3 inhibitor and 50 μM erlotinib as OATP2B1 inhibitor) on the cellular uptake of five different glucuronides (E2G for OATP1B1/1B3 and E1S for OATP2B1 as positive controls) in OATP1B1 (C1), OATP1B3 (C2), and OATP2B1 (C3) over-expressed cell lines was studied at 10 μM substrate concentration (Figure 3C1–C3). Cross-over uptake in OATP1B1 cells using 1 μM of Won-7-G, E2G, Lut-3’-G as substrates was studied and intracellular concentrations of the glucuronides were determined in absence and presence of 25 μM of other aglycones and glucuronides as inhibitors. Each experiment was run in triplicate using substrates solutions in HBSS buffer (pH 7.4) at 37°C and the incubation lasted for 20 min. Statistical significance was calculated using student t test in Figure 3B1–B3 and one-way ANOVA in Figure 3A and C1–C ('*', '**', and '***' indicates p<0.05, p<0.01, and p<0.001, respectively).
Figure 4 with 3 supplements

Correlation of liver recycling efficiency (LRE%) and intracellular concentration of glucuronides.
LRE% of 16 glucuronides calculated based on rat portal vein infusion experiment were plotted against the intracellular concentrations calculated as the sum of the individual measured intracellular concentrations in OATP1B1, 1B3, and 2B1 cells in the OATP uptake studies, weighted by their protein expression levels in human liver using Emax model. The Emax and EC50 parameter values were estimated and summarized in the table below the graph.
Figure 4—figure supplement 1
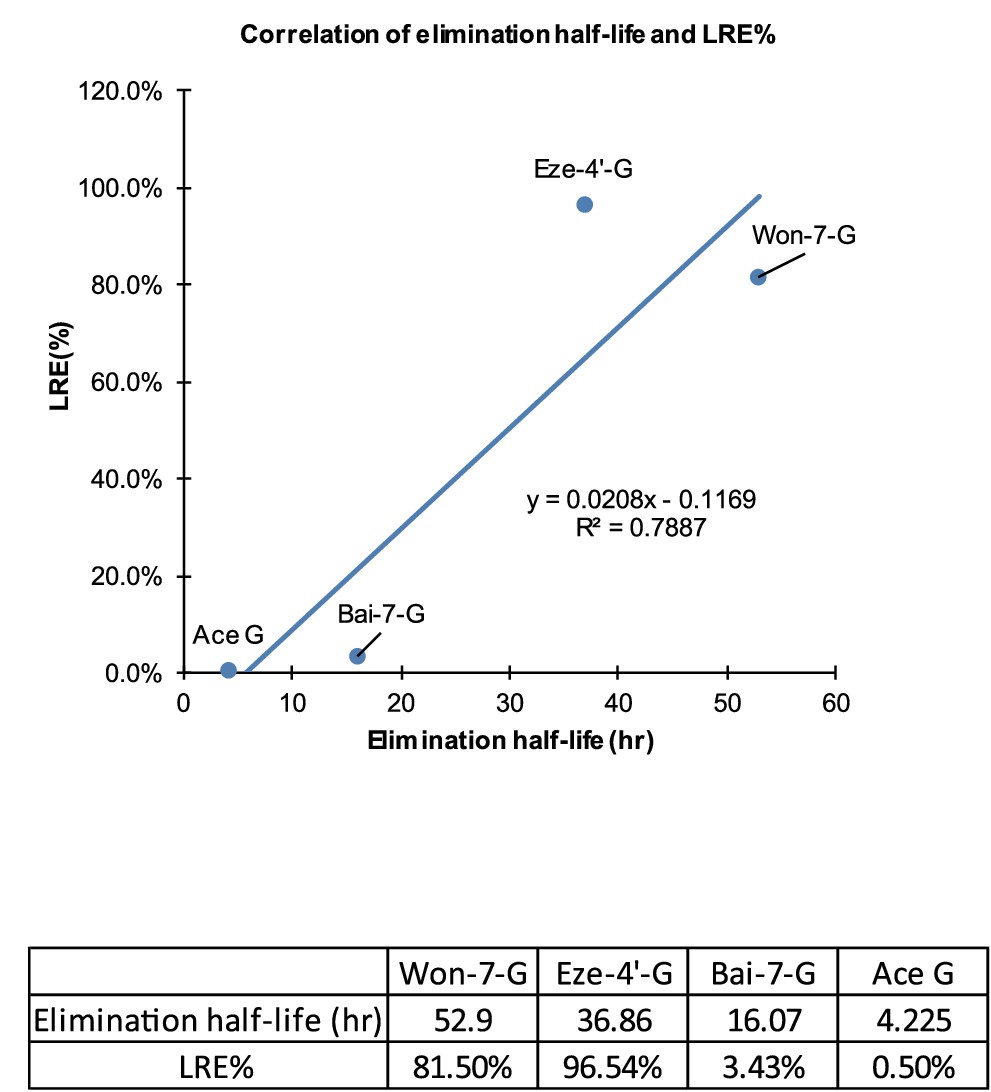
The elimination half-life of Won-7-G, Bai-7-G, Eze-4’-G, and Ace-G were plotted against with their corresponding liver recycling efficiency (LRE), n = 4.
Pharmacokinetic parameters were calculated by noncompartmental analysis (Phoenix WinNonlin 8.0; Pharsight, St. Louis, MO). The terminal elimination constant was obtained from the least-squares linear regression slope of concentration versus time, and terminal elimination half-life was calculated as 0.693/k.
Figure 4—figure supplement 2
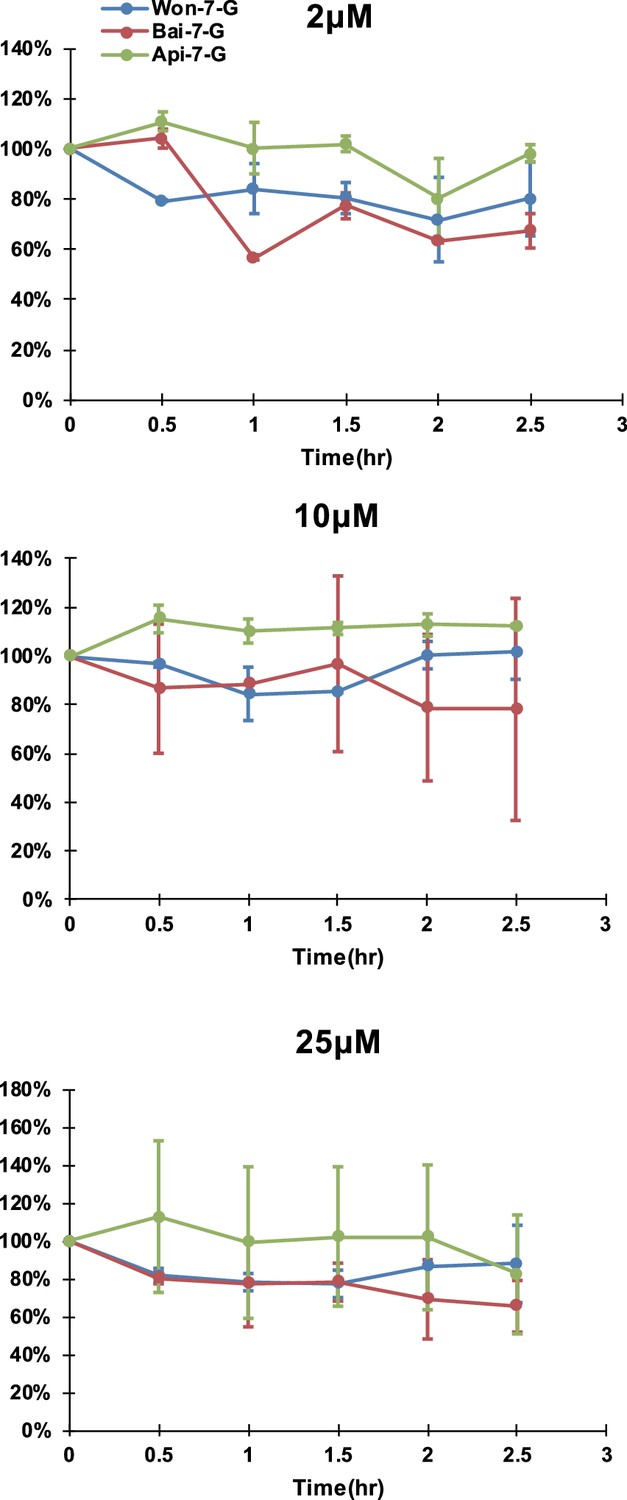
The relative blood stability of Won-7-G, Bai-7-G, and Api-7-G at three concentrations (2, 10,and 25 μM).
One-way Anova was applied and no significant differences were found.
Figure 4—figure supplement 3
The blood concentration-time curve of Won (A), Bai (B), Eze (C), and Ace (D) after orally administration of the aglycones, n = 4.
The aglycones were given at 30 mg/kg by oral gavage. Blood samples were taken at 0, 0.5, 1, 2, 4, 6, 8, and 24 hr after compound administration.
Figure 5
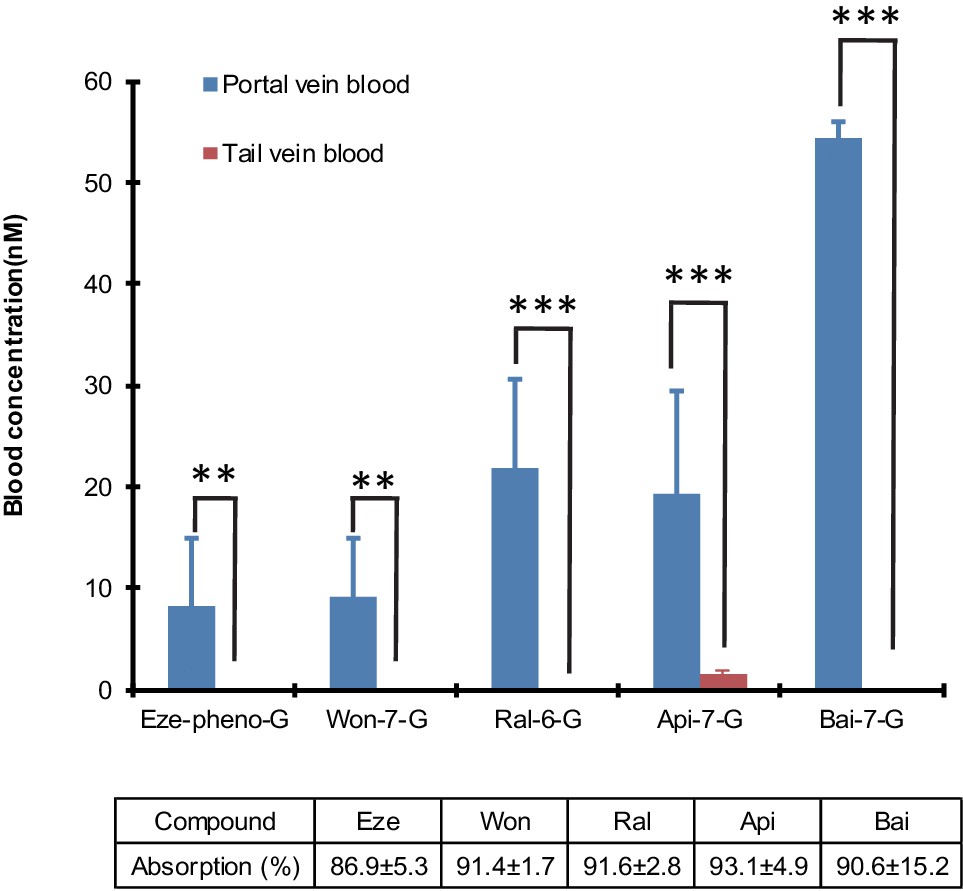
Differences in the portal vein and systemic concentrations of glucuronides after the intestinal perfusion of aglycone.
five aglycones [Eze; Won; Ral; Api and Bai] were perfused in the rat small intestine (duodenum and jejunum, approximate length = 15 cm) individually at the rate of 24 nmol/hr for 2.5 hr in male Wistar rats (n = 4 per experimental group). Bile and intestinal perfusate samples were collected for every 30 min. Blood samples from tail vein and portal vein were collected at the end of the study and analyzed for the concentration of respective glucuronides. The absorption percentage of each aglycone were calculated and tabulated below the graph in the figure. The biliary secretion of the glucuronides was summarized in Table 1. Statistical significance was calculated using student t-test ('*', '**', and '***' indicates p<0.05, p<0.01, and p<0.001, respectively).
Figure 6
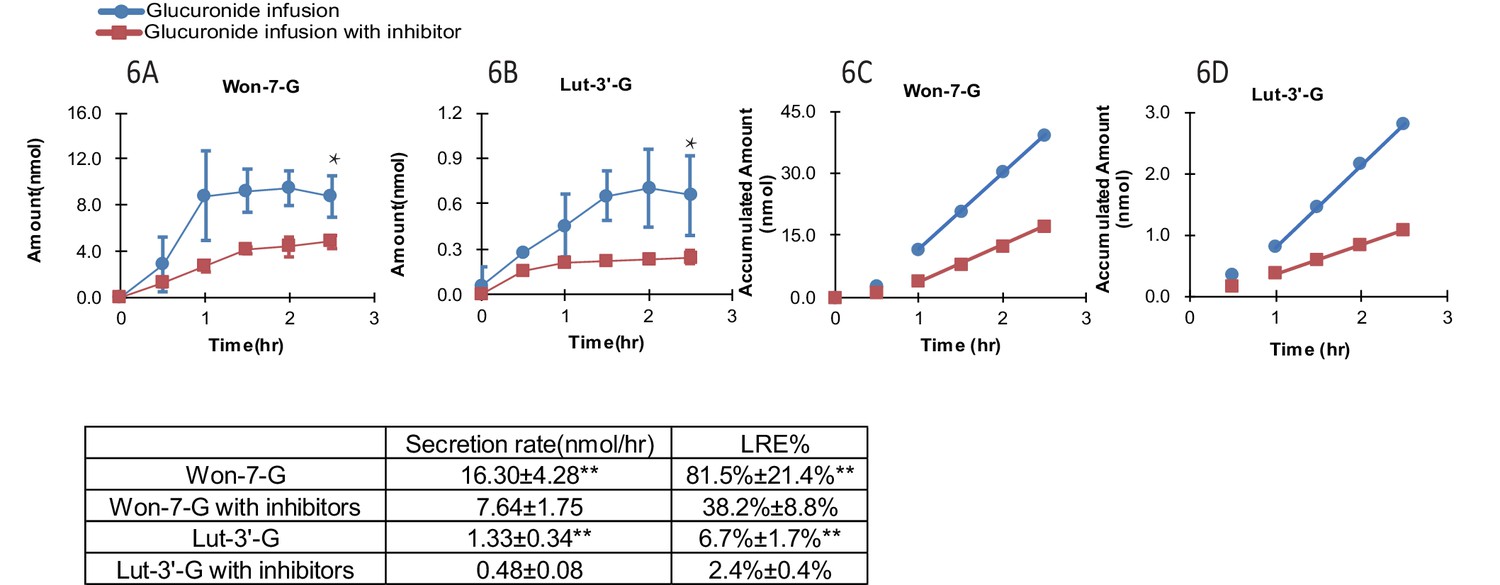
Effect of hepatic uptake inhibitors on the biliary excretion of glucuronides.
A combination of four hepatic uptake inhibitors (rifampicin, telmisartan, estradiol-17β-glucuronide and estrone-3-sulfate) at 1 mM concentration were infused in rat portal vein for an hour as pretreatment, followed by co-infusion of inhibitors (at 1 mM) and glucuronide substrate [Won-7-G or Lut-3’-G] (at 10 µM) in the rat portal vein at the rate of 2 ml/hr for 2.5 hr in male Wistar rats (n = 4 per group). The bile amounts of Won-7-G (A), Lut-3’-G (B) and the accumulated bile amounts of Won-7-G (C), Lut-3’-G (D) with or without the uptake inhibitors were determined. Statistical significance was calculated by student t test (‘**” indicates p<0.01).
Tables
Table 1
Comparison of bililary secretion rates and recycle ratios of glucuronides following hepatic glucuronide infusion, hepatic aglycone infusion and small intestinal aglycone perfusion.
The rate of hepatic infusion was 20 nmol/hr and the rate of intestinal perfusion was 24 nmol/hr.
| Dosing method | Hepatic glucuronide infusion | Hepatic aglycone infusion | Small intestine aglycone perfusion |
|---|---|---|---|
| Infused compounds | Eze-4'-G | Ezetimibe (Eze) | Ezetimibe (Eze) |
| Won-7-G | Wongonin (Won) | Wongonin (Won) | |
| Ral-6-G | Raloxifene (Ral) | Raloxifene (Ral) | |
| Api-7-G | Apigenin (Api) | Apigenin (Api) | |
| Bai-7-G | Baicalein (Bai) | Baicalein (Bai) | |
| Measured compound | Bile secretion rate (nmol/hr) | ||
| Eze-4'-G | 19.31 ± 1.85 | 2.93 ± 0.41***,† | 21.94 ± 5.29 |
| Won-7-G | 16.30 ± 4.28 | 8.46 ± 3.93***,† | 17.90 ± 11.96 |
| Ral-6-G | 10.53 ± 1.51 | 3.91 ± 0.82*** | 4.00 ± 0.68 |
| Api-7-G | 10.64 ± 4.49 | 1.22 ± 0.76***,† | 11.32 ± 4.08 |
| Bai-7-G | 0.69 ± 0.29 | 0.09 ± 0.07***,† | ND† |
| Measured compound | Recycle ratio (%) | ||
| Eze-4'-G | 96.54 ± 9.23 | 14.65 ± 2.05***,† | 91.42 ± 22.04 |
| Won-7-G | 81.5 ± 21.41 | 42.30 ± 20.00***,† | 74.58 ± 49.83 |
| Ral-6-G | 52.64 ± 7.54 | 19.55 ± 4.10***,† | 16.67 ± 2.83 |
| Api-7-G | 53.21 ± 22.44 | 6.10 ± 3.80***,† | 47.17 ± 17.00 |
| Bai-7-G | 3.43 ± 1.46 | 0.45 ± 0.35***,† | ND‡ |
-
*Significant difference between hepatic glucuronide infusion and hepatic aglycone infusion, p<0.01.
†Significant difference between hepatic aglycone infusion and small intestinal perfusion , p<0.01.
-
‡Not determined due to below quantification limit.
Appendix 1—key resources table
| Reagent type (species) or resource | Designation | Source or reference | Identifiers | Additional information |
|---|---|---|---|---|
| Chemical compound, drug | Apigenin-7-O-glucuronide (Api-7-G) | HWI Analytik GmbH | Lot#: 0449059 | |
| Chemical compound, drug | Wogonoside (Won-7-G) | Meilun bio | MB6662 | |
| Chemical compound, drug | Quercetin (Que-3-G) | Sigma-Aldrich | 00310590 | |
| Chemical compound, drug | Scutellarin (Scu-7-G) | Meilunebio | MB7004-S | |
| Chemical compound, drug | Luteolin-3’-glucuronide (Lue-3’-G) | Chengdu Alfa Biotechnology Co.,Ltd. | AF8025306 | |
| Chemical compound, drug | Luteolin-7-glucuronide (Lue-7-G) | Chengdu Alfa Biotechnology Co.,Ltd. | Af7022398 | |
| Chemical compound, drug | Wogonin (Won) | Meilunebio | MB6663 | |
| Chemical compound, drug | Luteolin (Lue) | Meilunebio | MB6799 | |
| Chemical compound, drug | Icaritin (Ica) | Meilunebio | MB7035 | |
| Chemical compound, drug | Icaritin-3-glucuronide (Ica-3-G) | This compound was synthesized by our cooperative lab. | ||
| Chemical compound, drug | Icaritin-7-glucuronide (Ica-7-G) | This compound was synthesized by our cooperative lab. | ||
| Chemical compound, drug | Estradiol-17β-glucuronide (E2G) | Steraloids Company | E1073-000 | |
| Chemical compound, drug | Estrone-3-sulfate (E1S) | Steraloids Company | E2335-000 | |
| Chemical compound, drug | Raloxifene (Ral) | Toronto Research Chemical | R099995 | |
| Chemical compound, drug | Raloxifene-4’-glucuronide (Ral-4’-G) | Toronto Research Chemical | R100020 | |
| Chemical compound, drug | Raloxifene-6-glucuronide (Ral-6-G) | Toronto Research Chemical | R100025 | |
| Chemical compound, drug | Ezetimibe (Eze) | Toronto Research Chemical | E975000 | |
| Chemical compound, drug | Ezetimibe-4’-phenoxy-glucuronide (Eze-4’-G) | Toronto Research Chemical | E975030 | |
| Chemical compound, drug | Apigenin (Api) | Indofine | A-002 | |
| Chemical compound, drug | Baicalein (Bai) | Indofine | B-101 | |
| Chemical compound, drug | Baicalein-7-glucuronide (Bai-7-G) | Indofine | 06–012 | |
| Chemical compound, drug | Dimethyl sulfoxide (DMSO) | Sigma-Aldrich | 276855 | |
| Chemical compound, drug | Hanks balanced salt solution (HBSS) | Sigma-Aldrich | H1387 | |
| Chemical compound, drug | Acetonitrile (ACN) | Omni Solv | AX0149 | |
| Chemical compound, drug | methanol (MeOH) | Omni Solv | MX0486 | |
| Chemical compound, drug | ORA-Plus suspending vehicle | Perrigo | 0574-0303-16 | |
| Cell line (Homo-sapiens) | HEK-293 OATP1B1/1B3 over-expressed cell line | Dr.Yue Wei’s Lab | The related publication could be searched by using PMID:29538325 | |
| Cell line (Homo-sapiens) | HEK-293 OATP2B1 over-expressed cell line | Dr. Per Artursson’s Lab | The related publication could be searched by using PMID:24799396 | |
| Software, algorithm | GraphPad Prism 6 | GraphPad Software Inc | RRID:SCR_002798 |
Appendix 2—table 1
Appendix 2—table 2
The uptake of wogonin in four different cell lines.
The incubation concentration, time, condition and intracellular concentrations were summarized in the table. Inhibitor(s) were changed in different cell line. For OATP1B1 and OATP1B3 cell line, inhibitor was 50 μM rifampicin. For OATP 2B1 cell line, inhibitor was 50 μM telmisartan. For MDCK cell line, inhibitors were 50 μM rifampicin and 50 μM telmisartan. Student t test was applied to calculate the p values. No significant differences observed when wogonin was incubated with or without inhibitor.
| Cell type | Incubation concentration(μM) | Incubation time(min) | Inhibitor | Intracellular concentration(nM) |
|---|---|---|---|---|
| MDCK MRP3 over-expressed cell line | 5 | 120 | Yes | 150.33 ± 37.87 |
| 5 | 120 | No | 163.67 ± 21.57 | |
| HEK-293 OATP1B1 over- expressed cell line | 10 | 20 | Yes | 442.00 ± 309.56 |
| 10 | 20 | No | 365.67 ± 168.67 | |
| HEK-293 OATP1B3 over- expressed cell line | 10 | 60 | Yes | 333.33 ± 33.08 |
| 10 | 60 | No | 381.33 ± 128.82 | |
| HEK-293 OATP2B1 over- expressed cell line | 10 | 20 | Yes | 782.33 ± 115.42 |
| 10 | 20 | No | 897.00 ± 409.17 |
Appendix 2—table 3
The uptake of wogonin and wogonin-7-G (wogonoside) in three different cell lines.
The incubation concentration, time, condition and intracellular concentrations were summarized iin the table. Inhibitor(s) were changed in different cell line. For OATP1B1 and OATP1B3 cell line, inhibitor was 50 μM rifampicin. For OATP 2B1 cell line, inhibitor was 50 μM telmisartan. Student t test was applied to calculate the p values. Significant differences were observed when wogonoside incubated with or without inhibitors in OATP 1B1 and 1B3 cell lines. No significant differences observed when wogonin was incubated with or without inhibitor.
| Cell type | Incubation concentration (μM) | Incubation time (min) | Inhibitor | Wogonoside intracellular concentration (nM) | Wogonin intracellular concentration (nM) |
|---|---|---|---|---|---|
| HEK-293 OATP1B1 over- expressed cell line | 10 | 20 | Yes | 0.01 ± 0.01 | 442.00 ± 309.56 |
| 10 | 20 | No | 401.00 ± 29.60†† | 365.67 ± 168.67 | |
| HEK-293 OATP1B3 over- expressed cell line | 10 | 60 | Yes | 48.33 ± 9.12 | 333.33 ± 33.08 |
| 10 | 60 | No | 58.03 ± 16.60 | 381.33 ± 128.82 | |
| HEK-293 OATP2B1 over- expressed cell line | 10 | 20 | Yes | 34.57 ± 21.26 | 782.33 ± 115.42 |
| 10 | 20 | No | 82.87 ± 2.45* | 897.00 ± 409.17 |
-
*p< 0.05.
†p<0.01.
Appendix 2—table 4
The liver concentration of wogonin/wogonin-7-G (n = 3).
| Compound | Wogonin | Wogonin-7-G (Wogonoside) |
|---|---|---|
| Liver concentration (nmol/g) | 0.51 ± 0.28 | <0.1* |
| Ratio (Wogonin/Wogonoside) | 5 > | \ |
-
* The concentration was below quantification limit (4 nM).
Appendix 2—table 5
Biliary glucuronide secretion rate and liver recycling efficiency of 16 different glucuronides.
| Infused compound (10 μM) | Secretion rate (nmol/hr)* | LRE%† |
|---|---|---|
| Ezetimibe-4'-G | 19.31 ± 1.85 | 96.5 ± 9.2 |
| Wogonin-7-G(wogonoside) | 16.3 ± 4.28 | 81.5 ± 21.4 |
| Raloxifene-4'-G | 11.48 ± 2.32 | 57.4 ± 11.6 |
| Apigenin-7-G | 10.64 ± 4.49 | 53.2 ± 22.4 |
| Raloxifene-6-G | 10.53 ± 1.51 | 52.6 ± 7.5 |
| Chrysin-7-G | 9.91 ± 1.92 ‡ | 49.6 ± 9.6 ‡ |
| Genestein-7-G | 9.45 ± 3.21 ‡ | 47.3 ± 16.0 ‡ |
| Icaritin-7-G | 7.46 ± 0.72 | 37.3 ± 3.6 |
| Icaritin-3-G | 5.35 ± 1.12 | 26.8 ± 5.6 |
| Scuttelarin | 4.34 ± 1.18 | 21.7 ± 5.9 |
| Biochanin A-G | 3.48 ± 0.75 ‡ | 17.5 ± 3.7 ‡ |
| Luteolin-3’-G | 1.33 ± 0.34 | 6.7 ± 1.7 |
| Baicalin | 0.69 ± 0.30 | 3.4 ± 1.5 |
| Luteolin-7-glycoside | 0.67 ± 0.56 | 3.4 ± 2.8 |
| Quercetin-3-G | 0.43 ± 0.57 | 2.2 ± 2.8 |
| Ace-G | 0.10 ± 0.06 | 0.5 ± 0.3 |
-
*The glucuronide secretion rate at the steady state was calculated by the linear regression of accumulated amount secreted in bile vs. time.
† LRE (liver recycling efficiency) % = Excretion rate at steady state/infusion rate.
-
‡ Data from previous published study (Zeng et al., 2016).
Appendix 2—table 6
Gender differences in bile secretion rates and liver recycling efficiency (LRE%).
| Infusion compounds (10 μM) | Secretion rate (nmol/hr) | LRE | (%) | ||||||||
|---|---|---|---|---|---|---|---|---|---|---|---|
| Male | Female | Male | Female | ||||||||
| Won-7-G | 16.30 ± 4.28 | 15.06 ± 0.70 | 81.5 ± 21.4 | 75.3 ± 3.5 | |||||||
| Bai-7-G | 0.69 ± 0.29 | 1.78 ± 0.42 | 3.4 ± 1.5 | 8.9 ± 2.1 | |||||||
| Lut-3'-G | 1.33 ± 0.34 | 1.67 ± 0.32 | 6.7 ± 1.7 | 8.3 ± 1.6 | |||||||
Appendix 2—table 7
Kinetic parameters of uptake (Km and Vmax) of selected glucuronides wogonoside, luteolin-3’-glucuronide (Lut-3’-glu) and apigenin-7-glucuronide (Api-7-glu) in OATP1B1/1B3/2B1 over-expressed cells.
| Compound | 1B1 | 1B3 | 2B1 | ||||||||
|---|---|---|---|---|---|---|---|---|---|---|---|
| Km(μM) | Vmax (pmol/min) | Km(μM) | Vmax (pmol/min) | Km(μM) | Vmax (pmol/min) | ||||||
| Won-7-G | 27.68 | 53.37 | >50 | 11.72 | >50 | 55.26 | |||||
| Lut-3’-G | 4.46 | 22.79 | >50 | 9.62 | 0.89 | 4.07 | |||||
| Api-7-G | >50 | >200 | >50 | >200 | 9.72 | 5.09 | |||||
| Eze-4'-G | >50 | 11.45 | 17.64 | 1.67 | 8.55 | 1.61 | |||||
Appendix 3—table 1
Compound-dependent parameter of the analytes and I.S.
| Compound | Q1/Q3 | DP | CE | EP | CXP |
|---|---|---|---|---|---|
| Api-7-G | 445.0/269.0 | −90 | −34 | −10 | −23 |
| Ace-G | 326.0/150.0 | −100 | −34 | −10 | −15 |
| Bai-7-G | 445.0/269.0 | −120 | −30 | −10 | −19 |
| E1S | 349.0/269.0 | −45 | −52 | −10 | −19 |
| E2G | 447.0/271.0 | −170 | −40 | −10 | −19 |
| Eze-4’-G | 584.0/271.0 | −154 | −42 | −10 | −15 |
| Ica-3-G | 543.1/367.1 | −90 | −33 | −10 | −10 |
| Ica-7-G | 543.1/352.0 | −90 | −53 | −10 | −10 |
| Lut-3’-G | 461.2/285.2 | −87 | −29 | −10 | −15 |
| Que-3-G | 477.0/301.0 | −110 | −32 | −10 | −11 |
| Ral-4’-G | 649.3/473.3 | −80 | −44 | −10 | −13 |
| Ral-6-G | 649.3/473.3 | −80 | −44 | −10 | −13 |
| Scu-7-G | 461.0/285.0 | −70 | −34 | −10 | −13 |
| Won-7-G | 459.0/283.0 | −87 | −21 | −10 | −15 |
| Rutin (I.S.) | 609.0/300.0 | −87 | −54 | −10 | −21 |
Appendix 4—table 1
Example of fisher exact test generated by the methods described above.
| Liver recycling efficiency (%) | |||
|---|---|---|---|
| High | Low | ||
| Intracellular concentrations (nM) | High | 4 | 1 |
| Low | 0 | 4 | |
Appendix 4—table 2
The results of Fisher exact test in different weightings were summarized.
p Values of different OATP weightings were calculated and summarized in this table. p<0.05 indicated significant correlation found between recycle ratios and cell uptake. Results marked in red were eliminated.
| Weighting | p | Weighting | p | |||
|---|---|---|---|---|---|---|
| OATP1B1 | OATP1B3 OATP2B1 | value | OATP1B1 | OATP1B3 OATP2B1 | value | |
| 2 | 3 5 | 0.0079 | 7 | 1 2 | 0.0476 | |
| 2 | 2 6 | 0.0079 | 7 | 0 3 | 0.0476 | |
| 2 | 1 7 | 0.0079 | 8 | 2 0 | 0.0476 | |
| 2 | 0 8 | 0.0079 | 8 | 0 2 | 0.0476 | |
| 3 | 2 5 | 0.0079 | 8 | 1 1 | 0.0476 | |
| 3 | 1 6 | 0.0079 | 9 | 1 0 | 0.0476 | |
| 3 | 0 7 | 0.0079 | 9 | 0 1 | 0.0476 | |
| 4 | 1 5 | 0.0079 | 10 | 0 0 | 0.0476 | |
| 4 | 0 6 | 0.0079 | ||||
| 5 | 1 4 | 0.0079 | ||||
| 5 | 0 5 | 0.0079 | ||||
| 6 | 0 4 | 0.0079 | ||||
| 0 | 3 7 | 0.0476 | ||||
| 0 | 2 8 | 0.0476 | ||||
| 0 | 1 9 | 0.0476 | ||||
| 0 | 0 10 | 0.0476 | ||||
| 1 | 3 6 | 0.0476 | ||||
| 1 | 2 7 | 0.0476 | ||||
| 1 | 1 8 | 0.0476 | ||||
| 1 | 0 9 | 0.0476 | ||||
| 3 | 3 4 | 0.0476 | 1 | 4 5 | 0.1667 | |
| 4 | 4 2 | 0.0476 | ||||
| 4 | 3 3 | 0.0476 | ||||
| 4 | 2 4 | 0.0476 | ||||
| 5 | 4 1 | 0.0476 | ||||
| 5 | 3 2 | 0.0476 | ||||
| 5 | 2 3 | 0.0476 | ||||
| 6 | 4 0 | 0.0476 | ||||
| 6 | 3 1 | 0.0476 | ||||
| 6 | 2 2 | 0.0476 | ||||
| 6 | 1 3 | 0.0476 | ||||
| 7 | 3 0 | 0.0476 | ||||
| 7 | 2 1 | 0.0476 |
Appendix 5—table 1
Peak area of postulated di-glucuronide of luteolin, L3’G, and luteolin from UPLC chromatograph (n = 2).
| Retention time/min | Before hydrolysis | 5 min hydrolysis | 30 min hydrolysis | |
|---|---|---|---|---|
| Postulated di-glucuronide | 1.79 | 28543 | 26070.5 | 18922 |
| L3'G | 2.67 | 78905.5 | 69006 | 42460.5 |
| Luteolin | 3.02 | - | 17289 | 66341 |
| sum | 107448.5 | 112365.5 | 127723.5 |
Additional files
Download links
A two-part list of links to download the article, or parts of the article, in various formats.
Downloads (link to download the article as PDF)
Open citations (links to open the citations from this article in various online reference manager services)
Cite this article (links to download the citations from this article in formats compatible with various reference manager tools)
Hepatoenteric recycling is a new disposition mechanism for orally administered phenolic drugs and phytochemicals in rats
eLife 10:e58820.
https://doi.org/10.7554/eLife.58820


