Label-free imaging of immune cell dynamics in the living retina using adaptive optics
- The Institute of Optics, University of Rochester, United States
- Translational Health Sciences, University of Bristol, United Kingdom
- Department of Biomedical Engineering, University of Rochester, United States
- Flaum Eye Institute, University of Rochester, United States
- Department of Neuroscience and the Del Monte Institute for Neuroscience, University of Rochester, United States
- Center for Visual Science, University of Rochester, United States
Figures
Figure 1 with 1 supplement
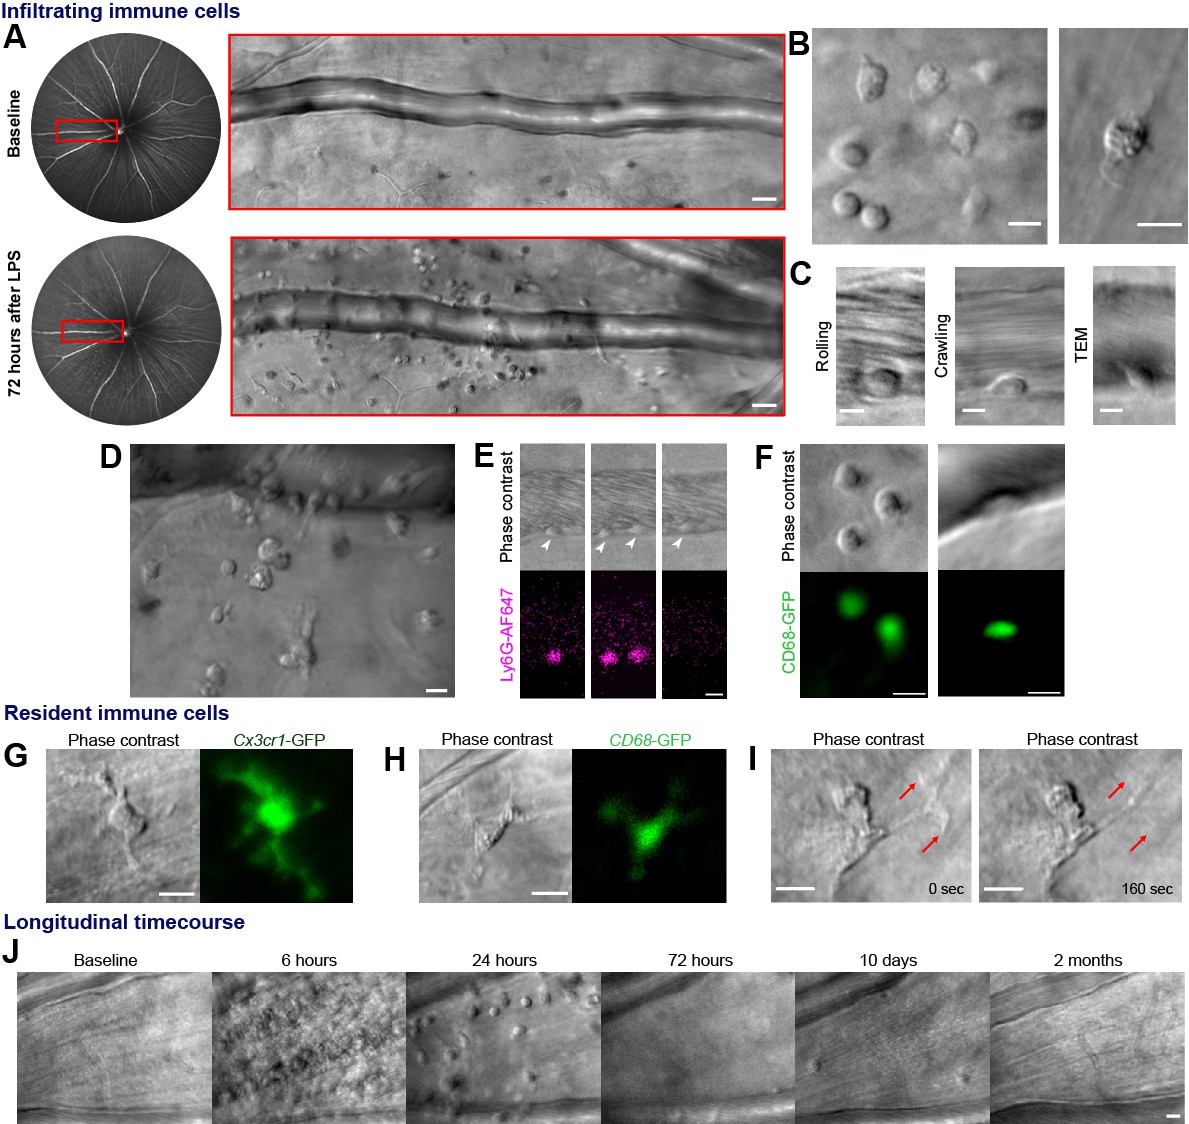
Label-free adaptive optics imaging of infiltrating and tissue resident immune cells in the retina.
(A) Widefield image showing venule baseline and 72 hr after LPS injection. AOSLO montage (red rectangle) detects dispersed immune cells. (B) Detail of heterogeneous immune cells. (C) Intravascular trans-endothelial migration (TEM) stages are visible. (D) Field adjacent to vein 72 hr after LPS. (E) Simultaneous phase-contrast and anti-Ly6G fluorescence reveals leukocyte rolling (arrowheads) and (F) CD68-GFP reporter shows extravascular and intravascular cells. (G) Representative examples of tissue-resident myeloid cells from Cx3cr1-GFP and (H), CD68-GFP reporter mice showing colocalization of fluorescence with label-free cells. (I) Phase-contrast image of process remodeling. (J) Longitudinal imaging (hours-to-months) at same location following LPS injection. Scale bars = 10 µm, except in A = 50 µm. Representative images from cohort of eleven (A to D, J) and three C57BL/6J mice (E), three CD68-GFP mice (F and H) and four Cx3cr1-GFP mice (G and I).
Figure 1—figure supplement 1
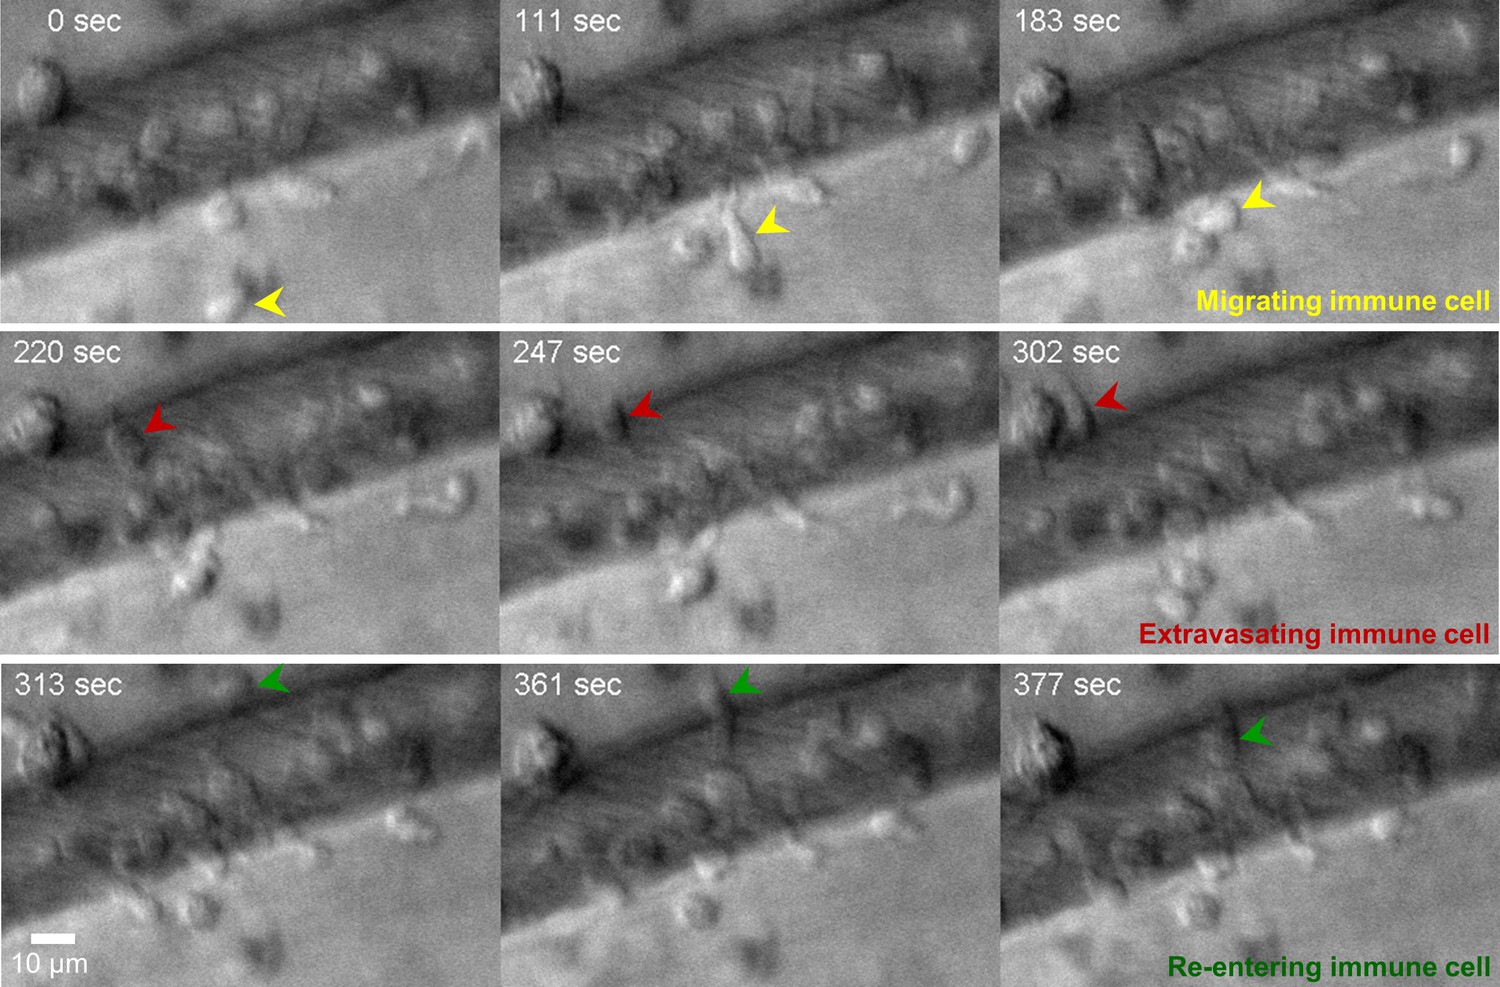
Time lapse imaging with label-free AOSLO phase-contrast (796 nm) shows single immune cells migrating (yellow), extravasating (red) and re-entering (green) a retinal venule.
Raw video collected at 25 frames/s. Frame-averaging performed with temporal bin-size of 25 frames. Each of the nine panels shows one such averaged frame, all acquired in one continuous video, in the same mouse, with imaging time-stamps as shown in top-left of each frame. Each row (and color) shows a unique immune cell tracked at three different time-points. Only nine snapshots shown here; all frames shown in second-half of Video 2.
Figure 2 with 1 supplement
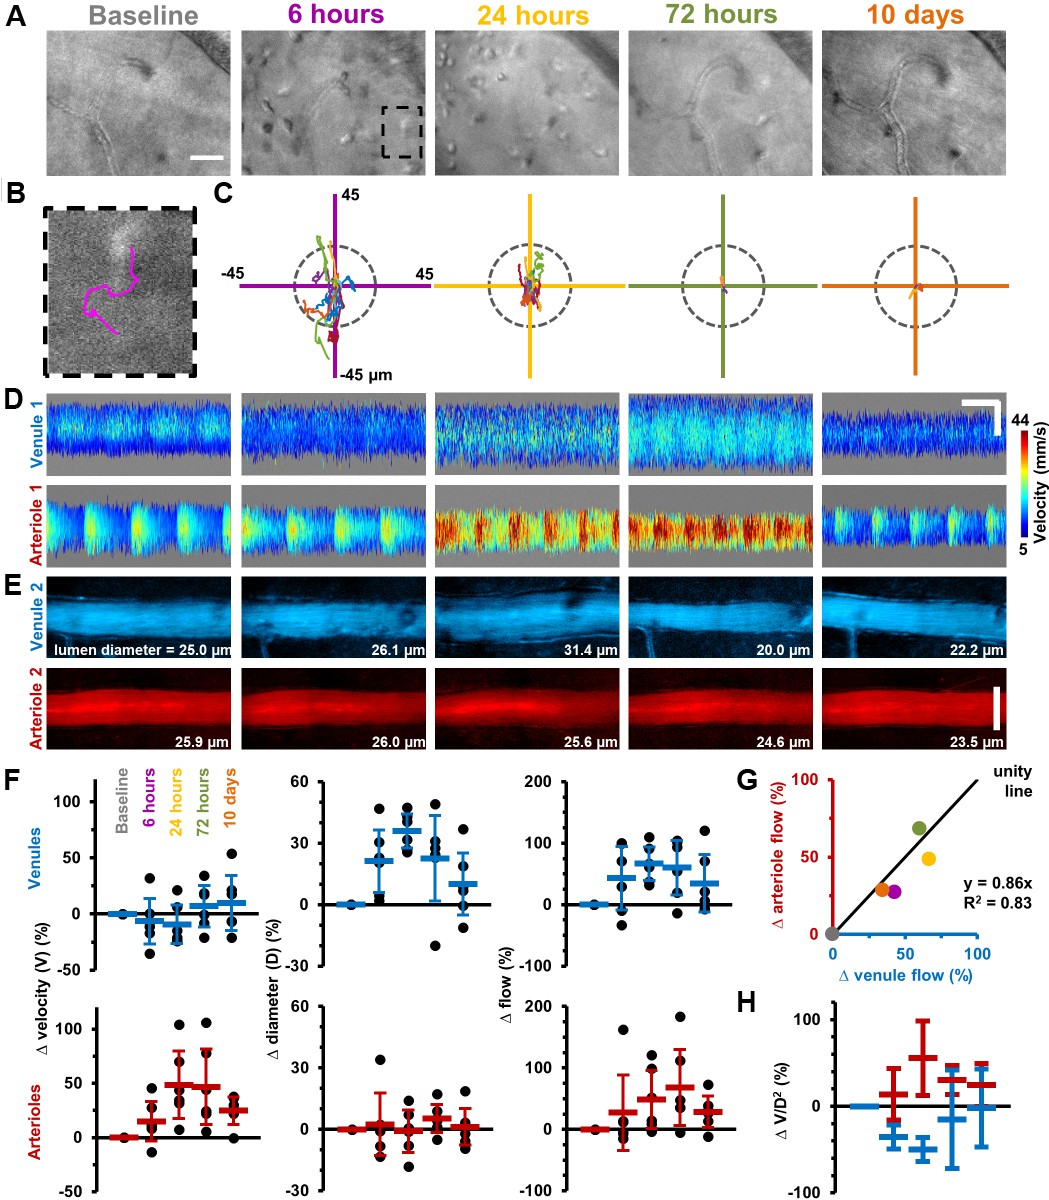
Longitudinal non-invasive measurement of combined immune cell dynamics and vascular flow.
Measurements of neighbouring venules, arterioles and connecting parenchyma in six C57BL/6J mice given EIU. (A) AOSLO phase-contrast images of same region across five timepoints relative to LPS injection, in a representative mouse. Scale bar = 30 µm. (B) Magnified image of one cell (marked overlay) with tracked trace (100 s). (C) Cell displacements for total cohort at indicated timepoints, in six mice. Displacement traces normalized to each cell starting position. Grey dashes indicate radius of typical cell size (13 µm). (D) Space-time images with overlaid single-cell blood velocity, in a representative mouse. Arteriolar velocity increases then resolves. Scale bars = 200 ms horizontal, 30 µm vertical. (E) Vessel diameter visualized in motion-contrast images of venules (blue) and arterioles (red), in a representative mouse. Venule diameter dilates then resolves. Scale bar = 30 µm. (F) Population values of RBC velocity change relative to baseline, lumen diameter and flow rate for venules and arterioles, in six mice. Vein diameter (p=0.008) and artery velocity (p=0.036) exhibit significant changes across time (Friedman test, n = 6 mice). Mean+ SD shown. (G) Correlation of change in flow between arterioles and venules (colors correspond to timepoints in A), in six mice. (H) Change in ratio V/D2, plotted across timepoints from F (V = velocity, D = diameter), in six mice (mean ±1 SD). Flow-rate is proportional to the product V*D2. Since V and D were independently measured, and since change in flow in arterioles and venules was found to be conserved in G, plotting the ratio of the two shows the relative contributions of each independent variable to the change in flow, in arterioles and venules. This in effect shows the functionally opposing behaviours of the two vessel types in response to inflammation.
Figure 2—figure supplement 1
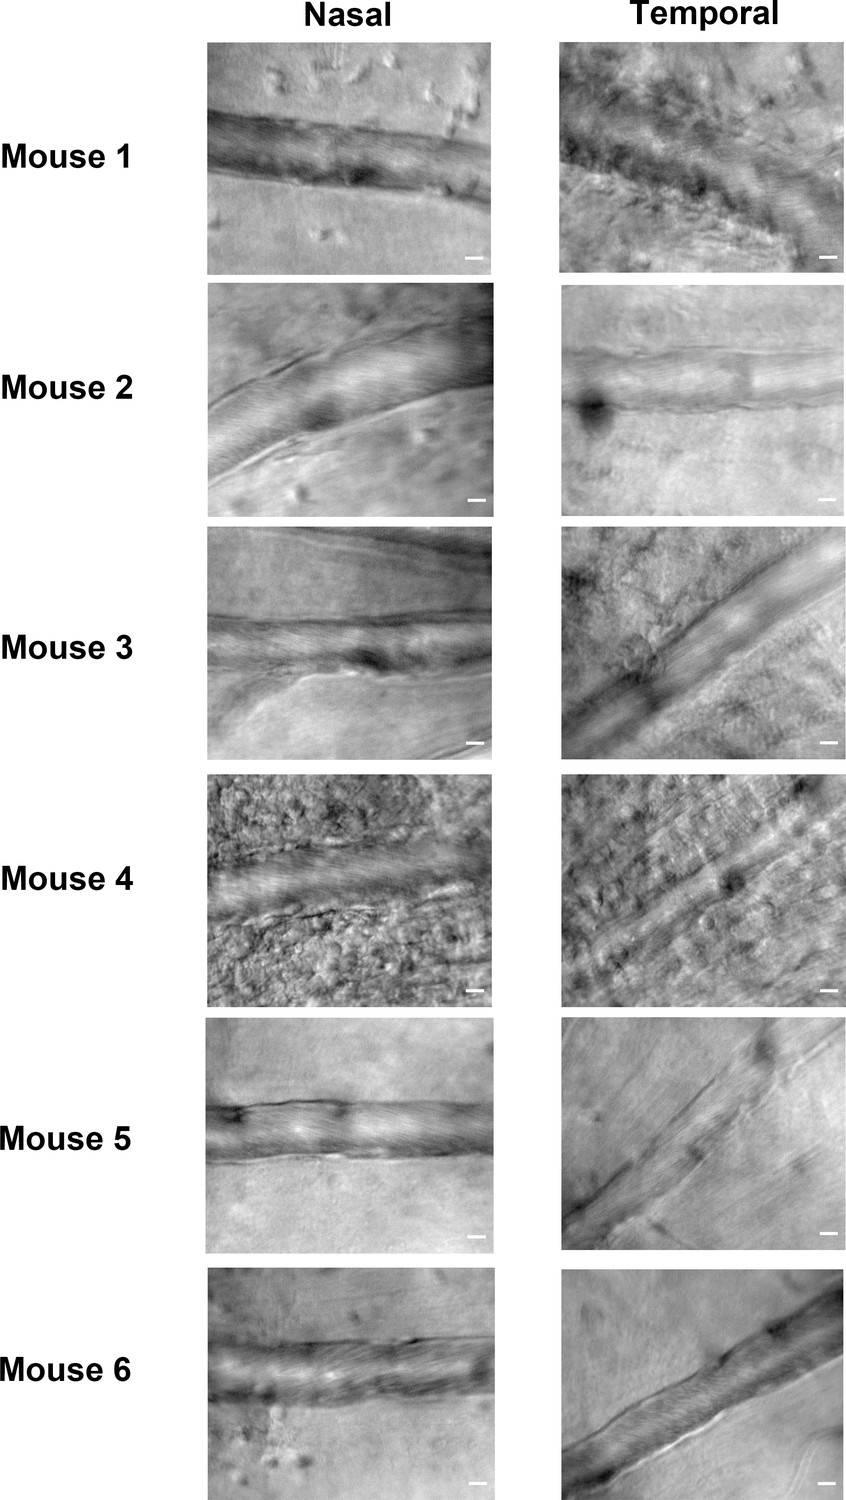
Variation between nasal and temporal retinal veins of the same eye during EIU, in six mice.
Representative still images of the most horizonal and diametrically opposite retinal veins on each side of the optic disc. Images were acquired approximately one-disc diameter distal from the optic nerve head for each mouse eye used in Figure 2 at the 6 hr post injection timepoint. Scale bars = 10 µm.
Videos
Video 1
Demonstration of image post-processing.
(a) Raw adaptive optics scanning light ophthalmoscope (AOSLO) corrected 796 nm phase contrast imaging of C57BL/6J mouse retina. Real-time video obtained at 25 fps acquisition (labelled ‘raw acquisition’) demonstrating movement from respiration and cardiac motion. Image following custom frame-registration. Application of 25 frame temporal averaging and accelerated time-lapse (labelled ‘frame averaging’). Top row, cluster of infiltrated immune cells 6 hr post-LPS. Bottom row, tissue resident cell in healthy retina adjacent to a retinal capillary. Scale bars = 10 μm.
Video 2
Label-free AOSLO time-lapse video demonstrating heterogenous immune cell populations and motility.
Two magnified locations from Figure 1b showing 796 nm phase contrast video acquired at 25 frames/second from two C57BL/6J mouse retinas 24 hr post-LPS injection. The second segment of the video is a full 4.98-degree AOSLO field at a retinal vein 48 hr after LPS injection, revealing a diversity of cell morphologies and motility patterns. Videos have undergone post-processing as described, 25–50 frame temporal averaging. Scale bars = 10 μm.
Video 3
Leukocyte rolling and crawling in an inflamed retinal post-capillary venule.
796 nm phase contrast AOSLO images taken at 6 hr post-LPS injection with 25 frame temporal averaging. Descriptive overlays provided. Scale bar = 10 μm.
Video 4
Examples of diverse immune cell behaviour observable by AOSLO phase contrast imaging.
796 nm reflectance AOSLO images at 6 or 24 hr post-LPS using between 5 to 50 frame averaging. Examples include post-capillary venule leukocyte rolling, transendothelial migration and perivascular leukocyte accumulation, venous leukocyte rolling and crawling with and against blood flow direction, mid tissue infiltrating leukocyte swarming, perivascular cell process contact with intravascular cell and cell migration toward lumen of retinal vein. Scale bars = 10 μm.
Video 5
Neutrophil endothelial rolling within a post-capillary venule confirmed using fluorescent labeling with anti-Ly6G antibody.
Representative example of retinal vein imaged six hours post LPS injection. Simultaneous aligned acquisition of 796 nm phase contrast (top panel) and anti-Ly6G conjugated AlexaFluor 647 (positively labeling neutrophils in bottom panel) using confocal AOSLO fluorescence. Scale bar = 10 μm.
Video 6
Cx3cr1-GFP+ tissue resident cell with motile processes.
Simultaneous aligned acquisition of 796 nm phase contrast (left panel) and GFP fluorescence (right panel) in healthy retina from Cx3cr1GFP/+ reporter mouse. Second section demonstrates process retraction in tissue resident myeloid cell. Third section illustrates diversity of morphology observed. Forth section highlights visible subcellular features in this population. Scale bar = 10 μm.
Video 7
Repeated longitudinal imaging of the same retinal location from initial inflammation to resolution.
Representative recordings from one C57BL/6J mouse eye at the same anatomical location in the retina, identifiable by peripapillary location and capillary and vascular landmarks. Recorded prior to and 6, 24, 72 hr, 10 days and 2 months following a single LPS injection. Scale bar = 10 μm.
Video 8
U-Net cell tracking trace example.
Recording from C57BL/6J mouse retina at 6 hr post-LPS injection. Whole field imaged and quantified is shown on the left side. Magnification of one representative cell on the right. Scale bar = 16 μm. Trace is marked with an overlaid magenta line. Second section shows validation of U-Net cell count results against masked human observers across time demonstrating significant correlation.
Tables
Key resources table
| Reagent type (species) or resource | Designation | Source or reference | Identifiers | Additional information |
|---|---|---|---|---|
| Strain, strain background (M. musculus, males) | Wildtype C57BL/6J mice | The Jackson Laboratory | RRID:IMSR_JAX:000664, JAX Stock number 000664 | six to 12 weeks old |
| Strain, strain background (M. musculus, males) | Cx3cr1-GFP Cx3cr1tm1Litthemizygous mice | The Jackson Laboratory | RRID:IMSR_JAX:005582, JAX Stock number 005582 | six to 8 months old |
| Strain, strain background (M. musculus, males) | Tg(CD68-EGFP)1Drg hemizygous mice | The Jackson Laboratory | RRID:IMSR_JAX:026827, JAX Stock number 026827 | six to 12 weeks old |
| Antibody | Alexa Fluor 647 anti-mouse Ly-6G antibody (1A8 clone) for labeling (Mouse monoclonal) | BioLegend | Catalogue number: 127610 | 2 µg total prepared in 100 µl PBS |
Additional files
Download links
A two-part list of links to download the article, or parts of the article, in various formats.
Downloads (link to download the article as PDF)
Open citations (links to open the citations from this article in various online reference manager services)
Cite this article (links to download the citations from this article in formats compatible with various reference manager tools)
Label-free imaging of immune cell dynamics in the living retina using adaptive optics
eLife 9:e60547.
https://doi.org/10.7554/eLife.60547


