Crosstalk between the chloroplast protein import and SUMO systems revealed through genetic and molecular investigation in Arabidopsis
- Department of Plant Sciences, University of Oxford, United Kingdom
- National Key Laboratory of Plant Molecular Genetics, CAS Centre for Excellence in Molecular Plant Sciences, Institute of Plant Physiology and Ecology, Shanghai Institutes for Biological Sciences, Chinese Academy of Sciences, China
- Department of Biology, University of Leicester, United Kingdom
Figures
Figure 1 with 3 supplements
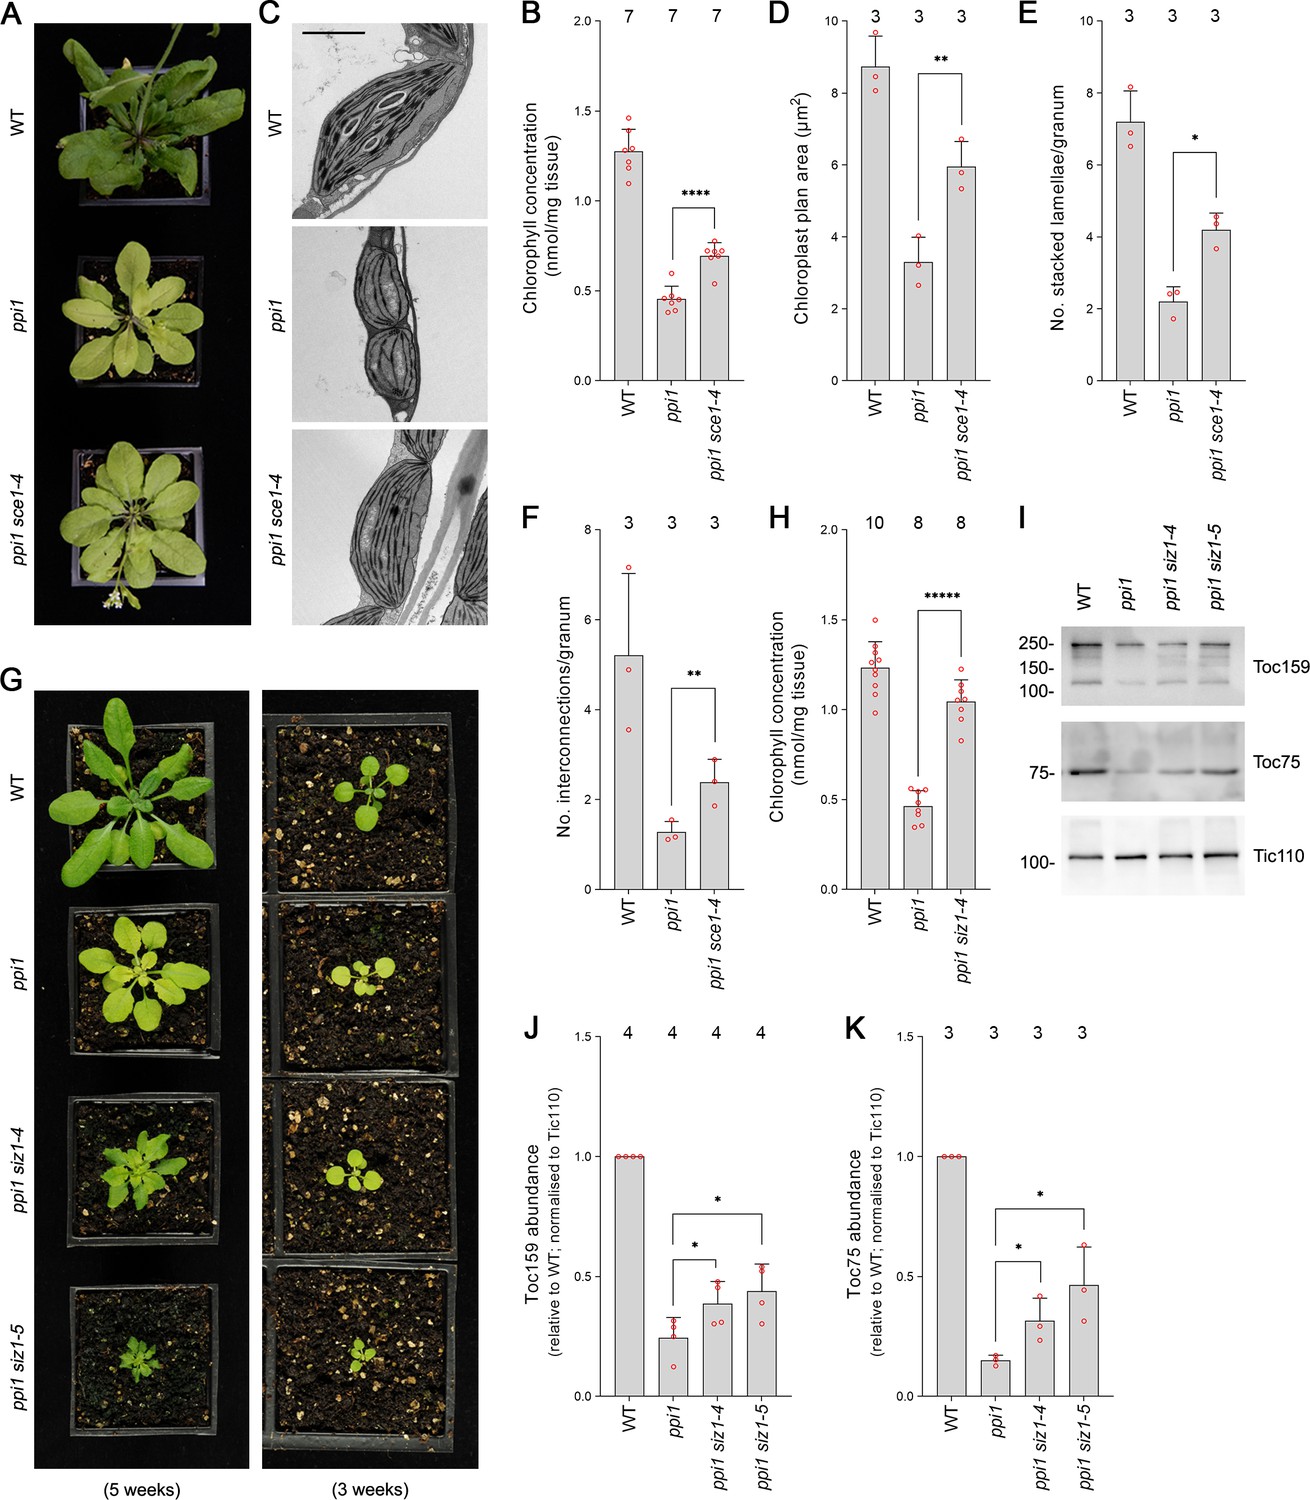
The E2 small ubiquitin-like modifier (SUMO) conjugating enzyme mutation sce1-4 and the E3 SUMO ligase mutations siz1-4 and siz1-5 suppress the phenotype of the plastid protein import mutant ppi1.
(A) The ppi1 sce1-4 double mutant appeared greener than ppi1 after approximately 5 weeks of growth on soil. (B) The ppi1 sce1-4 double mutant showed enhanced accumulation of chlorophyll relative to ppi1 after approximately 5 weeks of growth on soil. Measurements were taken from the plants shown in (A) on the day of photography, as well as additional similar plants. There were significant differences between the ppi1 and ppi1 sce1-4 plants (two-tailed t-test, unpaired samples, T = 6.15, p=0.000049). (C) Transmission electron microscopy revealed improved chloroplast development in mature rosette leaf mesophyll tissue of ppi1 sce1-4 plants relative to ppi1. Plants that had been grown on soil for approximately 4 weeks were analyzed, and representative images are shown. Scale bar = 2 µm. (D) Chloroplast plan area was elevated in ppi1 sce1-4 relative to ppi1. The transmission electron microscopy dataset was quantified. There were significant differences between the ppi1 and ppi1 sce1-4 plants (two-tailed t-test, unpaired samples, T = 4.65, p=0.009674). (E, F) Thylakoid membrane development was increased in ppi1 sce1-4 relative to ppi1. The number of stacked thylakoidal lamellae per granum (E), and the number of stromal thylakoidal lamellae emanating from each granum (granal interconnections) (F), was analyzed using the transmission electron microscopy dataset. There were significant differences between the ppi1 and ppi1 sce1-4 plants (two-tailed t-test, unpaired samples: T = 5.53, p=0.005221 [E]; T = 3.38, p=0.0277 [F]). (G) The ppi1 siz1-4 and ppi1 siz1-5 double mutants appeared greener than ppi1 after different periods of growth on soil. The plants were photographed after 3 weeks of growth (right panel) and then again after 5 weeks of growth (left panel). (H) The ppi1 siz1-4 double mutant showed enhanced accumulation of chlorophyll relative to ppi1 after approximately 5 weeks of growth on soil. Measurements were taken from the plants shown in (G) on the day of photography, as well as additional similar plants. There were significant differences between the ppi1 and ppi1 siz1-4 plants (two-tailed t-test, unpaired samples, T = 11.01, p<0.00001). (I) TOC protein accumulation was improved in ppi1 siz1-4 and ppi1 siz1-5 relative to ppi1. Analysis of the levels of Toc75 and Toc159 in ppi1 siz1-4, ppi1 siz1-5, and relevant control plants was conducted by immunoblotting. Protein samples were taken from whole seedlings that had been grown on soil for approximately 2 weeks (the plants shown in Figure 1—figure supplement 1C on the day of photography). Tic110, a TIC-associated protein, was included as a compartment-specific loading control (Inaba et al., 2005). Migration positions of standards are displayed to the left of the gel images, and sizes are indicated in kDa. Unprocessed membrane images are displayed in Source data 1. (J, K) Toc159 and Toc75 protein accumulation was improved in ppi1 siz1-4 and ppi1 siz1-5 relative to ppi1. Specific bands in (I) and in Source data 1 were quantified. There were significant differences between the ppi1 and ppi1 siz1-4 samples (one-tailed t-test, unpaired samples: T = 2.26, p=0.032316 [J, Toc159]; T = 2.93, p=0.021334 [K, Toc75]) and between the ppi1 and ppi1 siz1-5 samples (one-tailed t-test, unpaired samples: T = 2.76, p=0.01639 [J, Toc159]; T = 3.36, p=0.014118 [K, Toc75]). In all bar charts, error bars indicate standard deviation from the mean, and open red circles indicate individual data points. The numbers above the graphs indicate the number of biological replicates per sample. Statistical significance is indicated as follows: *p<0.05; **p<0.01; ****p<0.0001; *****p<0.00001.
Figure 1—figure supplement 1

The E2 small ubiquitin-like modifier (SUMO) conjugating enzyme mutation sce1-4 and the E3 SUMO ligase mutations siz1-4 and siz1-5 suppress the phenotype of the plastid protein import mutant ppi1.
(A) The ppi1 sce1-4 double mutant appeared greener than ppi1 after approximately 3 weeks of growth on soil, while the single sce1-4 mutant appeared no greener than the wild-type control. (B) The ppi1 sce1-4 double mutant showed enhanced accumulation of chlorophyll relative to ppi1 after approximately 3 weeks of growth on soil (T = 8.19, p<0.0001), while the single sce1-4 mutant displayed no enhanced accumulation of chlorophyll relative to the wild-type control. Measurements were taken from the plants shown in (A) on the day of photography, as well as additional similar plants. (C) The ppi1 siz1-4 and ppi1 siz1-5 double mutants appeared greener than ppi1 after approximately 2 weeks of growth on soil, while the single siz1-4 and siz1-5 mutants appeared no greener than the wild-type control. (D) The ppi1 siz1-4 and ppi1 siz1-5 double mutants showed enhanced accumulation of chlorophyll relative to ppi1 after approximately 2 weeks of growth on soil (T = 7.16, p<0.0001 and T = 8.26, p<0.0001, respectively), while the single siz1-4 and siz1-5 mutants displayed no enhanced accumulation of chlorophyll relative to the wild-type control. Measurements were taken from the plants shown in (C) on the day of photography, as well as additional similar plants. In all bar charts, error bars indicate standard deviation from the mean, and open red circles indicate individual data points. The numbers above the graphs indicate the number of biological replicates per sample. Statistical significance is indicated as follows: *****p<0.00001.
Figure 1—figure supplement 2
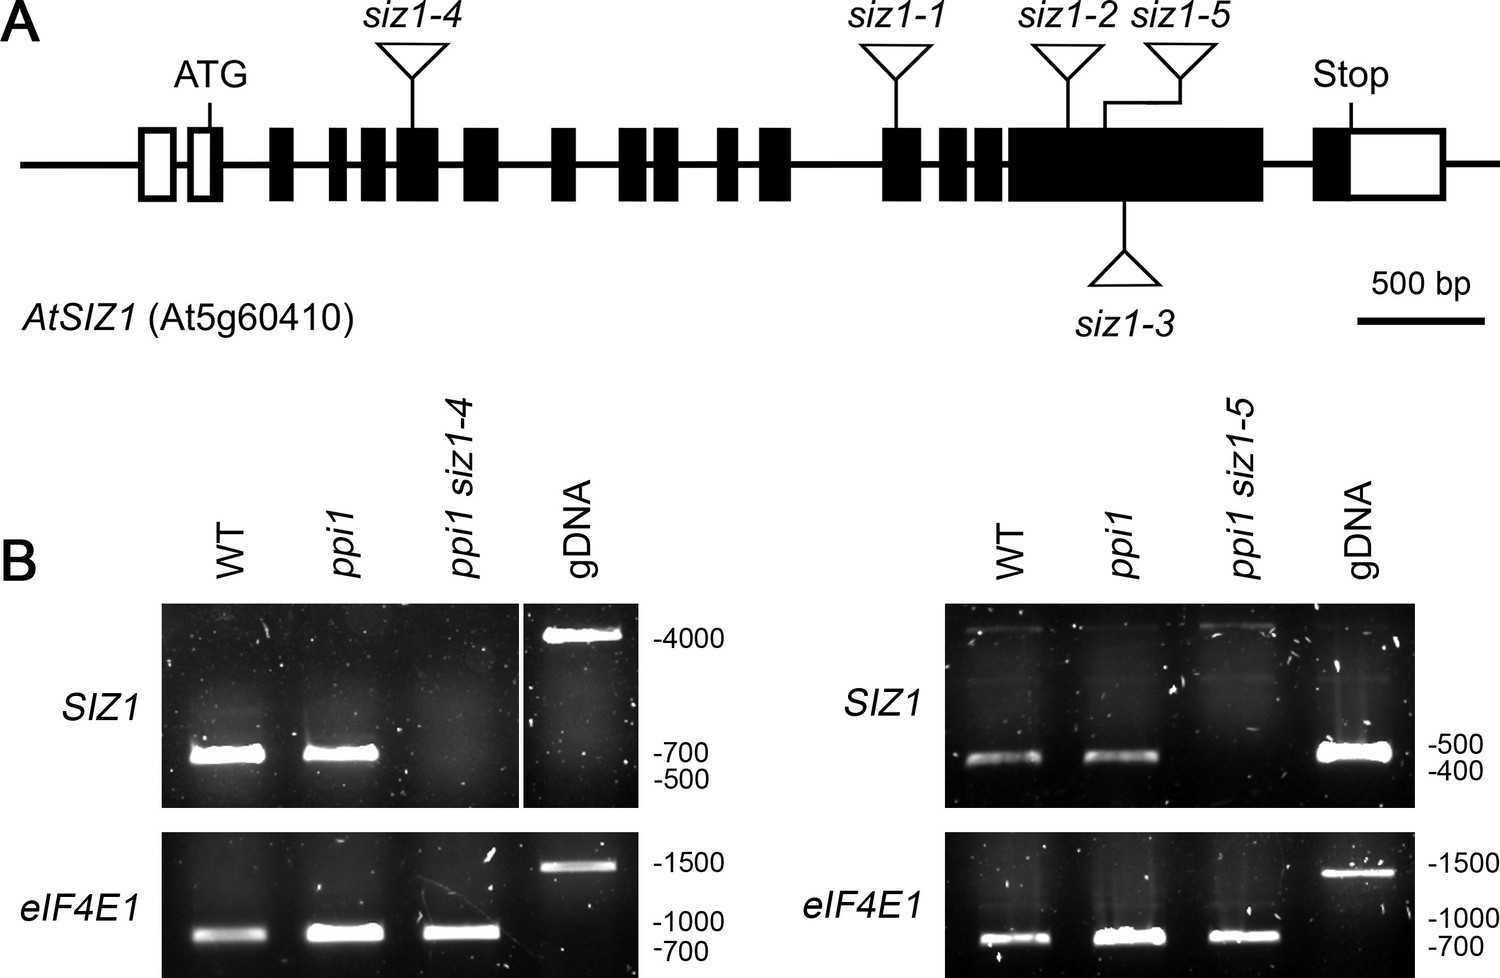
Molecular analysis of the siz1-4 and siz1-5 mutants.
(A) Schematic representation of the SIZ1 (At5g60410) gene, annotated with the positions of the siz1 T-DNA insertions. The siz1-4 and siz1-5 insertion sites were verified in this study by DNA sequencing. The black boxes indicate exons, while the interconnecting black lines represent introns. The white boxes indicate untranslated regions. (B) Analysis of SIZ1 mRNA expression in siz1-4 and siz1-5. RNA samples were taken from 2-week-old seedlings and used as a template for cDNA synthesis. Primers specific to SIZ1 and the reference gene eIF4E1 were used in two parallel RT-PCR experiments. gDNA: genomic DNA. Migration positions of standards are displayed to the right of the gel images, and sizes are indicated in base pairs.
Figure 1—figure supplement 3
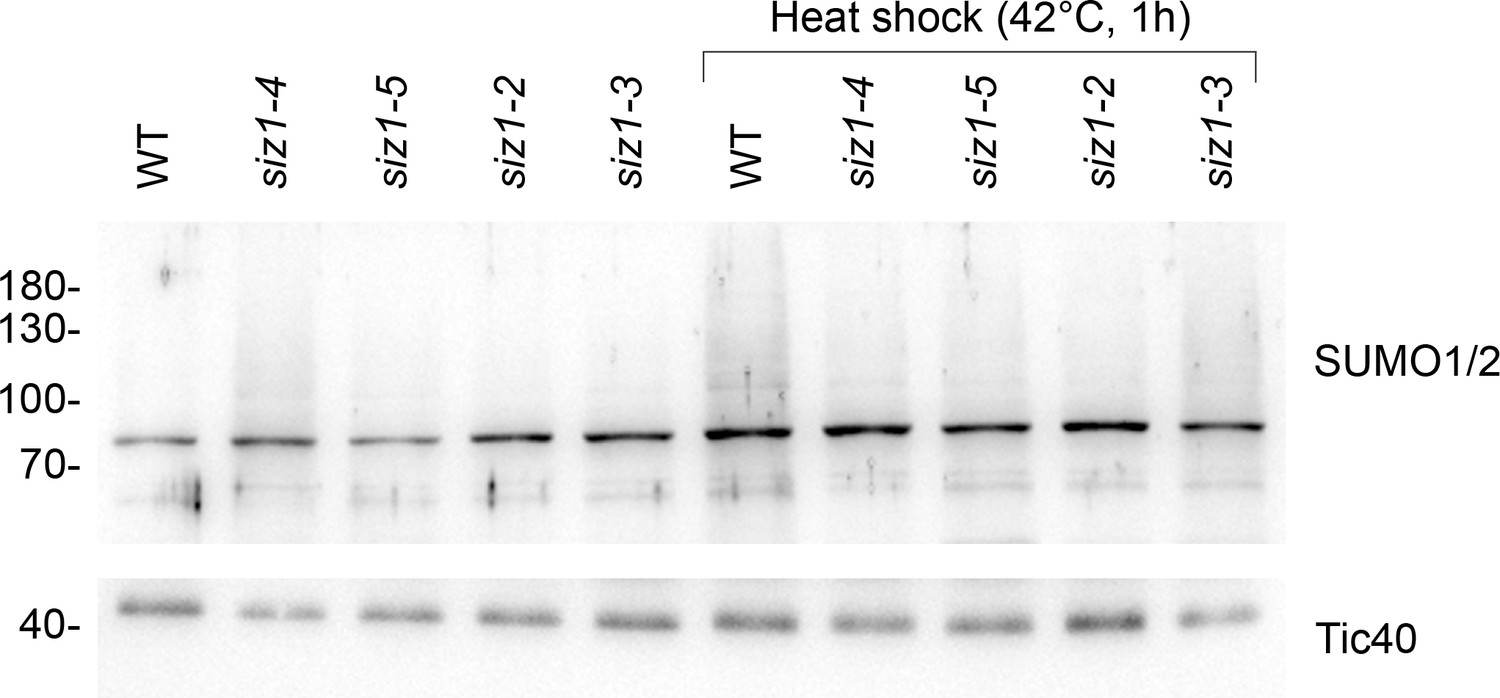
The siz1-4 and siz1-5 mutants display reduced global SUMOylation in response to heat shock.
14-day-old seedlings of the indicated genotypes were subjected to heat shock (42°C for 1 hr, followed by a 1 hr recovery period at 22°C). Protein samples were taken from whole seedlings and analyzed by immunoblotting. The siz1-4 and siz1-5 mutants displayed a moderate reduction of global SUMOylation, and this reduction was similar in magnitude to the reduction observed in the previously characterized siz1-2 and siz1-3 mutants. The unprocessed membrane images are displayed in Source data 1.
Figure 2
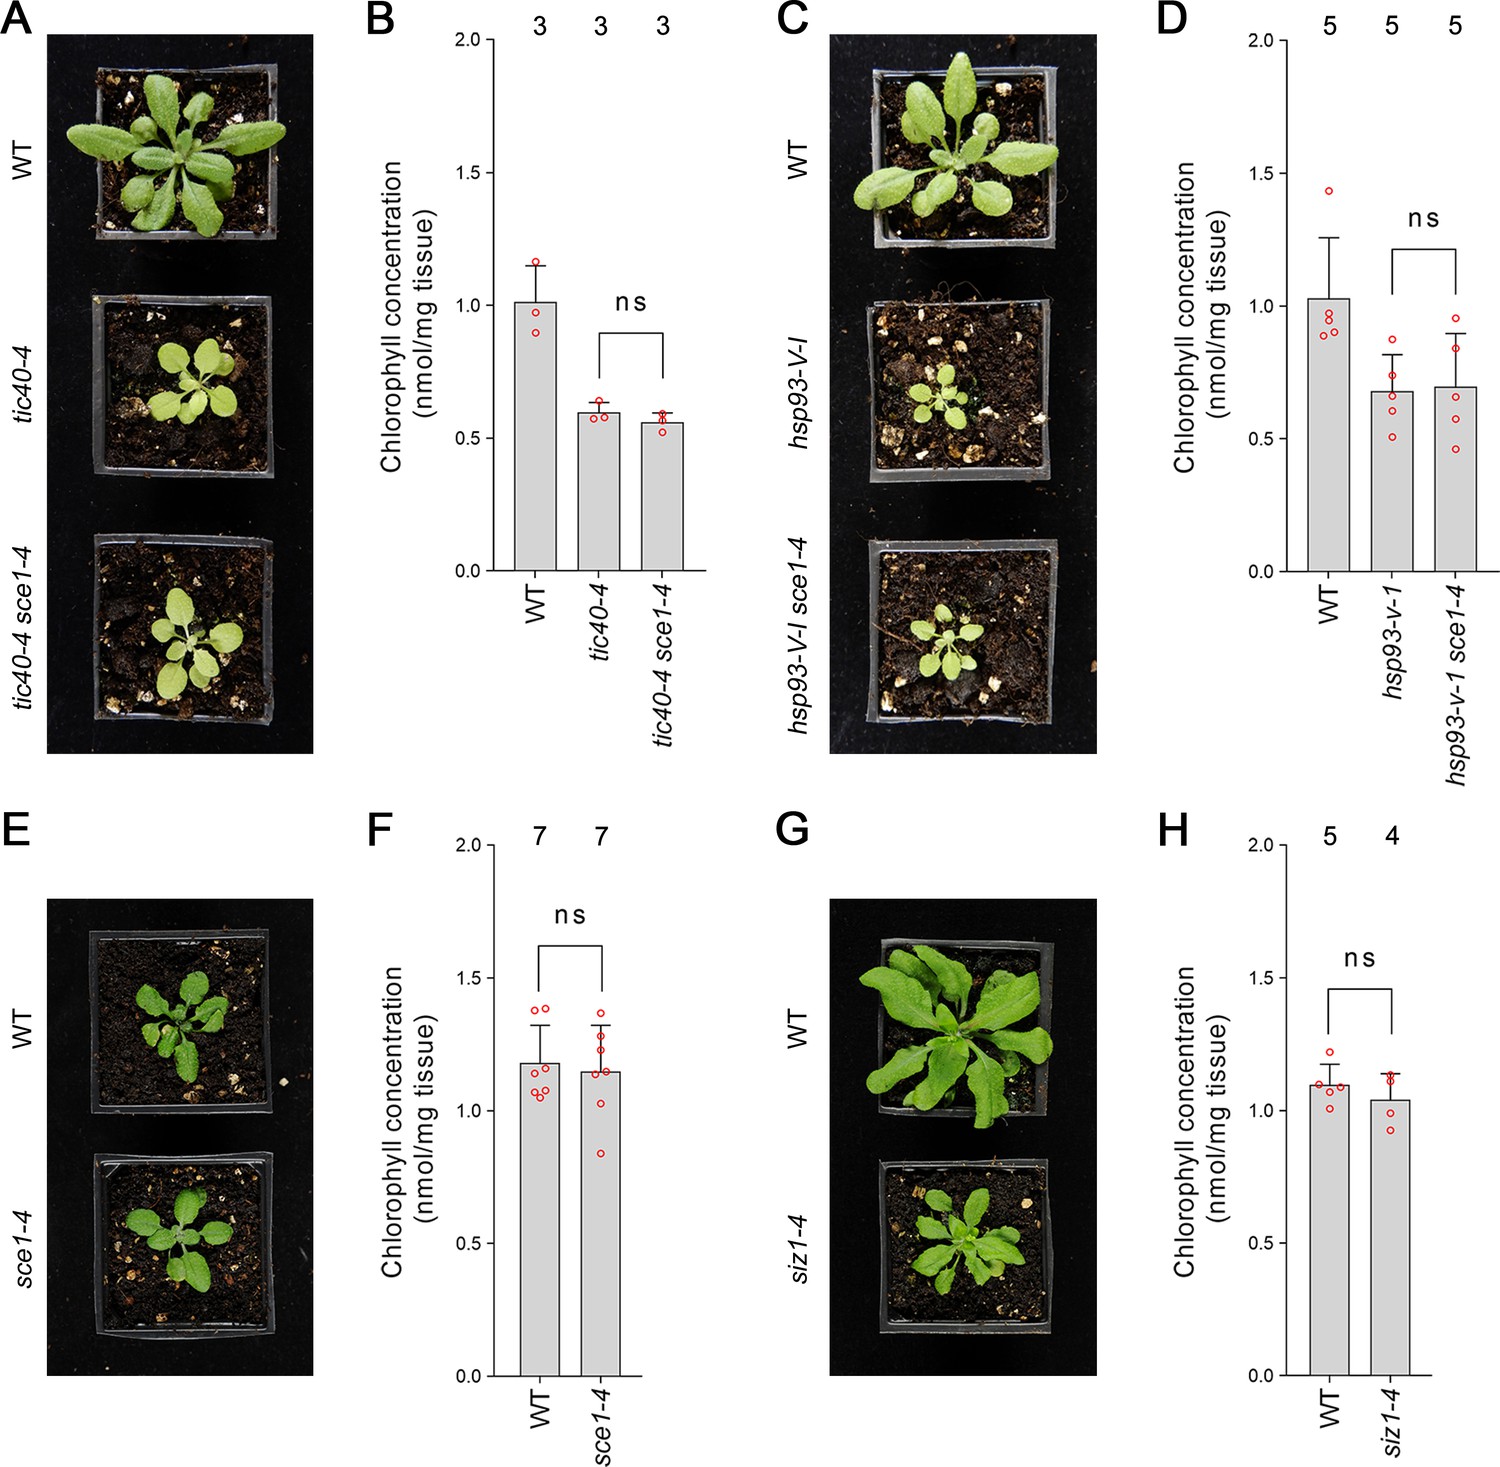
Genetic analysis reveals specificity of the suppression mediated by the sce1-4 and siz1-4 mutations.
(A) The tic40-4 sce1-4 double mutant did not appear greener than tic40-4 after approximately 4 weeks of growth on soil. (B) The tic40-4 sce1-4 double mutant did not show an enhanced accumulation of chlorophyll relative to tic40-4 after approximately 4 weeks of growth on soil. Measurements were taken from the plants shown in (A) on the day of photography, as well as additional similar plants. There were no significant differences between the tic40-4 and tic40-4 sce1-4 plants (two-tailed t-test, unpaired samples, T = 1.25, p=0.280106). (C) The hsp93-V-1 sce1-4 double mutant did not appear greener than hsp93-V-1 after approximately 4 weeks of growth on soil. (D) The hsp93-V-1 sce1-4 double mutant did not show an enhanced accumulation of chlorophyll relative to hsp93-V-1 after approximately 4 weeks of growth on soil. Measurements were taken from the plants shown in (C) on the day of photography, as well as additional similar plants. There were no significant differences between the hsp93-V-1 and hsp93-V-1 sce1-4 plants (two-tailed t-test, unpaired samples, T = 0.18, p=0.860702). (E) The sce1-4 single mutant did not appear greener than wild-type plants after approximately 4 weeks of growth on soil. (F) The sce1-4 single mutant did not show an enhanced accumulation of chlorophyll relative to wild-type plants after approximately 4 weeks of growth on soil. Measurements were taken from the plants shown in (E) on the day of photography, as well as additional similar plants. There were no significant differences between the sce1-4 and wild-type plants (two-tailed t-test, unpaired samples, T = 0.38, p=0.708484). (G) The siz1-4 single mutant did not appear greener than wild-type plants after approximately 5 weeks of growth on soil. (H) The siz1-4 single mutant did not show an enhanced accumulation of chlorophyll relative to wild-type plants after approximately 5 weeks of growth on soil. Measurements were taken from the plants shown in (G) on the day of photography, as well as from additional similar plants. There were no significant differences between the siz1-4 and wild-type plants (T = 0.96, p=0.370055). In all bar charts, error bars indicate standard deviation from the mean, and open red circles indicate individual data points. The numbers above the graphs indicate the number of biological replicates per sample. Statistical significance is indicated as follows: ns: not significant.
Figure 3
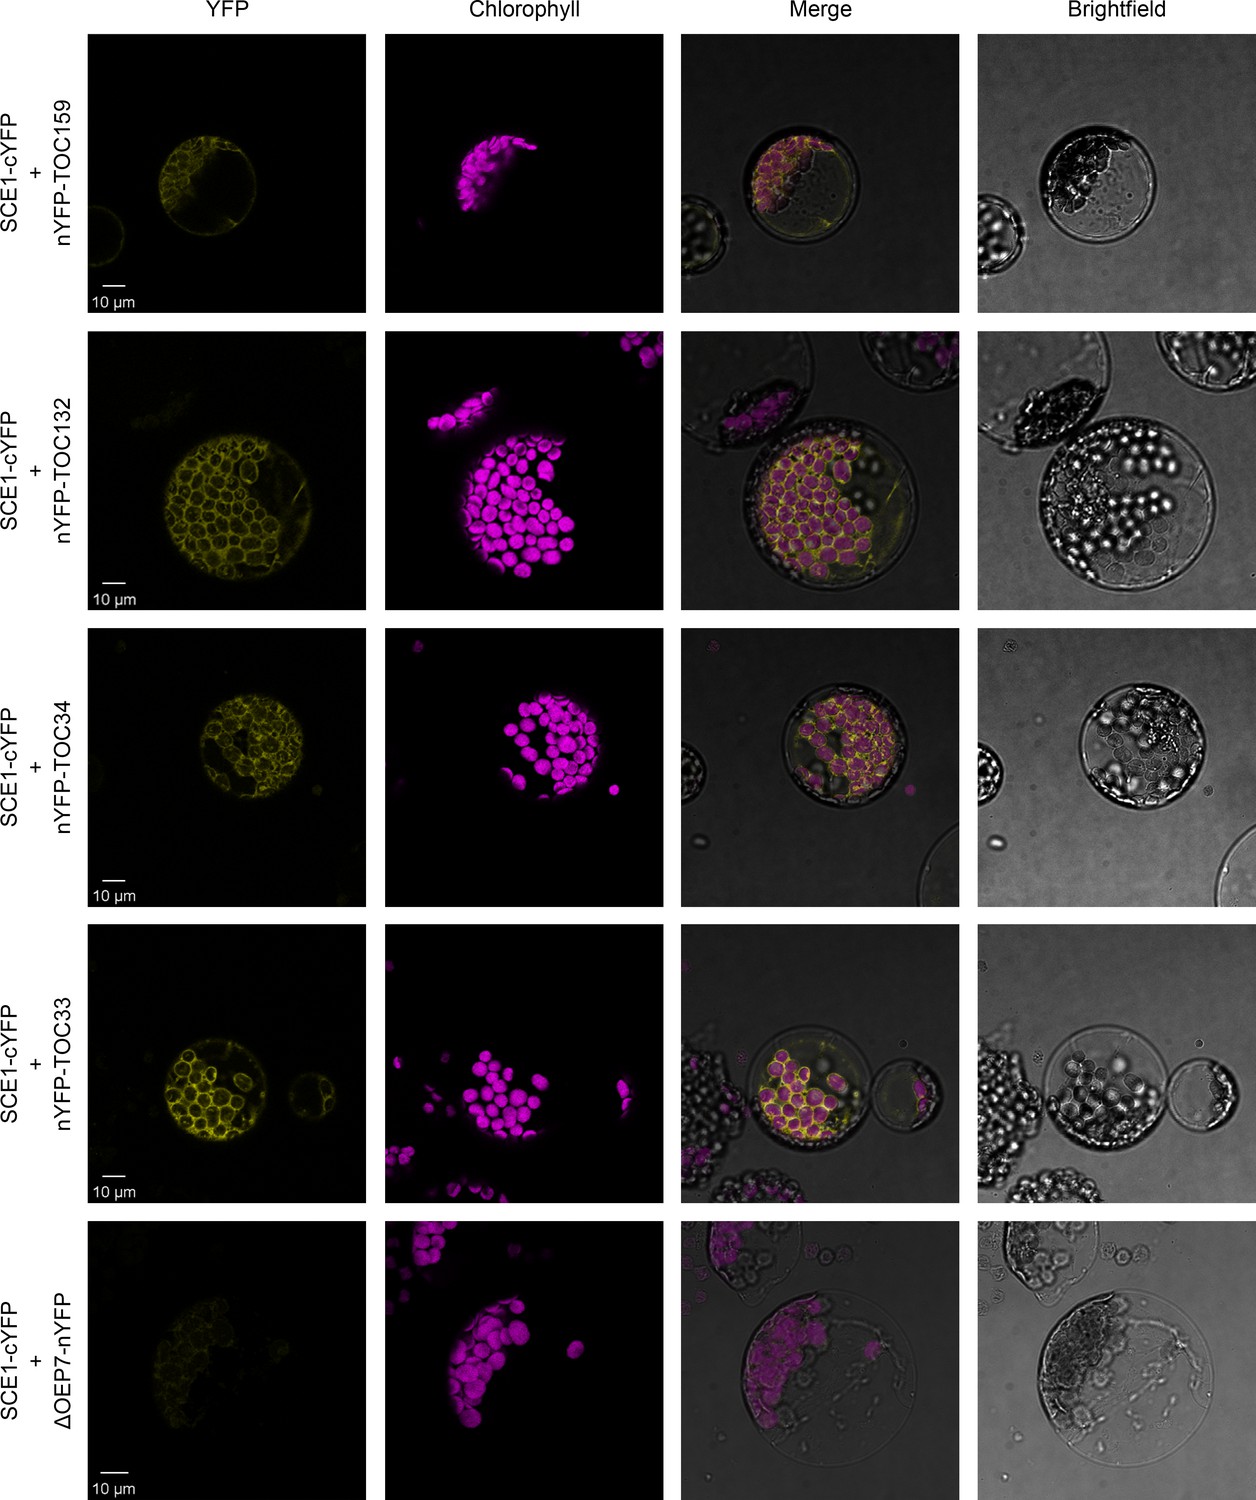
SCE1 physically interacts with TOC proteins in vivo.
Bimolecular fluorescence complementation (BiFC) analysis of SCE1 protein-protein interactions was performed by imaging Arabidopsis protoplasts co-expressing proteins fused to complementary N-terminal (nYFP) and C-terminal (cYFP) fragments of the YFP protein, as indicated. Chlorophyll autofluorescence images were used to orientate the YFP signals in relation to the chloroplasts. SCE1 physically associated with all tested TOC proteins. The images shown are representative confocal micrographs indicating associations between SCE1 and Toc159, Toc132, Toc34, and Toc33. In contrast, SCE1 did not physically associate with ΔOEP7 (comprising the transmembrane domain of OEP7, which is sufficient to direct targeting to the chloroplast outer envelope), which served as a negative control. Scale bars = 10 µm.
Figure 4 with 2 supplements
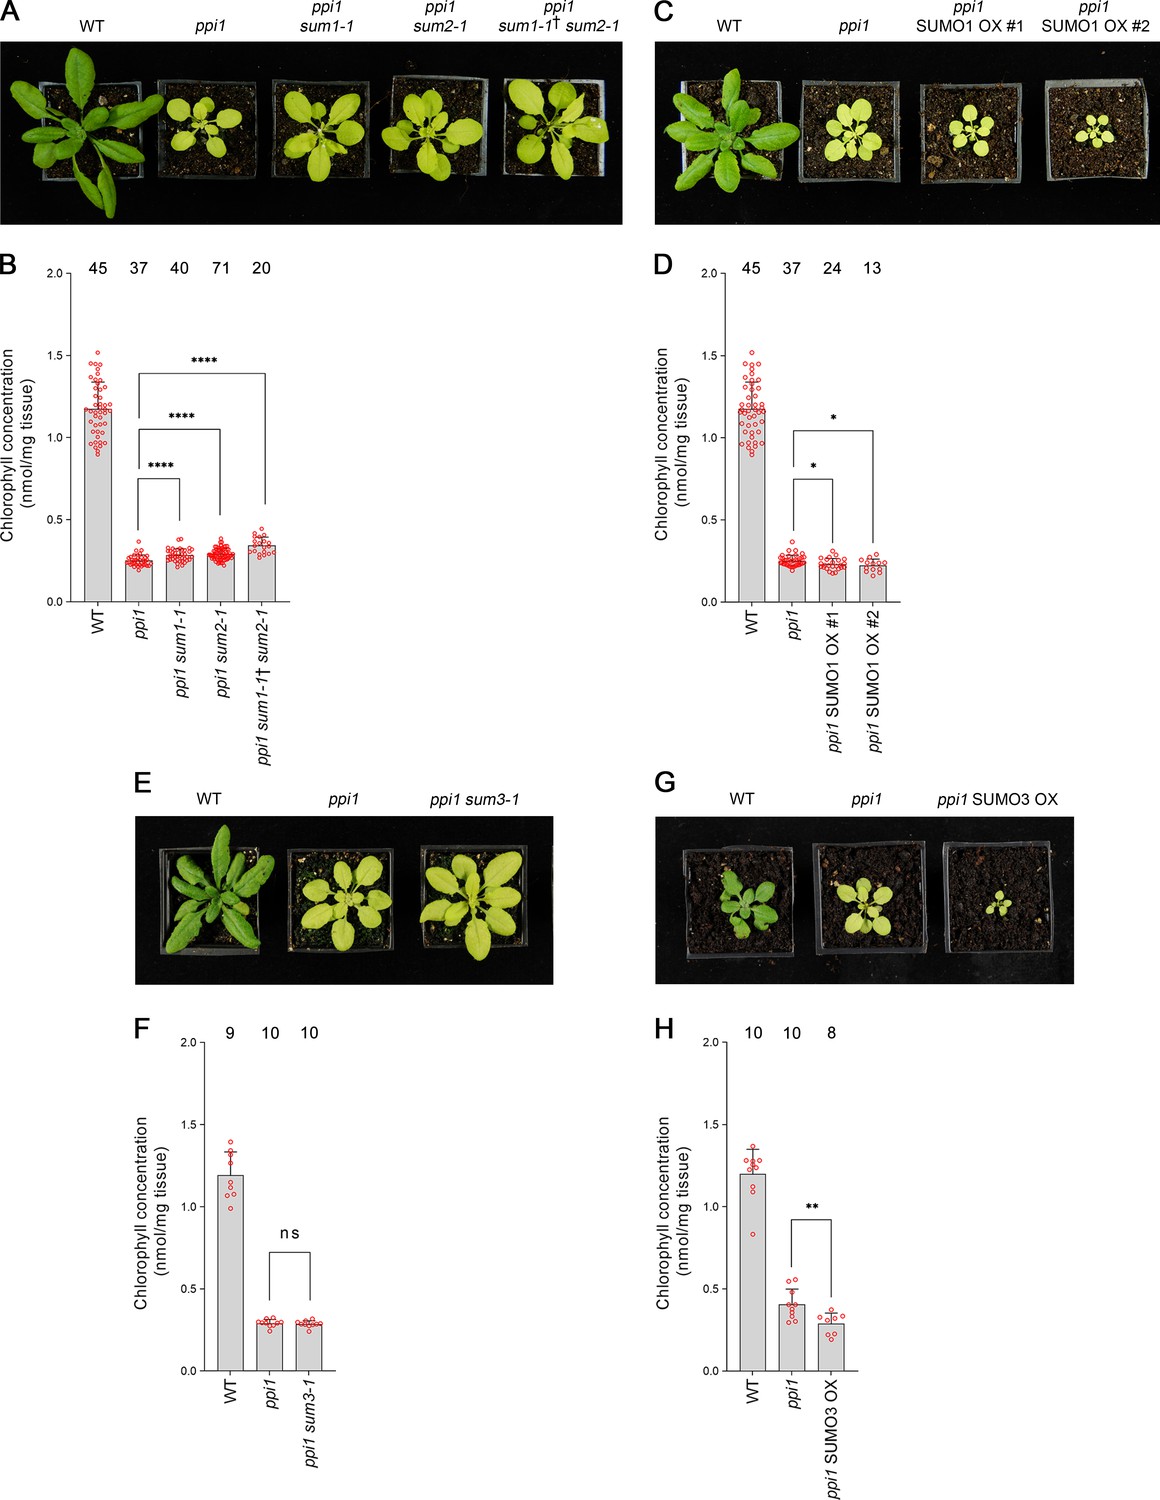
Genetic interactions between ppi1 and the genes encoding three small ubiquitin-like modifier (SUMO) isoforms.
(A) The ppi1 sum1-1, ppi1 sum2-1, and ppi1 sum1-1† sum2-1 double and triple mutants appeared greener than ppi1 after approximately 4 weeks of growth on soil. The ‘†’ symbol indicates that the triple mutant was heterozygous with respect to the sum1-1 mutation. (B) The ppi1 sum1-1, ppi1 sum2-1, and ppi1 sum1-1† sum2-1 double and triple mutants showed enhanced accumulation of chlorophyll relative to ppi1 after approximately 4 weeks of growth on soil. Measurements were taken from the plants shown in (A) on the day of photography, as well as additional similar plants. There were significant differences between the samples as measured via a one-way ANOVA (F = 26.21, p=6.65 × 10⁻¹⁴). A post-hoc Tukey HSD test indicated that there was a significant difference between the ppi1 and ppi1 sum1-1 samples (p<0.00001). There were also significant differences between the ppi1 and ppi1 sum2-1 samples (p<0.00001), and between the ppi1 and ppi1 sum1-1† sum2-1 samples (p<0.00001). (C) The ppi1 SUMO1 overexpression (OX) lines appeared smaller and paler than ppi1 after approximately 4 weeks of growth on soil. (D) The ppi1 SUMO1 OX lines showed reduced accumulation of chlorophyll relative to ppi1 after approximately 4 weeks of growth on soil. Measurements were taken from the plants shown in (C) on the day of photography, as well as additional similar plants. There were significant differences between the ppi1 and ppi1 SUMO1 OX #1 plants (two-tailed t-test, unpaired samples, T = 2.27, p=0.026832), and between the ppi1 and ppi1 SUMO1 OX #2 plants (two-tailed t-test, unpaired samples, T = 2.49, p=0.01634). (E) The ppi1 sum3-1 double mutant did not appear greener than ppi1 after approximately 4 weeks of growth on soil. (F) The ppi1 sum3-1 double mutant did not show an enhanced accumulation of chlorophyll relative to ppi1 after approximately 4 weeks of growth on soil. Measurements were taken from the plants shown in (E) on the day of photography, as well as additional similar plants. There were no significant differences between the ppi1 and ppi1 sum3-1 plants (two-tailed t-test, unpaired samples, T = 0.54, p=0.59407). (G) The ppi1 SUMO3 overexpression line appeared smaller and paler than ppi1 after approximately 3 weeks of growth on soil. (H) The ppi1 SUMO3 overexpression line showed reduced accumulation of chlorophyll relative to ppi1 after approximately 3 weeks of growth on soil. Measurements were taken from the plants shown in (G) on the day of photography, as well as additional similar plants. There were significant differences between the ppi1 SUMO3 OX plants and ppi1 (two-tailed t-test, unpaired samples, T = 2.99, p=0.008688). In all bar charts, error bars indicate standard deviation from the mean, and open red circles indicate individual data points. The numbers above the graphs indicate the number of biological replicates per sample. Statistical significance is indicated as follows: ns: not significant; *p<0.05; **p<0.01; ****p<0.0001.
Figure 4—figure supplement 1
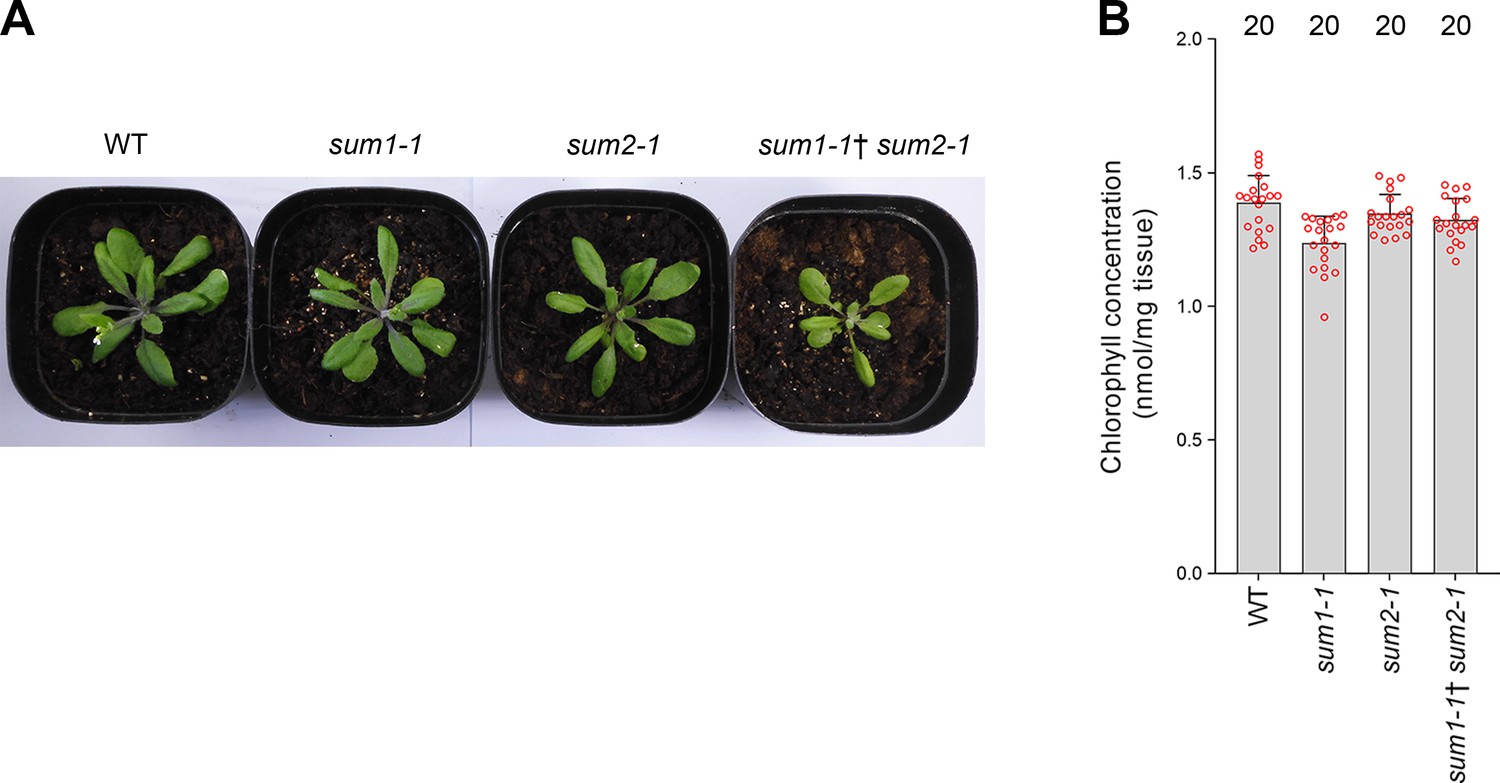
The sum1-1, sum2-1, and sum1-1† sum2-1 single and double mutants do not show enhanced chlorophyll accumulation relative to wild-type plants.
(A) The sum1-1, sum2-1, and sum1-1† sum2-1 mutants did not appear greener than wild-type plants after approximately 4 weeks of growth on soil. (B) The sum1-1, sum2-1, and sum1-1† sum2-1 mutants did not show enhanced chlorophyll accumulation relative to wild-type plants after approximately 4 weeks of growth on soil. The ‘†’ symbol indicates that the double mutant was heterozygous with respect to the sum1-1 mutation. Error bars indicate standard deviation from the mean, and open red circles indicate individual data points. The numbers above the graph indicate the number of biological replicates per sample.
Figure 4—figure supplement 2
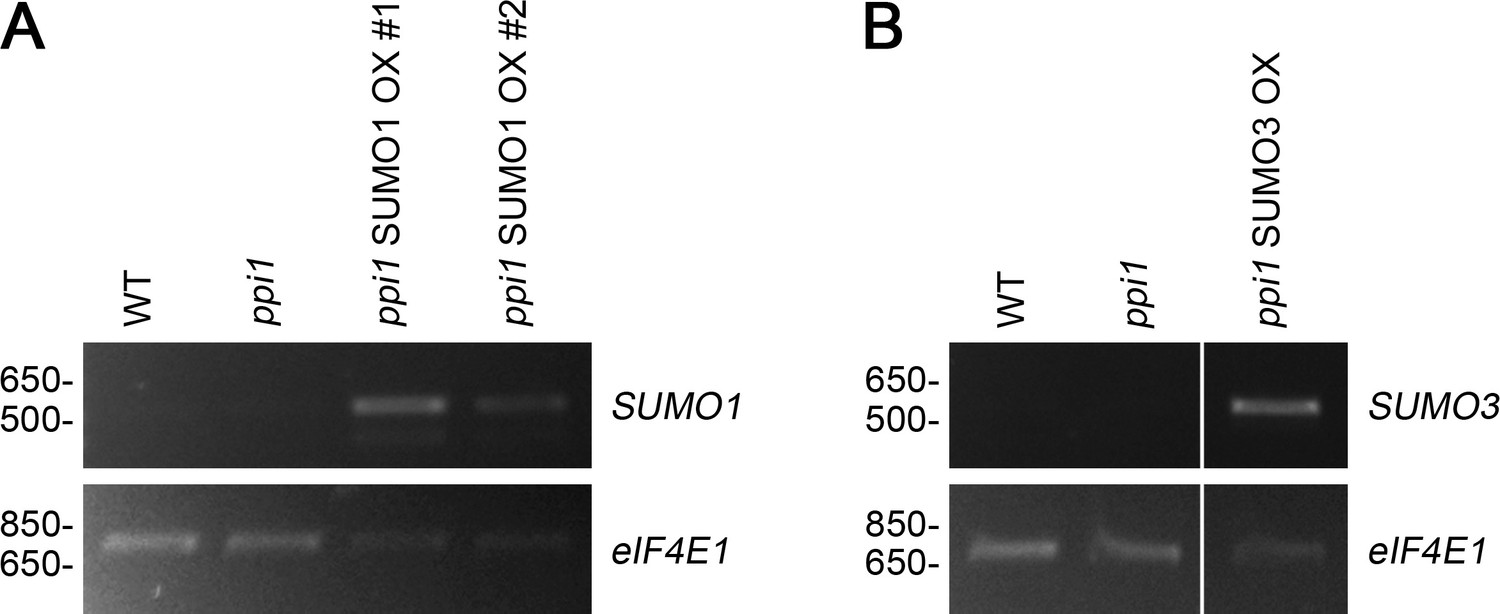
Analysis of the expression of the 35S:SUMO1 and 35S:SUMO3 transgenes in the selected transformants by RT-PCR.
Total RNA was extracted from the rosette tissue of plants that had been grown on soil for approximately 4 weeks. The expression of SUMO1 (A) or SUMO3 (B), and of the control gene, eIF4E1, was analyzed by semi-quantitative RT-PCR. A limited number of amplification cycles (n = 26) were employed to prevent saturation. Migration positions of standards are displayed to the left of the gel images, and sizes are indicated in base pairs.
Figure 5 with 4 supplements
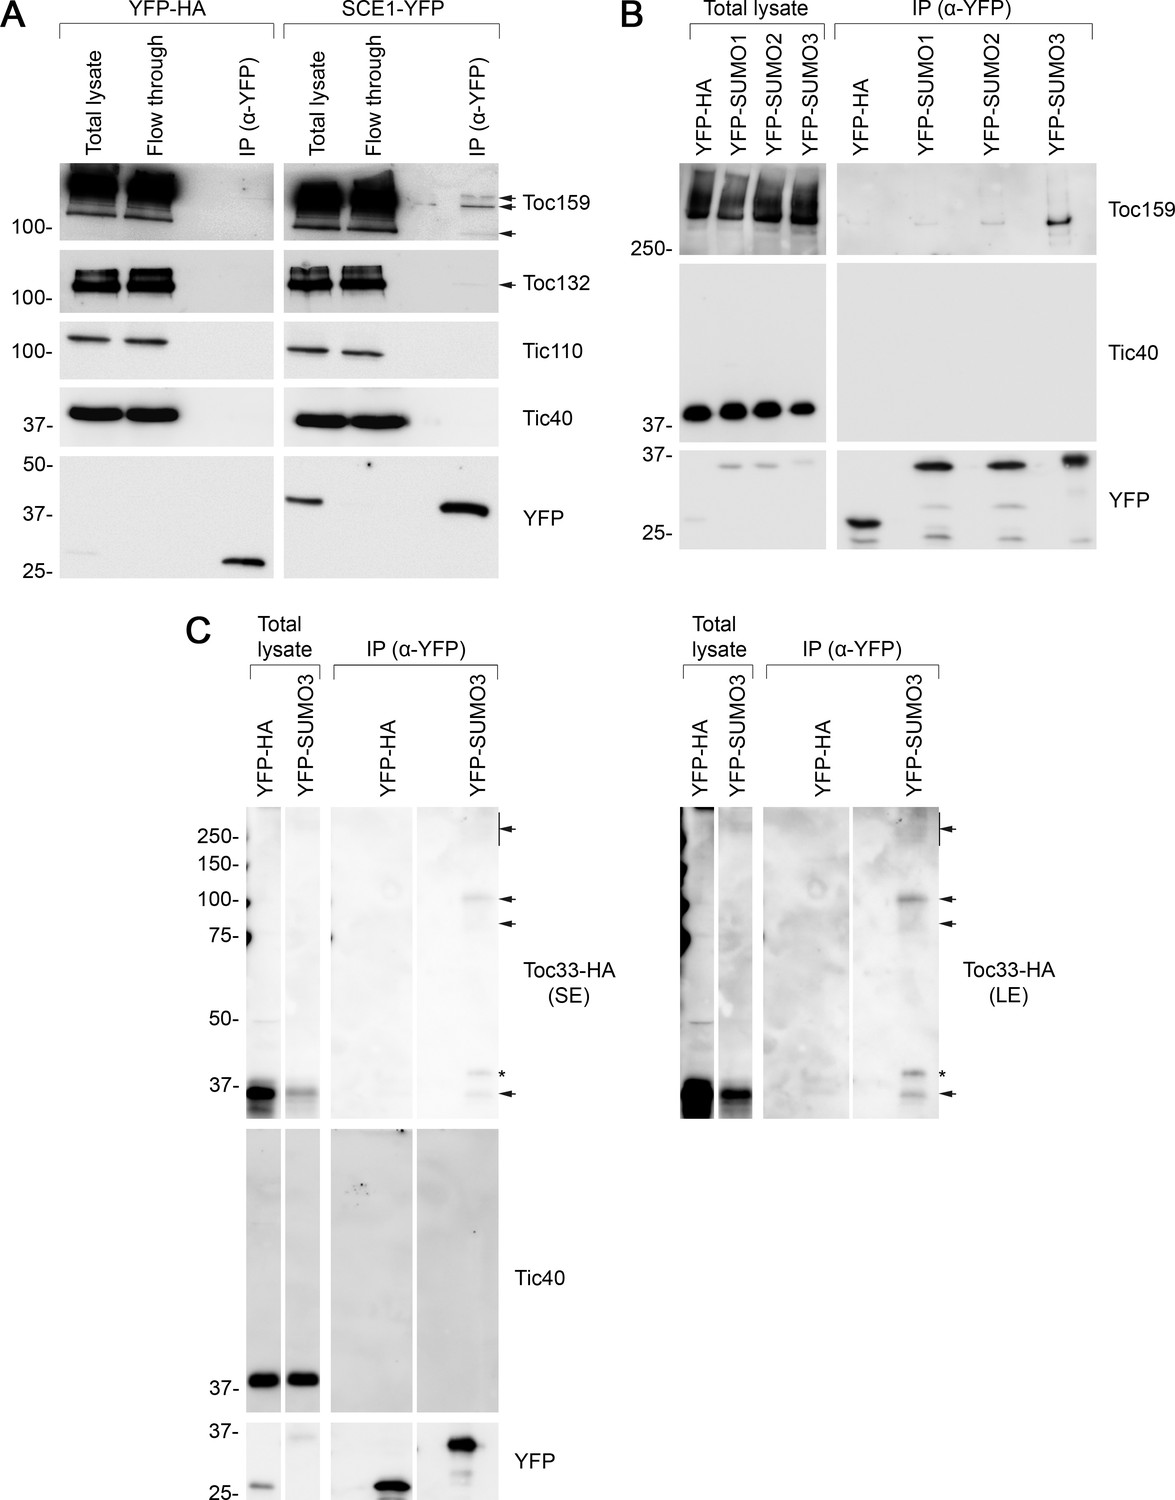
Immunoprecipitation (IP) analysis reveals that TOC proteins are small ubiquitin-like modifier (SUMO) targets.
(A) SCE1 physically associated with native TOC proteins. Arabidopsis protoplasts expressing YFP-HA (left panel) or SCE1-YFP (right panel) were solubilized and subjected to IP analysis. The YFP-HA construct served as a negative control. In both cases, three samples were analyzed: the ‘Total lysate’ sample (total protein extract from solubilized protoplasts); the ‘Flow through’ sample (the total protein sample after incubation with anti-YFP beads); and the ‘IP’ sample (the eluted fraction of the total protein sample that bound to the anti-YFP beads). The samples were analyzed by immunoblotting, revealing that SCE1-YFP, but not the YFP-HA control, was associated with native Toc159 and Toc132 (indicated by the arrows). Neither SCE1-YFP nor YFP-HA was associated with native Tic110 or Tic40, which were included as negative control proteins. (B) All three SUMO isoforms physically associated with native Toc159. Protoplasts expressing YFP-HA, YFP-SUMO1, YFP-SUMO2, or YFP-SUMO3 were solubilized and subjected to IP analysis as in (A). In all four cases, two samples (the ‘Total lysate’ and the ‘IP’ samples) were analyzed by immunoblotting. Toc159 was resolved on an 8% acrylamide gel for 4 hr to maximize the resolution of high molecular weight bands. All three YFP-SUMO proteins were found to associate with native Toc159; however, YFP-SUMO3 immunoprecipitated Toc159 with the greatest efficiency. None of the four YFP fusion proteins associated with native Tic40, which served as a negative control protein. (C) YFP-SUMO3 physically associated with Toc33-HA and related high molecular weight species. Protoplasts co-expressing YFP-SUMO3 or YFP-HA together with Toc33-HA were solubilized and subjected to IP analysis as in (A). In both cases, two samples (the ‘Total lysate’ and ‘IP’ samples) were analyzed by immunoblotting. The results showed that YFP-SUMO3, but not YFP-HA, was associated with Toc33-HA (indicated by the lower arrow). Bands corresponding to the molecular weight of Toc33-HA bearing one, two, or several YFP-SUMO3 motifs were detected on the membrane (indicated by the upper arrows). The predicted molecular weight of YFP-SUMO3 is approximately 38.9 kDa. Neither YFP-SUMO3 nor YFP-HA was associated with Tic40, which served as a negative control protein. The asterisk indicates a nonspecific band. Short (SE) and long (LE) exposures are shown. Migration positions of standards are displayed to the left of the gel images, and sizes are indicated in kDa. The unprocessed membrane images are displayed in Source data 1.
Figure 5—figure supplement 1
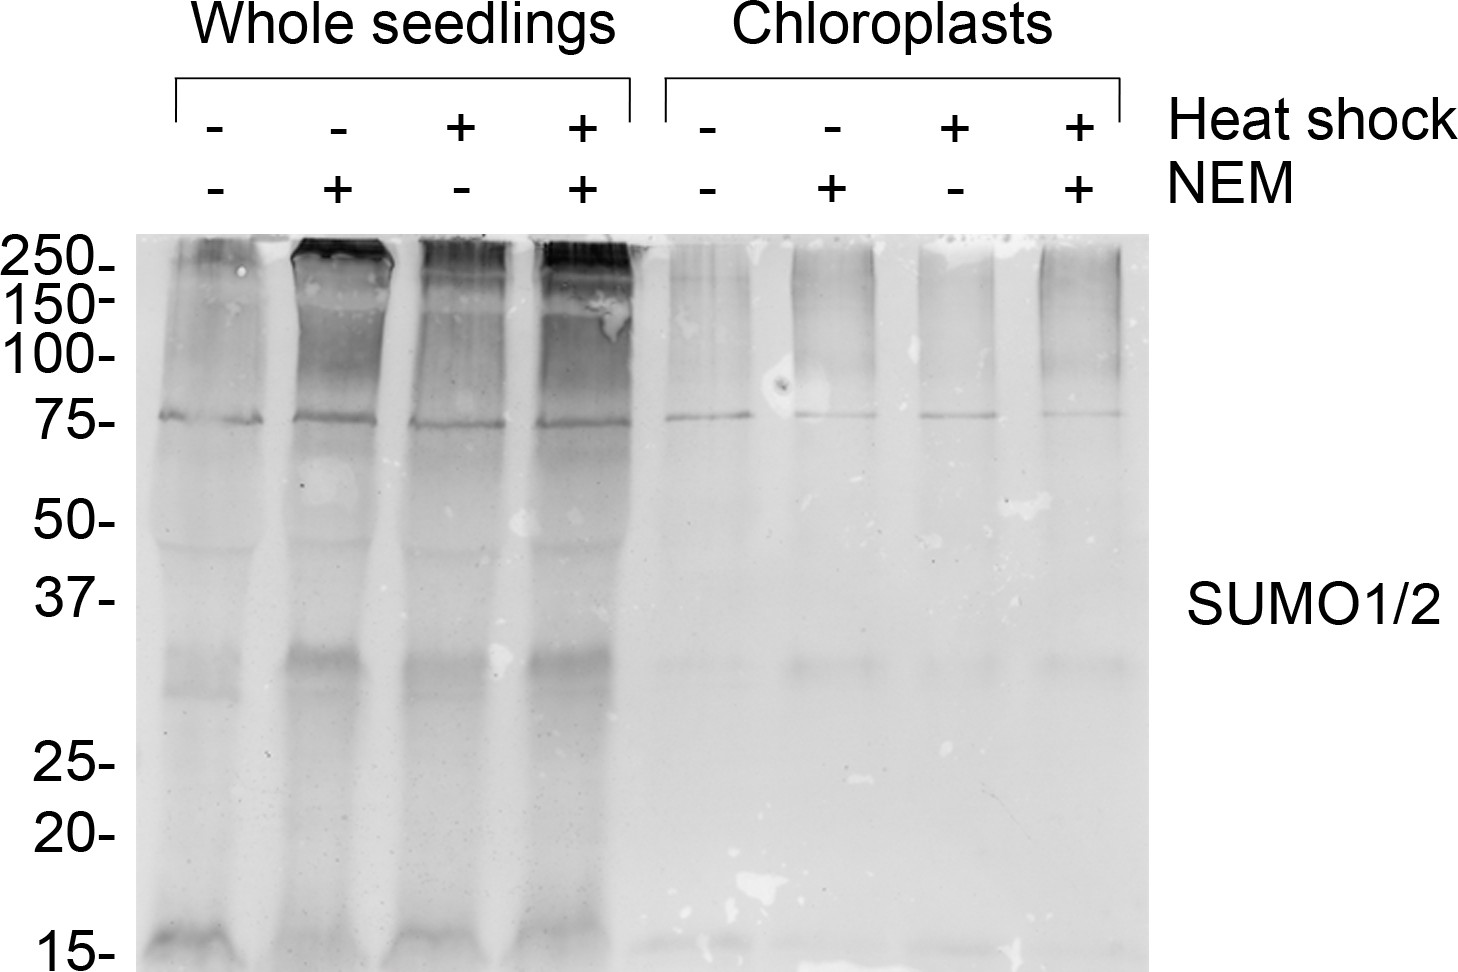
Chloroplast resident proteins are SUMOylated.
Anti-SUMO1 immunoblot of protein samples taken from whole seedlings (left-hand side) and isolated chloroplasts (right-hand side). Where indicated, seedlings were exposed to heat shock (42°C for 1 hr) and/or incubated with 10 mM N-ethylmaleimide (NEM) to aid the detection of SUMOylated proteins. The anti-SUMO1 antibody shows significant cross-reactivity with SUMO2. Migration positions of standards are displayed to the left of the gel images, and sizes are indicated in kDa.
Figure 5—figure supplement 2

Analysis of the expression of the YFP-tagged constructs used in the immunoprecipitation experiments by confocal microscopy.
The expression of the SCE1-YFP construct (A), and of the three YFP-SUMO constructs (B), was analyzed and confirmed by imaging transfected Arabidopsis protoplasts. Chlorophyll autofluorescence images were employed to orientate the YFP signals in relation to the chloroplasts. Representative confocal micrographs show a typical protoplast in each case. Scale bars = 10 µm.
Figure 5—figure supplement 3
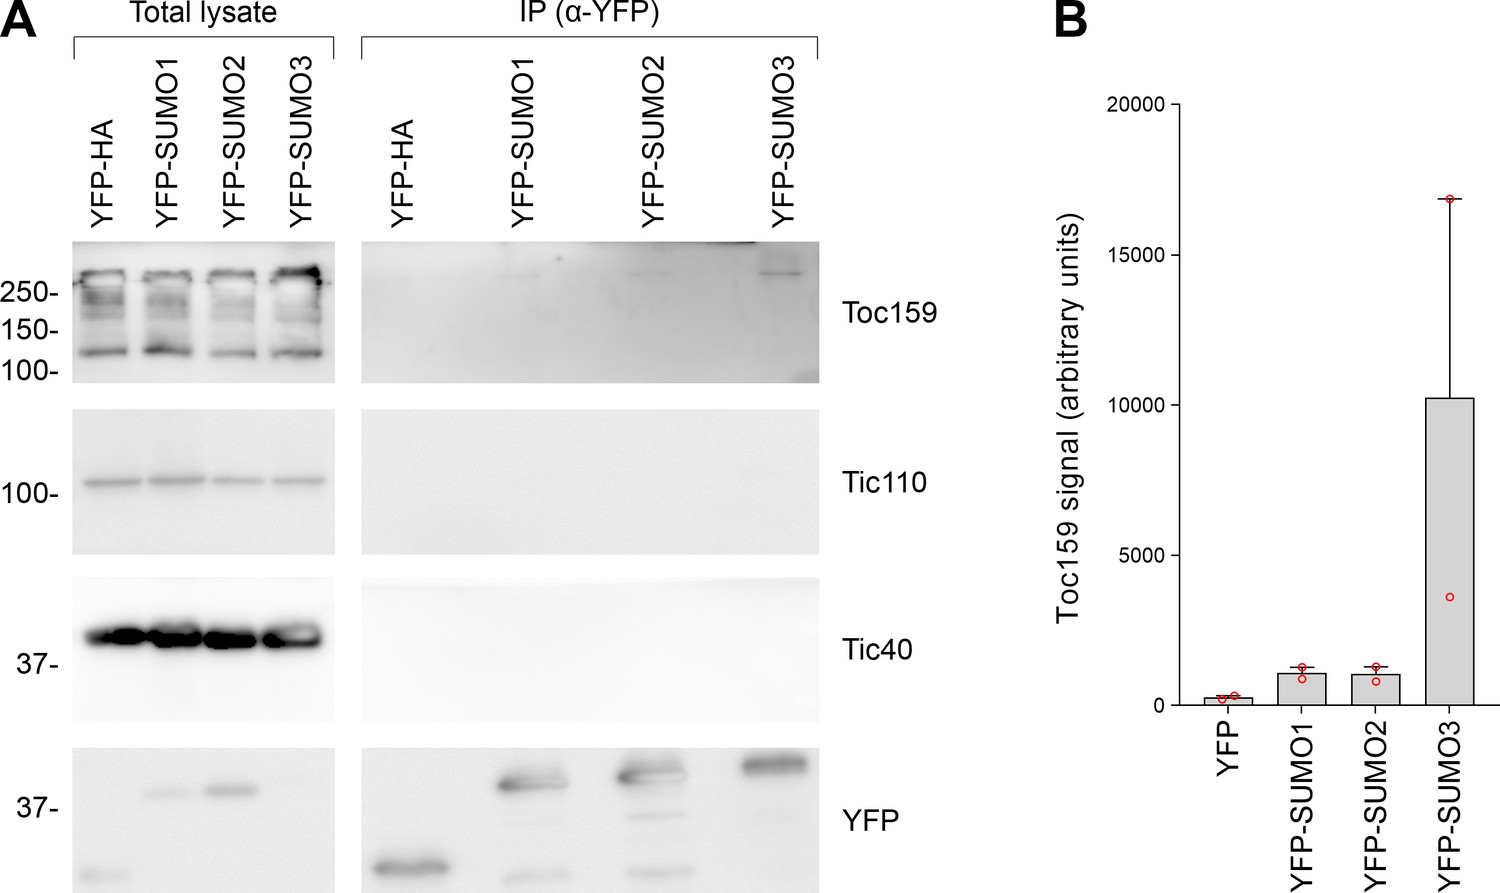
All three small ubiquitin-like modifier (SUMO) isoforms physically associated with native Toc159, with SUMO3 showing the strongest association.
(A) The immunoprecipitation experiment shown in Figure 5B was repeated. Tic110 was included as an additional negative control. The samples were run on a 10% acrylamide gel for 1 hr as opposed to an 8% acrylamide gel for 4 hr (as in Figure 5B). Migration positions of standards are displayed to the left of the gel images, and sizes are indicated in kDa. The unprocessed membrane images are displayed in Source data 1. (B) The Toc159 bands in the eluted fractions in the two experiments, in (A) and in Figure 5B, were quantified. Error bars indicate standard deviation from the mean, and open red circles indicate individual data points.
Figure 5—figure supplement 4
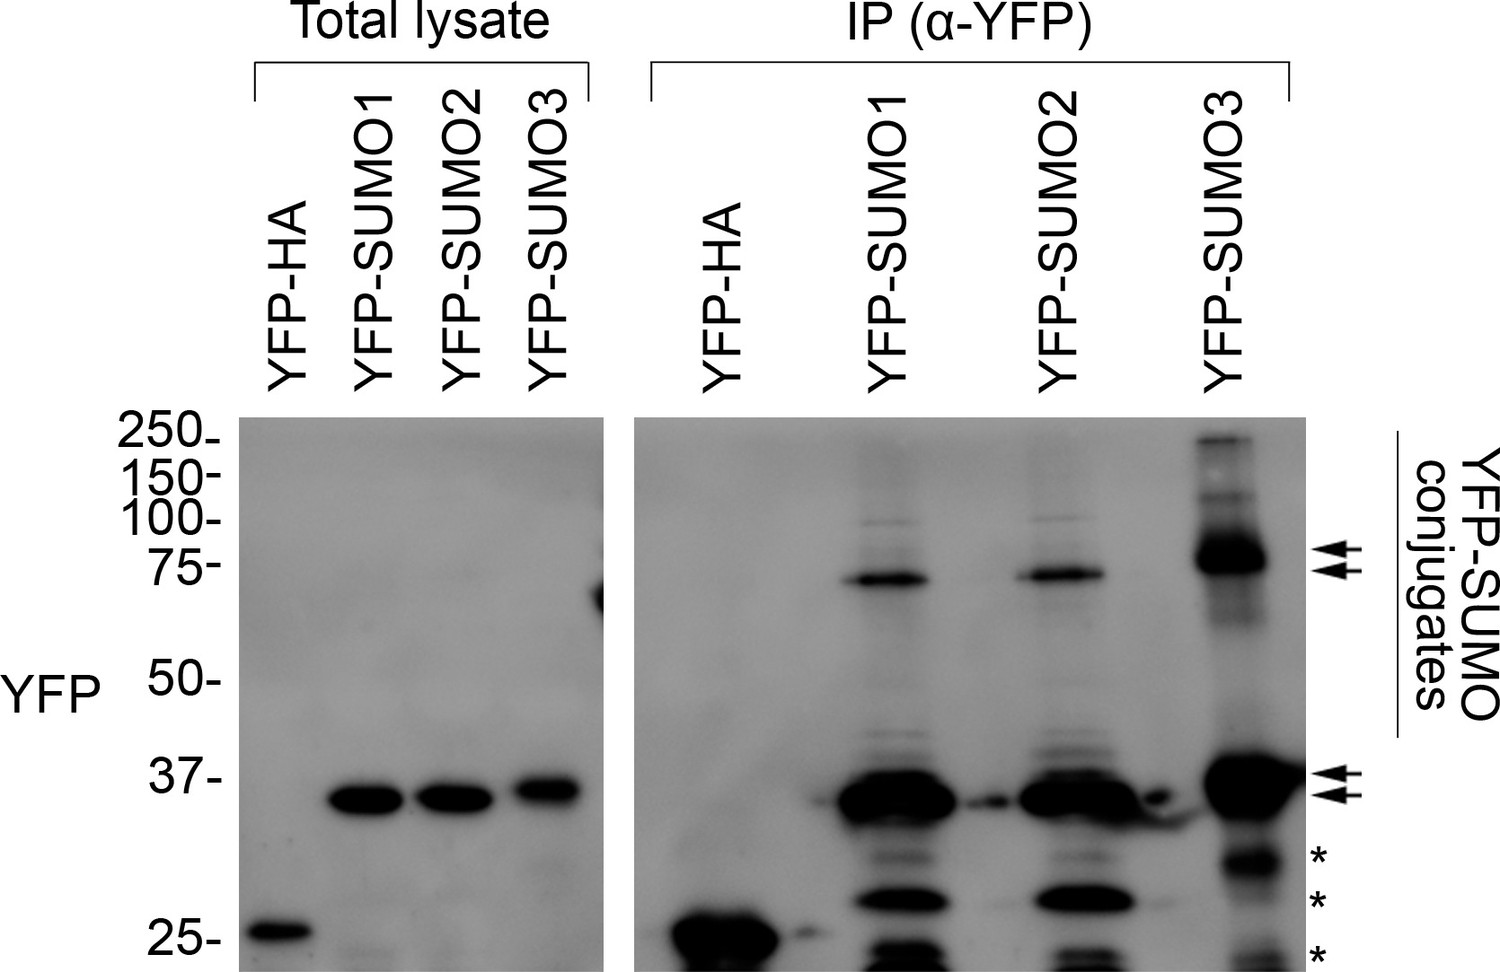
All three YFP-SUMO probes are conjugation-competent.
The membrane shown is the same as the one presented in Figure 5B (YFP panel). In this case, the membrane was visualized using a long exposure to aid the detection of weakly abundant protein bands. As well as the YFP-SUMO monomers, additional high molecular bands and smears were seen in the immunoprecipitation (IP) samples, indicating the capture of large numbers of SUMOylated proteins. This shows that all three YFP-SUMO probes could be successfully conjugated, as expected (Ayaydin and Dasso, 2004). The positions of the YFP-SUMO monomers (lower pair of arrows), and of the various SUMO adducts (vertical bar) potentially including di-SUMO (upper pair of arrows), are indicated. Note that YFP-SUMO3 migrated more slowly than the other two fusions, as expected. The asterisks indicate nonspecific bands. Migration positions of standards are displayed to the left of the gel images, and sizes are indicated in kDa.
Tables
Table 1
Bioinformatic analysis predicts that the core TOC proteins in Arabidopsis contain SUMOylation sites and small ubiquitin-like modifier (SUMO) interaction motifs.
The GPS-SUMO algorithm was applied to the amino acid sequences of Toc159, Toc132, Toc120, Toc90, Toc75, Toc33, and Toc34 using the ‘high stringency’ setting, and the results generated are shown in columns 2–4. ‘Consensus’ sites fall within canonical SUMO site motifs: ψ-K-X-E (where ψ indicates a hydrophobic amino acid, and X indicates any amino acid residue). ‘Non-consensus’ sites do not fall within canonical SUMO site motifs; analysis shows that ~40% of SUMOylation may occur at non-consensus sites (Zhao et al., 2014). ‘SUMO interaction’ sites are predicted to mediate the non-covalent interaction between proteins and SUMO peptides. The JASSA algorithm was also applied to the amino acid sequences using the ‘high cutoff’ setting (see column 5). aa denotes amino acids.
| Protein name (identifier and length) | Position (aa) | p-Value | Type | Also predicted by JASSA (high stringency)? |
|---|---|---|---|---|
| atToc159 | 95 | 0.021 | Consensus | No |
| (At4g02510) | 106 | 0.034 | Consensus | Yes |
| 1503 aa | 126 | 0.032 | Consensus | Yes |
| 144 | 0.02 | Consensus | Yes | |
| 151 | 0.02 | Consensus | No | |
| 246–250 | 0.005 | SUMO interaction | Yes | |
| 408–412 | 0.009 | SUMO interaction | Yes | |
| 486–490 | 0.009 | SUMO interaction | Yes | |
| 498 | 0.022 | Consensus | No | |
| 502 | 0.049 | Non-consensus | No | |
| 539 | 0.026 | Consensus | No | |
| 1,300 | 0.049 | Non-consensus | No | |
| 1,370 | 0.01 | Consensus | Yes | |
| atToc132 | 30 | 0.006 | Consensus | Yes |
| (At2g16640) | 66 | 0.036 | Consensus | Yes |
| 1206 aa | 352 | 0.002 | Consensus | No |
| 895 | 0.005 | Consensus | No | |
| 1077 | 0.014 | Consensus | No | |
| atToc120 | 52 | 0.008 | Consensus | No |
| (At3g16620) | 57 | 0.031 | Consensus | No |
| 1084 aa | 209 | 0.05 | Non-consensus | No |
| 777 | 0.006 | Consensus | No | |
| 959 | 0.013 | Consensus | No | |
| atToc90 | 191 | 0.027 | Consensus | Yes |
| (At5g20300) | 481 | 0.017 | Consensus | No |
| 793 aa | 711 | 0.02 | Consensus | No |
| 786 | 0.042 | Non-consensus | Yes | |
| atToc75 | 434 | 0.049 | Non-consensus | No |
| (At3g46740) | 513 | 0.029 | Consensus | No |
| 818 aa | ||||
| atToc33 | 291 | 0.044 | Non-consensus | No |
| (At1g02280) | ||||
| 297 aa | ||||
| atToc34 | 290 | 0.026 | Consensus | No |
| (At5g05000)313 aa | 298 | 0.043 | Non-consensus | Yes |
Key resources table
| Reagent type (species) or resource | Designation | Source or reference | Identifiers | Additional information |
|---|---|---|---|---|
| Genetic reagent (Arabidopsis thaliana) | Col-0 | NASC | NASC (RRID:SCR_004576) | |
| Genetic reagent (Arabidopsis thaliana) | ppi1-1 (Col-0) | NASC | NASC_ID:N2107726 | |
| Genetic reagent (Arabidopsis thaliana) | sce1-4 (Col-0) | NASC | NASC_ID:N506164 | |
| Genetic reagent (Arabidopsis thaliana) | siz1-2 (Col-0) | NASC | NASC_ID:N6559 | |
| Genetic reagent (Arabidopsis thaliana) | siz1-3 (Col-0) | NASC | NASC_ID:N6560 | |
| Genetic reagent (Arabidopsis thaliana) | siz1-4 (Col-0) | NASC | NASC_ID:N862769 | |
| Genetic reagent (Arabidopsis thaliana) | siz1-5 (Col-0) | NASC | NASC_ID:N611280 | |
| Genetic reagent (Arabidopsis thaliana) | sum1-1 (Col-0) | NASC | NASC_ID:N872916 | |
| Genetic reagent (Arabidopsis thaliana) | sum2-1 (Col-0) | NASC | NASC_ID:N629775 | |
| Genetic reagent (Arabidopsis thaliana) | sum3-1 (Col-0) | NASC | NASC_ID:N623673 | |
| Genetic reagent (Arabidopsis thaliana) | ppi1 SUMO1 OX #1Col-0 | This study | ||
| Genetic reagent (Arabidopsis thaliana) | ppi1 SUMO1 OX #2Col-0 | This study | ||
| Genetic reagent (Arabidopsis thaliana) | ppi1 SUMO3 OX #1Col-0 | This study | ||
| Antibody | Anti-SUMO1(rabbit polyclonal) | Abcam | Ab5316 | WB (1:1000) |
| Antibody | Anti-Toc75-III(rabbit polyclonal) | doi:10.1111/j.1365–313 X.2011.04551.x | Custom-made | WB (1:500) |
| Antibody | Anti-Toc159(rabbit polyclonal) | doi:10.1038/35003214 | Custom-made | WB (1:2500) |
| Antibody | Anti-Toc132(rabbit polyclonal) | doi:10.1126/science.1225053 | Custom-made | WB (1:1000) |
| Antibody | Anti-Toc33(rabbit polyclonal) | doi:10.1111/j.1365–313 X.2011.04551.x | Custom-made | WB (1:1000) |
| Antibody | Anti-Tic110(rabbit polyclonal) | doi:10.1111/j.1365–313 X.2010.04242.x | Custom-made | WB (1:1000) |
| Antibody | Anti-Tic40(rabbit polyclonal) | doi:10.1111/j.1365–313 X.2011.04551.x | Custom-made | WB (1:10,000) |
| Antibody | Anti-GFP(rabbit polyclonal) | Sigma | SAB4301138 | WB (1:1000) |
| Antibody | Goat anti-rabbit IgG HRP(goat polyclonal) | Sigma | 12-348 | WB (1:10,000) |
| Antibody | Goat anti-rabbit IgG alkaline phosphatase(goat polyclonal) | Sigma | A3687 | WB (1:10,000) |
| Recombinant DNA reagent | pSAT4(A)-nEYFP-N1 | doi:10.1007/s11103-005-0340-5doi:10.1016/j.jmb.2006.08.017 | Kind gift from the Gelvin lab (Purdue University) | |
| Recombinant DNA reagent | pSAT4-cEYFP-C1-B | doi:10.1007/s11103-005-0340-5doi:10.1016/j.jmb.2006.08.017 | Kind gift from the Gelvin lab (Purdue University) | |
| Recombinant DNA reagent | pSAT4(A)-cEYFP-N1 | doi:10.1007/s11103-005-0340-5doi:10.1016/j.jmb.2006.08.017 | Kind gift from the Gelvin lab (Purdue University) | |
| Recombinant DNA reagent | pDONR201 | Invitrogen | RRID:Addgene#2392 | |
| Recombinant DNA reagent | pDONR207 | Invitrogen | RRID:Addgene#2393 | |
| Recombinant DNA reagent | pH2GW7 | doi:10.1016/s1360-1385 (02)02251–3doi:10.1016/j.tplants.2005.01.008 | VIB-UGent Center for Plant Systems Biology | |
| Recombinant DNA reagent | p2GWY7 | doi:10.1016/s1360-1385 (02)02251–3doi: 10.1016/j.tplants.2005.01.008 | VIB-UGent Center for Plant Systems Biology | |
| Recombinant DNA reagent | p2YGW7 | doi:10.1016/s1360-1385 (02)02251–3doi:10.1016/j.tplants.2005.01.008 | VIB-UGent Center for Plant Systems Biology | |
| Chemical compound, drug | N-ethylmaleimide | Merck | E3876 | |
| Software, algorithm | GPS-SUMO | http://sumosp.biocuckoo.org/online.php | ||
| Software, algorithm | JASSA | http://www.jassa.fr/index.php |
Table 2
Primers used during the course of this study.
| (A)Primers used in restriction cloning procedures | ||
|---|---|---|
| Primer name | Sequence | Used to generate … |
| SCE1 F(HindIII) | AAAAGCTTATGGCTAGTGGAATCGCTC | pSAT4(A)-nEYFP-N1 SCE1 |
| SCE1 R(EcoRI) | AAGAATTCGACAAGAGCAGGATACTGCTTG | pSAT4(A)-nEYFP-N1 SCE1 |
| Toc159-5 F (EcoRI) | AAGAATTCAATGGACTCAAAGTCGGTT | pSAT4-cEYFP-C1-B Toc159 |
| Toc132-5 F (XhoI) | AACTCGAGCTATG GGAGATGGGACTGAG | pSAT4-cEYFP-C1-B Toc159 |
| Toc132-3 R (SmaI) | AACCCGGGTCATTGTCCATATTGCGT | pSAT4-cEYFP-C1-B Toc132 |
| Toc33-5 F (HindIII) | AGAAGCTTCGATGGGGTCTCTCGTTCGT | pSAT4-cEYFP-C1-B Toc132 |
| Toc33-3 R (XbaI) | AATCTAGATTAAAGTGGCTTTCCACT | pSAT4-cEYFP-C1-B Toc33 |
| Toc34-5 F (HindIII) | AGAAGCTTCGATGGCAGCTTTGCAAACG | pSAT4-cEYFP-C1-B Toc34 |
| Toc34-3 R (XbaI) | AATCTAGATCAAGACCTTCGACTTGC | pSAT4-cEYFP-C1-B Toc34 |
| OEP7 F (XhoI) | CTCGAGATGGGAAAAACTTCGGGA | pSAT4(A)-cEYFP-N1 ΔOEP7 |
| OEP7-35 R (KpnI) | GGTACCGGAATTTATCGAGGAAAGG | pSAT4(A)-cEYFP-N1 ΔOEP7 |
| (B)Primers used in Gateway cloning procedures | ||
| SCE1 Gateway F | GGGGACAAGTTTGTACAAAAAAGCAGGCTCCATGGCTAGTGGAATCGCTC | p2GWY7 SCE1 |
| SCE1 Gateway R | GGGGACCACTTTGTACAAGAAAGCTGGGTTGACAAGAGCAGGATACTGC | p2GWY7 SCE1 |
| SUMO1 Gateway F | GGGGACAAGTTTGTACAAAAAAGCAGGCTCCTCTGCAAACCAGGAGGAAGACAAG | p2YGW7 SUMO1 |
| SUMO1 Gateway R | GGGGACCACTTTGTACAAGAAAGCTGGGTTTCAGGCCGTAGCACCACC | p2YGWYSUMO1 |
| SUMO2 Gateway F | GGGGACAAGTTTGTACAAAAAAGCAGGCTCCTCTGCTACTCCGGAAGAAGAC | p2YGW7 SUMO2 |
| SUMO2 Gateway R | GGGGACCACTTTGTACAAGAAAGCTGGGTTCTAAAAGCAGAAGAGCTTCAGGCC | p2YGW7 SUMO2 |
| SUMO3 Gateway F | GSGGGACAAGTTTGTACAAAAAAGCAGGCTCCTCTAACCCTCAAGATGACAAGCCC | p2YGW7SUMO3 |
| SUMO3 Gateway R | GGGGACCACTTTGTACAAGAAAGCTGGGTTTTAAAGCCCATTATGATCGAAAAGC | p2YGW7SUMO3 |
| (C)Primers used in RT-PCR experiments | ||
| SUMO1 F(2) | AAAAAGCAGGCTCCACAAAAGCCACGGCCAATTAG | SUMO1 |
| SUMO1 R(2) | AGAAAGCTGGGTTCCATTCATATCACACACAAGCCC | SUMO1 |
| SUMO3 F | ACAGACTGGAGTTTTTGTTTC | SUMO3 |
| SUMO3 R | CTCATGAGTCATTTACACACACG | SUMO3 |
| eIF4E1 F | AAGATTTGAGAGGTTTCAAGCGGTGTAAG | eIF4E1 |
| eIF4E1 R | AAACAATGGCGGTAGAAGACACTC | eIF4E1 |
| Siz1-HindIII-F | AAAAGCTTATGGATTTGGAAGCTAATTGTAAG | SIZ1 (for siz1-4) |
| Siz1-seq-1R | TCTGCATTGTGCTTGCAC | SIZ1 (for siz1-4) |
| Siz1-F | GGATTATCTTCCAGTAATAGGCAAG | SIZ1 (for siz1-5) |
| Siz1-R | CCCGACTGAGCTGAAGCATC | SIZ1 (for siz1-5) |
| (D)Primers used to genotype mutants | ||
| Primer name | Sequence | Used to genotype… |
| SUMO1 F(2) | AAAAAGCAGGCTCCACAAAAGCCACGGCCAATTAG | sum1-1 |
| SUMO1 R(2) | AGAAAGCTGGGTTCCATTCATATCACACACAAGCCC | sum1-1 |
| SUMO2 F | CGTTGTTGGTACTTGGTTGG | sum2-1 |
| SUMO2 R | CAAAACTCTAAACTGGTCGG | sum2-1 |
| SUMO3 F | ACAGACTGGAGTTTTTGTTTC | sum3-1 |
| SUMO3 R | CTCATGAGTCATTTACACACACG | sum3-1 |
| SCE1 F | CGCCGCGAAATCTGGACC | sce1-4 |
| SCE1 R | TTCCTCTCTTCAGCTAAACG | sce1-4 |
| SIZ1 F(2) | GCAAACAGGGAAAGAAGCAGG | siz1-4 |
| SIZ1 R(2) | CATTGAGTCTGTTTCTAGCG | siz1-4 |
| LBb1 | GCGTGGACCGCTTGCTGCAACT | SALK lines (left border) |
| LB1 | GCCTTTTCAGAAATGGATAAATAGCCTTGCTTCC | SAIL lines (left border) |
| (E)Primers used to map thesiz1-4andsiz1-5T-DNA insertions | ||
| Primer name | Sequence | Used to map … |
| Siz1-Seq-1R | TCTGCATTGTGCTTGCAC | siz1-4 T-DNA insertion |
| Siz1-Seq-3R | TGACAACCACTGTATGCAGG | siz1-5 T-DNA insertion |
-
Underlining indicates restriction sites (A and C), or attB1 and attB2 recombination sequences (B).
Additional files
-
Transparent reporting form
- https://cdn.elifesciences.org/articles/60960/elife-60960-transrepform1-v2.docx
-
Source data 1
Immunoblot source data.
Uncropped immunoblot images for Figures 1 and 5, and their supplements.
- https://cdn.elifesciences.org/articles/60960/elife-60960-supp1-v2.pdf
-
Source data 2
Numerical source data.
Raw numerical data used to plot all graphs in the paper.
- https://cdn.elifesciences.org/articles/60960/elife-60960-supp2-v2.xlsx
Download links
A two-part list of links to download the article, or parts of the article, in various formats.
Downloads (link to download the article as PDF)
Open citations (links to open the citations from this article in various online reference manager services)
Cite this article (links to download the citations from this article in formats compatible with various reference manager tools)
Crosstalk between the chloroplast protein import and SUMO systems revealed through genetic and molecular investigation in Arabidopsis
eLife 10:e60960.
https://doi.org/10.7554/eLife.60960


