HAT cofactor TRRAP modulates microtubule dynamics via SP1 signaling to prevent neurodegeneration
- Leibniz Institute on Aging – Fritz Lipmann Institute (FLI), Germany
- Faculty of Biological Sciences, Friedrich-Schiller-University of Jena, Germany
Figures
Figure 1 with 1 supplement
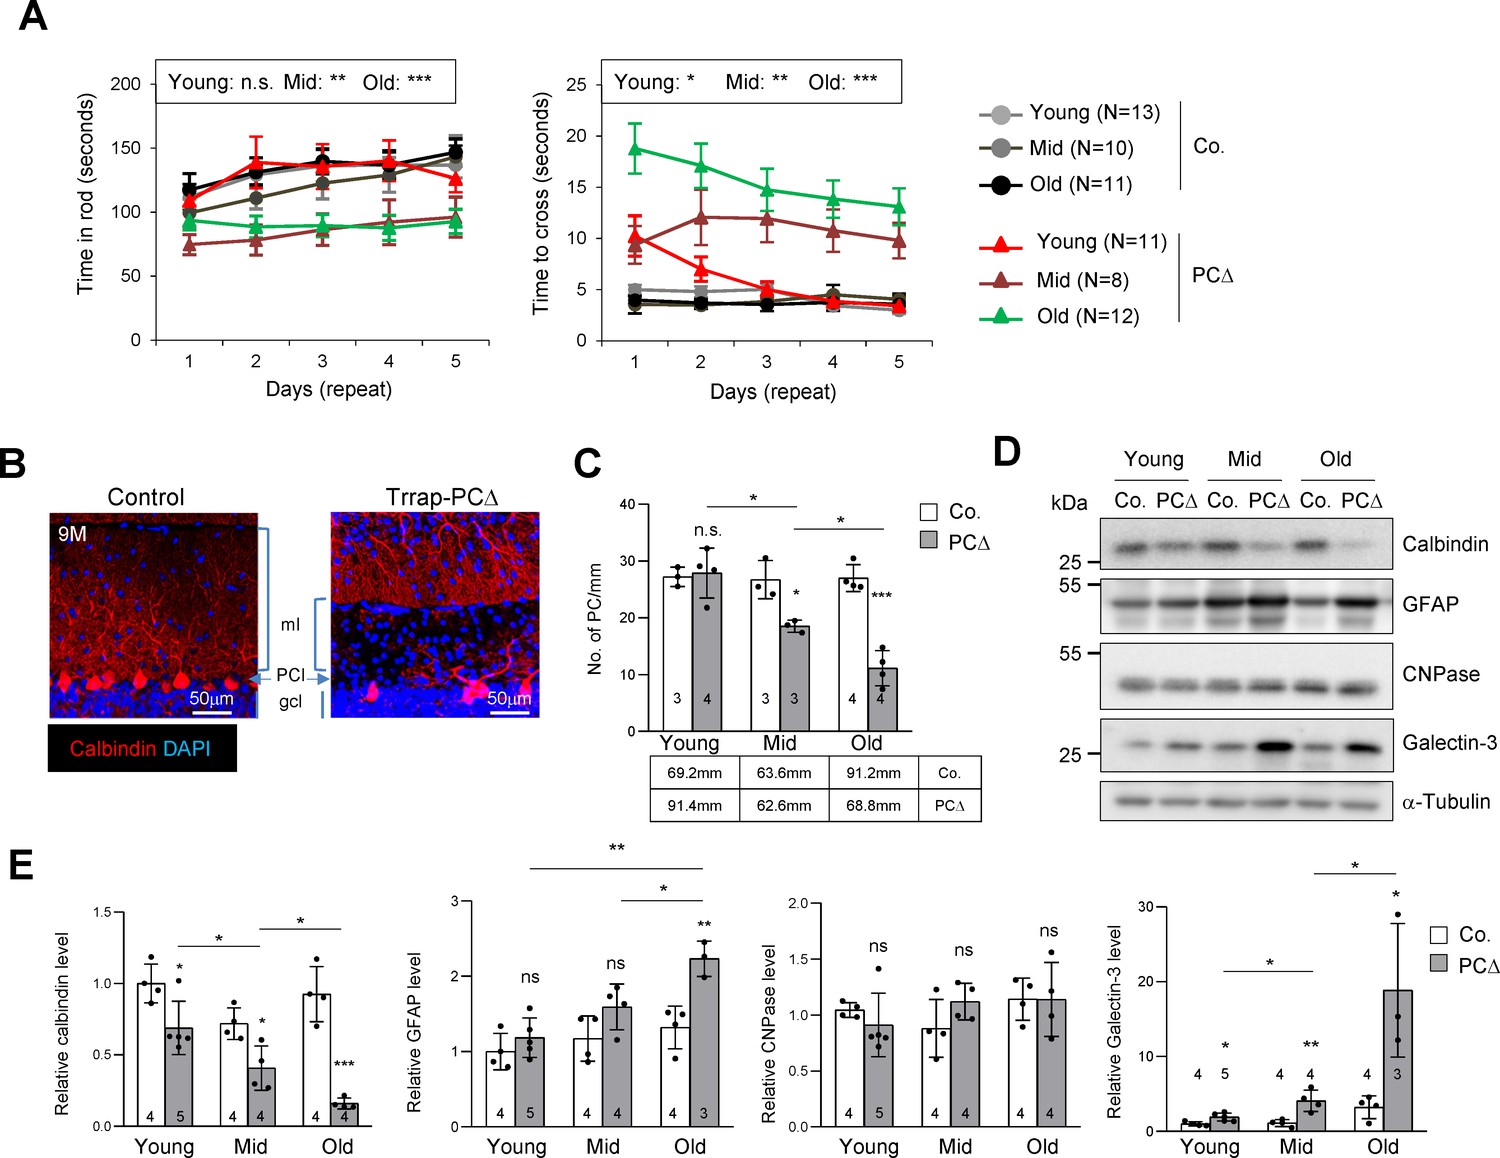
Deletion of Trrap in Purkinje cells causes neurodegeneration.
(A) The rotarod test and the beam balance were used to assess the motor coordination of control and Trrap-PCΔ mice. The left panel depicts the time that the mice stayed in the rod before falling off. The right panel shows the quantification of the time taken by mice to cross the beam. (N) Indicates the number of mice analyzed. Young: 1–2 months; mid age: 3–6 months; old: 9–12 months. (B) Immunostaining of the cerebellar sections of 9-month-old mice using an antibody against calbindin (red, Purkinje cells). ml: molecular layer; gcl: granule cell layer; PCl: Purkinje Cell layer. (C) The quantification of the number of Purkinje cells in the cerebellum at the indicated ages. The mm of the Purkinje cell layer analyzed are indicated in the table. Young: 1–2 months; mid age: 3–6 months; old: 9–12 months. (D) The representative of the western blot analysis for markers for Purkinje cells (calbindin), astrocytes (GFAP), oligodendrocytes (CNPase), and activated microglia (Galectin-3). (E) The quantification of western blots of the cerebellum (from D). Signal intensities are normalized to α-Tubulin. The numbers inside the bars indicate the number of mice analyzed. Young: 1 month; mid age: 4 months; old: 9 months. Co.: control; PCΔ: Trrap-PCΔ. Mean ± standard error of the mean is shown. Two-way ANOVA and Holm–Sidak test was performed for statistical analysis in (A), (B) and Student's t-test or one-way ANOVA for (C), (E). n.s.: not significant. *p≤0.05, **p≤0.01, ***p≤0.001.
Figure 1—figure supplement 1
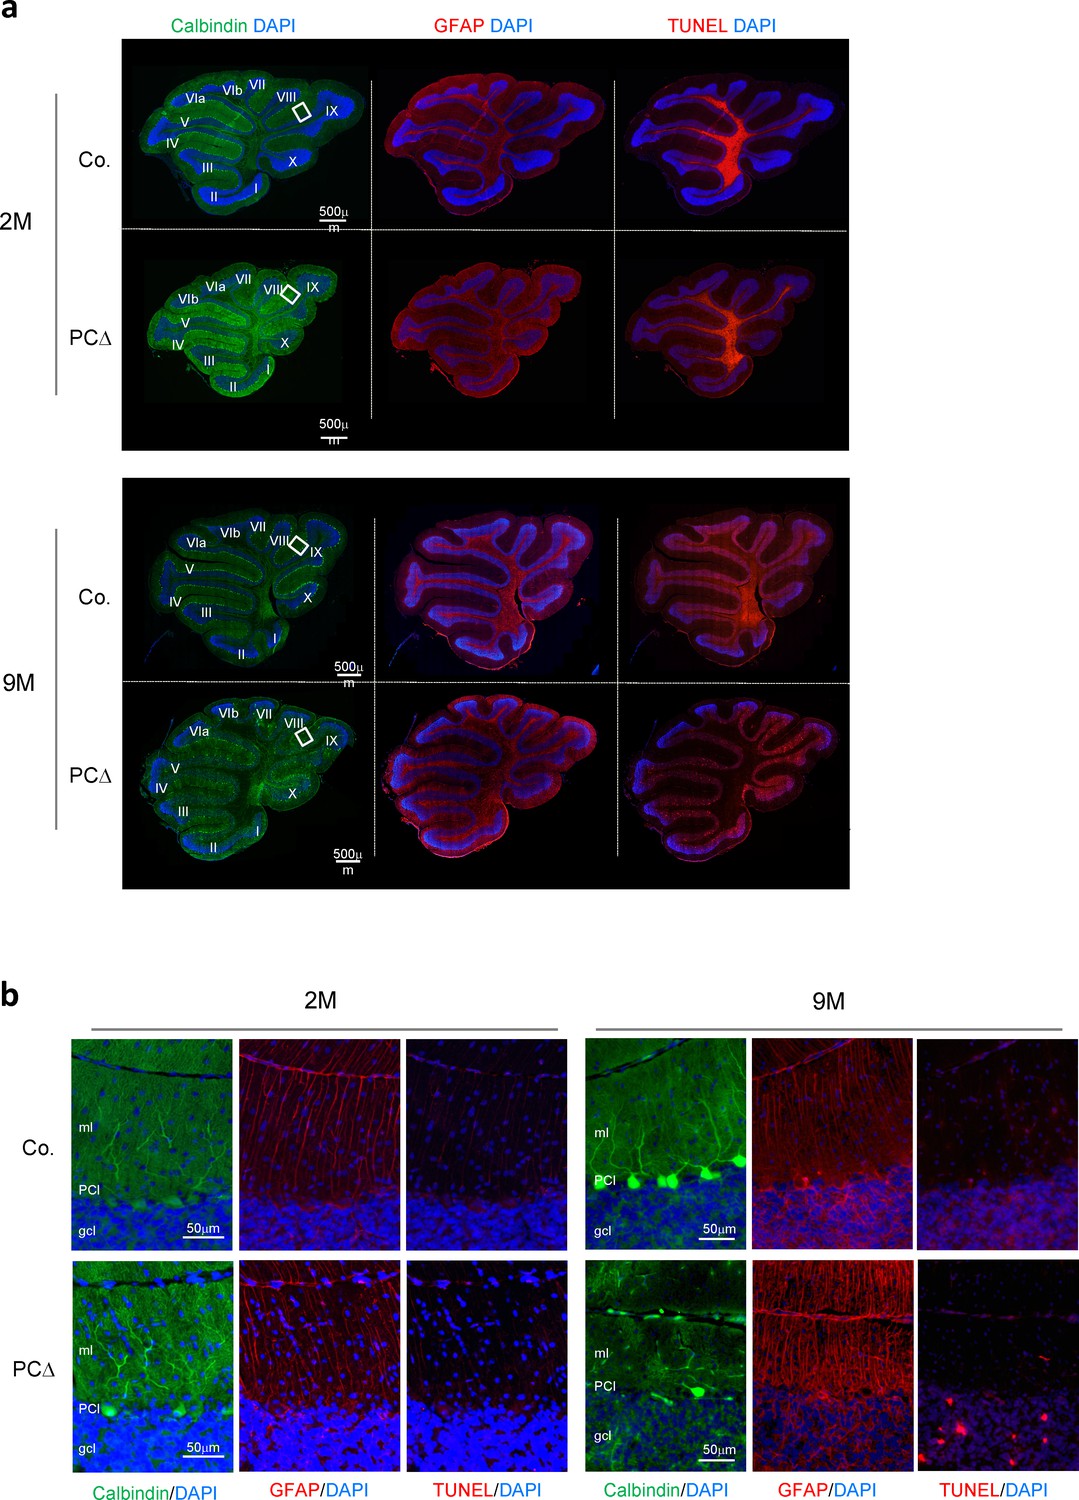
Deletion of Trrap in Purkinje cells causes neurodegeneration.
(a) Immunostaining of sagittal sections using TUNEL reaction (red, cell death) and antibodies against calbindin (green, Purkinje Cells) and GFAP (red, astrocytes), and counterstained with DAPI. A representative image from 9-month-old mice shows a marked reduction in Purkinje cell numbers (green) in Trrap-PCΔ samples accompanied by reactive astrogliosis (red) in all layers of the cerebellar lobes and an increase in cell death in all cerebellar areas. The cerebellar lobes are numbered I–X. (b) High magnification of the areas highlighted in (a). Note a thinner molecular layer of 9-month-old cerebella (see quantification in Figure 2G). PCl: Purkinje cell layer, ml: molecular layer, gcl: granule cell layer. Co.: control; PCΔ: Trrap-PCΔ.
Figure 2 with 1 supplement
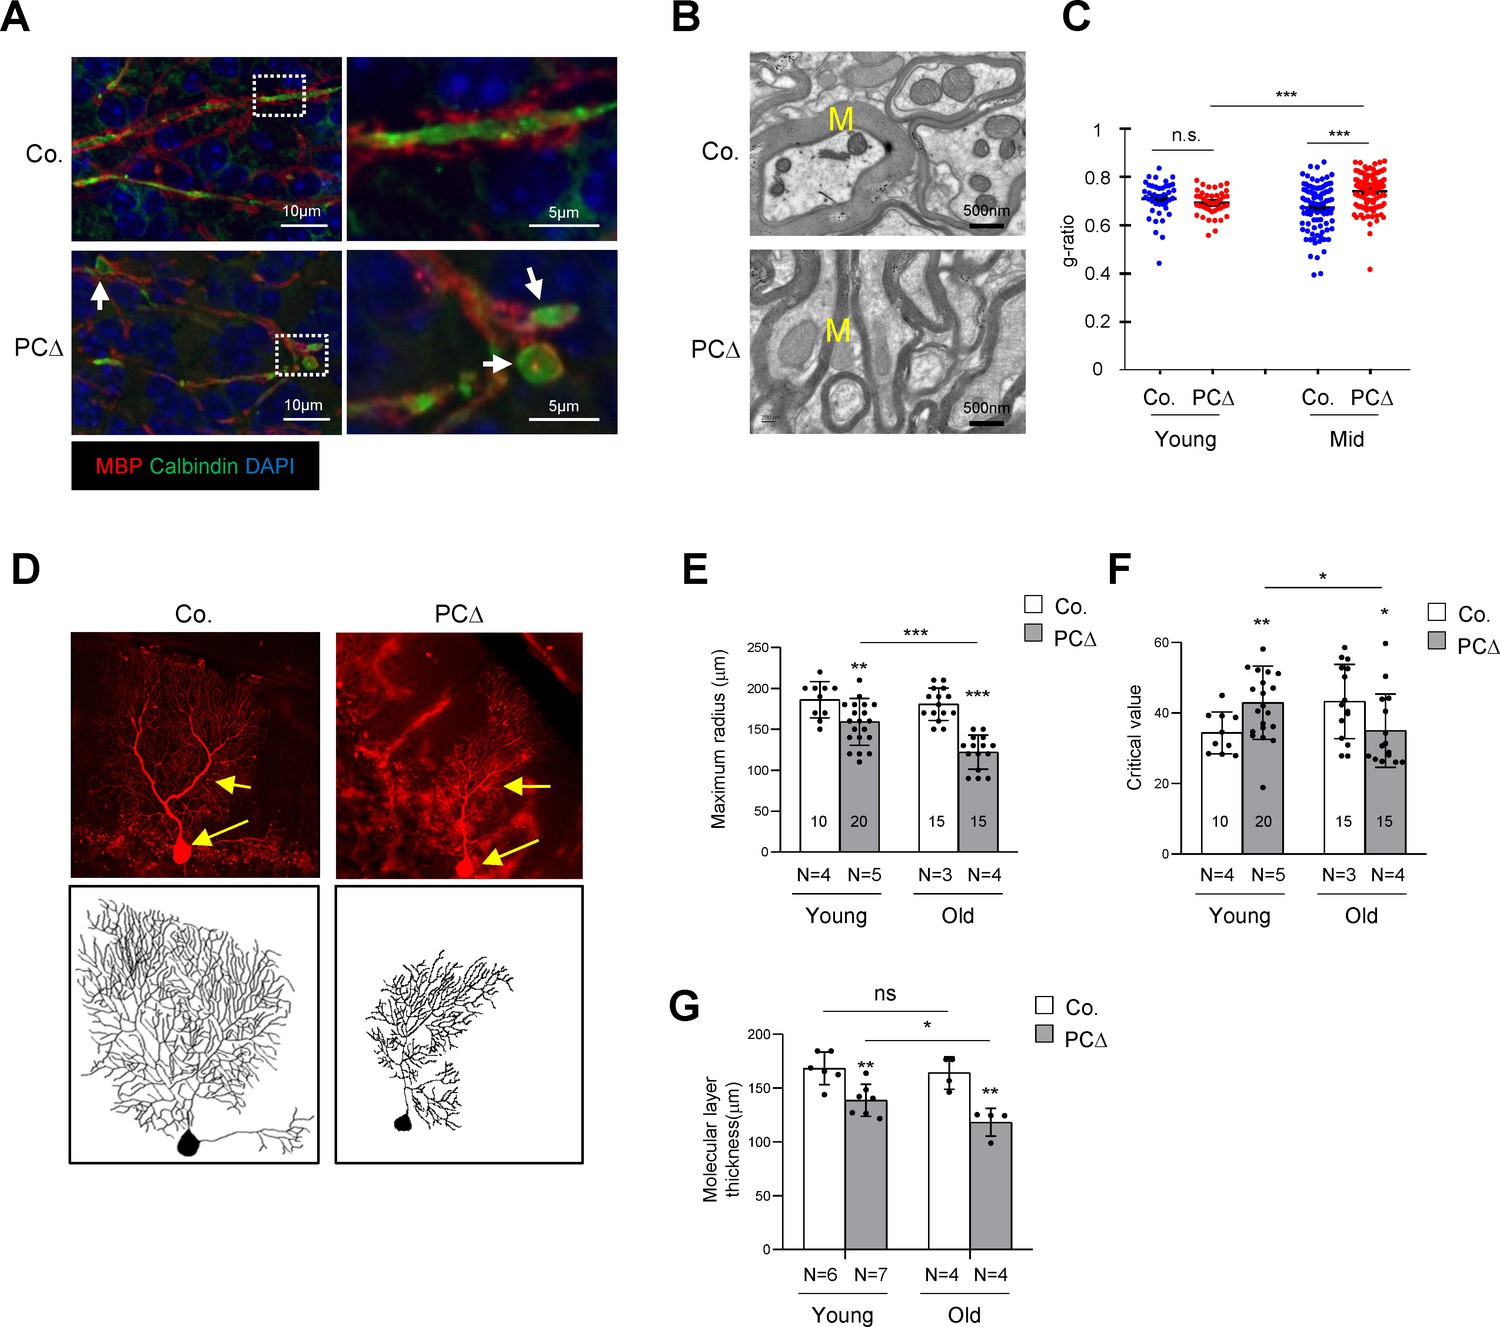
Deletion of Trrap in Purkinje cells leads to defects in their axons and dendrites.
(A) Cerebellar sections from 1-month-old mice were stained with antibodies against Calbindin (green, Purkinje cells) and myelin-binding protein (MBP, red, Myelin sheets) and counterstained with DAPI. White arrows indicate axonal swellings. (B) Representative images of electromicrographs showing axon myelination in the cerebellar white matter of 6-month-old control and Trrap-PCΔ mice. M: Myelin sheet. (C) The quantification of the myelination index at the indicated ages by g-ratio, which is measured by ImageJ as ag-factor (the square-root of the area of the inner surface of an axon divided by the area of the outer surface including the myelin). Thus, a high g-ratio indicates a low myelination index. (D) Single Purkinje cells were analyzed by tracing the expression of the Confetti transgene (RFP). Representative Purkinje cell images of maximum intensity projection (MIP) from Z-stacks (upper panel) of 10-month-old mice are shown after reconstruction (lower panel) based on RFP expression in Trrap-PCΔ mice. (E) The quantification of the maximum radius after Sholl analysis, at the indicated ages, demonstrating that Purkinje cells retract their dendrites in Trrap-PCΔ mice. Young: 1–4 months; old: 10 months. (F) The graph shows the critical value measured by the Sholl analysis, at the indicated ages, indicative of the complexity of Purkinje cells. (G) The quantification of the molecular layer thickness of all cerebellar lobes. Young: 1–4 months; old: 10 months. Co.: control; PCΔ:Trrap-PCΔ. N: the number of mice analyzed. The numbers inside the bars indicate the number of cells analyzed. Mean ± standard error of the mean is shown. Student's t-test or one-way ANOVA was performed for statistical analysis. n.s.: not significant. *p≤0.05, **p≤0.01, ***p≤0.001.
Figure 2—figure supplement 1
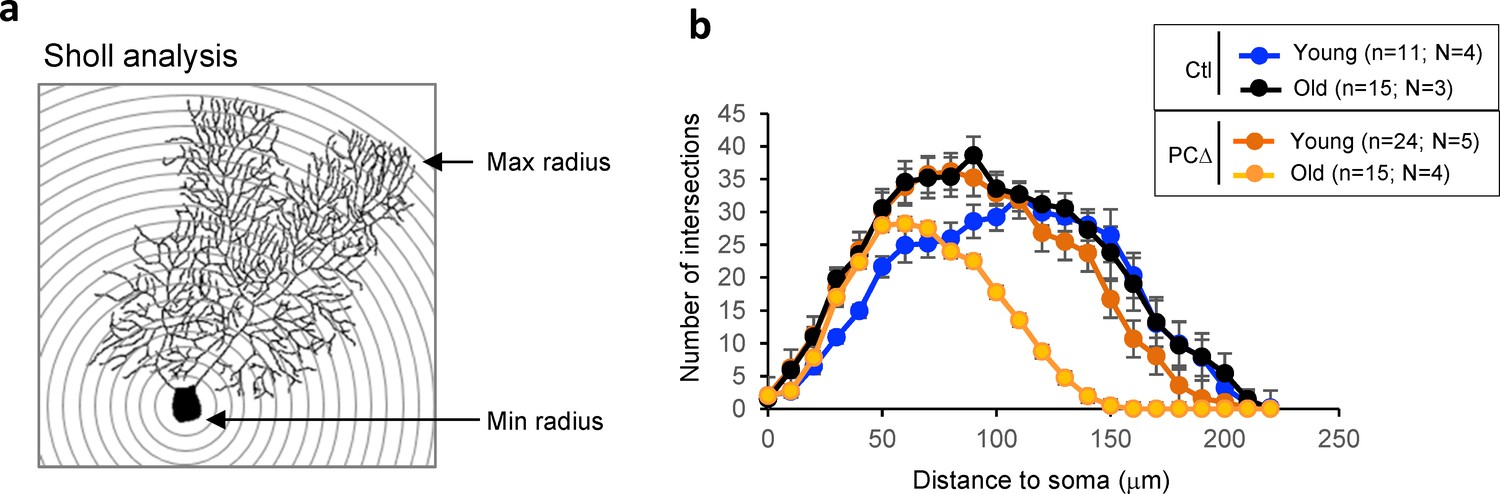
Sholl analysis of degeneration of Purkinje cells of Trrap-PCΔ mice.
(a) Scheme of Sholl analysis. Concentric circles are drawn around a given Purkinje cell and the number of times the cell crosses the circles is scored. (b) The graph shows the results of the Sholl analysis indicating that Purkinje cells at indicated age (old, 10 months; young, 1–4 months) retract their dendrites in Trrap-PCΔ mice. N: number of mice; n: cells.
Figure 3 with 2 supplements
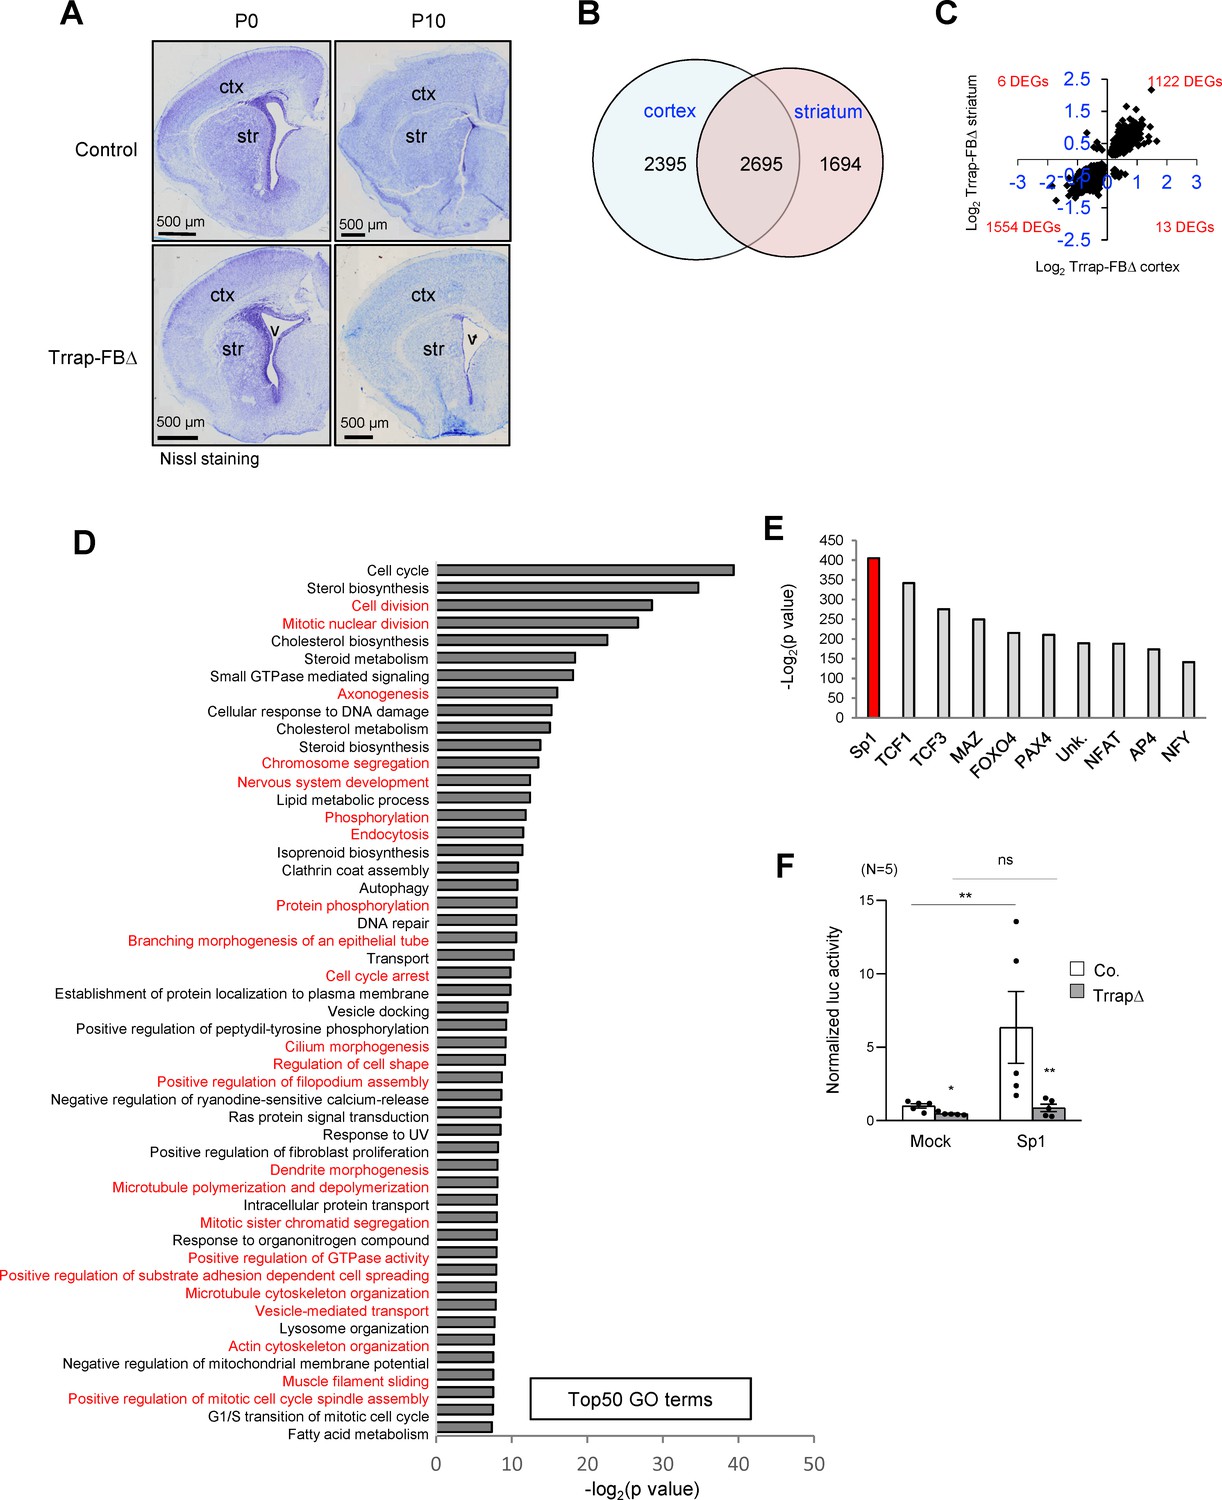
Deletion of Trrap in pyramid neurons of the forebrain results in a progress degeneration of the cortex and striatum.
(A) Nissl staining of the coronal session of Trrap-FBΔ brain at postnatal day 0 (P0) and 10 (P10). Ctx: cortex; str: striatum; v: ventricle. (B) The Venn diagram depicts the overlap between the differentially expressed genes (DEGs) measured by RNA-seq in the cortex and striatum. The numbers refer to the DEGs in the indicated data sets. (C) Log2 of the fold changes of the 2695 common DEGs in Trrap-FBΔ cortex and striatum. (D) Top50 GO terms of the 2695 overlapping hits identified in the RNA-seq data set of the cortex and striatum. Note that microtubule dynamics related processes are highlighted in red. (E) Transcription factor binding site (TFBS) enrichment analysis of the 1261 common DEGs in aNSCs, the cortex, and the striatum identified by RNA-seq. (F) Luciferase assays using a Sp1-responsive construct. The graph shows the luciferase activity normalized by Bradford assay. N: the number of cell lines analyzed; Mock: empty vector, Sp1: overexpression; luc: luciferase. Co.: control; aNSCsΔ: Trrap-aNSCsΔ. n: the number of cell lines analyzed. Mean ± standard error of the mean is shown. Unpaired t-test was performed for statistical analysis. n.s.: not significant; *p≤0.05, **p≤0.01.
Figure 3—figure supplement 1
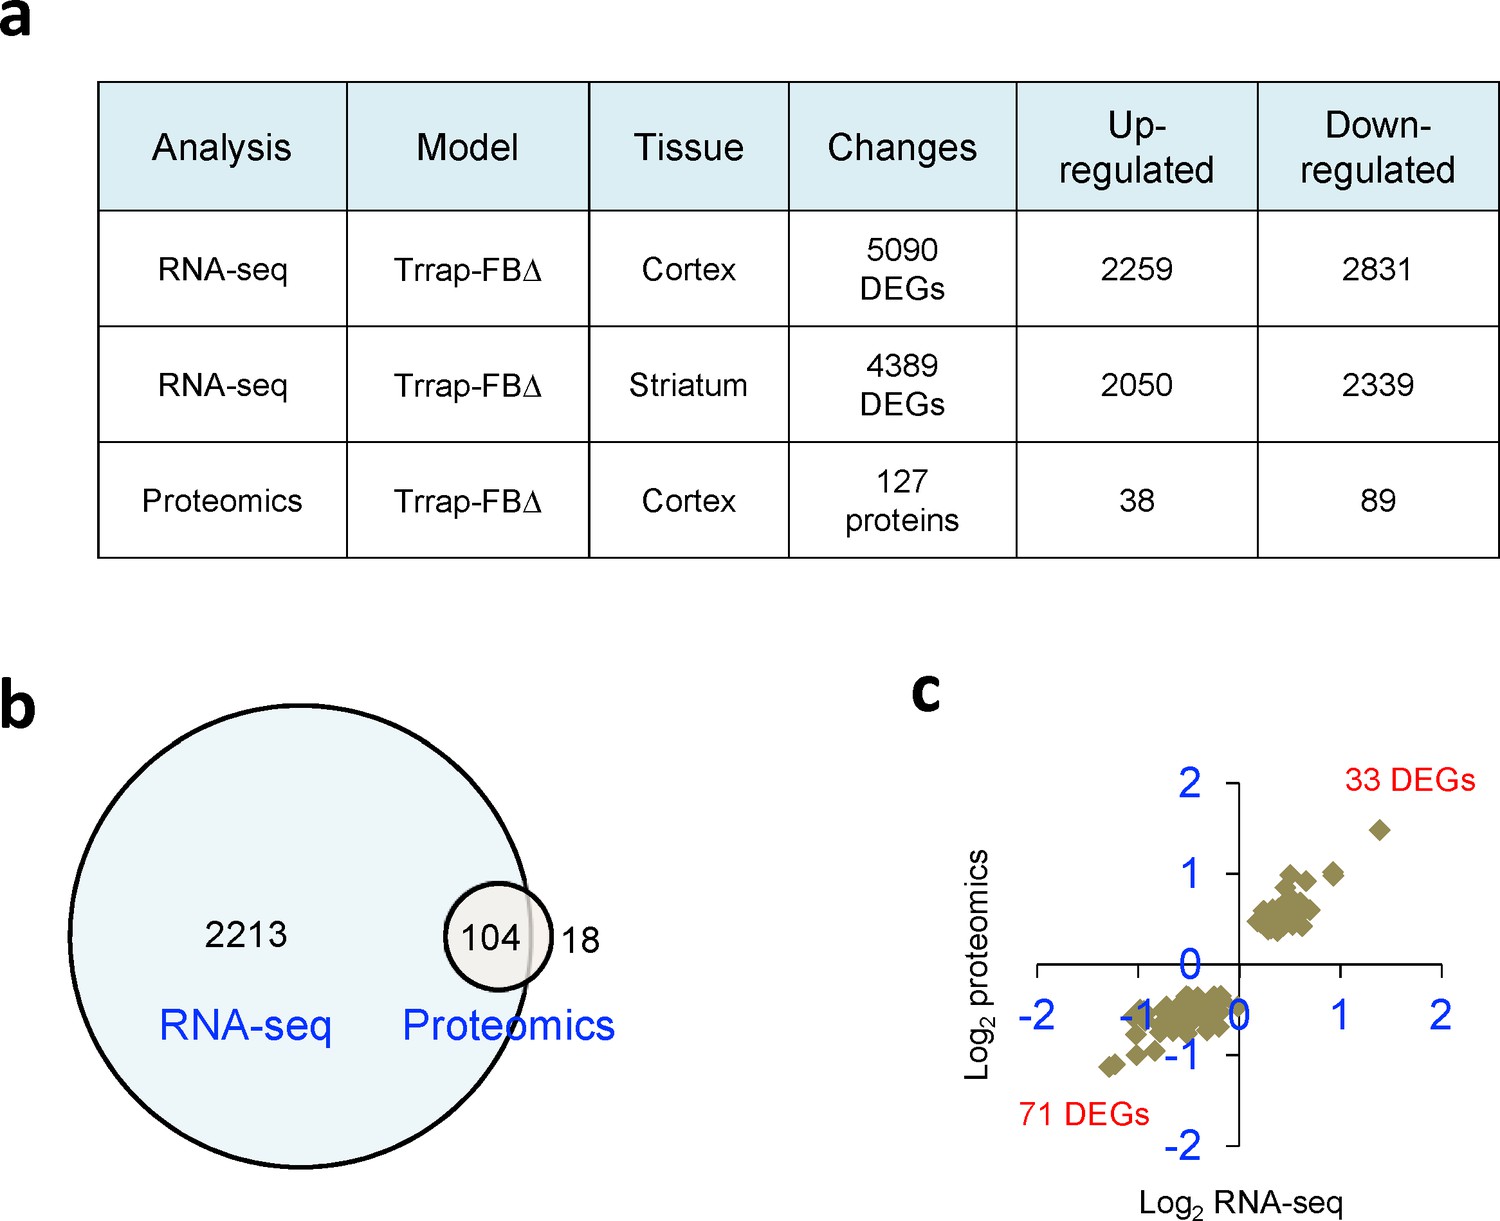
Trrap deletion leads to transcriptome and proteome changes.
(a) The table summarizes the different genome-wide approaches used to analyze the function of Trrap in different cell types and the general results obtained. For all analyses, four to five biological replicates were used. (b) The Venn diagram depicts the overlap between the differentially expressed genes (DEGs) measured by RNA-seq and protein changes measured by mass spectrometry (cutoff, q ≤ 0.1) in Trrap-FBΔ cortices. The numbers refer to common DEGs/DEP (differentially expressed proteins) in the indicated data sets. (c) The Venn diagram depicts the log2 of the fold changes of the 104 common DEGs/proteins in Trrap-FBΔ cortices.
Figure 3—figure supplement 2
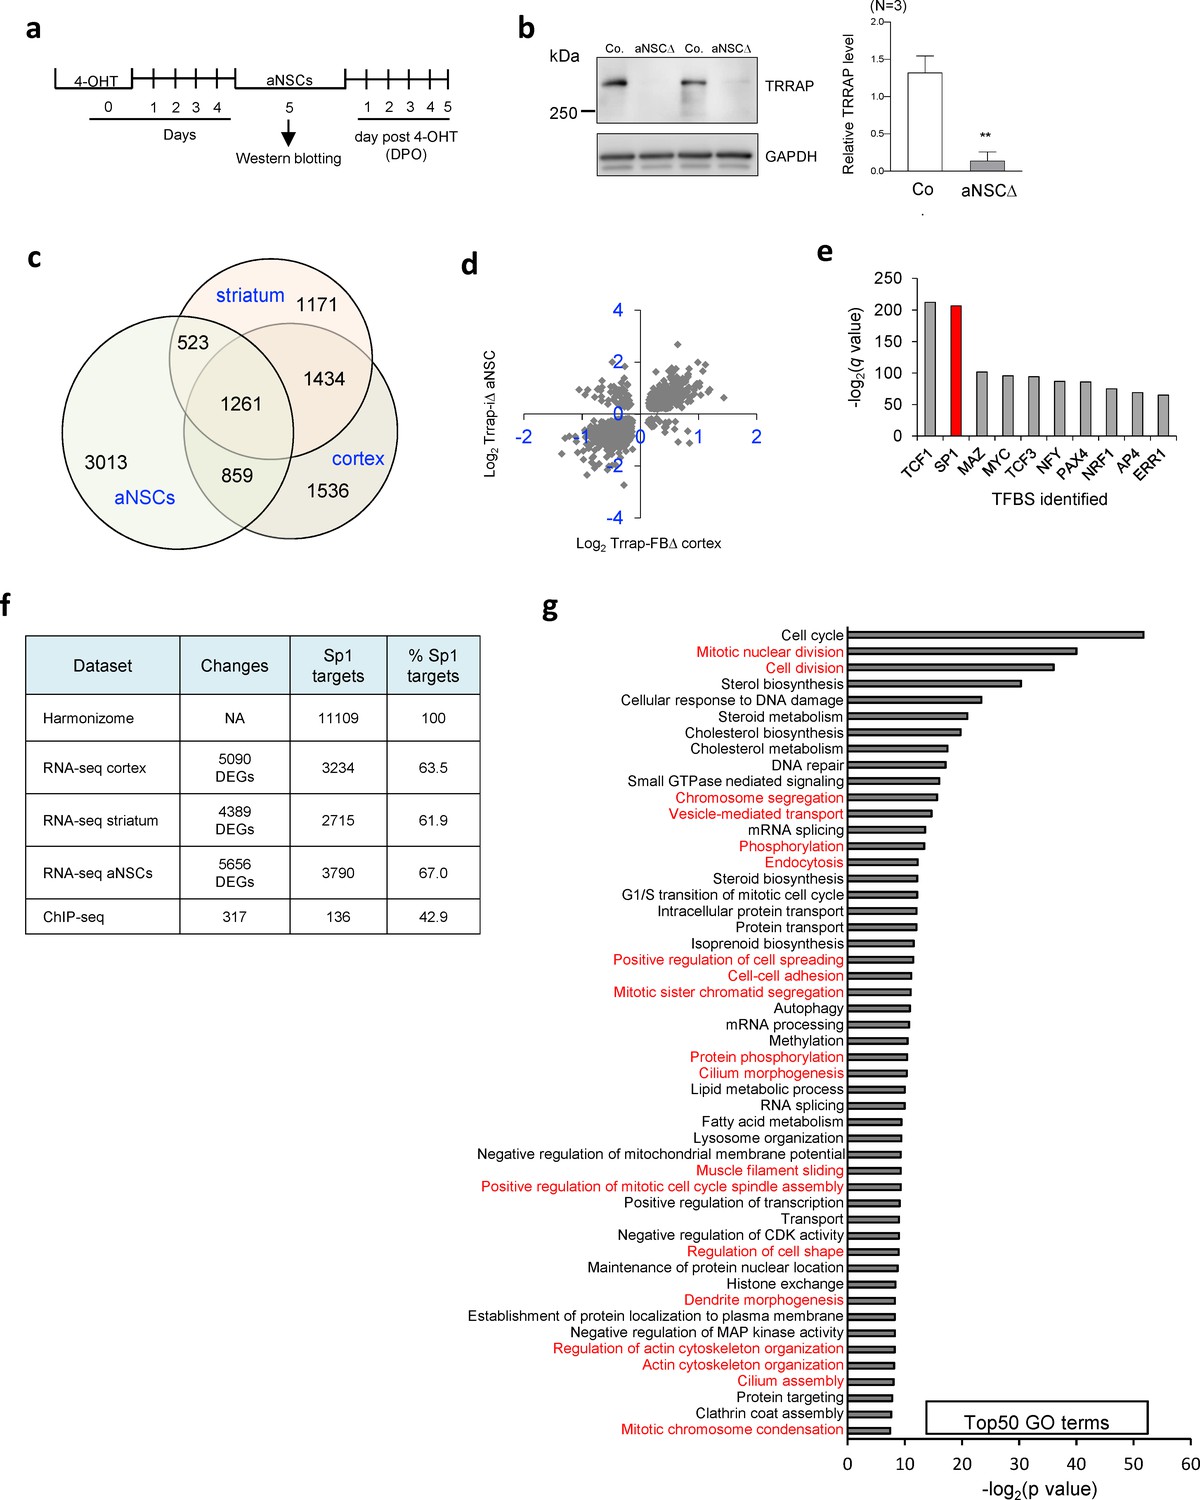
Comparative Omics analysis of Trrap deleted aNSCs with Trrap-FBΔ brains.
(a) The experimental workflow of the Trrap deletion in aNSCs in culture by 4-OHT followed by experiments at indicated day post 4-OHT treatment (DPO). (b) Western blot analysis of the Trrap deletion in aNSC at 5DPO. GAPDH is a loading control. Quantification of the Trrap protein levels from three animals (N = 3) after normalization to GAPDH is shown on the left. Co.: control; aNSCΔ: Trrap-aNSCΔ. (c) The Venn diagram depicts the overlap between the differentially expressed genes (DEGs) measured by RNA-seq in the cortex, striatum, and aNSCs. The numbers refer to DEGs in the indicated data sets. (d) Log2 of the fold changes of the 2120 common DEGs in Trrap-FBΔ cortex and Trrap-aNSCΔ aNSCs. (e) Transcription factor binding site (TFBS) enrichment analysis of the 1261 common DEGs in aNSCs, cortex, and striatum identified by RNA-seq. (f) A list of the Sp1 targets based on published ChIP-seq results was obtained from the Harmonizome database (Rouillard et al., 2016) and compared with our RNA-seq results to determine the amount of Sp1 targets in each data set. (g) Top50 GO terms of the processes regulated by Sp1. Note that microtubule dynamics related processes are highlighted in red.
Figure 4 with 1 supplement
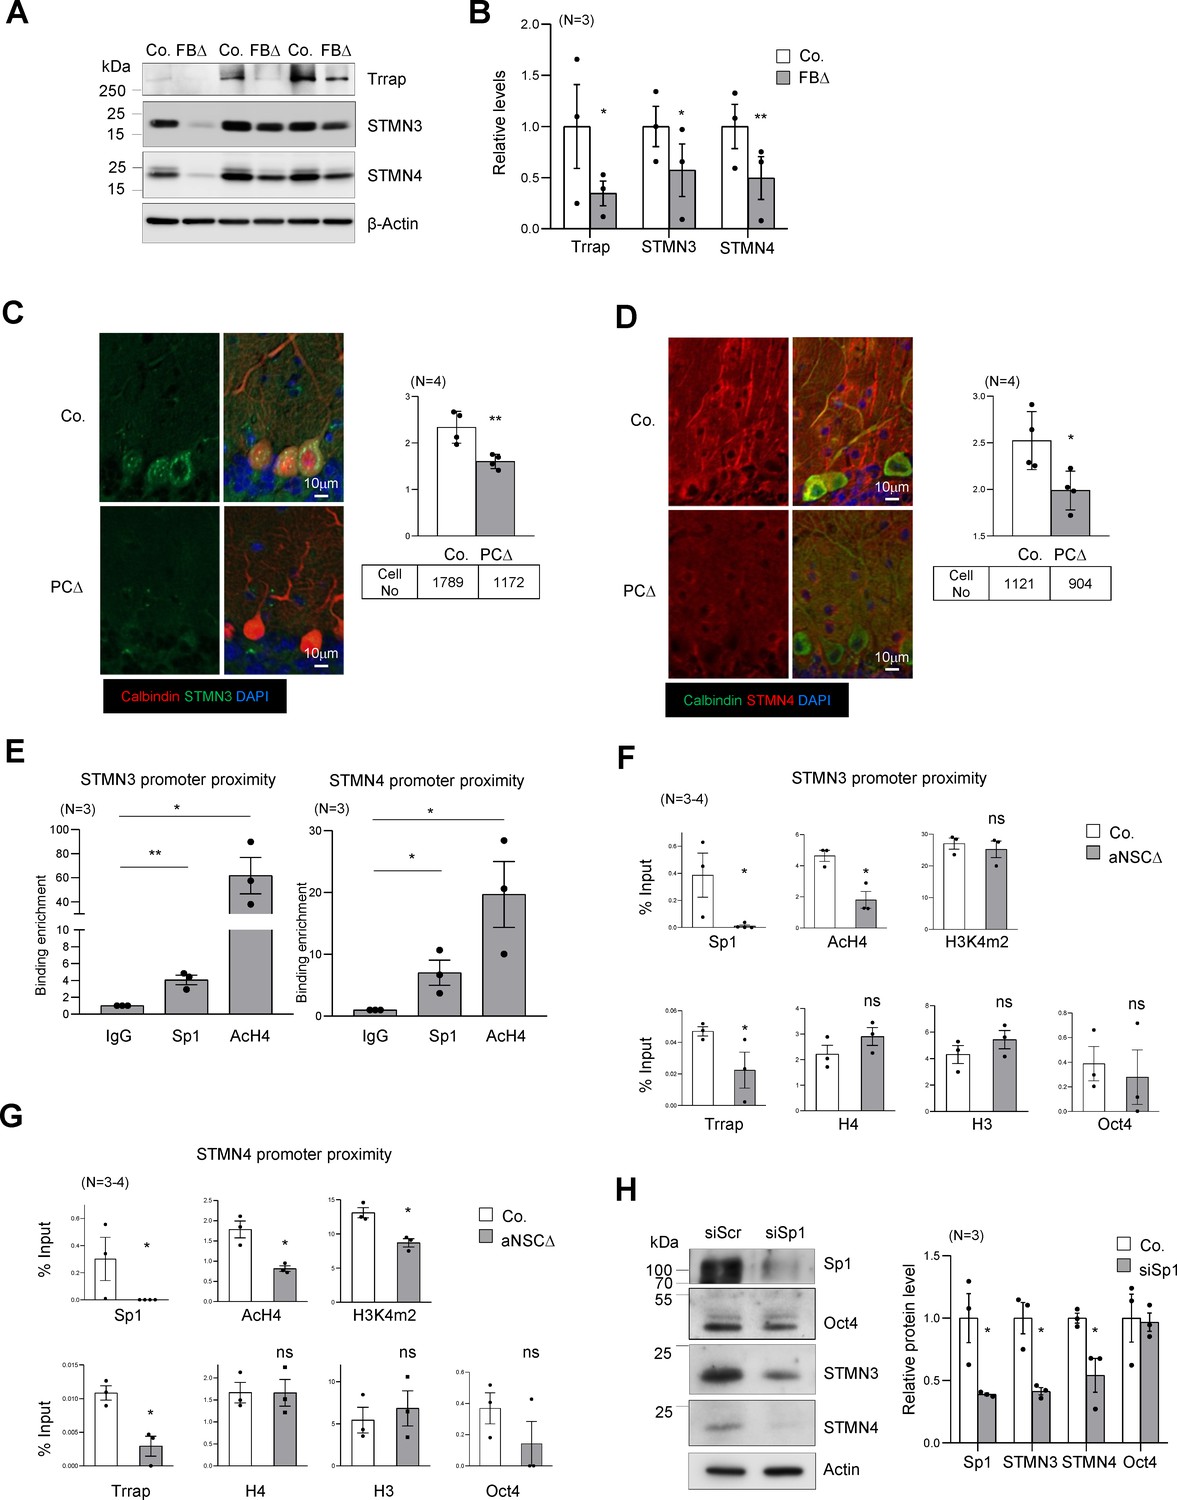
Trrap regulates the expression of STMNs via Sp1.
(A) Western blot analysis of the Trrap deletion and expression of STMNs in the forebrain of indicated genotype at postnatal day 10 (P10). β-actin is a loading control. Co: control; FBΔ: Trrap-FBΔ. (B) The quantification of the expression of the indicated proteins in mutant forebrains measured by western blots are related value to adjacent controls after normalization to β-actin. N: the number of mice analyzed. The error bar presents the standard error. Paired t-test was used for statistical analysis. *p≤0.05, **p≤0.01. (C and D) Sagittal sections of 4-month-old Trrap-PCΔ mice were stained against STMN3 (green, C) and STMN4 (green, D), the Purkinje cell marker Calbindin (red) and counterstained with DAPI (blue). The right panel shows the average intensity of STMN3 or STMN4 in Purkinje cells normalized by the intensity in the neighboring cells (not Trrap-deleted). n: the number of cells analyzed; N = 4 mice analyzed. (E) ChIP analysis on the STMN3 and STMN4 promoters in control striata using antibodies against Sp1, AcH4, and IgG. qPCR analysis was performed to quantify the binding of the indicated factors to the promoter. The binding enrichment was calculated as fold enrichment over IgG. N = 3 mice analyzed. The primers that contain the Sp1 site for ChIP assays are marked in Figure 4—figure supplement 1g. (F and G) ChIP analysis on the proximity of STMN3 (F) and STMN4 (G) promoters in control and TrrapΔ aNSCs. Protein binding value is presented in percentage of input. The large error bars in Oct4 ChIP are due to an inclusion of a high value from one pair of samples. N = 3–4 mice analyzed. (H) Western blot analysis of STMN3 and STMN4 expression after siRNA-mediated knockdown of Sp1 in aNSCs. Oct4 is an Sp1 independent transcription factor control and β-actin controls loading. (C–H) Mean ± standard error of the mean is shown. Unpaired t-test was performed for statistical analysis. *p≤0.05, **p≤0.01.
Figure 4—figure supplement 1
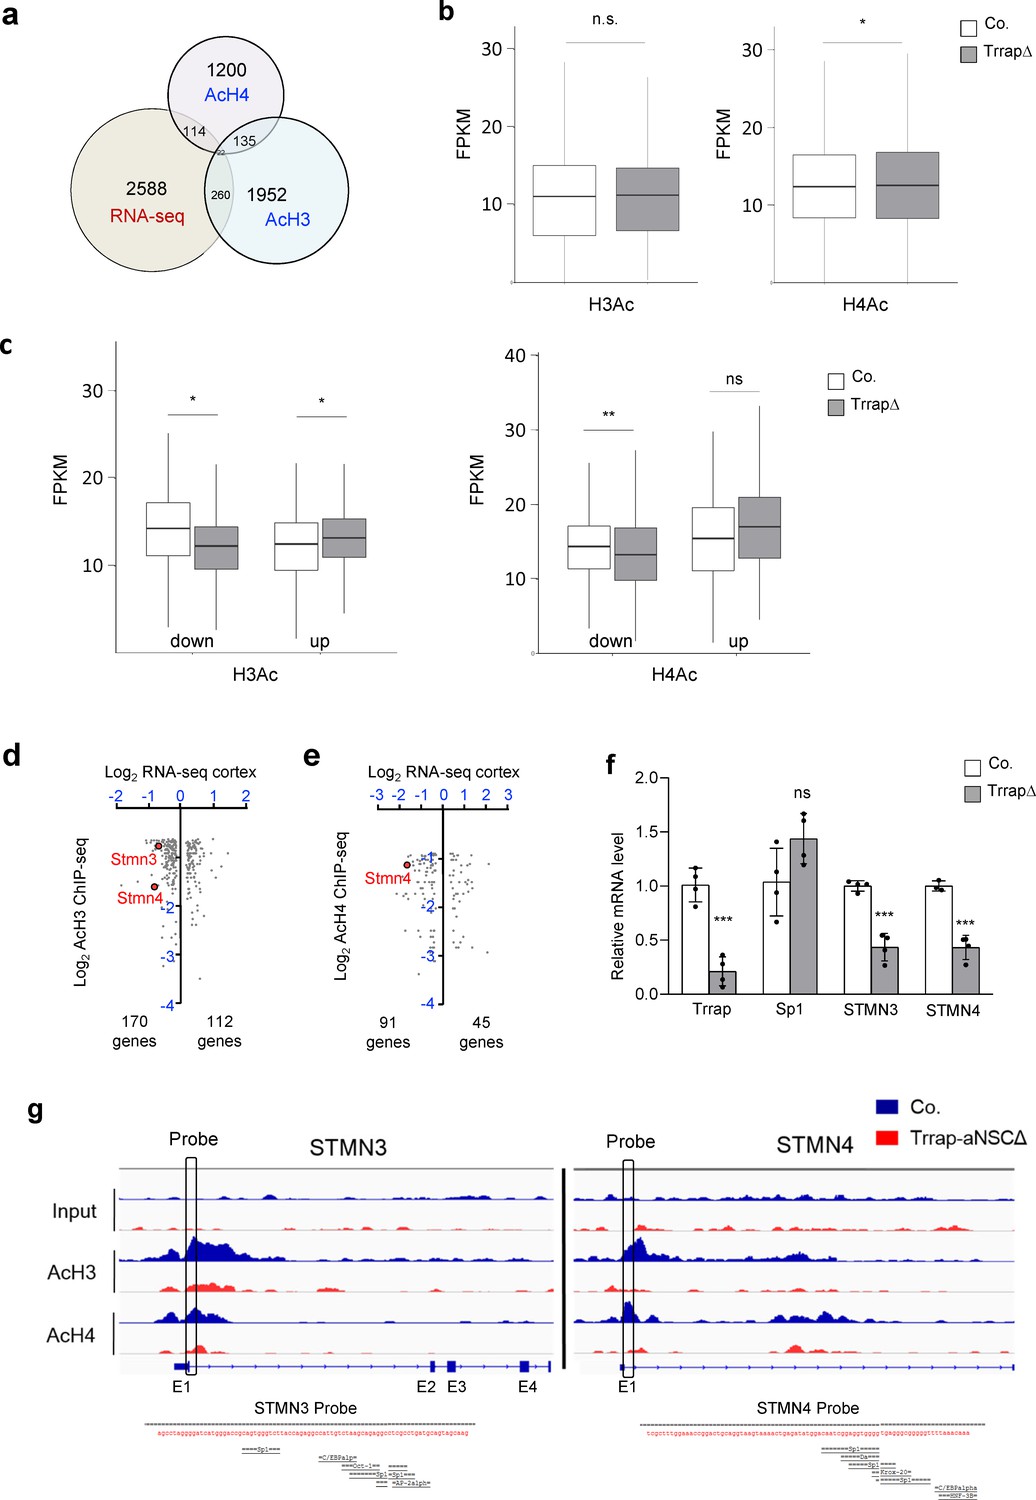
Expression and HAT binding analysis of STMNs in Trrap-FBΔ brains.
(a) The scheme depicts the overlap between the common differentially expressed genes (DEGs) measured in the RNA-seq analyses of the cortex and striatum of Trrap-FBΔ mice and acetylated histone depleted peaks in aNSCs. The numbers refer to common genes identified in the indicated data sets. (b) Level of histone acetylation across SP1-motif in the whole genome. Box plot shows the distribution of lower quartile 25% and upper quartile 75%. RPKM: Fragment per kb pair region per million sequence reads. Whiskers present minimal to maximal value. Unpaired t-test was performed for statistical analysis. *p≤0.05. (c) Level of histone acetylation across SP1-motif in the genome at Trrap DEGs. Box plot shows the distribution of lower quartile 25% and upper quartile 75%. Whiskers present minimal to maximal value. ‘Up’ indicates the acetylated histone peak among genes that are upregulated after Trrap-deletion, ‘down’ indicates those which are downregulated. Unpaired t-test was performed for statistical analysis. *p≤0.05, **p≤0.01. (d) Genes overlapping in RNA-seq from cortices and striatum and AcH3 ChIP-seq in aNSCs. The log2 of the fold changes in RNA-seq of cortices and AcH3 ChIP-seq of the 282 genes where decreased AcH3 was observed concomitant with changes in RNA levels. STMN3 and STMN4 are targets analyzed in this study and related to neuronal homeostasis. (e) Genes overlapping in RNA-seq from cortices and striatum and AcH4 ChIP-seq in aNSCs. Log2 of the fold changes in RNA-seq of cortices and AcH4 ChIP-seq of the 136 genes where decreased AcH4 was observed concomitant with changes in RNA levels. STMN4 is a target analyzed in this study and related to neuronal homeostasis. (f) Quantitative PCR (q-PCR) analysis of Sp1 target genes in Trrap-FBΔ cortex and striatum. N = 4, the number of mice analyzed. Unpaired t-test was performed for statistical analysis. *p≤0.05; ***p≤0.001; n.s.: not significant. (g) Genomic view of the Stmn3 and Stmn4 gene showing the levels of histone H3 and H4 acetylation in control and mutant aNSCs from ChIP-seq data sets (Supplementary file 5). The primers used for ChIP assays are located in the promoter proximity of respective genes. Lower panels depict the sequence of both ChIP probes, in which Sp1 consensus is shown.
Figure 5 with 1 supplement
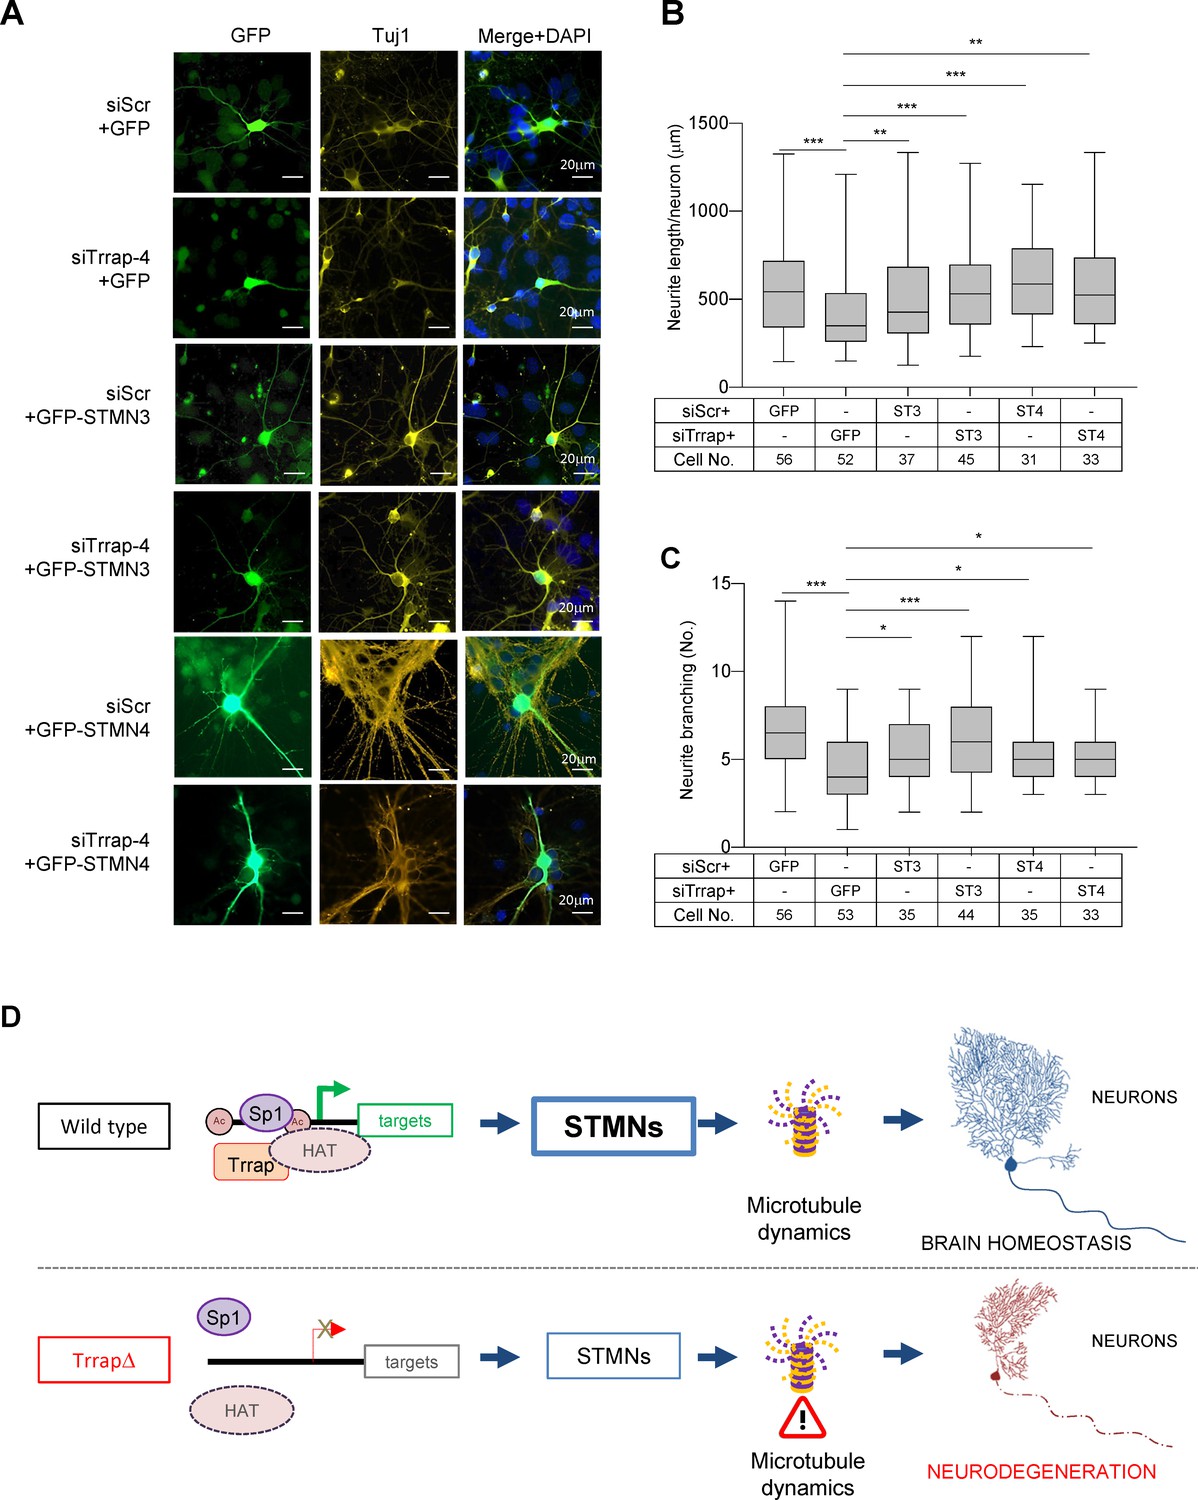
Trrap deletion causes neuronal defects in vitro that can be rescued by ectopic expression of STMN3.
(A) Immunofluorescent images of primary neurons isolated from E16.5 forebrains at 6 days post co-transfection of siRNA (siScramble, siTrrap-4) with GFP, or with the GFP-STMN3, or with GFP-STMN4 expressing vector. (B) The neurite length after the Trrap knockdown and rescue by the STMN3 or STMN4 overexpression was analyzed at 6 days post co-transfection of the indicated siRNA with the GFP-, STMN3-, or STMN4-expressing vector. The neurite length is measured with NeuronJ (ImageJ plug-in). Only GFP-positive neurons (indicative of transfection) were analyzed. Each bar represents the data from four to six mouse embryos; the experiments were repeated more than three times. Unpaired t-test was performed for statistical analysis. **p≤0.01, ***p≤0.001, n.s., not significant. (C) The neurite branching after the Trrap knockdown and rescue by STMN3 or STMN4 overexpression was analyzed at 6 days post co-transfection of the indicated siRNA with the GFP, STMN3-, or STMN4-expressing vector. The neurite length is measured with NeuronJ (ImageJ software). Only GFP-positive neurons were scored and are shown. Each bar represents the data from four to six mouse embryos; the experiments were repeated more than three times. Unpaired t-test was performed for statistical analysis. *p≤0.05, **p≤0.01, ***p≤0.001, n.s., not significant. (D) Working model of Trrap-HAT-Sp1 in brain homeostasis and neurodegeneration. The Trrap deletion compromises HAT to acetylate histones resulting in insufficient binding of Sp1 and the subsequent downregulation of target genes involved in microtubule dynamics (STMNs). The dysregulation of STMNs provokes the axonal swelling, declines of neurite lengths and branching of postmitotic neurons, ultimately, leading to defective neuronal homeostasis and neurodegeneration.
Figure 5—figure supplement 1
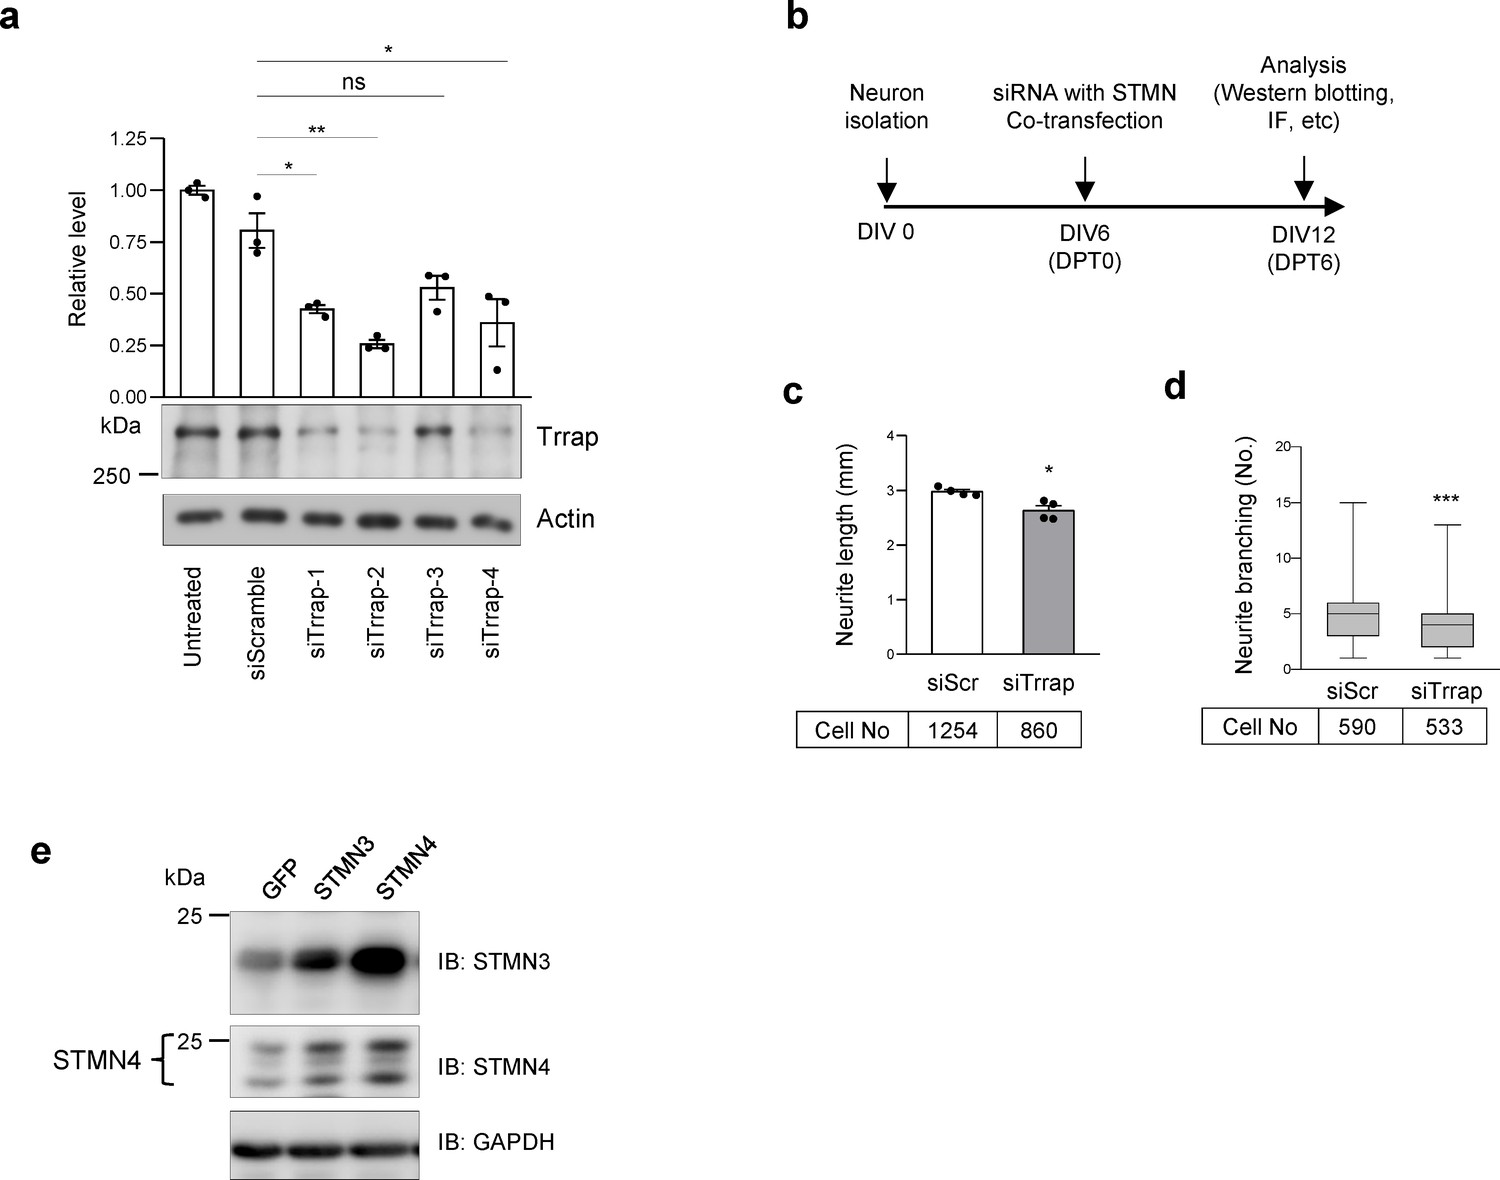
Ectopic expression of STMNs rescues defects of Trrap knockdown neurons.
(a) Western blot analysis of the siRNA mediated Trrap knockdown in N2A cells. Various siRNAs against Trrap (−1,–2, −3,–4) and siScramble (as a control) are shown. The efficiency of the Trrap knockdown was determined by ImageJ software and is shown on the top of the blot. The Trrap level is normalized to the non-treated sample after correction to GAPDH. The error bar presents the standard error. Unpaired t-test was used for statistical analysis. *p≤0.05, **p≤0.01. (b) Scheme of primary neuron transfection and analysis. The primary neurons were isolated from E16.5 murine cortical tissue and cultured for 6 days (DIV) prior to transfection. Six days post-transfection (DPT), the neuronal culture was subject to analysis. (c) The neurite length was acquired and analyzed by IncuCyte at DPT6. The total neurite length (mm) was divided by the number of the cell-body cluster in the whole culture plate. Only GFP-positive (indicative of transfection) neurons were scored. The mouse embryo number: N = 6. The error bar represents the standard deviation. Unpaired t-test was used for a statistical analysis. *p≤0.05. (d) The neuronal culture was imaged by IncuCyte at DPT6 and the neurite branching number per cell-body cluster is shown. The neurite branching was scored manually on all GFP-positive only neurons. The mouse embryo number: N = 6. The error bar represents the standard deviation. Unpaired t-test was used for statistical analysis. ***p≤0.001.
Tables
Key resources table
| Reagent type (species) or resource | Designation | Source or reference | Identifiers | Additional information |
|---|---|---|---|---|
| Gene (M. musculus) | Trrap | Genebank | MGI:MGI:2153272 | |
| Gene (M. musculus) | Sp1 | Genebank | MGI:MGI:98372 | |
| Gene (M. musculus) | STMN3 | Genebank | MGI:MGI:1277137 | |
| Gene (M. musculus) | STMN4 | Genebank | MGI:MGI:1931224 | |
| Strain, strain background (M. musculus) | Trrapf/f; Pcp2-Cre | This paper | Trrap deletion in Purkinje cells; M. musculus, male and female; Please refer to ‘Materials and methods’ in the paper, Section ‘Mice’ | |
| Strain, strain background (M. musculus) | Trrapf/f; Camk2-Cre | This paper | Trrap deletion in forebrain; M. musculus, male and female; Please refer to ‘Materials and methods’ in this paper, Section ‘Mice’ | |
| Strain, strain background (M. musculus) | Trrapf/+; Rosa26-CreERT2 Trrapf/f; Rosa26-CreERT2 | This paper | Trrapf/+ acts as a control to Trrapf/f Trrap deletion in adult neural stem cells; M. musculus, male and female; Please refer to ‘Materials and methods’ in this paper, Section ‘Mice’ | |
| Strain, strain background (M. musculus) | B6.Cg-Tg(Thy1-Brainbow1.0)HLich/J (R26R-Confetti); Trrapf/f; Pcp2-Cre | This paper | Tracing of the single Purkinje cells; M. musculus, male and female; Please refer to ‘Materials and methods’ in this paper, Section ‘Mice’ | |
| Genetic reagent (M. musculus) | Lipofectamine 2000 | Invitrogen | Cat#: 11668027 | siTrrap and Plasmid co-transfection; M. musculus |
| Genetic reagent (M. musculus) | Lipofectamine RNAiMAX | Invitrogen | Cat#: 13778075 | siSp1 transfection; M. musculus |
| Cell line (M. musculus) | Trrap-aNSC | This paper | Primary cell line; M. musculus; Please refer to ‘Materials and methods’ in this paper, Section ‘aNSC cell culture’. | |
| Cell line (M. musculus) | E16.5 cortical neuron | This paper | Primary cell line; M. musculus; Please refer to ‘Materials and methods’ in the paper, Section ‘Isolation and culture of murine primary neurons’. | |
| Cell line (M. musculus) | Neuro-2a Neuroblastoma cells | PMID:4534402 | ATCC CCL-131 | Cell line; M. musculus |
| Transfected construct (M. musculus) | ON-TARGETplus siRNA Reagents -Mouse (siScramble) | Horizon Discovery | Cat#: D-001810-10-05 | UGGUUUACAUGUCGACUAA; M. musculus |
| Transfected construct (M. musculus) | siTrrap-1 | Horizon Discovery | Cat#: LQ-051873-01-0005 | CAAAAGUAGUGAACCGCUA; M. musculus |
| Transfected construct (M. musculus) | siTrrap-2 | Horizon Discovery | Cat#: LQ-051873-01-0005 | CCUACAUUGUGGAGCGGUU; M. musculus |
| Transfected construct (M. musculus) | siTrrap-3 | Horizon Discovery | Cat#: LQ-051873-01-0005 | GCCAACUGUCAGACCGUAA; M. musculus |
| Transfected construct (M. musculus) | siTrrap-4 | Horizon Discovery | Cat#: LQ-051873-01-0005 | CGUACCUGGUCAUGAACGA; M. musculus |
| Antibody | Anti-Calbindin (Mouse Monoclonal) | Sigma | Cat#:C9848 RRID:AB_476894 | IF:1:300 WB: 1:1000 |
| Antibody | Anti-GFAP (Mouse Monoclonal) | Agilent | Cat#:G3893 RRID:AB_477010 | IF:1:300 WB: 1:1000 |
| Antibody | Anti-MBP (Mouse Monoclonal) | Millipore | Cat#:MAB384 RRID:AB_240837 | IF:1:300 |
| Antibody | Anti-GFP (Rabbit Monoclonal) | Cell Signaling Technology | Cat#:2956 RRID:AB_1196615 | IF: 1:200 |
| Antibody | Anti-GFP (Mouse Monoclonal) | Santa Cruz | Cat#:sc-390394 | IF:1:200 WB: 1:400 |
| Antibody | Anti-Sp1 (Mouse Monoclonal) | Santa Cruz | Cat#:sc-17824 RRID:AB_628272 | IF: 1:50 |
| Antibody | Anti-Sp1 (Rabbit Polyclonal) | Millipore | Cat#:07–645 RRID:AB_310773 | WB:1:1000 ChIP: 1:80 |
| Antibody | Anti-STMN3 (Rabbit Polyclonal) | Proteintech, | Cat#:11311–1-AP RRID:AB_2197399 | IF:1:100 WB:1:1000 |
| Antibody | Anti-STMN4 (Mouse Monoclonal) | Santa Cruz | Cat#:sc-376829 | IF:1:100 WB:1:1000 |
| Antibody | Anti-Tuj1(Mouse Monoclonal) | Covance | Cat#: MMS-435P RRID:AB_2313773 | IF:1:400 |
| Antibody | Anti-CNPase (Mouse Monoclonal) | Sigma | Cat#: SAB4200693 | IF:1:1000 |
| Antibody | Anti-Galectin3 (Rat Monoclonal) | eBioscience | Cat#:14-5301-82 RRID:AB_837132 | WB:1:1000 |
| Antibody | Anti-a-tubulin (Mouse Monoclonal) | Sigma | Cat#:sc-32293 RRID:AB_628412 | WB: 1:5000 |
| Antibody | Anti-TRRAP (Mouse) clone TRR-2D5 | Euromedex | ID: IG-TRR-2D5 | WB:1:1000 |
| Antibody | Anti-TRRAP (Mouse) clone TRR-1B3 | Euromedex | ID: IG-TRR-1B3 | ChIP: 1:40 |
| Antibody | Anti-β-actin (Mouse Monoclonal) | Sigma | Cat#:A5441 RRID:AB_476744 | WB:1:3000 |
| Antibody | Anti-AcH3 (Rabbit Polyclonal) | Millipore | Cat#:06–599 RRID:AB_2115283 | ChIP: 1:150 |
| Antibody | Anti-AcH4 (Rabbit Polyclonal) | Millipore | Cat#:06–866 RRID:AB_310270 | ChIP: 1:150 |
| Antibody | Anti-H3K4me2(Rabbit Polyclonal) | Abcam | Cat#: ab7766 RRID:AB_2560996 | ChIP: 1:100 |
| Antibody | H3 (Rabbit Monoclonal) | Abcam | Cat#: ab1791 RRID:AB_302613 | ChIP: 1:150 |
| Antibody | H4 (Rabbit Polyclonal) | Abcam | Cat#: ab7311 RRID:AB_305837 | ChIP: 1:150 |
| Antibody | Oct-4 (Rabbit Monoclonal) | Cell Signaling | Cat#: 2840 RRID:AB_2167691 | ChIP: 1:80 WB:1:1000 |
| Antibody | IgG (Rabbit Polyclonal) | Sigma | Cat#: I8140 RRID:AB_1163661 | ChIP: 1:1500 (2 µg antibody) |
| Recombinant DNA reagent | EF1a-GFP-P2A-STMN3-Poly(A) (plasmid) | This paper | STMN3 overexpression plasmid; M. musculus; Please refer to‘Materials and methods’ in this paper, Section ‘Construction of STMNs expression vectors’. | |
| Recombinant DNA reagent | EF1a-GFP-Poly(A)-EF1a-STMN4-Poly(A) (plasmid) | This paper | STMN4 overexpression plasmid; M. musculus; Please refer to ‘Materials and methods’ in this paper, Section ‘Construction of STMNs expression vectors’. | |
| Recombinant DNA reagent | −111 hTF m3 | Addgene | Cat#: 15450 | Sp1 activity reporter; H. sapiens |
| Recombinant DNA reagent | pN3-Sp1FL | Addgene | Cat#: 24543 | Sp1 overexpression reporter; H. sapiens |
| Sequence-based reagent | Sp1 primer | PrimerBank | ID 7305515a1 | Fwd, 5’-GCCGCCTTTTCTCAGACTC-3’; Rev, 5’-TTGGGTGACTCAATTCTGCTG-3’ |
| Sequence-based reagent | STMN3 primer | PrimerBank | ID 6677873a1 | Fwd, 5’-CAGCACCGTATCTGCCTACAA-3’; Rev, 5’-GTAGATGGTGTTCGGGTGAGG-3’; |
| Sequence-based reagent | STMN4 primer | PrimerBank | ID 9790189a1 | Fwd, 5’-ATGGAAGTCATCGAGCTGAACA-3’; Rev, 5’-GGGAGGCATTAAACTCAGGCA-3’. |
| Sequence-based reagent | STMN3 promoter primer | This paper | Fwd, 5’-CTTGCTACTGCATCAGGCGA-3’; Rev, 5’-AGCCTAGGGGATCATGGGAC-3’; | |
| Sequence-based reagent | STMN4 promoter primer | This paper | Fwd, 5’-TCGCTTTGGAAACCGGACTG-3’; Rev, 5’-TTTGTTTAAAACCCCCGCCC-3’. | |
| Commercial assay or kit | Incucyte S3 | Sartorius AG | Product Code: 4695 | For neurite detection and quantification |
| Commercial assay or kit | RNeasy Lipid Tissue Mini Kit | Qiagen | Cat #: 74804 | |
| Commercial assay or kit | RNAeasy Mini Kit | Qiagen | Cat #: 74104 | |
| Commercial assay or kit | LightCycler 480 Real-Time PCR System | Roche | Product No. 05015243001 | |
| Commercial assay or kit | RNA 6000 nano kit | Agilent | Cat #: 5067–1511 | |
| Commercial assay or kit | TruSeq Stranded mRNA Kit | Illumina | Cat #: 20020594 | |
| Commercial assay or kit | Dual-Glo Luciferase Assay System | Promega | Cat# E2920 | |
| Commercial assay or kit | QiaQuick PCR Purification Kit | Qiagen | Cat# 28106 | |
| Commercial assay or kit | Fragment Analyzer | Agilent | Cat#: M5310AA | |
| Commercial assay or kit | NextSeq500 platform | Illumina | RRID:SCR_014983 | |
| Commercial assay or kit | TruSeq ChIP Sample Preparation Kit | Illumina | Cat#: IP-202–1024 | |
| Chemical compound, drug | Epoxy resin ‘Epon’ | SERVA | Glycid ether 100 for electron microscopy | |
| Chemical compound, drug | cOmplete, Mini, EDTA-free | Roche | Cat#: 04693159001 | Protease Inhibitor |
| Chemical compound, drug | PhosSTOP | Roche | Cat#: PHOSS-RO | Phosphatase Inhibitor |
| Chemical compound, drug | protein-A-conjugated magnetic beads | Invitrogen | Cat#: 10003D | |
| Chemical compound, drug | protein-G-conjugated magnetic beads | Invitrogen | 10001D | |
| Chemical compound, drug | Platinum SYBR Green qPCR SuperMix-UDG | Qiagen | 11733046 | |
| Software, algorithm | NeuronJ Plug-in by ImageJ software | National Institutes of Health | Neurite tracing and quantification | |
| Software, algorithm | Fiji plugins Simple Neurite Tracing | National Institutes of Health | Sholl analysis | |
| Software, algorithm | bcl2FastQ | Illumina | RRID:SCR_015058 | Version 1.8.4 |
| Software, algorithm | STAR | PMID:23104886 | RRID:SCR_015899 | Version 2.5.4b; RNA sequence mapping parameters: --alignIntronMax 100000 --outSJfilterReads Unique --outSAMmultNmax 1 --outFilterMismatchNoverLmax 0.04 |
| Software, algorithm | FeatureCounts | PMID:24227677 | RRID:SCR_012919 | Version 1.5.0; parameters: metafeature mode, stranded mode ‘2’, Ensembl 92 annotation |
| Software, algorithm | ENSEMBL annotation | PMID:31691826 | RRID:SCR_002344 | Release 92 for Mus musculus |
| Software, algorithm | MultiQC | PMID:27312411 | RRID:SCR_014982 | Version 1.6; RNA sequence quality assessment of the raw input data, the read mapping and assignment steps |
| Software, algorithm | R package DESeq2 | PMID:25516281 | RRID:SCR_015687 | Version 1.20.0; Analysis of differential expressed genes in pairwise comparisons. |
| Software, algorithm | R package VennDiagram | PMID:21269502 | RRID:SCR_002414 | Version 1.6.20 |
| Software, algorithm | Database for Annotation, Visualization and Integrated Discovery (DAVID) programs | https://david.ncifcrf.gov/home.jsp | DAVID v6.7; Gene ontology (GO) and KEGG pathway enrichment analyses | |
| Software, algorithm | TFBS enrichment analysis | UC San Diego, Broad Institute, USA | GSEA 4.1.0 | Based on GSEA database or Harmonizome database for Sp1 targets |
| Software, algorithm | Ingenuity Pathway Analysis (IPA) program | Qiagen | Analysis of Sp1 targets affected by Trrap deletion | |
| Software, algorithm | R package AnnotationDbi | Bioconductor | DOI: 10.18129/B9.bioc.AnnotationDbi | Version 1.42.1 |
| Software, algorithm | R package org.Mm.eg.db | Bioconductor | DOI: 10.18129/B9.bioc.org.Mm.eg.db | Version 3.6.0 |
| Software, algorithm | FastQC | Babraham Bioinformatics, UK | RRID:SCR_014583 | Version 0.11.5 |
| Software, algorithm | Bowtie | http://bowtie-bio.sourceforge.net | RRID:SCR_005476 | Version 1.1.2 |
| Software, algorithm | MACS14 | https://bio.tools/macs | RRID:SCR_013291 | |
| Software, algorithm | R | https://www.r-project.org/ | RRID:SCR_001905 | Version 3.4.4 |
| Other | Beam walking | Homemade | ||
| Other | Mouse Rota-rod | Ugo Basile | Cat#: 47600 | |
| Other | DAPI stain | Invitrogen | Cat#: D1306 | 1:5000 |
| Other | Bioruptor | Diagenode | N/A | Sonication |
| Other | vibrating microtome HM 650 V | Thermo Scientific Microm | Sagittal section cutting | |
| Other | Reichert Ultracut S | Leica | Ultrathin section cutting | |
| Other | JEM 1400 electron microscope | JEOL | Electron microscopic imaging | |
| Other | Orius SC 1000 CCD-camera | GATAN | Electron microscopic imaging | |
| Other | Bioanalyzer 2100 | Agilent | Quality check and quantification of RNA |
Additional files
-
Source data 1
SP1-regulated molecular pathways.
(A) Top30 nervous system processes targets of Sp1. DEGs in all three RNA-seq data sets were compared with the list of the Sp1 targets from the Harmonizome database (Rouillard et al., 2016) and the resulting list was analyzed using IPA to find the disease process associated with the DEGs (cutoff, p<0.05). (B) Top30 differentially expressed Sp1 targets. DEGs in the RNA-seq data sets were compared with the list of Sp1 targets from the Harmonizome database and the Top30 DEGs (cutoff, p<0.05) are indicated. (C) Top30 protein changes of Sp1 targets. Proteins from the forebrain, whose expression changed after the Trrap deletion and correlated with the changes in RNA-seq, were compared with the list of Sp1 targets obtained from the Harmonizone database. The Top30 results based on the q-value are summarized.
- https://cdn.elifesciences.org/articles/61531/elife-61531-data1-v4.docx
-
Supplementary file 1
The list of up- and downregulated genes (adjusted p-value <0.05) in different data sets.
The list includes the DEGs in Trrap-FBΔ cortices (A), Trrap-FBΔ striata (B), and Trrap-deleted aNSCs (C). The list also includes comparisons between Trrap-FBΔ cortices and striata (D) and Trrap-FBΔ cortices, striata, and Trrap-deleted aNSCs (E). Moreover, it includes the GO (F) and KEGG (G) terms obtained from the list in (D), statistical information, and the list of genes in each group.
- https://cdn.elifesciences.org/articles/61531/elife-61531-supp1-v4.xlsx
-
Supplementary file 2
The list of protein changes in Trrap-FBΔ cortices.
(A) The list of protein changes after Trrap deletion. (B) The comparison between protein changes (proteomics, q < 0.1) and mRNA changes (transcriptomics, adjusted p-value <0.05).
- https://cdn.elifesciences.org/articles/61531/elife-61531-supp2-v4.xlsx
-
Supplementary file 3
The results of TFBS enrichment analysis in different data sets.
The list includes the results from the TFBS enrichment analysis using the following lists as a template: (A) DEGs in D. (B) First 2940 DEGs from the list in A sorted by adjusted p-value. (C) DEGs 2941 to 5090 from the list in A sorted by adjusted p-value. (D) First 2940 DEGs from the list in B sorted by adjusted p-value. (E) DEGs 2941 to 4741 from the list in B sorted by adjusted p-value. (F) DEGs in E.
- https://cdn.elifesciences.org/articles/61531/elife-61531-supp3-v4.xlsx
-
Supplementary file 4
Changes in Sp1 targets in different data sets.
(A) A list of known Sp1 targets was obtained from the Harmonizome database (Dubey et al., 2015). The common gene names were transformed to Ensembl gene IDs using the online conversion tool from the DAVID database. (B) A comparison between the DEGs in Suppl. File 1A and the known Sp1 targets listed in (A). (C) A comparison between the DEGs in Suppl. File 1B and the known Sp1 targets listed in (A). (D) A comparison between the DEGs in Suppl. File 1D and the known Sp1 targets listed in (A). (E) The GO terms obtained from the list in (D), statistical information, and the list of genes in each group. (F) The KEGG terms obtained from the list in (D), statistical information, and the list of genes in each group. (G) The list includes the results of the Sp1 ChIP-seq in aNSCs. 30% of the most depleted regions in Trrap-D versus control aNSCs for Sp1 were used as cutoff for defining differentially regulated regions. (H) A comparison between the ChIP-seq results in (G) and the known Sp1 targets listed in (A). (I) The overlaps between the ChIP-seq results in (G) and the DEGs in Suppl. File 1D. (J) A comparison between the DEGs in (I) and the known Sp1 targets listed in (A).
- https://cdn.elifesciences.org/articles/61531/elife-61531-supp4-v4.xlsx
-
Supplementary file 5
Changes in acetylation after Trrap deletion.
(A) The list includes the results of AcH3 ChIP-seq of aNSCs. The 10% most depleted regions in Trrap-Δ versus control aNSCs for AcH3 are summarized. (B) The list includes the results of the AcH4 ChIP-seq of aNSCs. The 10% most depleted regions in Trrap-Δ versus control aNSCs for AcH4 are summarized. (C) The overlaps between the genes mapped in (A) and (B). (D) The overlaps between the DEGs in D and the genes mapped in (A). (E) The overlaps between the DEGs in D and the genes mapped in (B). (F) The overlaps between the DEGs in D and the genes mapped in (C). (G) A combined list from (D) and (E) was created and compared with the list of Sp1 targets in Supplementary file 4A. The list contains genes where the acetylation of H3 or H4 was decreased, whose expression was altered after Trrap deletion and which are reported Sp1 targets.
- https://cdn.elifesciences.org/articles/61531/elife-61531-supp5-v4.xlsx
-
Supplementary file 6
Quality assessment of RNA-seq raw input data.
The table provides the results of the read mapping and assignment steps performed using MultiQC (version 1.6) (Ewels et al., 2016).
- https://cdn.elifesciences.org/articles/61531/elife-61531-supp6-v4.xlsx
-
Transparent reporting form
- https://cdn.elifesciences.org/articles/61531/elife-61531-transrepform-v4.docx
Download links
A two-part list of links to download the article, or parts of the article, in various formats.
Downloads (link to download the article as PDF)
Open citations (links to open the citations from this article in various online reference manager services)
Cite this article (links to download the citations from this article in formats compatible with various reference manager tools)
HAT cofactor TRRAP modulates microtubule dynamics via SP1 signaling to prevent neurodegeneration
eLife 10:e61531.
https://doi.org/10.7554/eLife.61531


