The human origin recognition complex is essential for pre-RC assembly, mitosis, and maintenance of nuclear structure
- Cold Spring Harbor Laboratory, United States
- Graduate Program in Molecular and Cellular Biology, Stony Brook University, United States
- Department of Computer Science, Whiting School of Engineering, Johns Hopkins University, United States
Figures
Figure 1 with 2 supplements
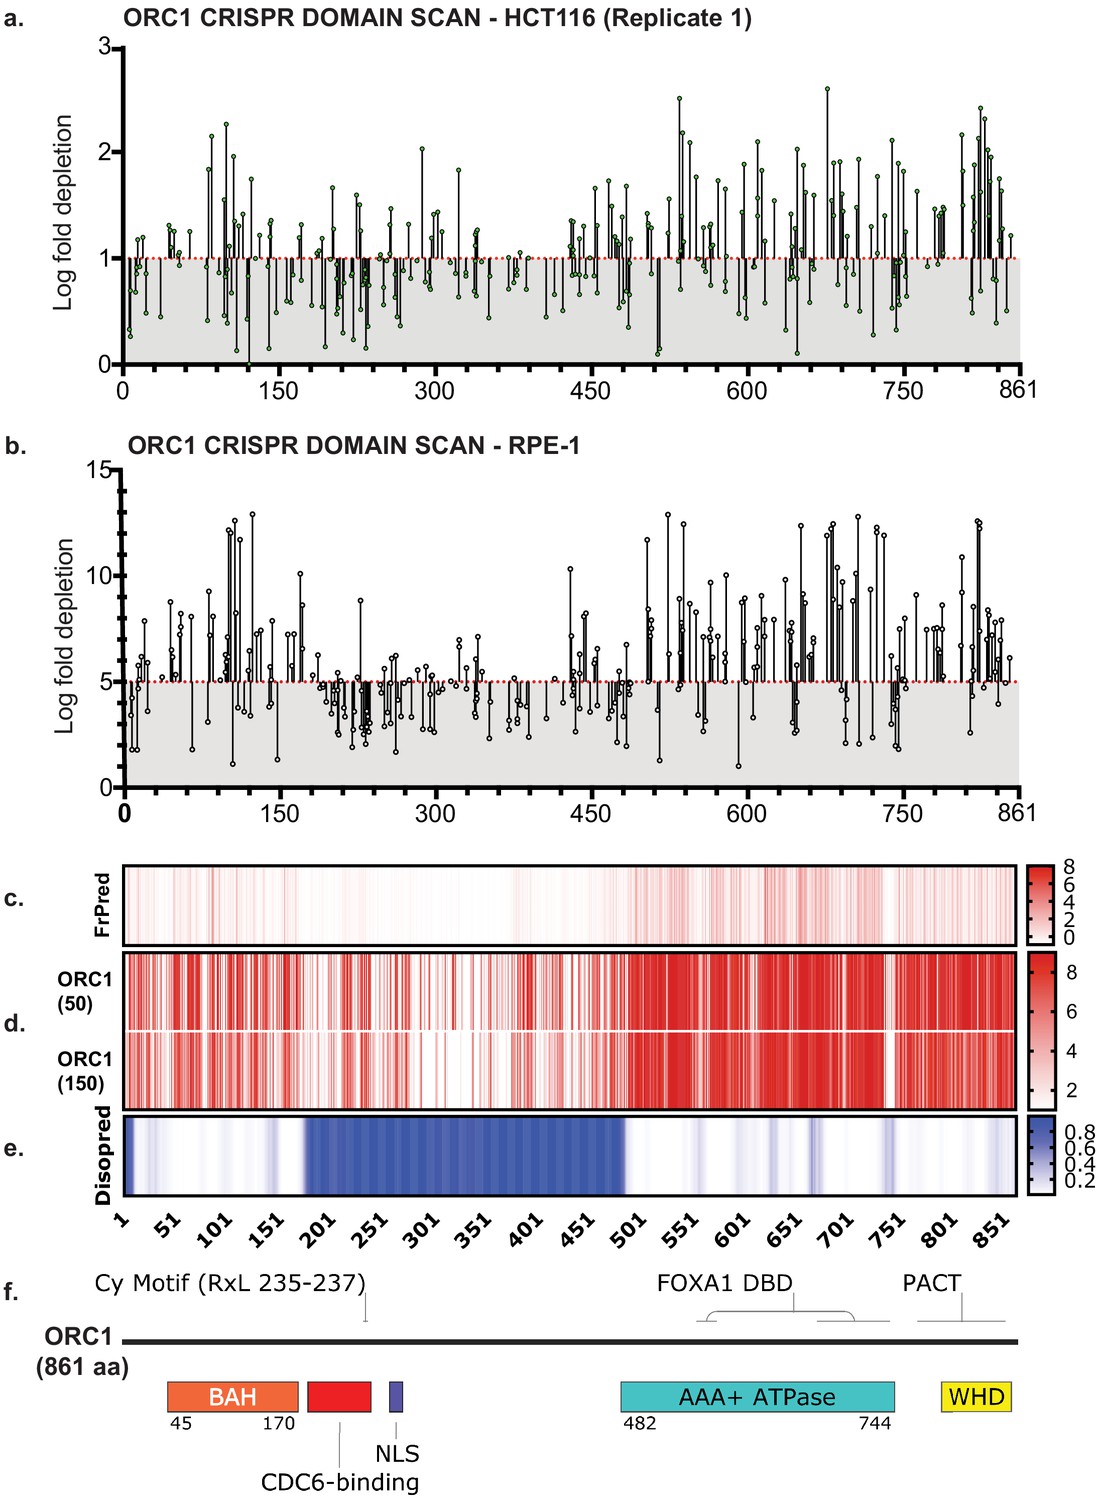
ORC1 is essential to HCT116 and RPE-1 cell lines.
(a) Tiling-sgRNA map ORC1 (replicate 1) in HCT116. Mapped as Log fold depletion (inverted LFC scale) of guide RNAs as calculated by MAGeCK (Li et al., 2014) on y axis vs the amino acid(s) disrupted by that guide RNA on the x axis. Effect of guide RNA is interpreted as essential if its depletion is more than one log fold (red dotted line). Data mapped on 1 Log fold depletion pseudo-axis for clarity (See Figure 1—source data 1). (b) Tiling-sgRNA map of ORC1 in RPE-1. Effect of guide RNA is interpreted as essential if its depletion is more than five log fold (red dotted line). Data mapped on 5 Log fold depletion pseudo-axis for clarity (See Figure 1—source data 2). (c) FrPred (https://toolkit.tuebingen.mpg.de/frpred) of hORC1 (NP_004144.2) shown as gradient heat map of conservation score vs amino acid position. (d) Consurf (https://consurf.tau.ac.il/) of hORC1 – (upper) ORC1 (50) subset (50 HMMER Homologues collected from UNIREF90 database, Max sequence identity = 95%, Min sequence identity 50, Other parameters = default), and (lower) ORC1 (150) subset (150 HMMER Homologues collected from UNIREF90 database, Max sequence identity = 95%, Min sequence identity 35, Other parameters = default). Data represented as heat map of Conservation scores of each amino acid position. (e) Disopred (http://bioinf.cs.ucl.ac.uk/psipred/) plot of hORC1 – heat map representing amino acids within intrinsically disordered regions of the protein. (f) Schematic of domain architecture of ORC1.
-
Figure 1—source data 1
Numerical data table for ORC1 tiling sgRNA CRISPR screen log fold depletion in Figure 1a.
Log fold depletion (LFC) for ORC1 tiling-sgRNA CRISPR screen by MAGeCK HCT116 replicate 1.
- https://cdn.elifesciences.org/articles/61797/elife-61797-fig1-data1-v2.docx
-
Figure 1—source data 2
Numerical data table for ORC1 tiling sgRNA CRISPR screen log fold depletion in Figure 1b.
Log fold depletion (LFC) for ORC1 tiling-sgRNA CRISPR screen by MAGeCK RPE-1.
- https://cdn.elifesciences.org/articles/61797/elife-61797-fig1-data2-v2.docx
Figure 1—figure supplement 1
Tiling-sgRNA CRISPR screen data and controls.
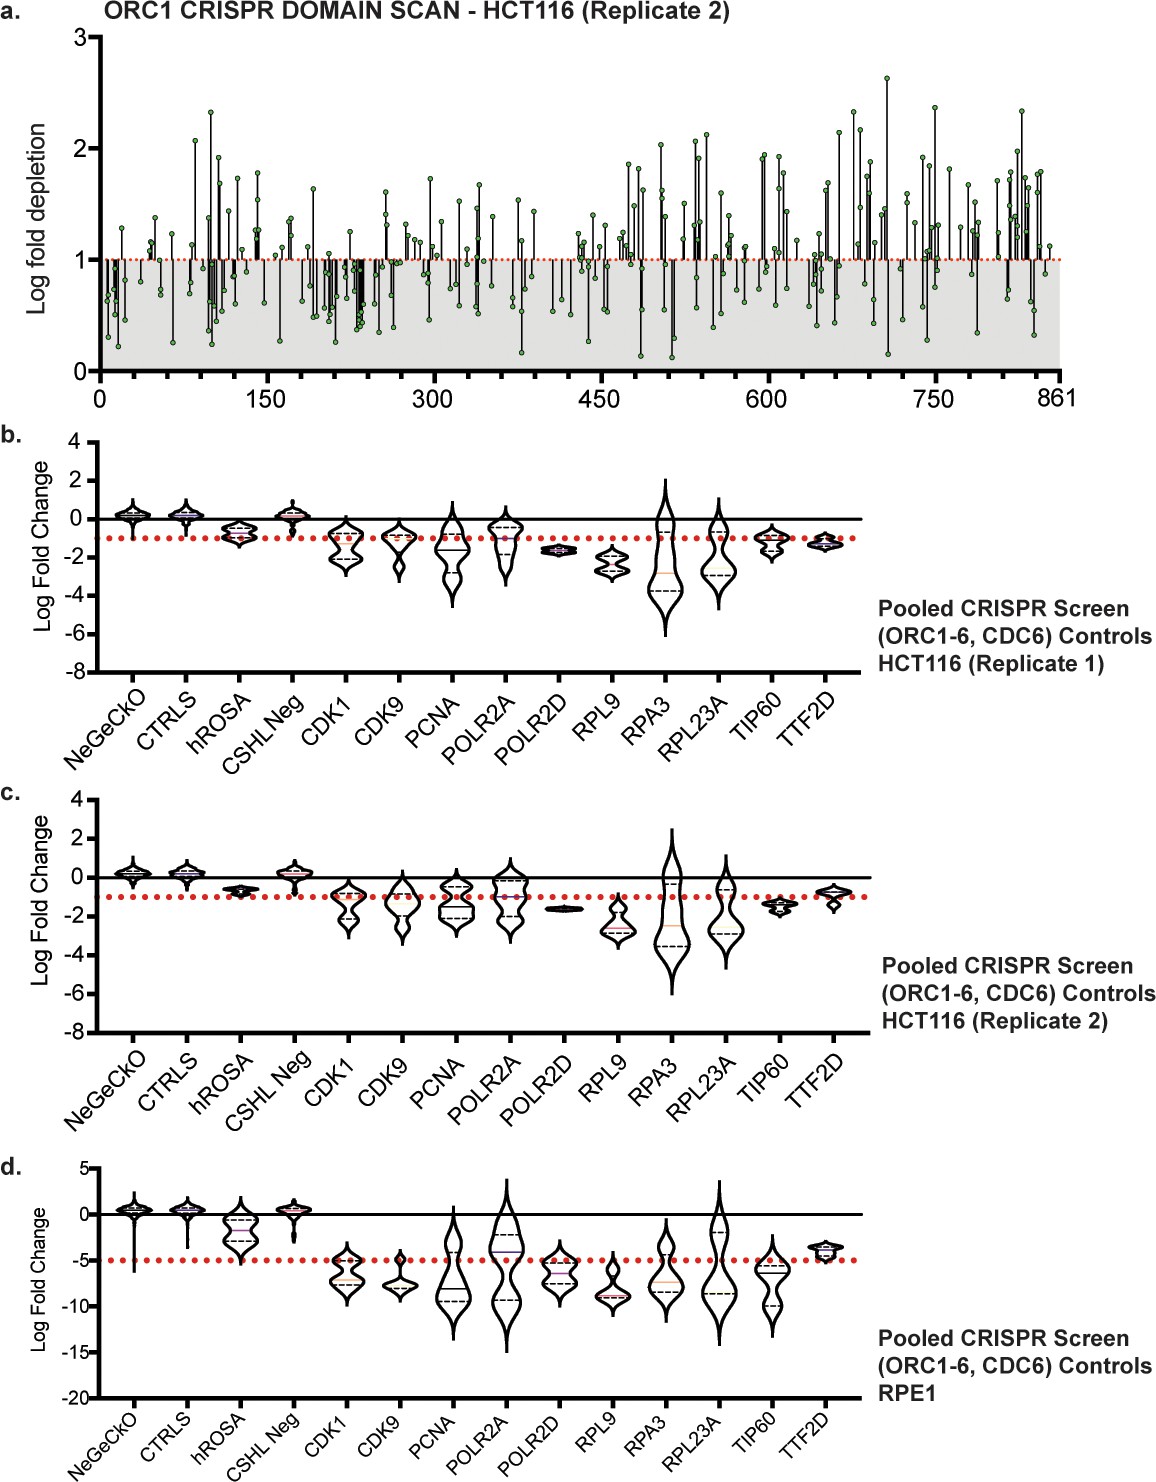
(a) tiling-sgRNA map of ORC1 (replicate 2) in HCT116. Mapped as Log fold depletion (inverted LFC scale) as calculated by MAGeCK (Li et al., 2014) on y axis vs the amino acid disrupted by that guide RNA on the x axis. Effect of guide RNA is interpreted as essential if its depletion is more than one log fold (red dotted line). Data mapped on 1 Log fold depletion pseudo-axis for clarity. (b) tiling-sgRNA controls for HCT116 (replicate 1). Violin plots mapped as distribution of Log fold depletion (MAGeCK) for each guide RNA from negative (NeGeCKO, CTRLS, hROSA, and CSHL-neg library) or positive control (CDK1, CDK9, PCNA, POLR2A, POLR2D, RPL9, RPA3, RPL23A, TIP60, TTF2D) subsets. The median and quartiles of LFC for each subset are indicated within their violin plots. Cut-off of essentiality is LFC ≥ 1 (log fold depletion), indicated by red dotted line (Highest log fold depletion value of all negative controls and more than the median of positive controls). (c) tiling-sgRNA controls for HCT116 (replicate 2). (d) tiling-sgRNA controls for RPE-1. Cut-off of essentiality is LFC ≥ 5, indicated by red dotted line.
Figure 1—figure supplement 2
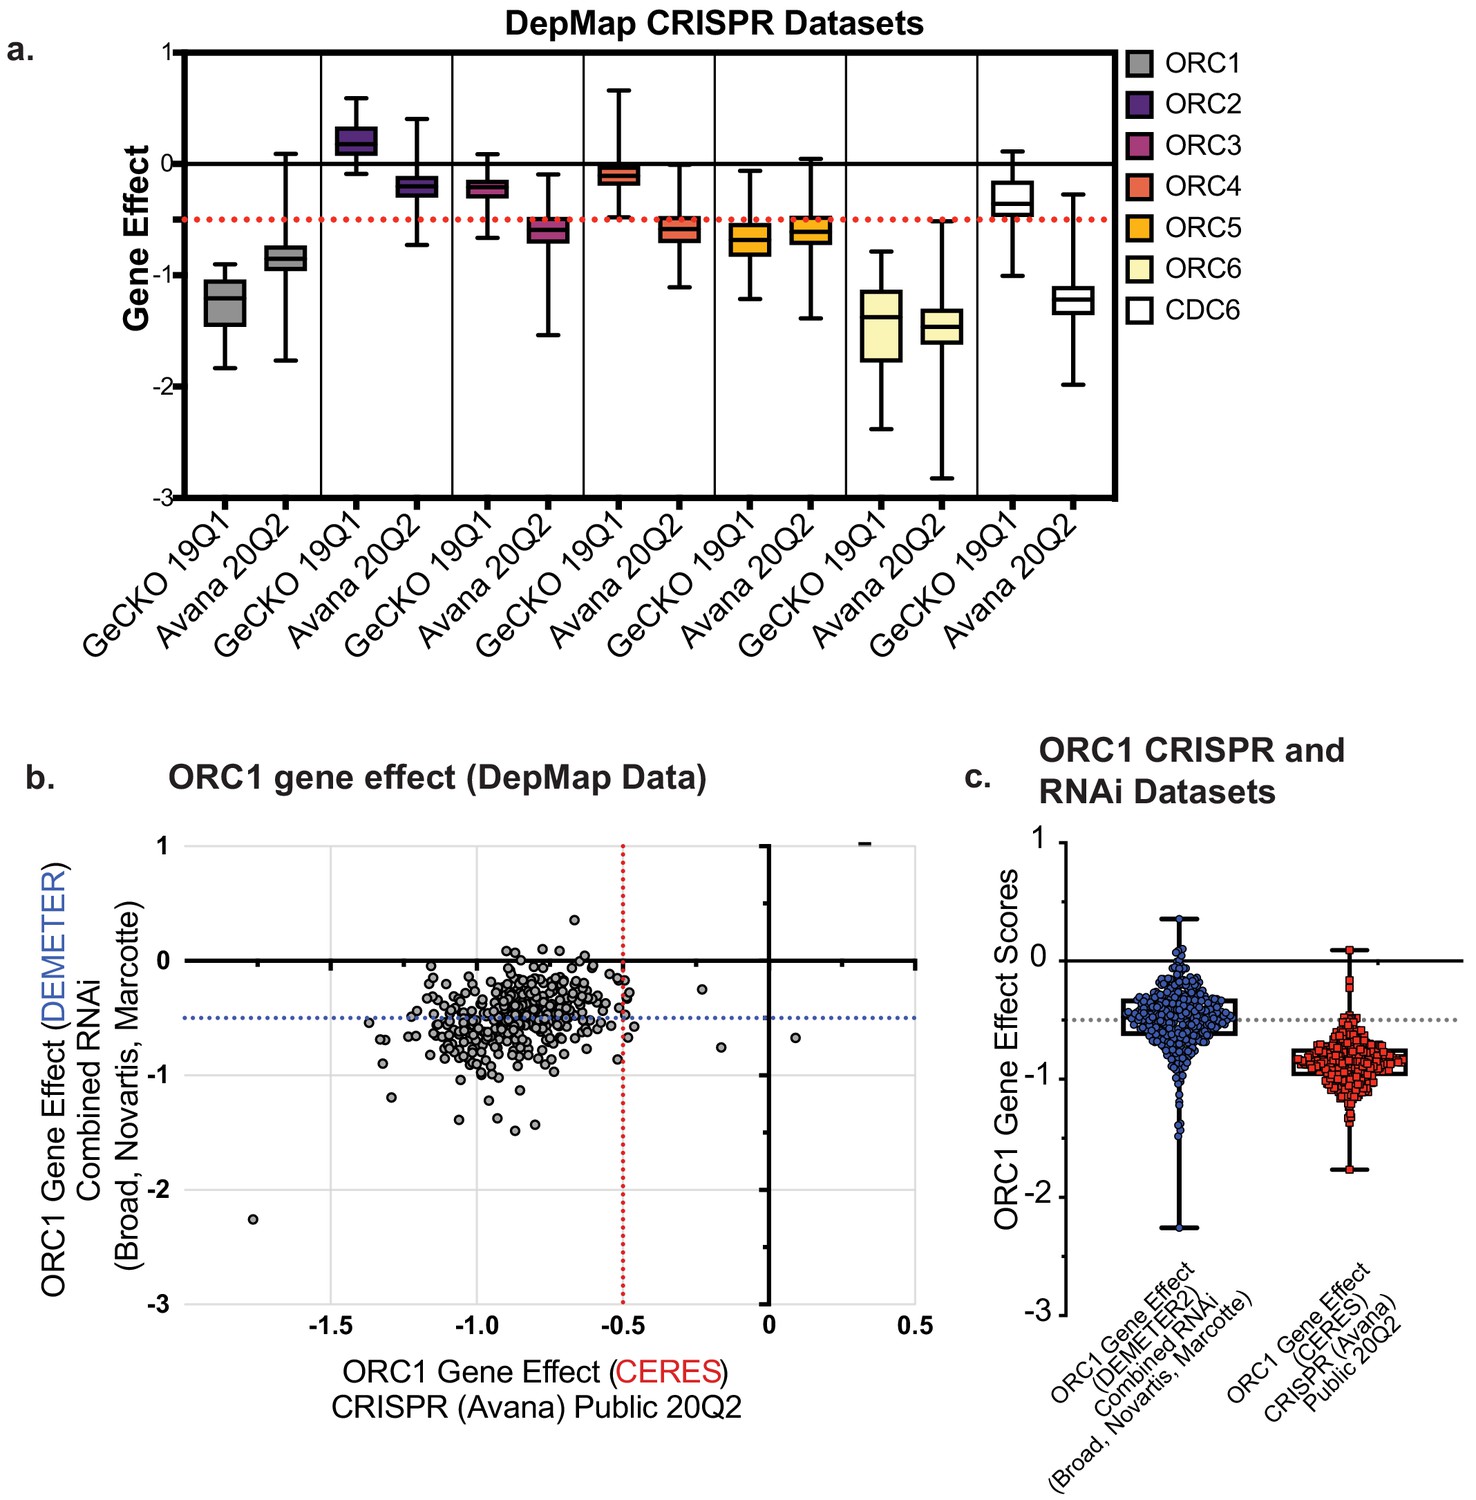
DepMap analyses of ORC1 data.
(a) Distribution of Gene Effect scores of ORC1-6 and CDC6 across all the cell lines used in either the GeCKO 19Q1 or Avana 20Q2 CRISPR screens reported on DepMap (DepMap, 2019): DepMap GeCKO 19Q1. figshare. Dataset. https://doi.org/10.6084/m9.figshare.7668407.v1, DepMap, Broad (2020): DepMap 20Q2 Public. figshare. Dataset. https://doi.org/10.6084/m9.figshare.12280541.v4, (Meyers et al., 2017). Each box plot represents gene effect range displayed in the tested cell lines. The red dotted line represents the gene effect score below which genes are scores as essential. (b) ORC1 gene effect values for CRISPR [CERES]; (Meyers et al., 2017) vs RNAi (DepMap, 2019; McFarland et al., 2018) mapped as xy scatter for ~ 390 common cell lines used in the screens. Red dotted line bifurcates the plot at CRISPR based gene effect score of less than −0.5 is considered essential to cell line. Blue dotted line bifurcates the plot at RNAi based gene effect score of less than −0.5 is considered essential to cell line. (c) Distribution of ORC1 gene effect scores across all the cell lines used in CRISPR Avana 20Q2 and RNAi datasets respectively (McFarland et al., 2018; Meyers et al., 2017).
Figure 2 with 13 supplements
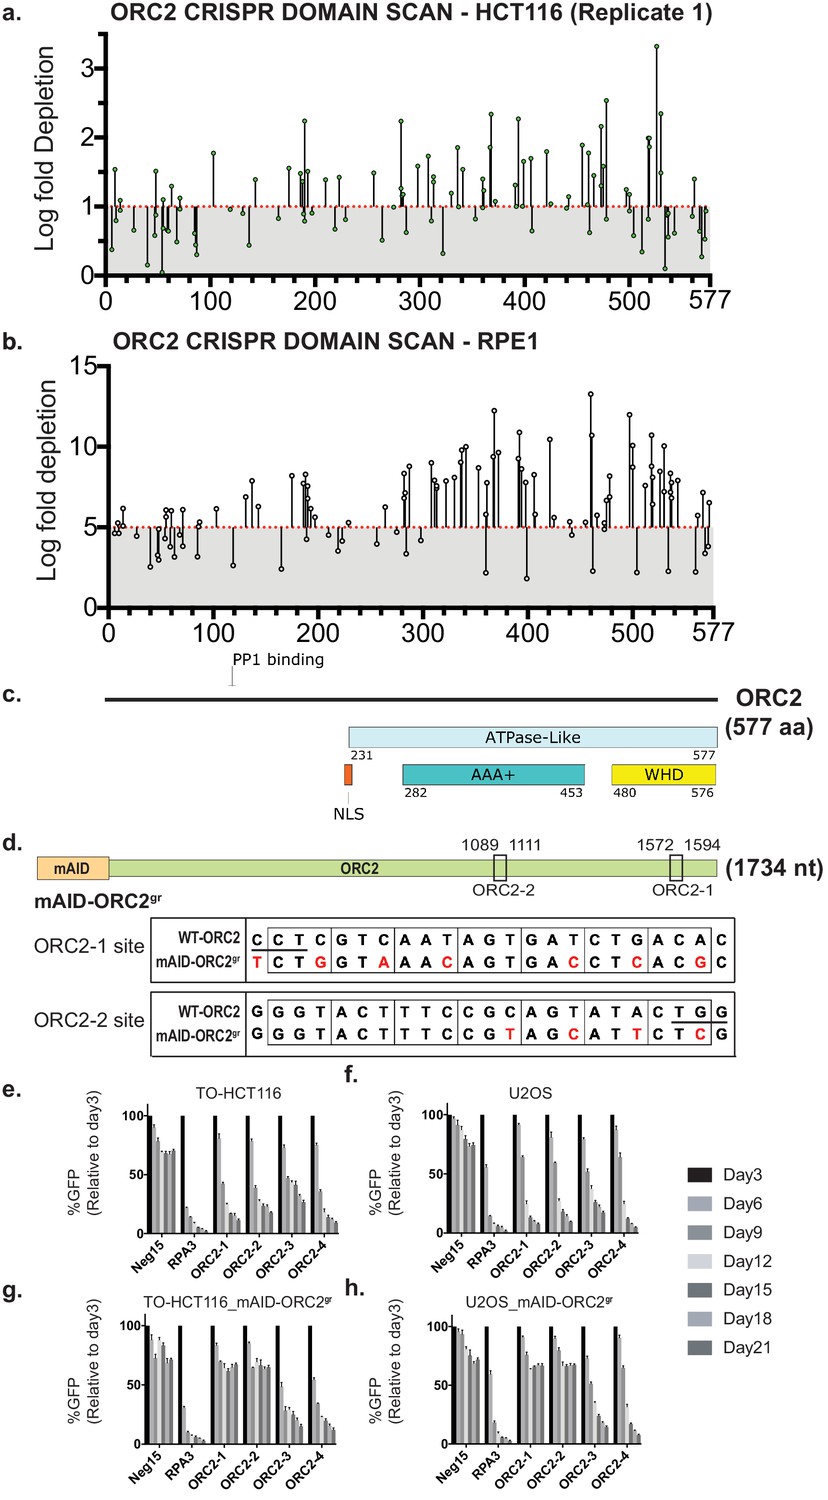
ORC2 is essential in HCT116 and RPE-1 by both tiling-sgRNA and single guide CRISPR knock-down.
(a) Tiling-sgRNA map of ORC2 (replicate 1) in HCT116. Mapped as Log fold depletion (inverted LFC scale) of guide RNAs as calculated by MAGeCK (Li et al., 2014) on y axis vs the amino acid(s) disrupted by that guide RNA on the x axis. Effect of guide RNA is interpreted as essential if its depletion is more than one log fold (red dotted line). Data mapped on one log fold depletion pseudo-axis for clarity (See Figure 2—source data 1). (b) Tiling-sgRNA map of ORC2 for RPE-1. Data mapped on 5 Log fold depletion pseudo-axis for clarity (See Figure 2—source data 2). (c) Schematic of ORC2 protein showing annotated structural or functional domains. (d) The top panel is the schematic of the mAID degron fused to ORC2 transgene at the N-terminus, and the two black rectangles indicate ORC2-1 and ORC2-2 sgRNAs targeting regions. The numbers represent nucleotide positions in the ORC2 cDNA. The lower two panels show the silent mutations (in red) around the sgRNA target sites introduced into mAID-ORC2gr compared to wild-type ORC2. Protospacer-adjacent motif (PAM) site is underlined in the wild-type sequence. (e–h) Negative-selection time course assay that plots the percentage of GFP-positive cells over time following transduction with the indicated sgRNAs. Experiments were performed in (e) TO-HCT116, (f) U2OS, (g) TO-HCT116_mAID-ORC2gr, and (h) U2OS_mAID-ORC2gr cell lines. The GFP-positive percentages were normalized to the Day3 measurement. n = 3. Error bars, mean ± SD.
-
Figure 2—source data 1
Numerical data table for ORC2 tiling sgRNA CRISPR screen log fold depletion in Figure 2a.
Log fold depletion (LFC) for ORC2 tiling-sgRNA CRISPR screen by MAGeCK HCT116 replicate 1.
- https://cdn.elifesciences.org/articles/61797/elife-61797-fig2-data1-v2.docx
-
Figure 2—source data 2
Numerical data table for ORC1 tiling sgRNA CRISPR screen log fold depletion in Figure 2b.
Log fold depletion (LFC) for ORC2 tiling-sgRNA CRISPR screen by MAGeCK RPE-1.
- https://cdn.elifesciences.org/articles/61797/elife-61797-fig2-data2-v2.docx
Figure 2—figure supplement 1
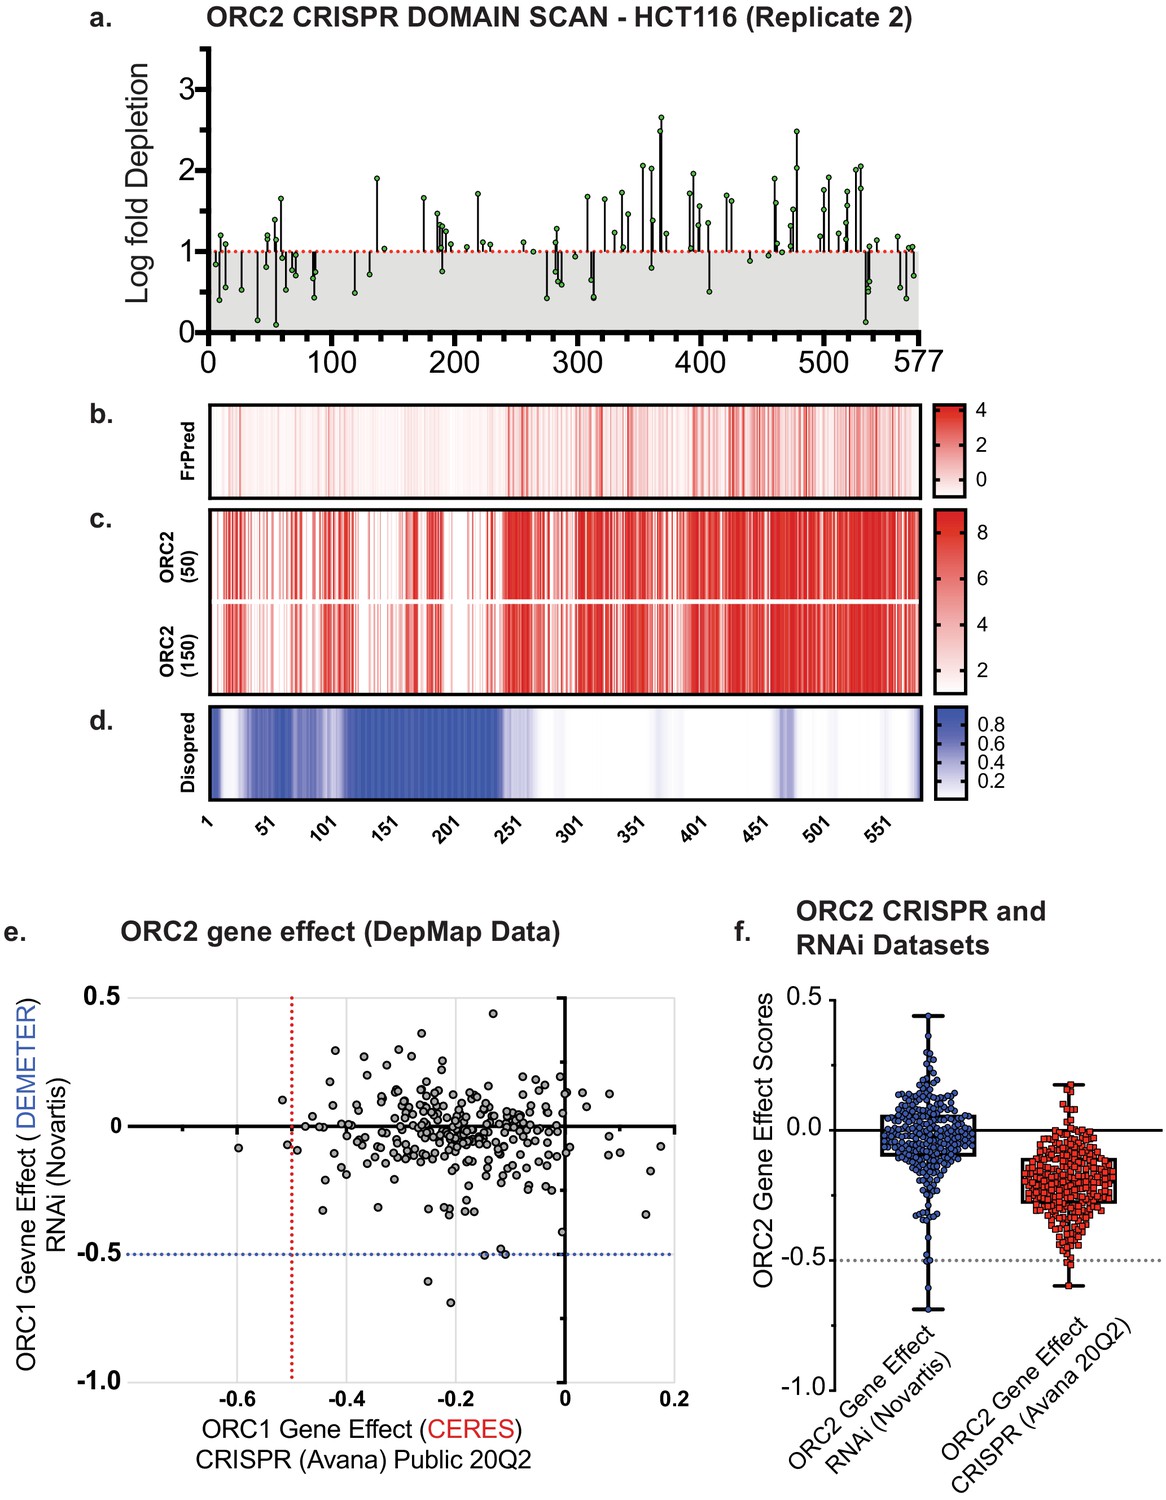
(a) Tiling-sgRNA map of ORC2 (replicate 2) in HCT116.
(b) FrPred (https://toolkit.tuebingen.mpg.de/frpred) of hORC2 (NP_006181.1) shown as gradient heat map of conservation score vs amino acid position. (d) Consurf (https://consurf.tau.ac.il/) of hORC2 – (upper) ORC2 (50) subset (50 HMMER Homologues collected from UNIREF90 database, Max sequence identity = 95%, Min sequence identity 50, Other parameters = default), and (lower) ORC2 (150) subset (150 HMMER Homologues collected from UNIREF90 database, Max sequence identity = 95%, Min sequence identity 35, Other parameters = default). Data represented as heatmap of Conservation scores of each amino acid position. (e) Disopred (http://bioinf.cs.ucl.ac.uk/psipred/) plot of hORC2 – heatmap representing amino acids within intrinsically disordered regions of the protein.
Figure 2—figure supplement 2
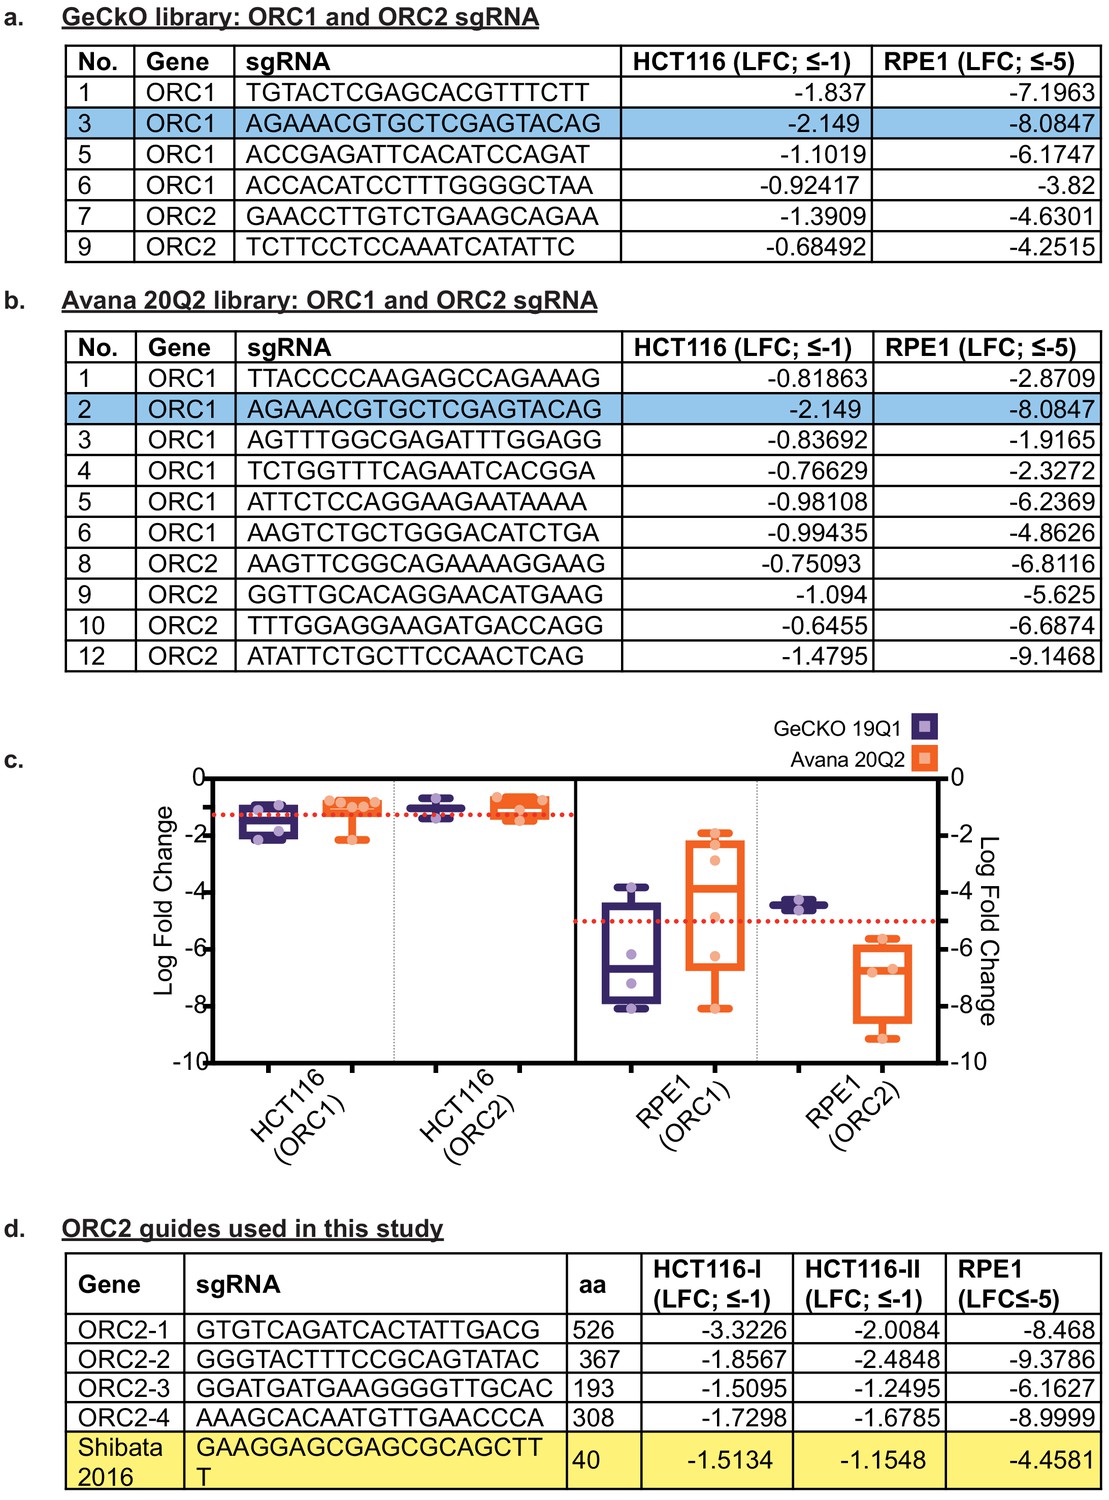
Table of guide RNAs.
(a) Table listing guide RNA sequences used in GeCKO 19Q1 library against ORC1 and ORC2 that were also present in our tiling-sgRNA screen; columns HCT116(LFC ≤ −1) and RPE-1(LFC ≤−5) show the LFC of the GeCKO guides in our screen. (b) Table listing guide RNA sequences used in Avana 20Q2 library against ORC1 and ORC2 that were also present in our tiling-sgRNA screen; columns HCT116(LFC ≤ −1) and RPE-1(LFC ≤−5) show the LFC of the GeCKO guides in our screen. Rows highlighted blue represent the only common guide against ORC1 used between GeCKO and Avana screens (c) Distribution of the LFC values for the GeCKO and Avana guides in HCT116 and RPE-1 (graphical representation of the tables (a) and (b)). (d) ORC2 guides selected for single guide studies. Row highlighted yellow – guide RNA sequence used in the Shibata et al., 2016 study.
Figure 2—figure supplement 3
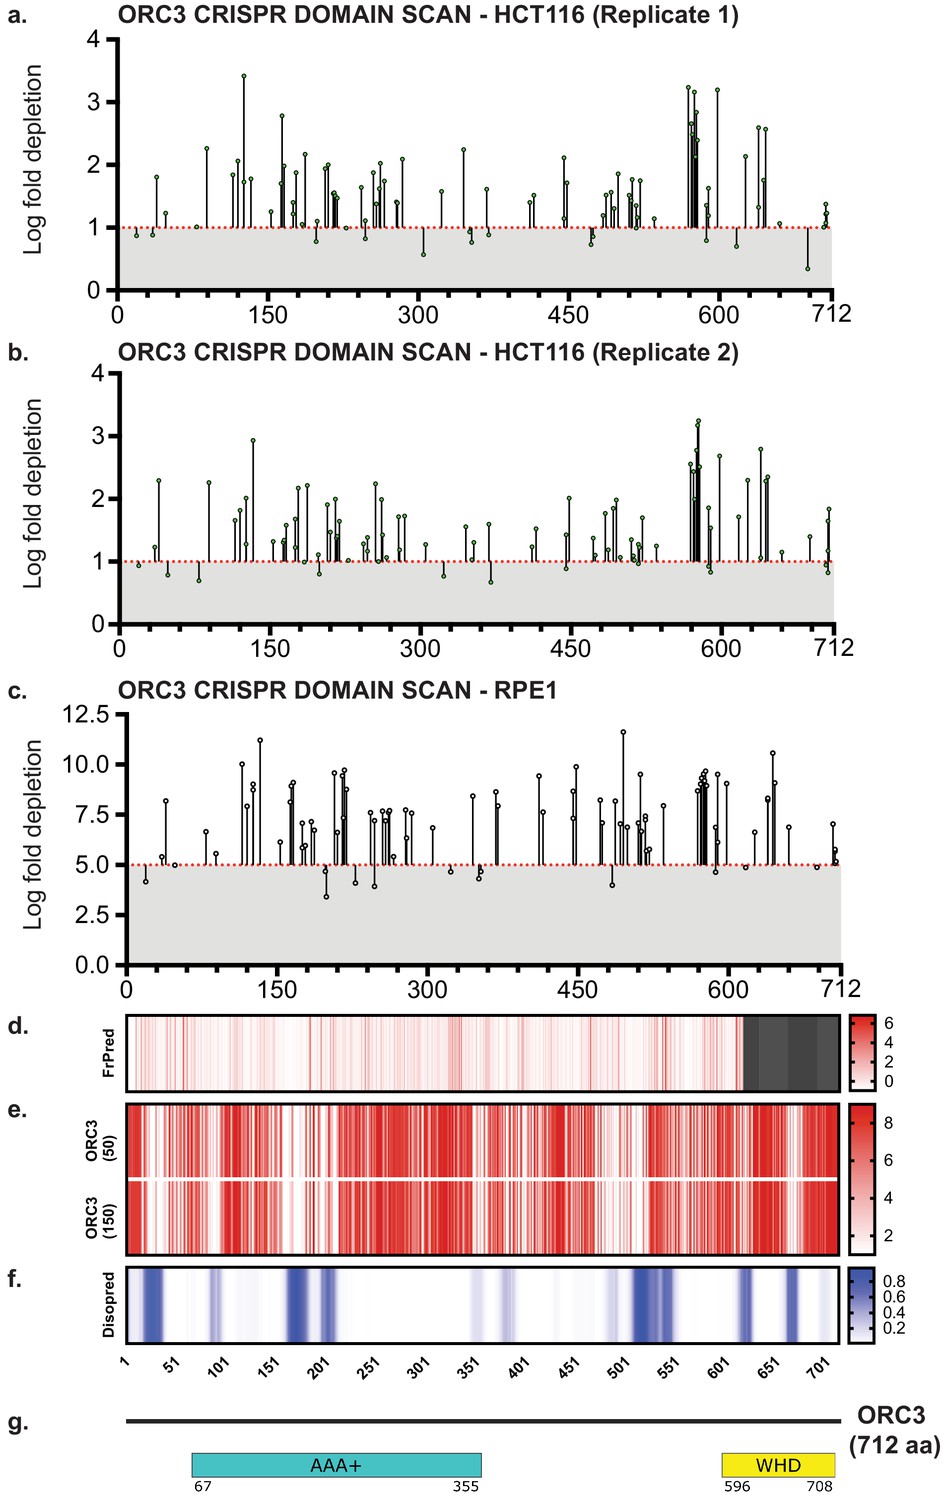
Tiling-sgRNA CRISPR screen data contd.
(a) tiling-sgRNA map of ORC3 in HCT116 (replicate 1). Mapped as Log fold depletion as calculated by MAGeCK on y axis vs the amino acid(s) disrupted by that guide RNA on the x axis. Effect of guide RNA is interpreted as essential if its depletion is more than one log fold (red dotted line). (b) tiling-sgRNA map of ORC3 for HCT116 (replicate 2). (c) tiling-sgRNA map of ORC3 for RPE-1 cell line. Cutt-off of essentiality is LFC ≥ −5, indicated by red dotted line. (d) FrPred of hORC3 (NP_862820.1) shown as gradient heat map of conservation score vs amino acid position. (e) Consurf of hORC3 – (upper) ORC3 (50) subset (50 HMMER Homologues collected from UNIREF90 database, Max sequence identity = 95%, Min sequence identity 50, Other parameters = default), and (lower) ORC3 (150) subset (150 HMMER Homologues collected from UNIREF90 database, Max sequence identity = 95%, Min sequence identity 35, Other parameters = default). Data represented as heatmap of Conservation scores of each amino acid position. (f) Disopred plot of hORC3 – heatmap representing amino acids within intrinsically disordered regions of the protein. (g) Schematic of domain architecture of ORC3.
Figure 2—figure supplement 4
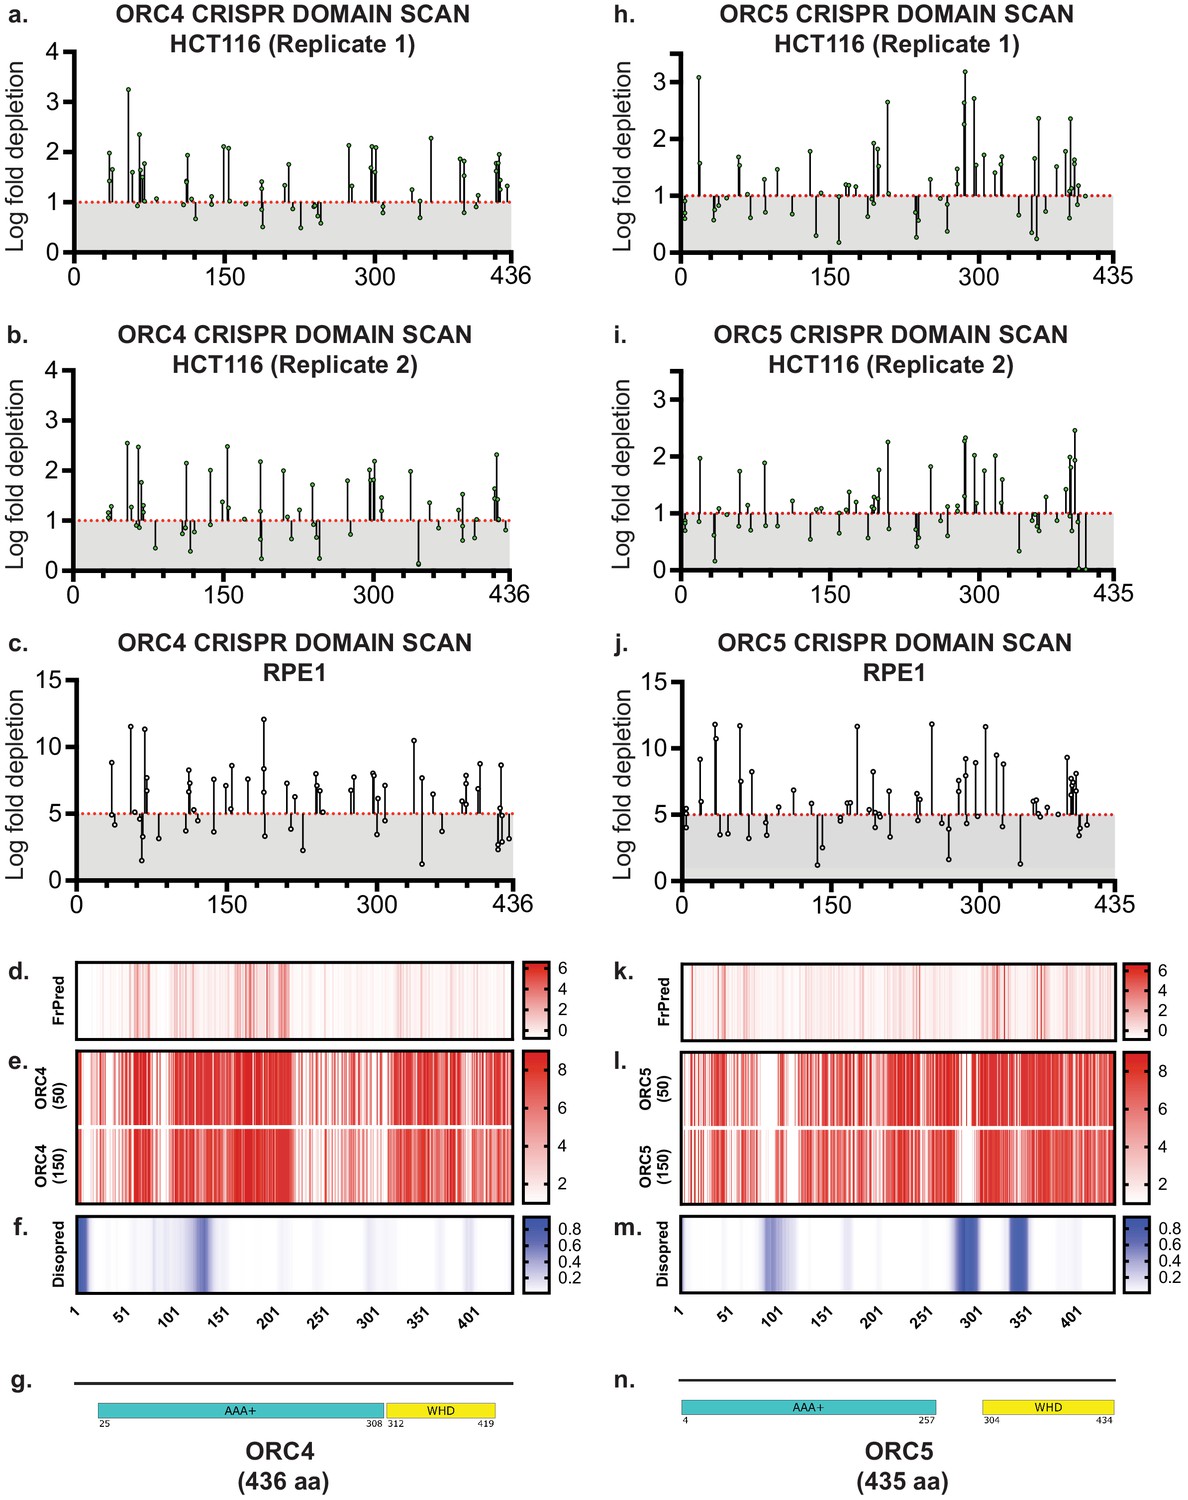
Tiling-sgRNA CRISPR screen data contd.
(a) tiling-sgRNA map of ORC4 in HCT116 (replicate 1). Mapped as Log fold depletion as calculated by MAGeCK on y axis vs the amino acid(s) disrupted by that guide RNA on the x axis. Effect of guide RNA is interpreted as essential if its depletion is more than one log fold (red dotted line). (b) tiling-sgRNA map of ORC4 for HCT116 (replicate 2). (c) tiling-sgRNA map of ORC4 for RPE-1 cell line. Cutt-off of essentiality is LFC ≥ −5, indicated by red dotted line. (d) FrPred of hORC4 (NP_859525.1) shown as gradient heat map of conservation score vs amino acid position. (e) Consurf of hORC4 – (upper) ORC4 (50) subset (50 HMMER Homologues collected from UNIREF90 database, Max sequence identity = 95%, Min sequence identity 50, Other parameters = default), and (lower) ORC4 (150) subset (150 HMMER Homologues collected from UNIREF90 database, Max sequence identity = 95%, Min sequence identity 35, Other parameters = default). Data represented as heatmap of Conservation scores of each amino acid position. (f) Disopred plot of hORC4 – heatmap representing amino acids within intrinsically disordered regions of the protein. (g) Schematic of domain architecture of ORC4. (h) tiling-sgRNA map of ORC5 in HCT116 (replicate 1). (i) tiling-sgRNA map of ORC5 for HCT116 (replicate 2). (j) tiling-sgRNA map of ORC5 for RPE-1 cell line. (k) FrPred of hORC5 (NP_002544.1) shown as gradient heat map of conservation score vs amino acid position. (e) Consurf of hORC5 – (upper) ORC5 (50) subset and (lower) ORC5 (150) subset. Data represented as heatmap of Conservation scores of each amino acid position. (f) Disopred plot of hORC5 – heatmap representing amino acids within intrinsically disordered regions of the protein. (g) Schematic of domain architecture of ORC5.
Figure 2—figure supplement 5
Tiling-sgRNA CRISPR screen data contd.
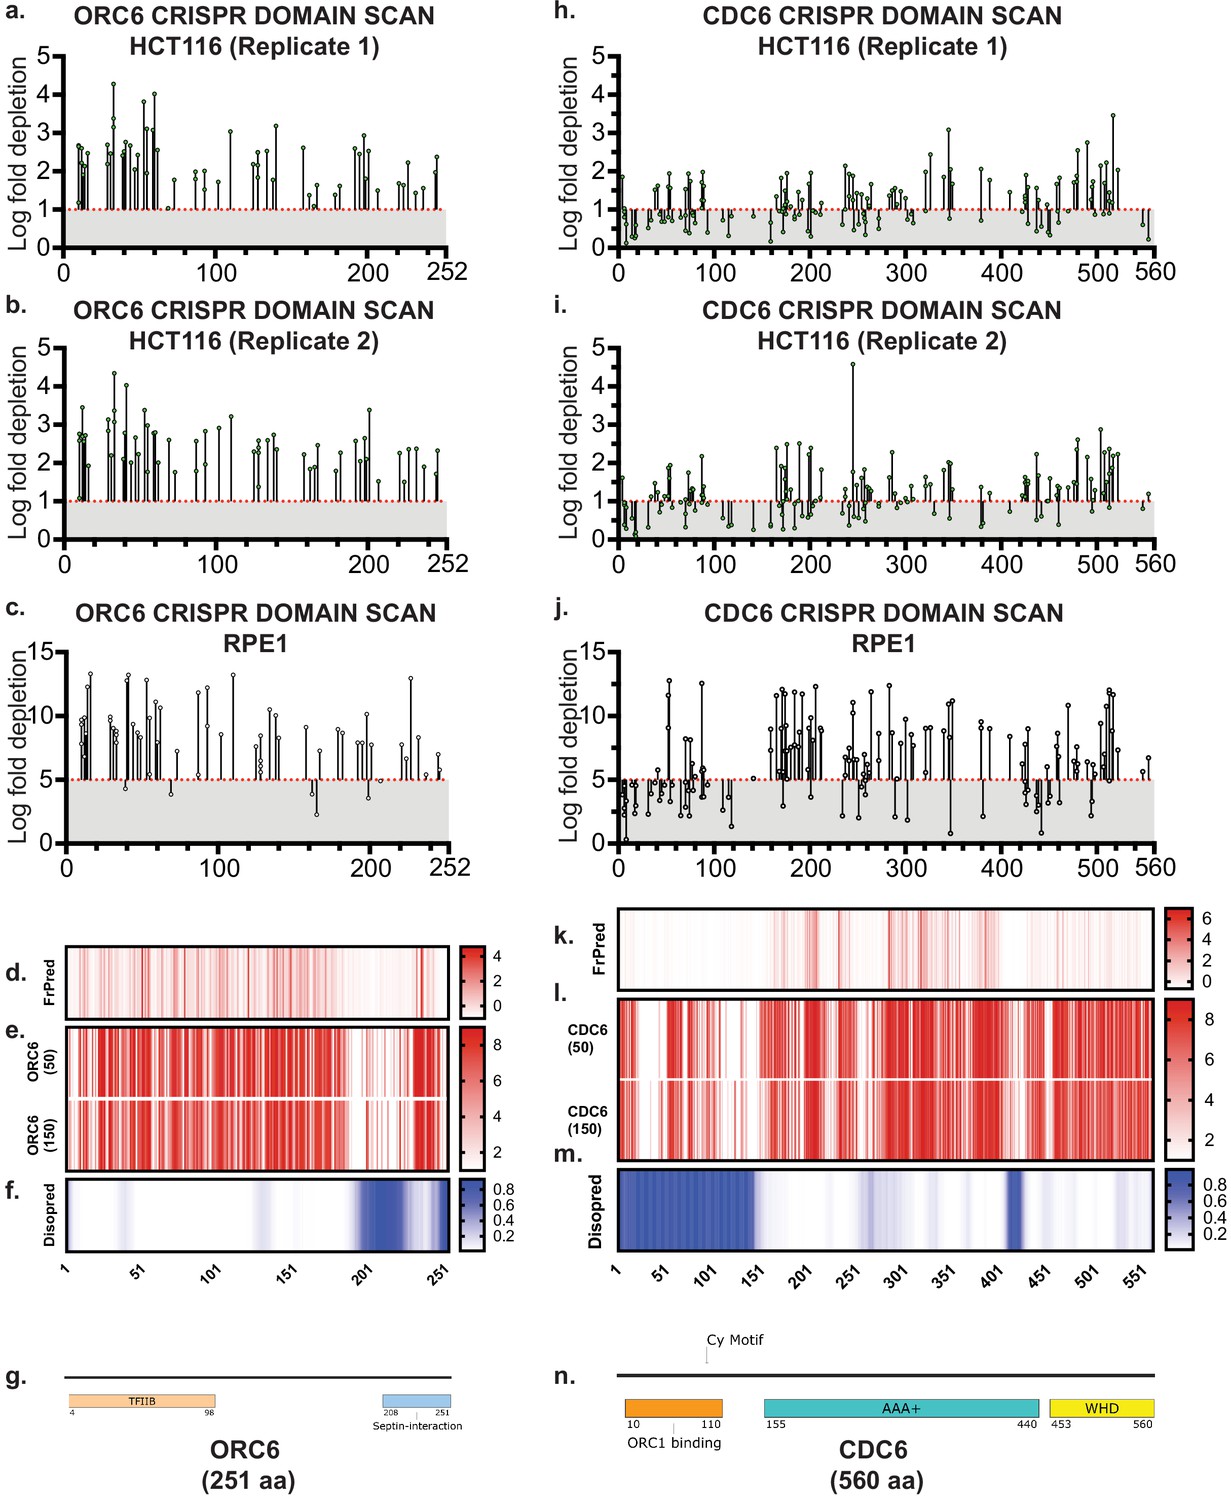
(a) Tiling-sgRNA map of ORC6 in HCT116 (replicate 1). Mapped as Log fold depletion as calculated by MAGeCK on y axis vs the amino acid(s) disrupted by that guide RNA on the x axis. Effect of guide RNA is interpreted as essential if its depletion is more than one log fold (red dotted line). (b) Tiling-sgRNA map of ORC6 for HCT116 (replicate 2). (c) Tiling-sgRNA map of ORC6 for RPE-1 cell line. Cutt-off of essentiality is LFC ≥ −5, indicated by red dotted line. (d) FrPred of hORC6 (NP_055136.1) shown as gradient heat map of conservation score vs amino acid position. (e) Consurf of hORC6 – (upper) ORC6 (50) subset and (lower) ORC6 (150) (f) Disopred plot of hORC6-heatmap representing amino acids within intrinsically disordered regions of the protein. (g) Schematic of domain architecture of ORC6. (h) tiling-sgRNA map of CDC6 in HCT116 (replicate 1). (i) Tiling-sgRNA map of CDC6 for HCT116 (replicate 2). (j) Tiling-sgRNA map of CDC6 for RPE-1 cell line. (k) FrPred of hCDC6 (NP_001245.1) shown as gradient heat map of conservation score vs amino acid position. (e) Consurf of hCDC6 – (upper) CDC6 (50) subset and (lower) ORC5 (150) subset. Data represented as heatmap of Conservation scores of each amino acid position. (f) Disopred plot of hCDC6 – heatmap representing amino acids within intrinsically disordered regions of the protein. (g) Schematic of domain architecture of hCDC6.
Figure 2—figure supplement 6
Analysis of ORC1-6, CDC6 tiling-sgRNA CRISPR screens.
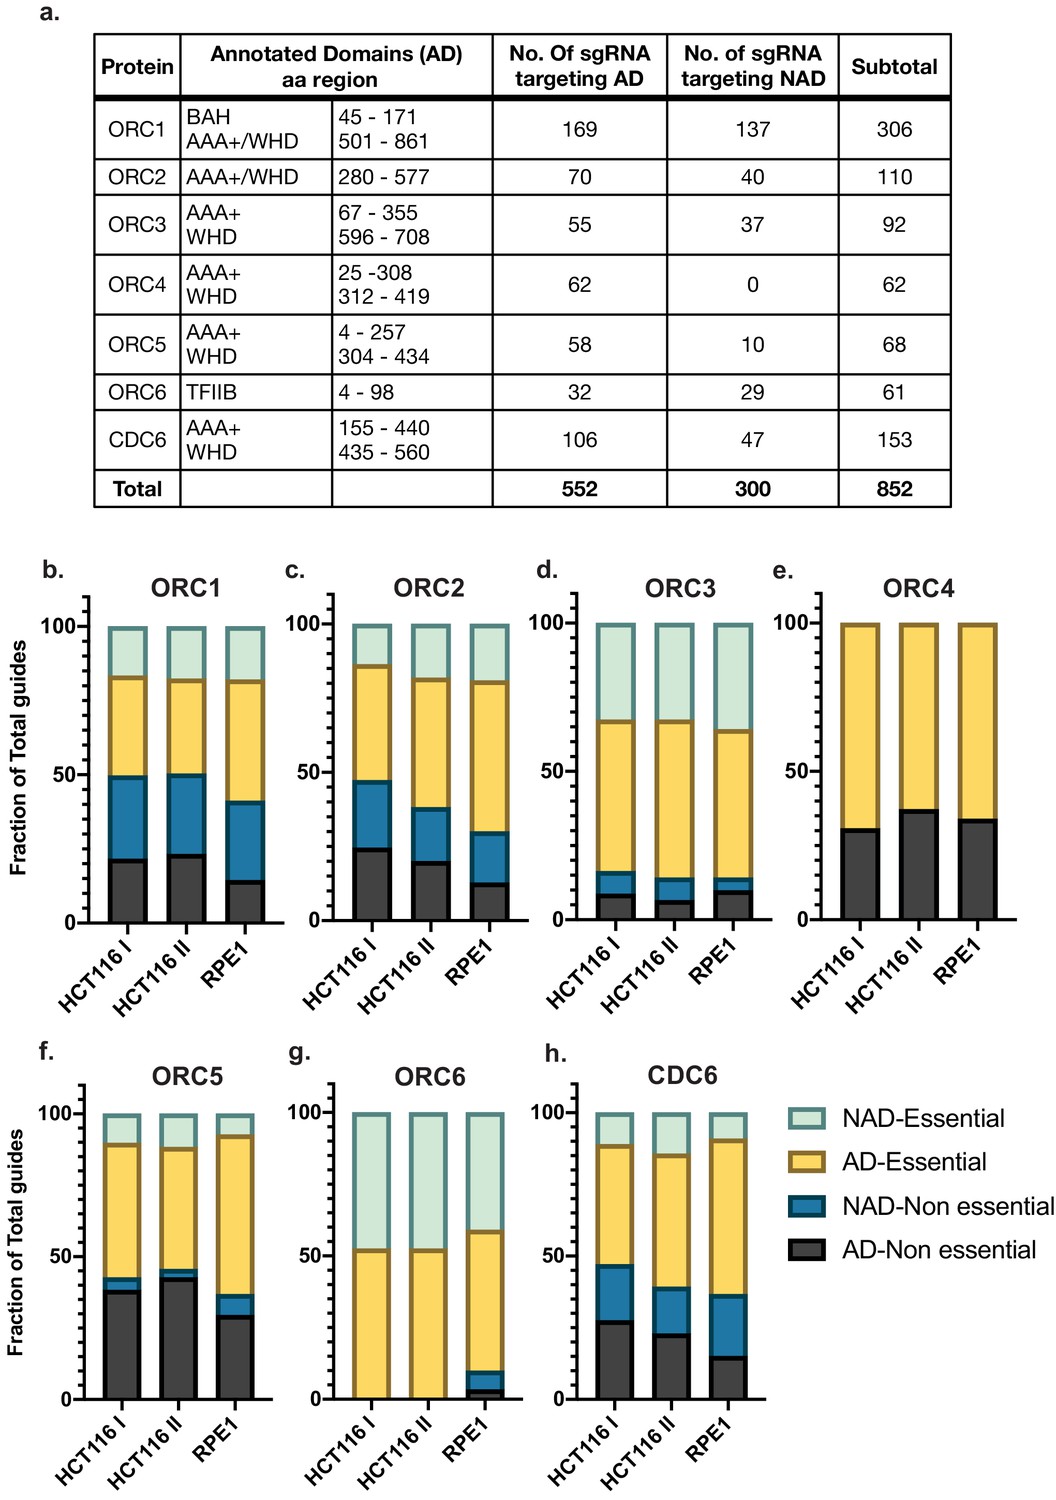
(a) Table listing annotated domains from Pfam database and structural studies in ORC1-6 and CDC6. It also lists the number of guides recovered in our sequencing datasets targeting either Annotated Domain (AD) regions or Non-Annotated Domain (NAD) regions (Total input library was 882 guides;~30 guides from the ORC3 library were consistently absent in the initial time harvest to start with). (b–h) Fractions of AD and NAD targeting guide RNAs classified as essential or non-essential in the tiling-sgRNA CRISPR screens. Data represented as percent of total guide RNAs targeting the protein. Stacked histograms represent individual screens - HCT116 I (replicate 1), HCT116 II (replicate 2), and RPE-1.
Figure 2—figure supplement 7

Guide RNAs targeting annotated domains show a higher negative selection phenotype.
(a) Distribution of LFC values of all guide RNAs (ORC1-6, CDC6) targeting all annotated domains (AD) (red) or non-annotated domains (NAD) (gray) regions. Significance (p value) calculated using non-parametric Mann-Whitney t-test to compare ranks. Error bars depict median and interquartile ranges of distributions. (b) Heatmap of correlation matrix for the three tiling-sgRNA screens. r values were computed by Spearman Correlation for each pair at a confidence interval of 99%.
Figure 2—figure supplement 8
Identification of CKHS regions in ORC1 using Protiler.
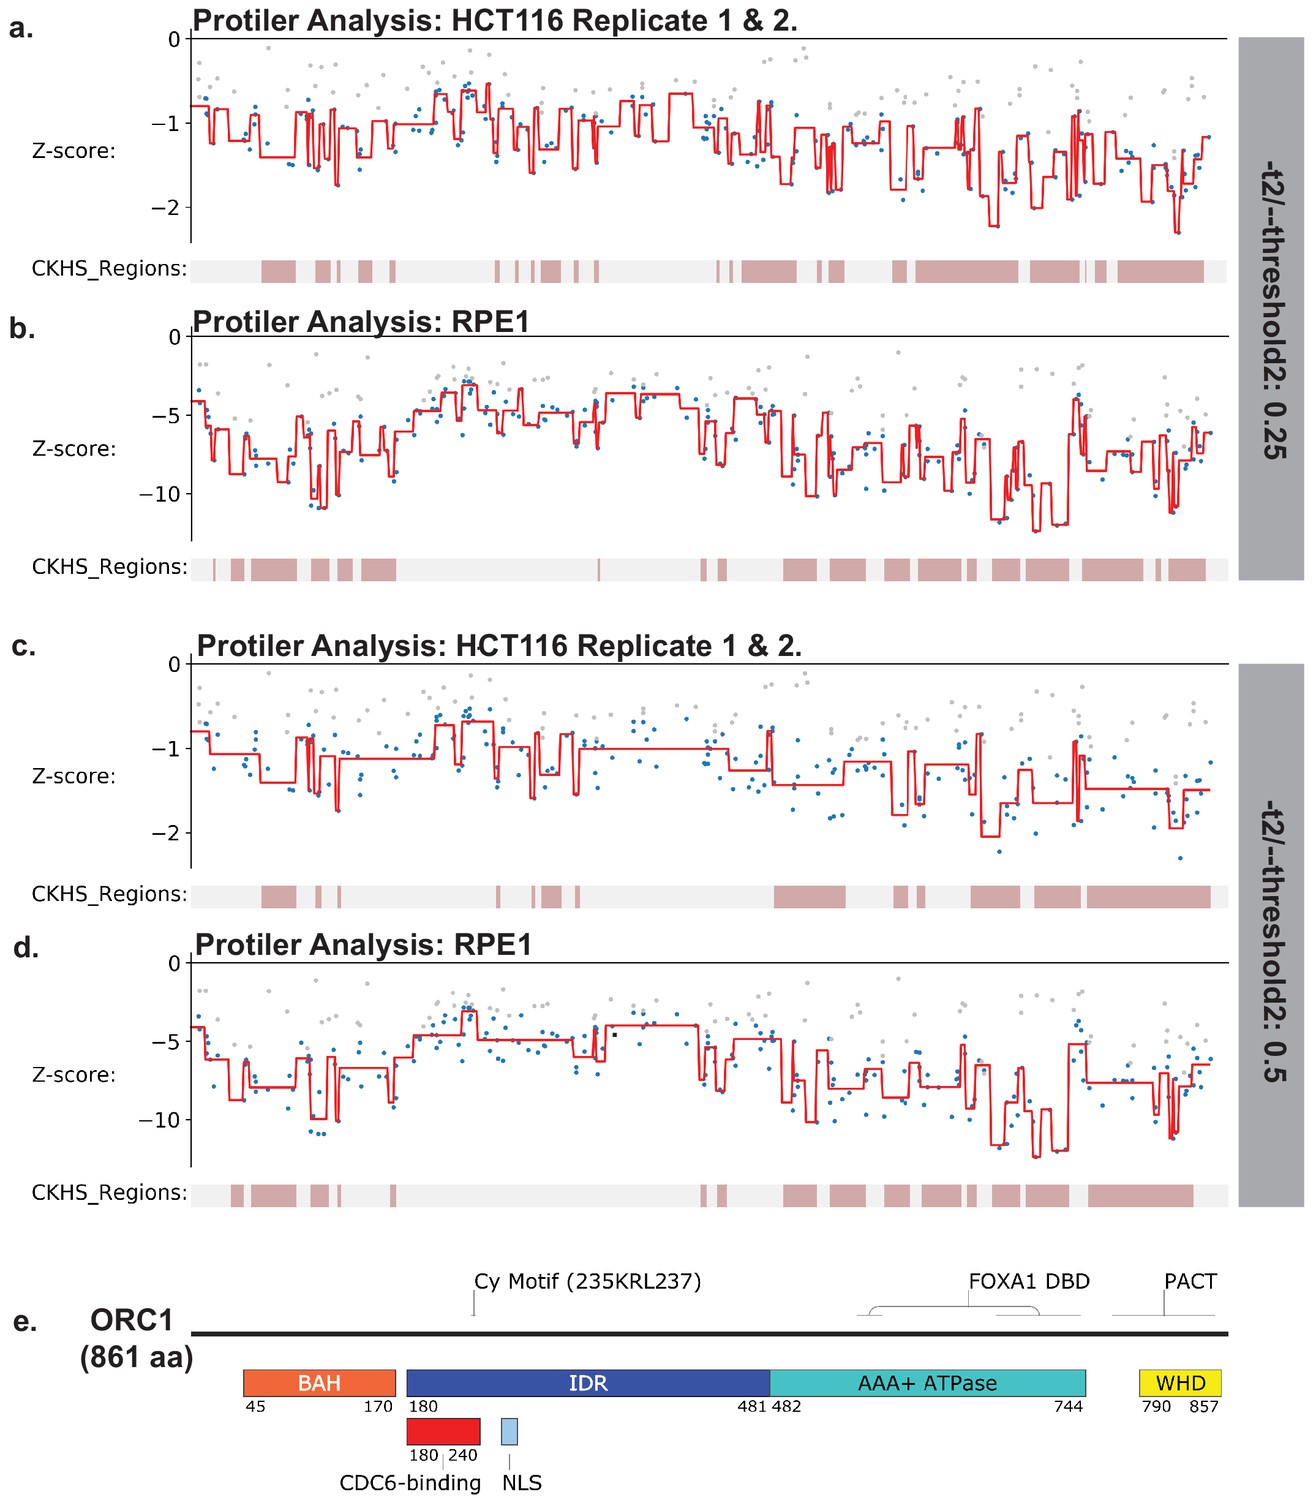
Protiler computational pipeline was run on LFC values of guide RNAs for either for the average of the two HCT116 replicates or RPE-1 at two different TGUH thresholds. (a–b) -t2/--threshold2=0.25. (c–d) -t2/--threshold2=0.5. (e) Schematic of ORC1 highlighting annotated domains, IDRs and regions of known function.
Figure 2—figure supplement 9
Identification of CKHS regions in ORC2 using Protiler.
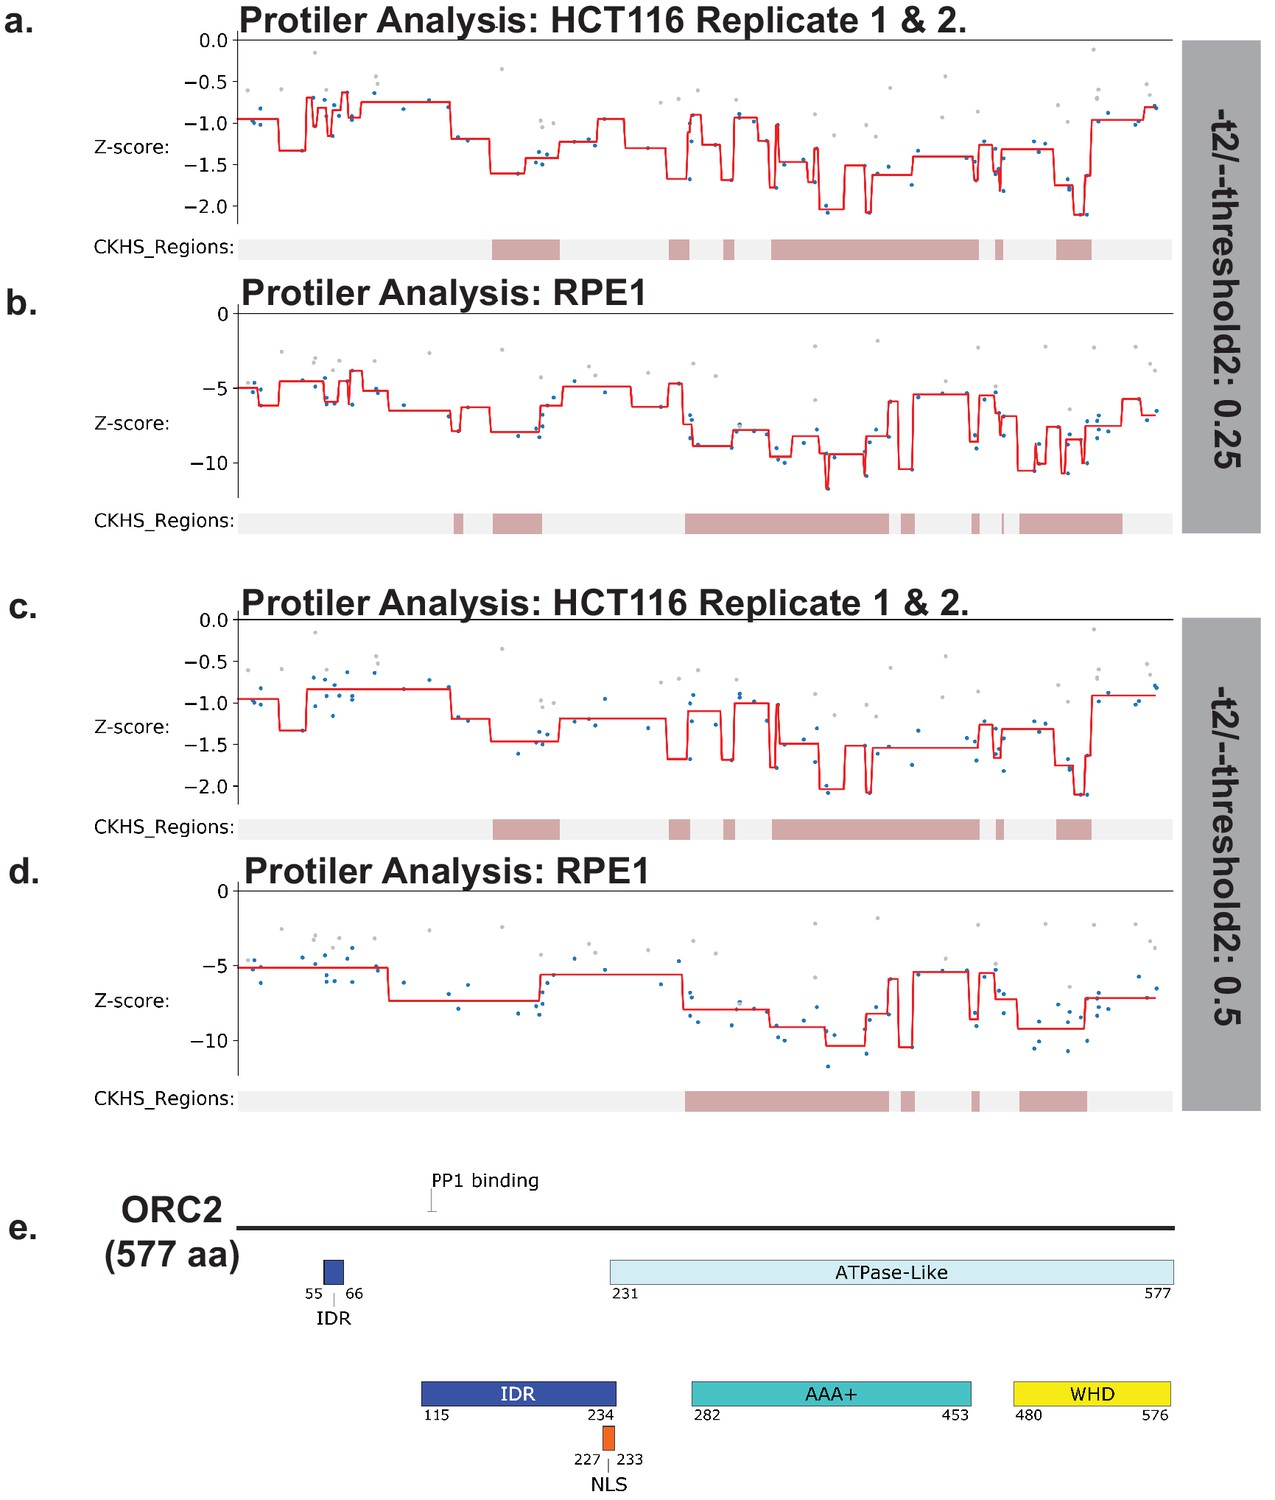
Protiler computational pipeline was run on LFC values of guide RNAs for either for the average of the two HCT116 replicates or RPE-1 at two different TGUH thresholds. (a–b) -t2/--threshold2=0.25. (c–d) -t2/--threshold2=0.5. (e) Schematic of ORC2 highlighting annotated domains, IDRs and regions of known function.
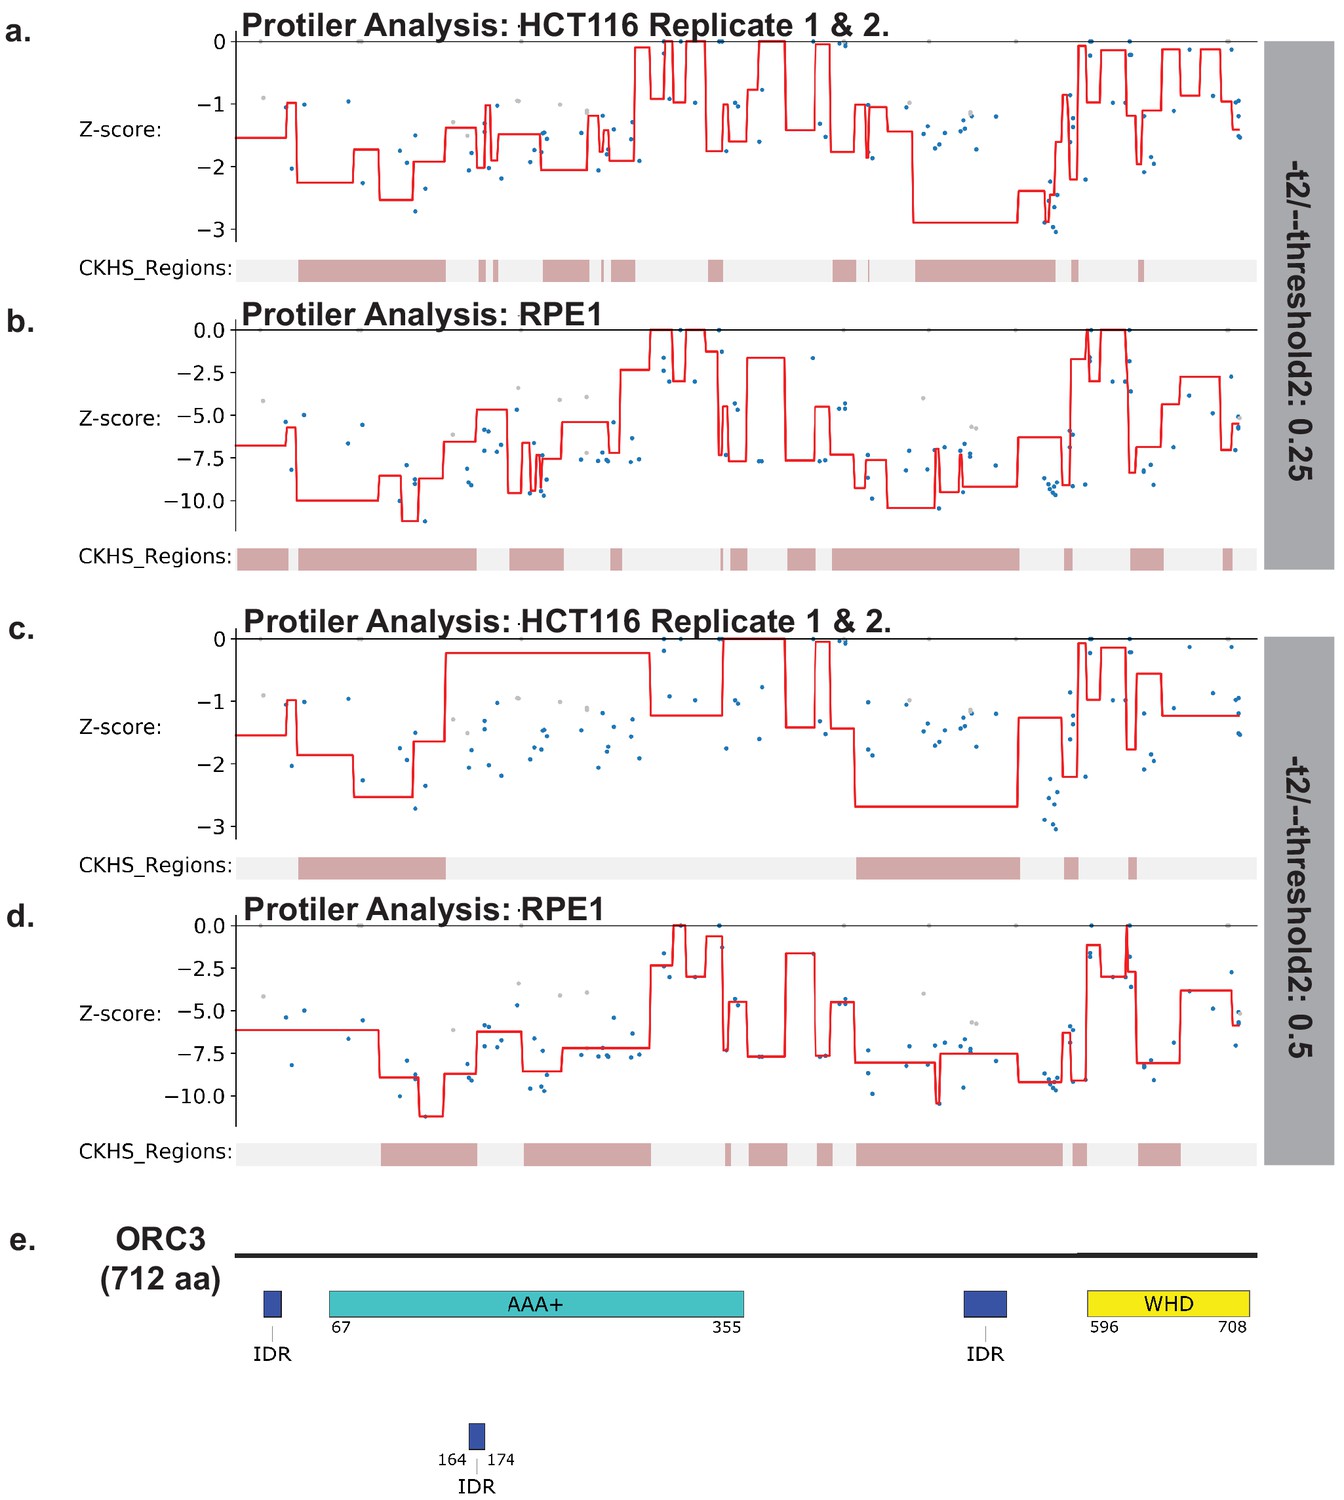
Figure 2—figure supplement 10
Identification of CKHS regions in ORC3 using Protiler.
Protiler computational pipeline was run on LFC values of guide RNAs for either for the average of the two HCT116 replicates or RPE-1 at two different TGUH thresholds. (a–b) -t2/--threshold2=0.25. (c–d) -t2/--threshold2=0.5. (e) Schematic of ORC3 highlighting annotated domains, IDRs and regions of known function.
Figure 2—figure supplement 11
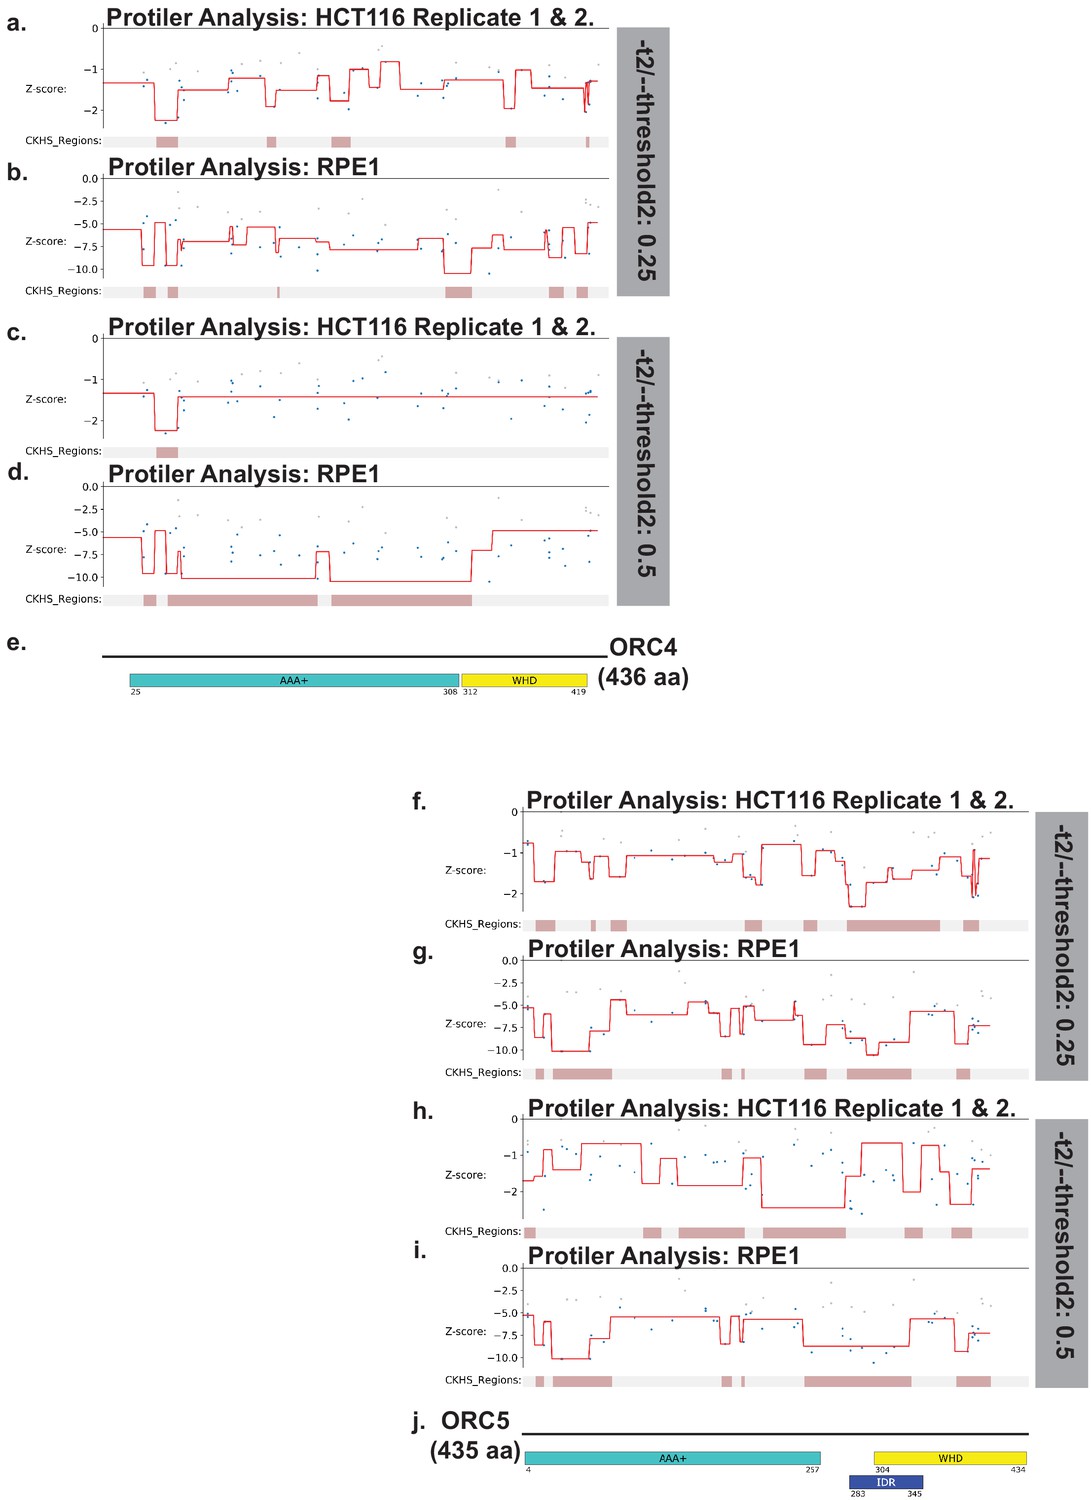
Identification of CKHS regions in ORC4 and ORC5 using Protiler.
Protiler computational pipeline was run on LFC values of guide RNAs for either for the average of the two HCT116 replicates or RPE-1 at two different TGUH thresholds. ORC4 (a–b) -t2/--threshold2=0.25. (c–d) -t2/--threshold2=0.5. (e) Schematic of ORC4 highlighting annotated domains, IDRs and regions of known function. ORC5 (f–g) -t2/--threshold2=0.25. (h–i) -t2/--threshold2=0.5. (j) Schematic of ORC4 highlighting annotated domains, IDRs and regions of known function.
Figure 2—figure supplement 12
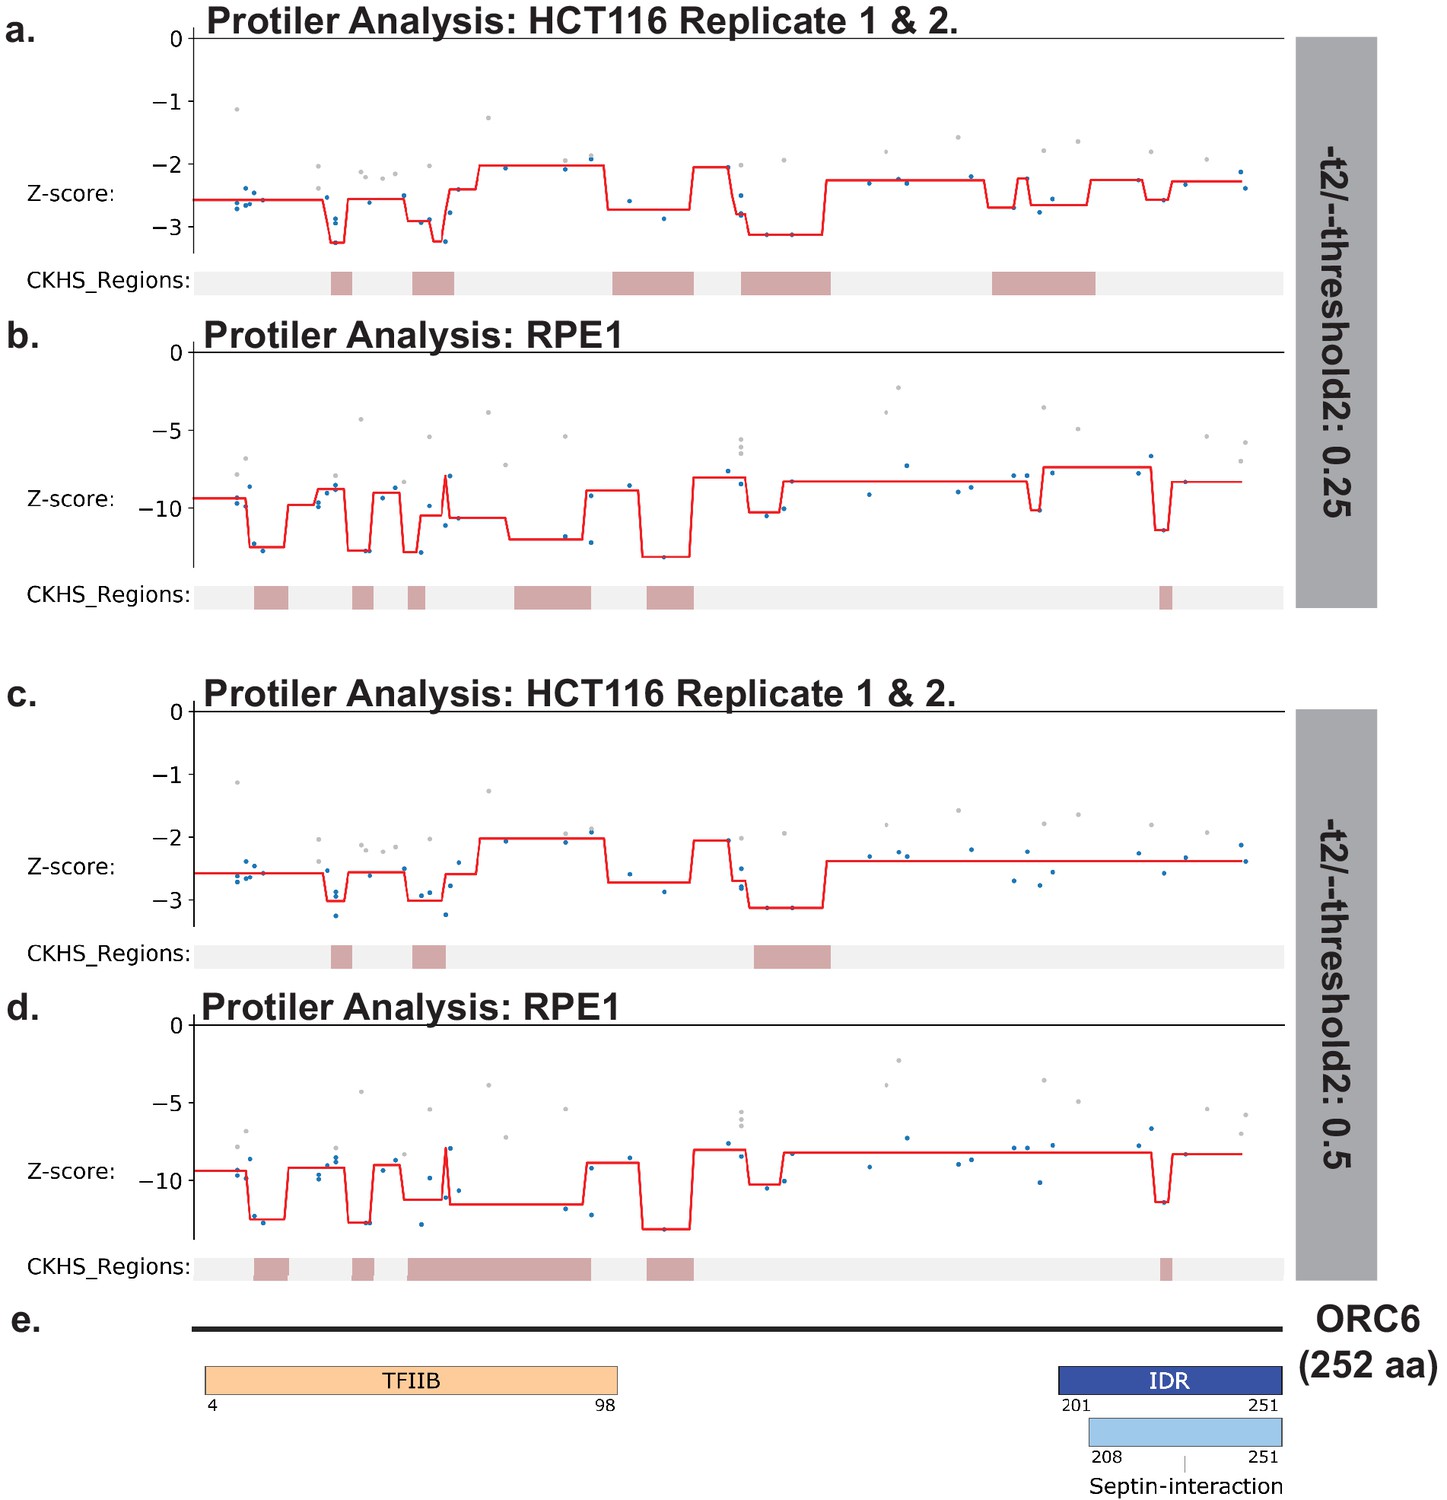
Identification of CKHS regions in ORC6 using Protiler.
Protiler computational pipeline was run on LFC values of guide RNAs for either for the average of the two HCT116 replicates or RPE-1 at two different TGUH thresholds. (a–b) -t2/--threshold2=0.25. (c–d) -t2/--threshold2=0.5. (e) Schematic of ORC6 highlighting annotated domains, IDRs and regions of known function.
Figure 2—figure supplement 13

Identification of CKHS regions CDC6 using Protiler.
Protiler computational pipeline was run on LFC values of guide RNAs for either for the average of the two HCT116 replicates or RPE-1 at two different TGUH thresholds. ORC4 (a–b) -t2/--threshold2=0.25. (c–d) -t2/--threshold2=0.5. (e) Schematic of CDC6 highlighting annotated domains, IDRs and regions of known function.
Figure 3 with 3 supplements
Characterization of CRISPR/Cas9 ORC2 knockout and complementation with sgRNA resistant ORC2.
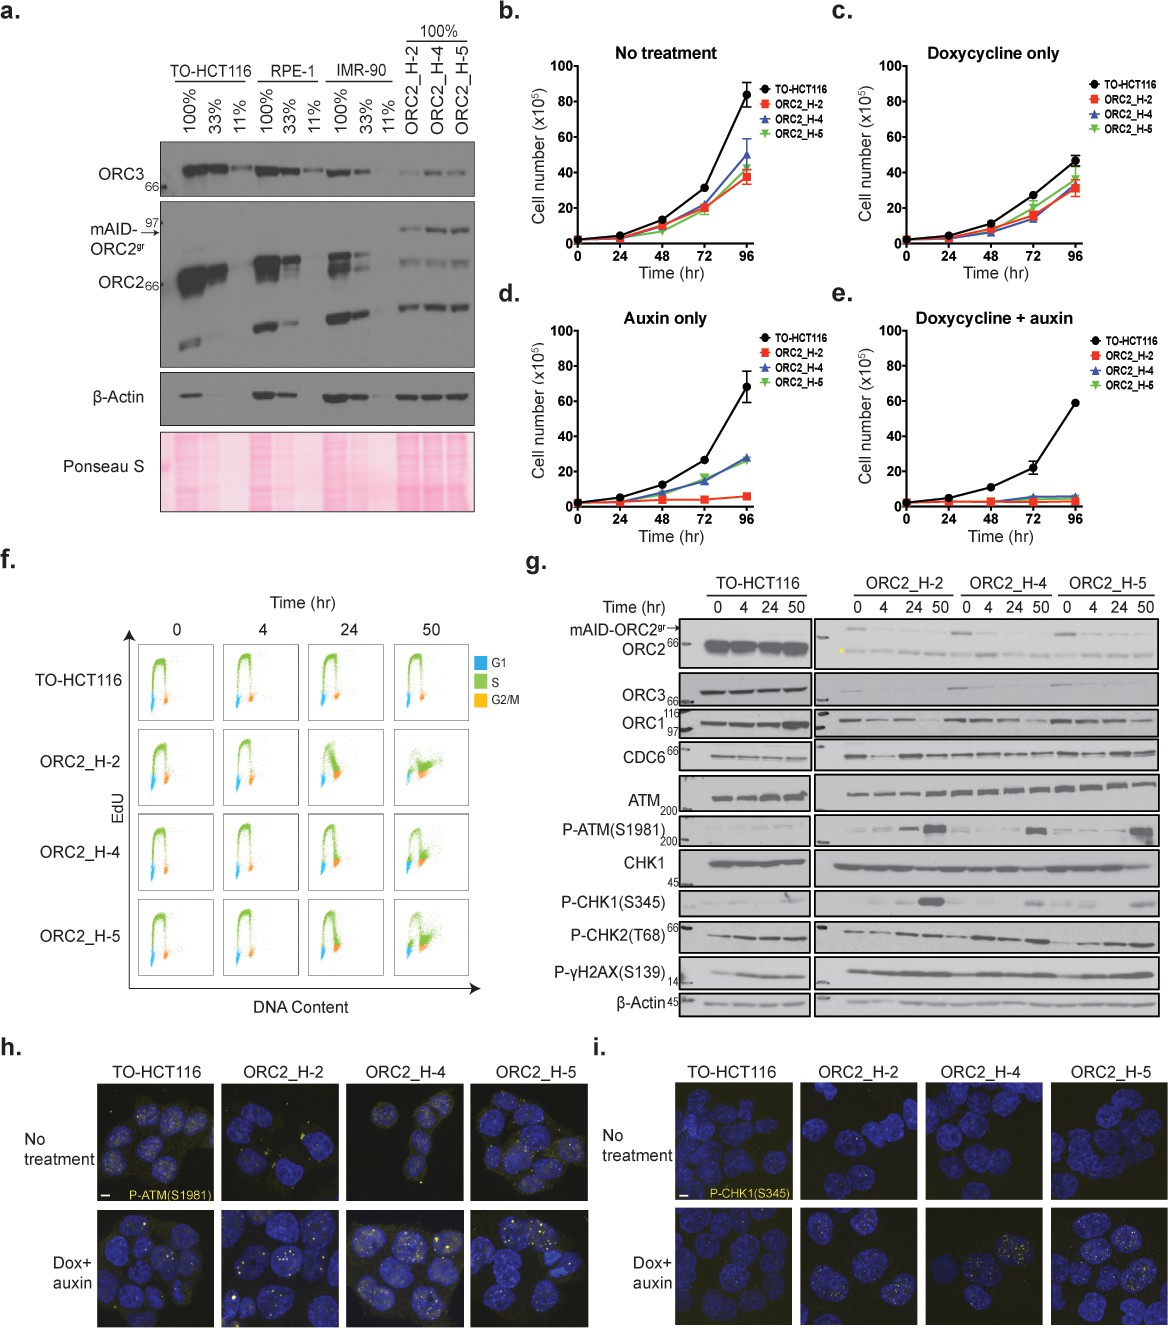
(a) ORC2, mAID-ORC2gr, and ORC3 protein levels in human TO-HCT116, RPE-1, human diploid IMR-90, and three ORC2 KO cell lines. See Figure 3—source data 1 for uncropped images. (b–e) Growth curves of cell lines under (b) normal condition, (c) doxycycline only, (d) auxin only, and (e) dox+auxin containing media, respectively. The x axis indicates hours after addition of doxycycline or auxin if any. The y axis reflects the cell number (x105). n = 3 (biological repeats). Error bars, mean ± SD. (f) Cell cycle analysis of TO-HCT116, ORC2_H-2, ORC2_H-4, and ORC2_H-5 cell lines following mAID-ORC2gr depletion. Cells were treated with 0.75 µg/ml of doxycycline for 24 hr before auxin treatment. Cells were pulse labeled with 10 μM EdU for 2 hr before harvesting at 0, 4, 24, and 50 hr time points. The x axis indicates DNA content, and the y axis represents EdU incorporation. Color legend for cell cycle phases - G1-blue; S-green; G2/M-orange. >10,000 cells were analyzed per condition. (g) Protein expression profiles of mAID-ORC2gr, ORC2, ORC1, ORC3, CDC6, ATM, p-ATM(S1981), CHK1, p-CHK1(S345), p-CHK2(T68), and p-γH2AX(S139) in four cell lines after dox and auxin treatment for 0, 4, 24, and 50 hr. Cells were treated with doxycycline for 24 hr prior to auxin treatment. Asterisks (*) indicates the non-specific band detected in mutant cell lines. Immunoblot of each protein was developed on the same film at the same time for comparison between all four cell lines. Quantification of ORC1 and CDC6 levels are shown in Figure 3—figure supplement 3b and c. See Figure 3—source data 2 for original uncropped immunoblots. (h) Immunofluorescence staining of p-ATM(S1981) in four cell lines with or without dox+auxin treatment. Quantification of p-ATM(S1981) foci is shown in Figure 3—figure supplement 3d. See Figure 3—source data 3 for uncropped images. (i) Immunofluorescence staining of p-CHK1(S345) in four cell lines with or without dox+auxin treatment. For (h) and (i), dox+auxin-treated cells were stained after incubation with doxycycline for 24 hr followed by addition of auxin for 48 hr. Quantification of p-CHK1(S345) foci is shown in Figure 3—figure supplement 3e. See Figure 3—source data 4 for uncropped images. Scale bar indicated 4 μM.
-
Figure 3—source data 1
Entire films of the cropped western blots in Figure 3a.
- https://cdn.elifesciences.org/articles/61797/elife-61797-fig3-data1-v2.pptx
-
Figure 3—source data 2
Entire films of the cropped western blots in Figure 3g.
- https://cdn.elifesciences.org/articles/61797/elife-61797-fig3-data2-v2.pptx
-
Figure 3—source data 3
Uncropped immunofluorescence image of Figure 3h.
- https://cdn.elifesciences.org/articles/61797/elife-61797-fig3-data3-v2.pptx
-
Figure 3—source data 4
Uncropped immunofluorescence image of Figure 3i.
- https://cdn.elifesciences.org/articles/61797/elife-61797-fig3-data4-v2.pptx
Figure 3—figure supplement 1
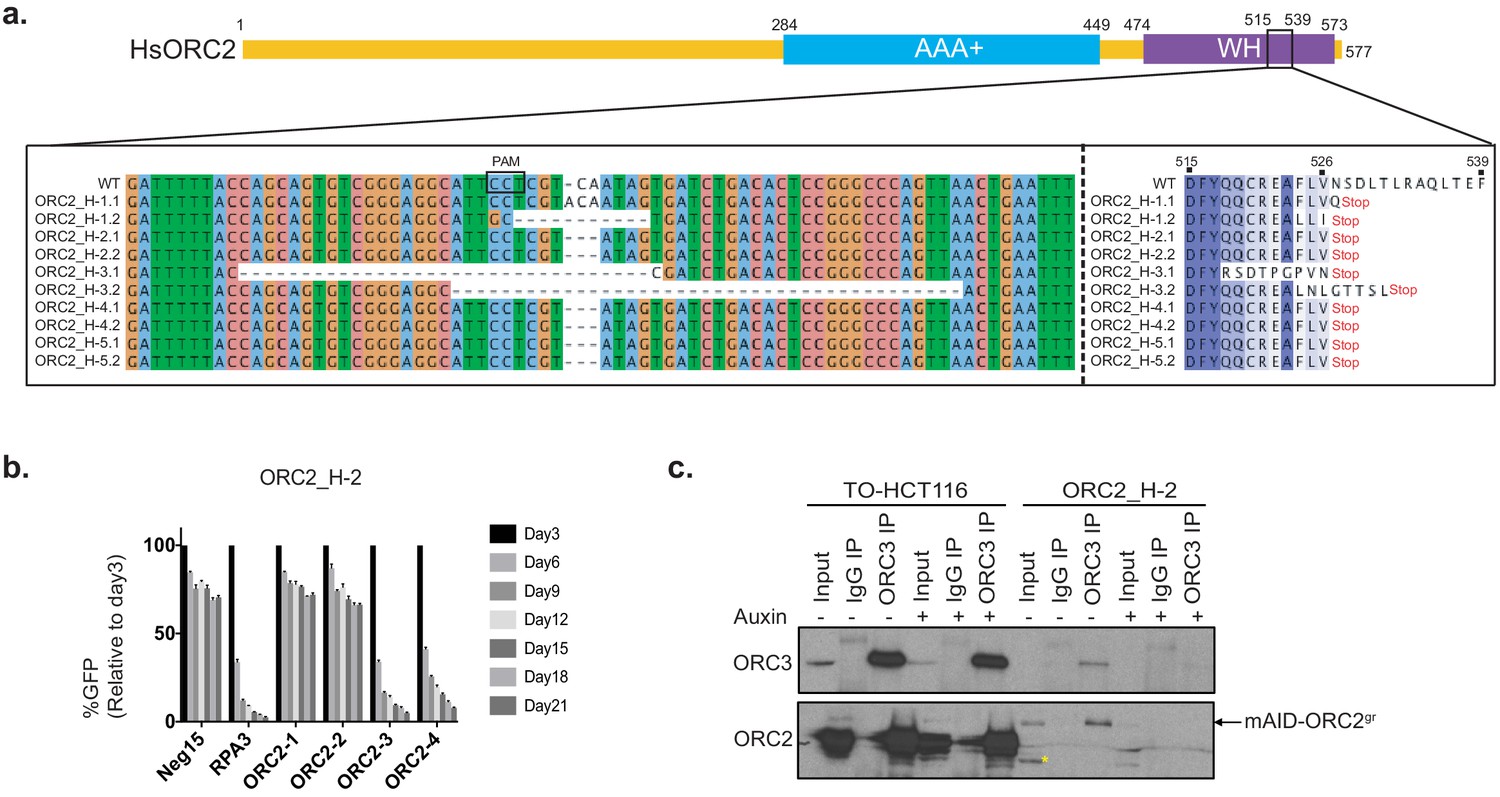
Validation of CRISPR/Cas9 knockout in ORC2_H-2 cell line.
(a) Nucleotide and amino acid alignments near the ORC2-1 sgRNA targeting site in parental TO-HCT116 and five cloned ORC2 KO cell lines. (b) the ORC2_H-2 cell line is resistant to ORC2_1 and ORC2_2 sgRNAs. Negative-selection time course assays that plot the percentage of GFP-positive cells over time following transduction with indicated sgRNAs/Cas9. The GFP-positive percentage was normalized to Day3 measurement. N = 3. Error bars, mean ± SD. (c) ORC3 immunoprecipitation in TO-HCT116 and ORC2_H-2 cell lines. Cells lysates were incubated with mouse IgG or ORC3 mouse monoclonal antibody for immunoprecipitation, followed by western blotting and detected with antibodies against ORC2 and ORC3. Input ~ 2.5% and IP ~ 30% of total lysate. Asterisks (*) indicates the non-specific smaller band detected in ORC2_H-2 cell line.
Figure 3—figure supplement 2
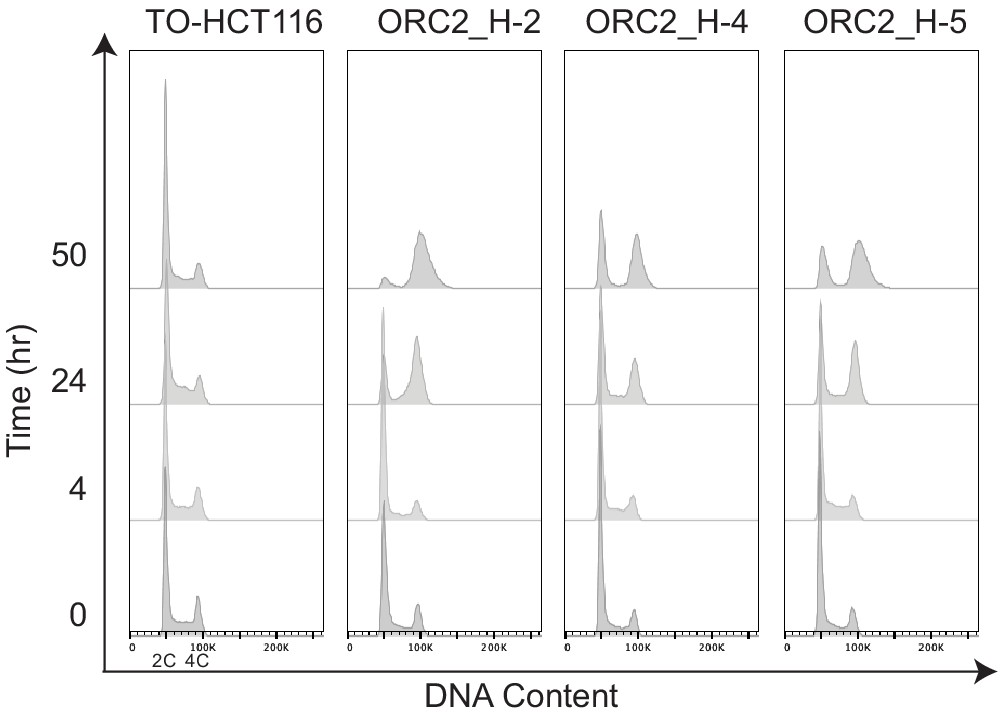
Cell cycle analysis after dox and auxin treatment in TO-HCT116, ORC2_H-2, ORC2_H-4, and ORC2_H-5 cell lines.
Flow cytometry histogram plots with DNA content plotted on the x axis. Pseudo-Y axis represents time points (hr) following auxin treatment.
Figure 3—figure supplement 3
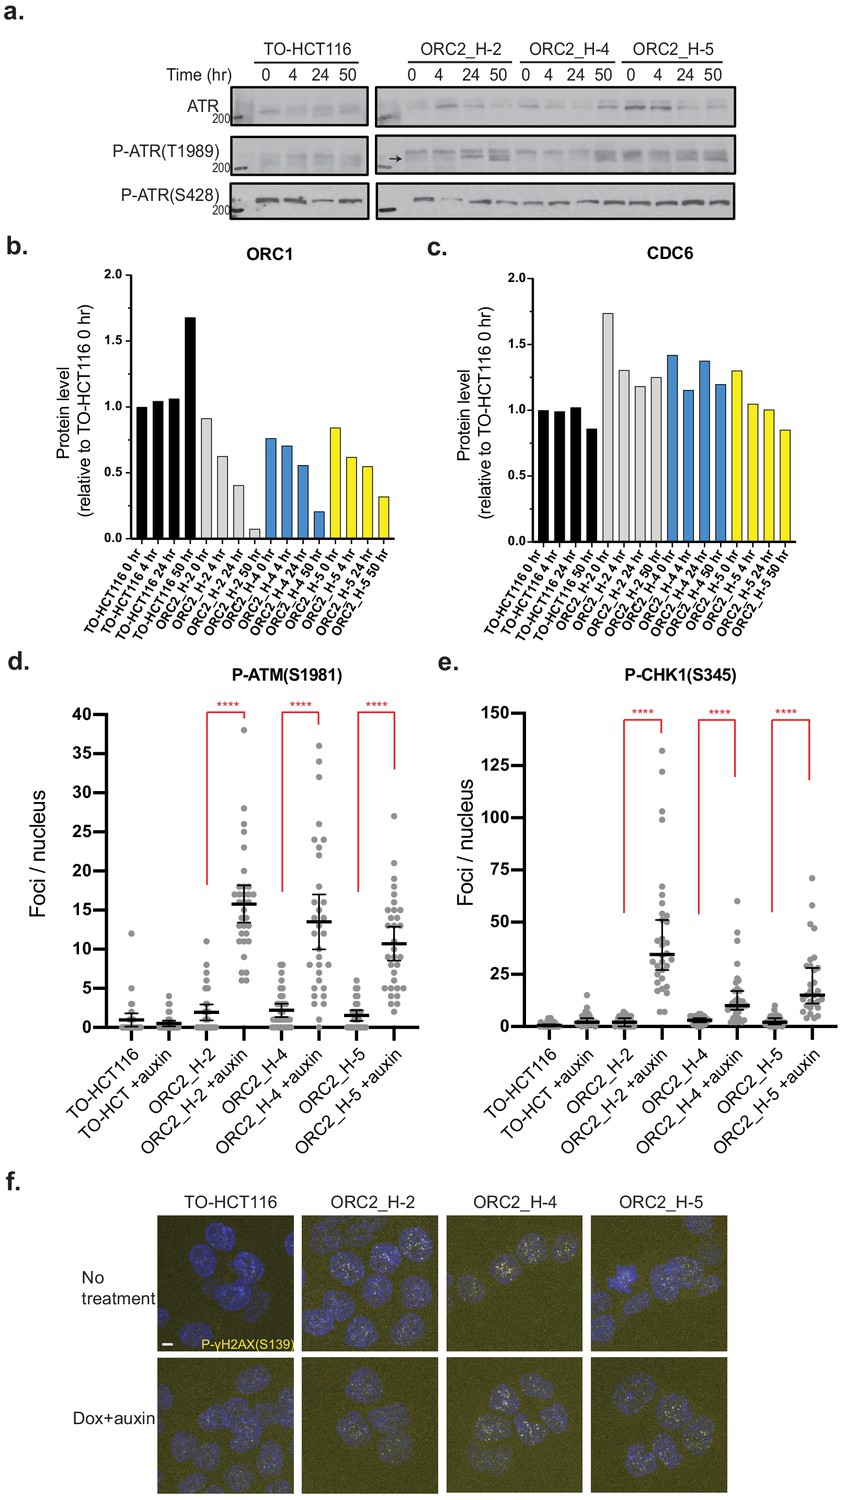
DNA damage checkpoint is activated in auxin-treated ORC2_H-2, ORC2_H-4, and ORC2_H-5 cell lines.
(a) ATR(T1989) was phosphorylated in ORC2_H-2, –4, −5 cell lines after dox and auxin treatment for 50 hr. There was no change in p-ATR(S428) level. See Figure 3—figure supplement 3—source data 1 for original uncropped images. (b) Relative ORC1 levels in four cell lines at different time points after auxin treatment. (c) Relative CDC6 level in four cell lines at different time points after auxin treatment. Protein levels in all cases were normalized to actin loading control and then compared to TO-HCT116 cells 0 hr time point. (d) Quantification of phospho-ATM(S1981) foci per nucleus in four cell lines in the absence or presence of dox and auxin. TO-HCT116, n = 31; TO-HCT116 with dox+auxin, n = 33; ORC2_H-2, n = 33; ORC2_H-2 with dox+auxin, n = 33; ORC2_H-4, n = 34; ORC2_H-4 with dox+auxin, n = 32; ORC2_H-5, n = 30; ORC2_H-5 with dox+auxin, n = 32. Statistical analysis was performed using unpaired t-test: ****p<0.0001. (e) Quantification of phospho-CHK1(S345) foci per nucleus in four cell lines either in the absence or presence of dox and auxin. TO-HCT116, n = 30; TO-HCT116 with dox+auxin, n = 34; ORC2_H-2, n = 32; ORC2_H-2 with dox+auxin, n = 32; ORC2_H-4, n = 37; ORC2_H-4 with dox+auxin, n = 32; ORC2_H-5, n = 33; ORC2_H-5 with dox+auxin, n = 30. Statistical analysis was performed using unpaired t-test: ****p<0.0001. (f) Phosphorylation of γH2AX(S139) was seen in ORC2_H-2, H-4, and H-5 cells either in the absence or presence of dox and auxin for 48 hr. See Figure 3—figure supplement 3—source data 2 for uncropped images.
-
Figure 3—figure supplement 1—source data 1
Entire films of the cropped western blots in Figure 3—figure supplement 3a.
- https://cdn.elifesciences.org/articles/61797/elife-61797-fig3-figsupp1-data1-v2.pptx
-
Figure 3—figure supplement 1—source data 2
Uncropped immunofluorescence image of Figure 3—figure supplement 3f.
- https://cdn.elifesciences.org/articles/61797/elife-61797-fig3-figsupp1-data2-v2.pptx
Figure 4 with 3 supplements
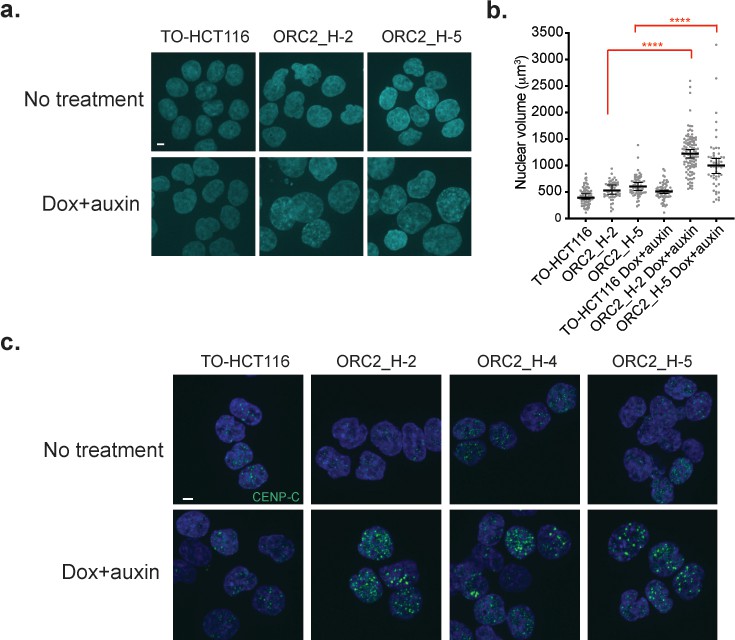
Auxin-treated ORC2_H2, H-4, and H-5 cells have abnormal nuclear phenotypes.
(a) Nuclear morphology of TO-HCT116, ORC2_H-2, and H-5 cells after 48 hr of auxin treatment. Scale bar indicated 4 μM. See Figure 4—source data 1 for uncropped images. (b) Scatter plot illustrating the nuclear volume after 48 hr of auxin treatment. Untreated: TO-HCT116, n = 77; ORC2_H-2, n = 52; ORC2_H-5, n = 63. Dox and auxin treated: TO-HCT116, n = 66; ORC2_H-2, n = 110; ORC2_H-5, n = 54. Error bars, medium ± 95% CI. Nuclear volume decreased significantly in both dox and auxin-treated ORC2_H-2 and H-5 cells. Statistical analysis was performed using Student’s t-test: ****p<0.0001. All singlets in each field captured have been measured, resulting in different but unbiased sample size selection. See Figure 4—source data 2 for numerical data table. (c) Immunofluorescence staining of CENP-C after mAID-ORC2gr depletion for 50 hr. Scale bar is 4 μM. See Figure 4—source data 3 for uncropped images.
-
Figure 4—source data 1
Uncropped immunofluorescence image of Figure 4a.
- https://cdn.elifesciences.org/articles/61797/elife-61797-fig4-data1-v2.pptx
-
Figure 4—source data 2
Numerical data table for nuclear volume of Figure 4b.
- https://cdn.elifesciences.org/articles/61797/elife-61797-fig4-data2-v2.docx
-
Figure 4—source data 3
Uncropped immunofluorescence image of Figure 4c.
- https://cdn.elifesciences.org/articles/61797/elife-61797-fig4-data3-v2.pptx
Figure 4—figure supplement 1
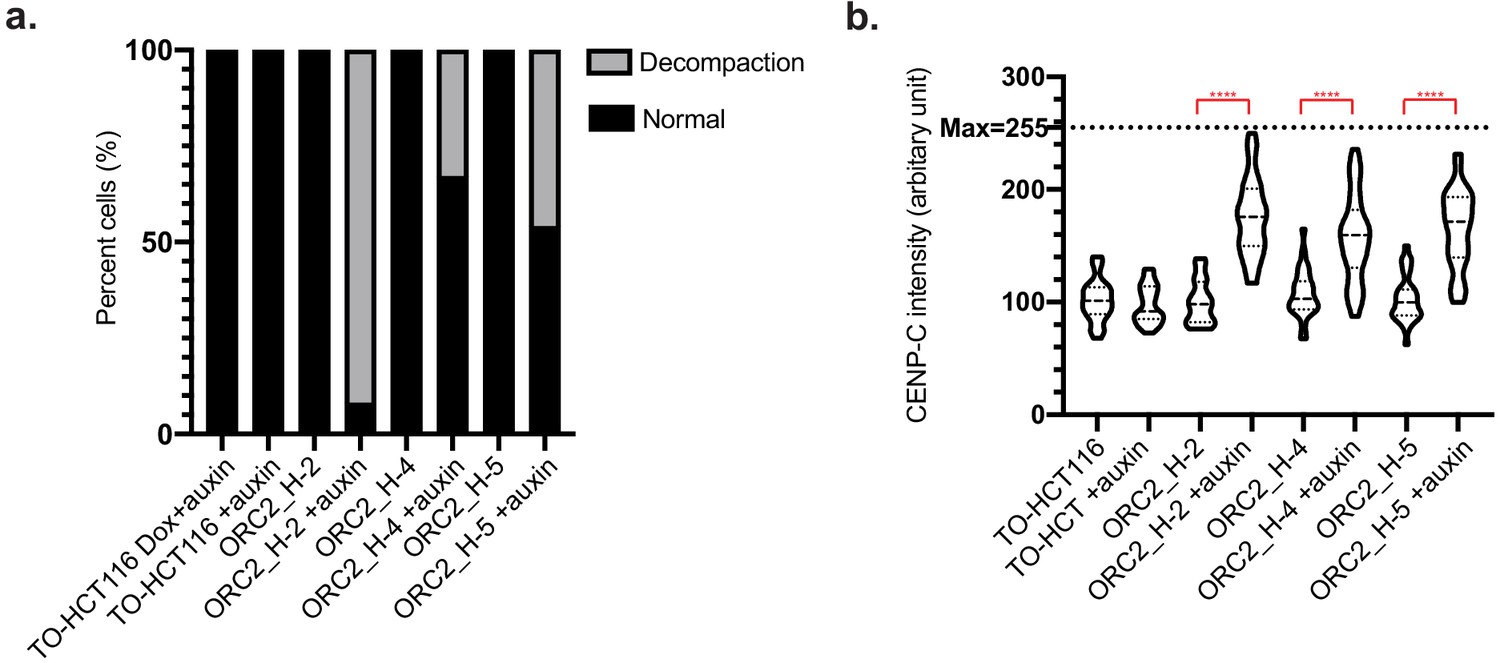
Quantification of CENP-C foci.
(a) Quantitation of cells with large CENP-C foci in each experimental group. N = 30 for all groups. (b) Violin plot illustrating CENP-C intensity per nucleus in four cell lines either in the absence or presence of dox and auxin. The y-axis represents mean intensity of CENP-C in each nucleus. Mean intensity of CENP-C foci per nucleus was calculated by averaging intensity of five foci in each nucleus by imageJ software. N = 30 nuclei for all groups.
Figure 4—figure supplement 2
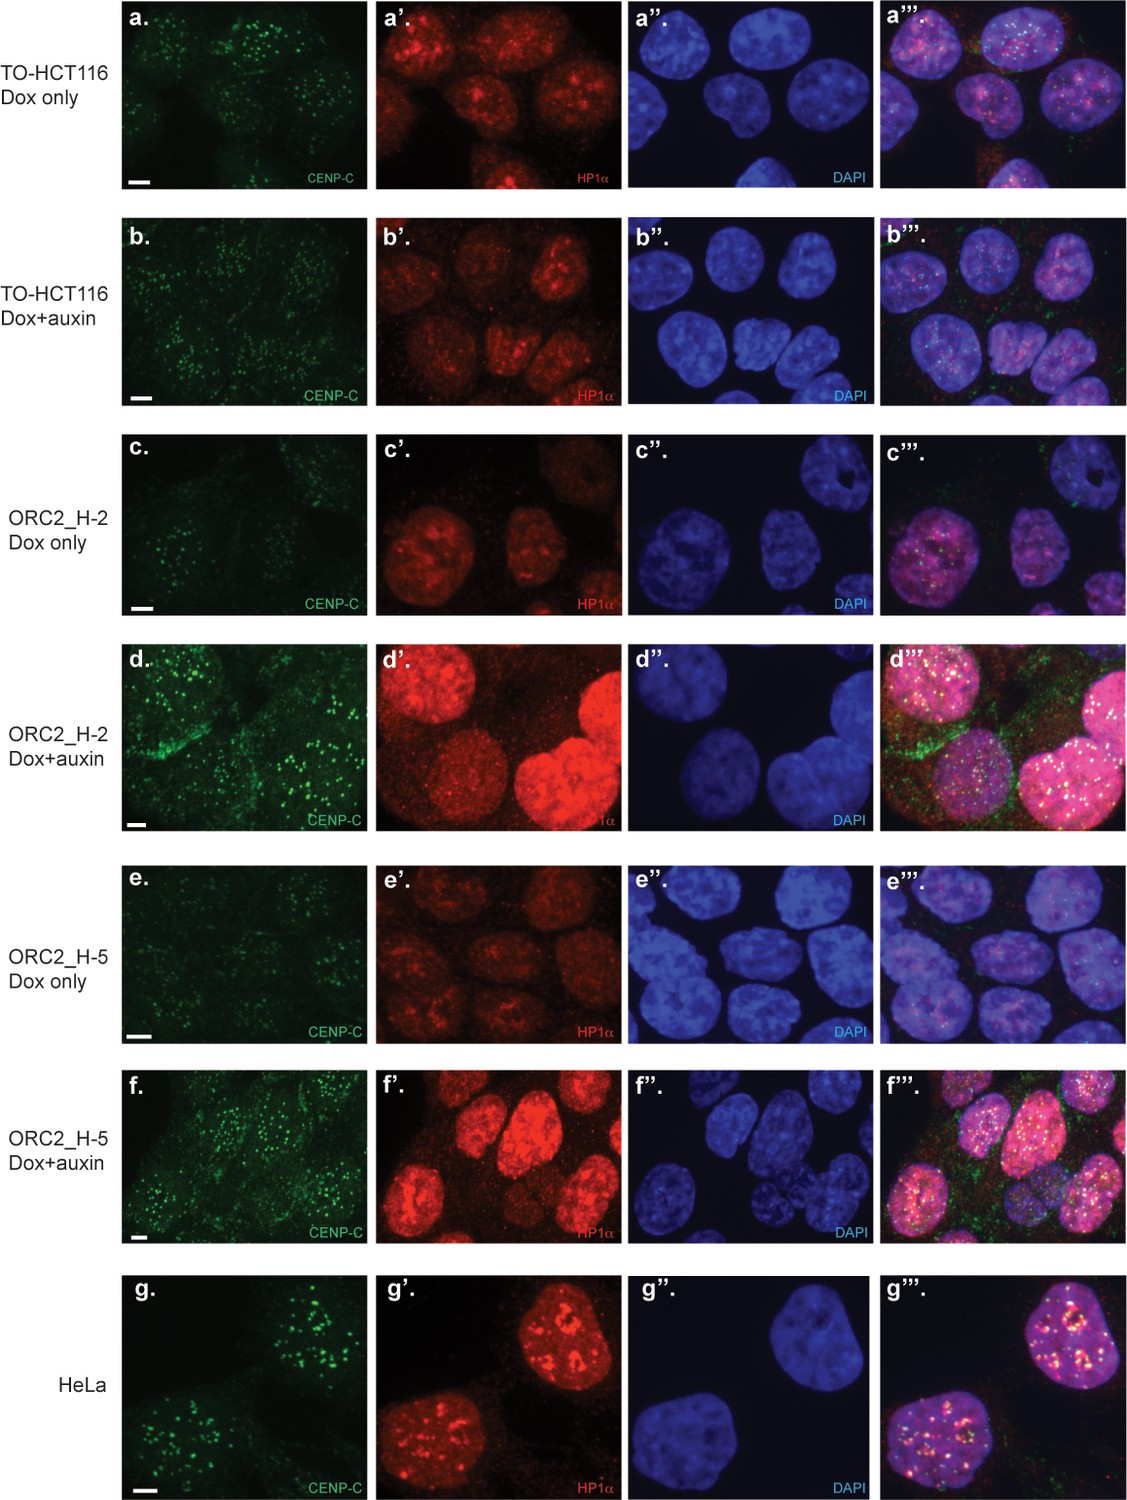
Centromeric foci and heterochromatin are decondensed in ORC2-depleted ORC2_H-2 and H-5 cells.
Endogenous CENP-C and HP1α foci were detected by indirect immunofluorescence. Merged images include nuclear DAPI staining. Panels top to bottom: doxycycline-treated TO-HCT116 cells (a, a’, a’’, and a’’’), dox+auxin treated TO-HCT116 cells (b, b’, b’’, and b’’’), dox-treated ORC2_H-2 cells (c, c’, c’’, and c’’’), dox+auxin treated ORC2_H-2 cells (d, d’, d’’, and d’’’), dox-treated ORC2_H-5 cells (e, e’, e’’, and e’’’), dox+auxin treated ORC2_H-5 cells (f, f’, f’’, and f’’’), and untreated HeLa cells (g, g’, g’’, and g’’’). For dox+auxin groups, cells were treated with dox for 24 hr followed by addition of auxin for another 48 hr before harvest. All Scale bars indicate 4 μM.
Figure 4—figure supplement 3
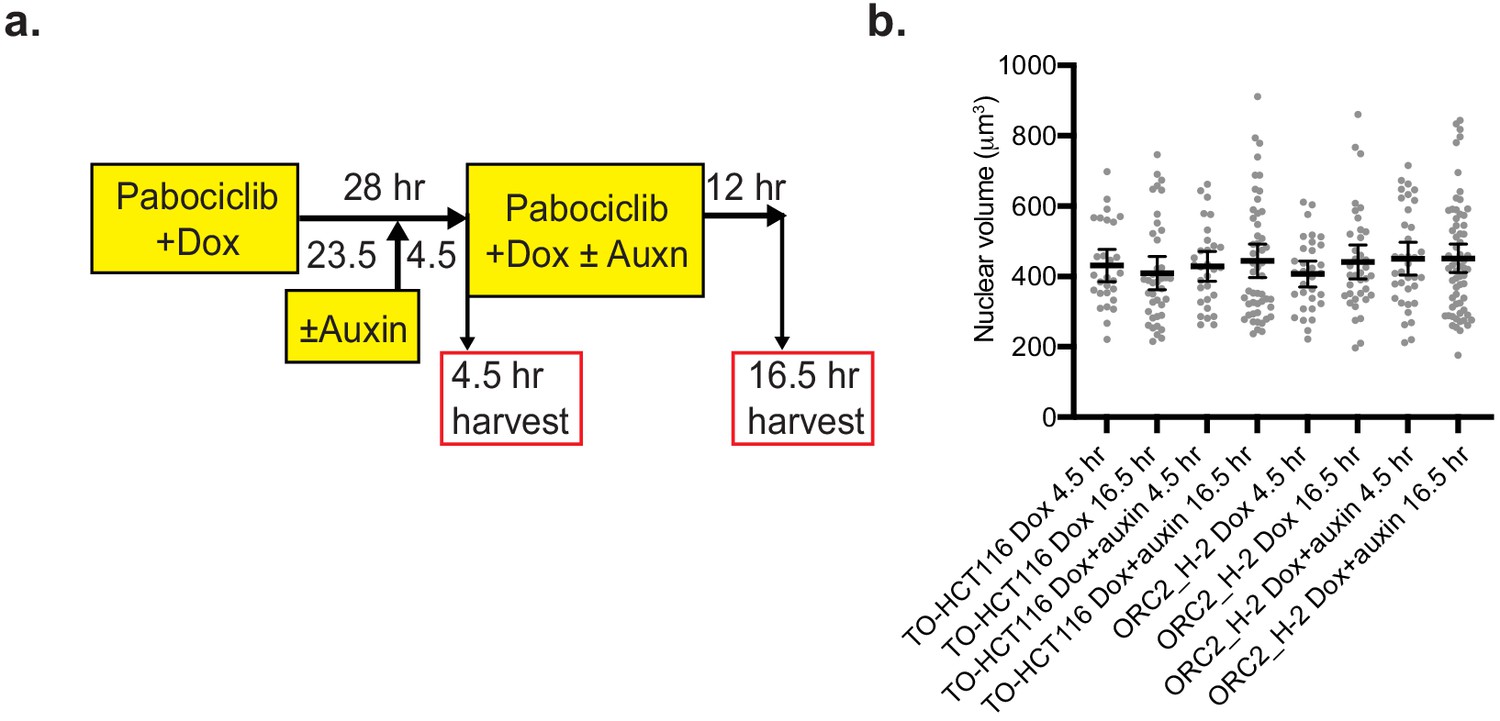
Palbociclib synchronization of TO-HCT116 and ORC2_H-2 cell lines.
(a) Experimental scheme of TO-HCT116 and ORC2_H-2 cells synchronization by a Palbociclib block. (b) Scatter plot illustrating the nuclear volume after incubating cells in Palbociclib with doxycycline and different times of auxin treatment, in TO-HCT116 and ORC2_H-2 cell lines. For TO-HCT116 cells, Dox 4.5 hr, n = 28; Dox 16.5 hr, n = 39; Dox+auxin 4.5 hr, n = 30; Dox+auxin 16.5 hr, n = 50. For ORC2_H-2 cells, Dox 4.5 hr, n = 32; Dox 16.5 hr, n = 37; Dox+auxin 4.5 hr, n = 36; Dox+auxin 16.5 hr, n = 63. Error bars, median ± 95% CI. All singlets in each field captured have been measured, resulting in different but unbiased sample size selection.
Figure 5 with 1 supplement
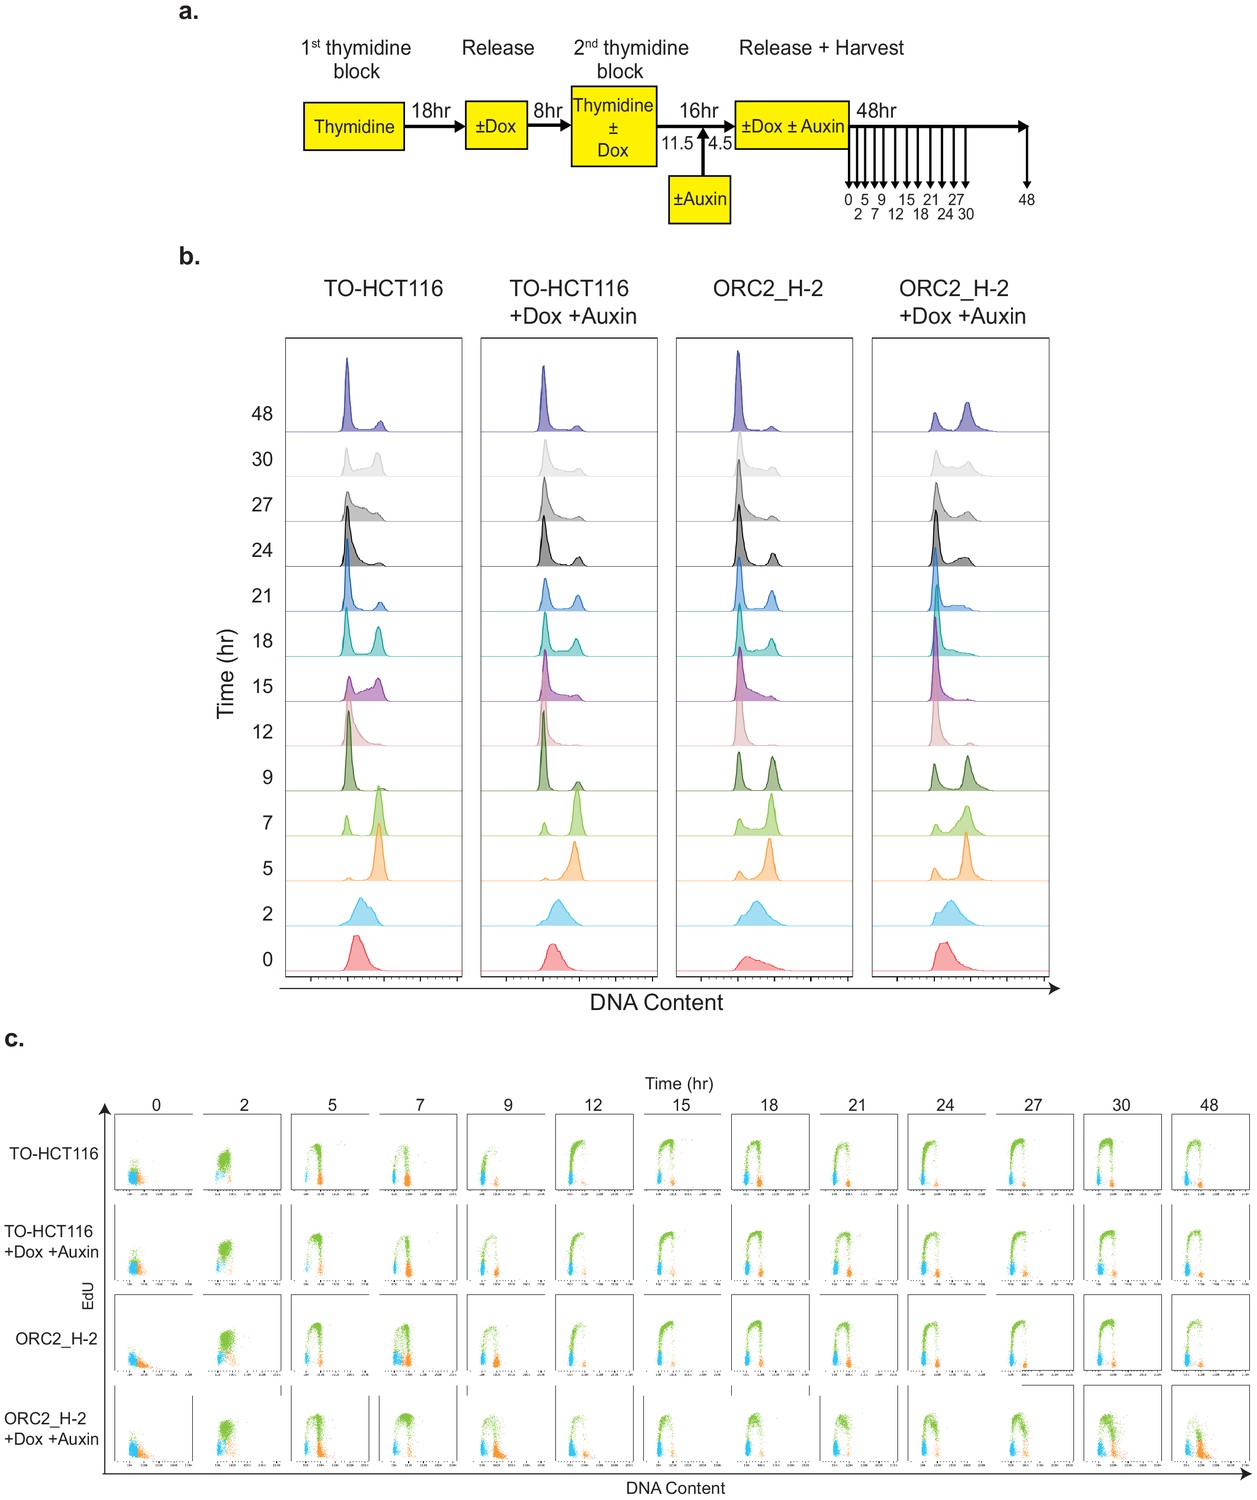
ORC2_H-2 cells show abnormal cell cycle progression after mAID-ORC2gr depletion.
(a) Experimental scheme of TO-HCT116 and ORC2_H-2 cells synchronization by a double thymidine block. (b) Flow cytometry analysis of FxCycle Violet stained cells (singlets) released from double thymidine block in indicated treatment. (c) Cell cycle profiles of TO-HCT116 and ORC2_H-2 cells released from a double thymidine block in indicated treatment. Cells were pulse labeled with 10 μM EdU for 2 hr before harvesting at different time points. X axis indicates DNA content, and y axis represents to EdU incorporation. Color legend for overlay plots of cell cycle phases - G1-blue; S-green; G2/M-orange.
Figure 5—figure supplement 1
Double thymidine block and release in TO-HCT116 and ORC2_H-2 cell lines.
(a) ORC2 and mAID-ORC2gr protein levels in TO-HCT116 and ORC2_H-2 cells in double thymidine block and release experiments. Both blots were run and developed at the same time. (b) Flow cytometry gating strategy for Figure 5b and c. FSC (area) vs SSC (area) was used to exclude the cell debris and gate for cell-type population. Singlets gated on FxCycle Violet (DNA content) height vs area. Cell population in G1, S, and G2/M phase were gated on the FxCycle Violet (DNA content) area vs EdU plots.
Figure 6 with 2 supplements
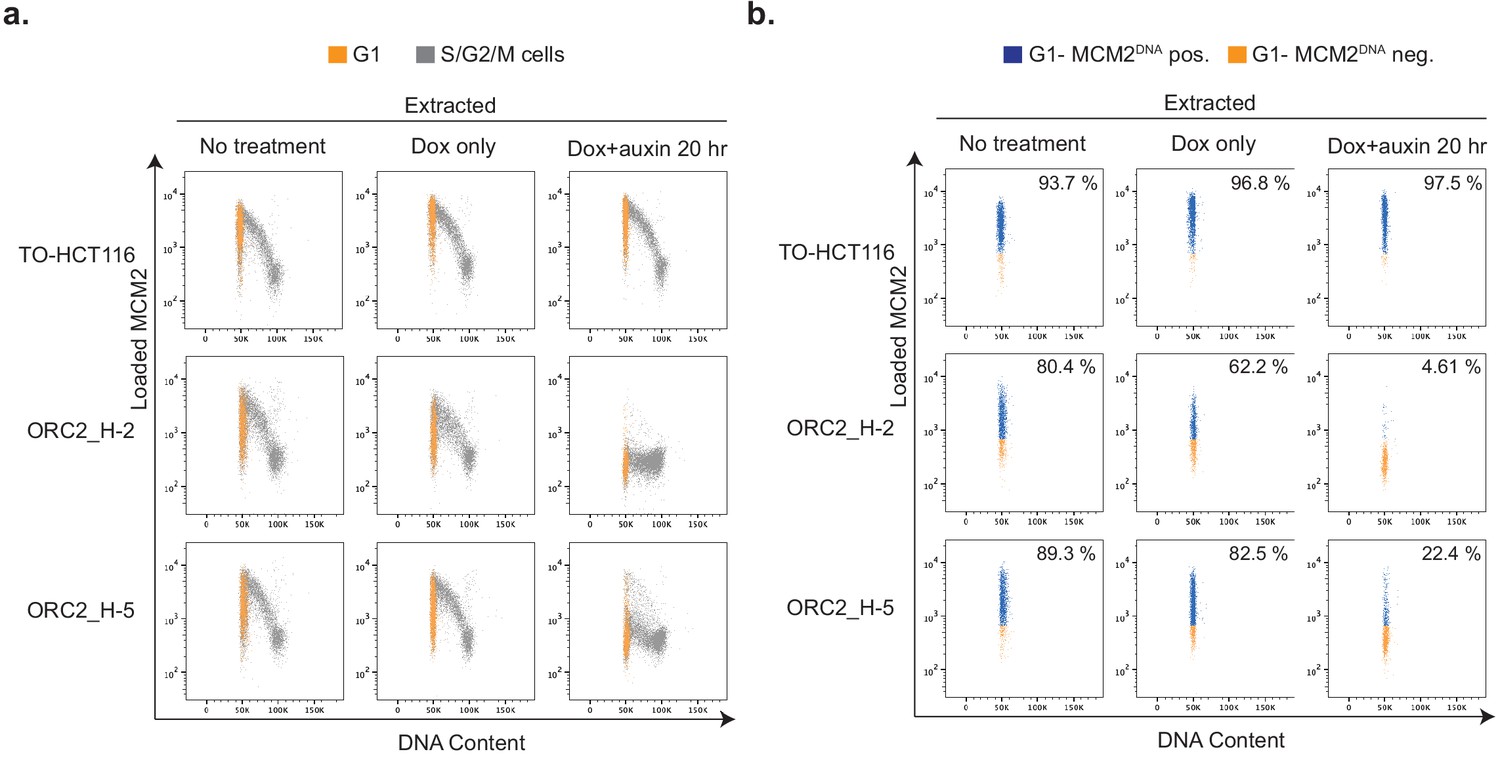
Depletion of mAID-ORC2gr in ORC2_H-2 and H-5 cells results in decreased DNA-loaded MCM.
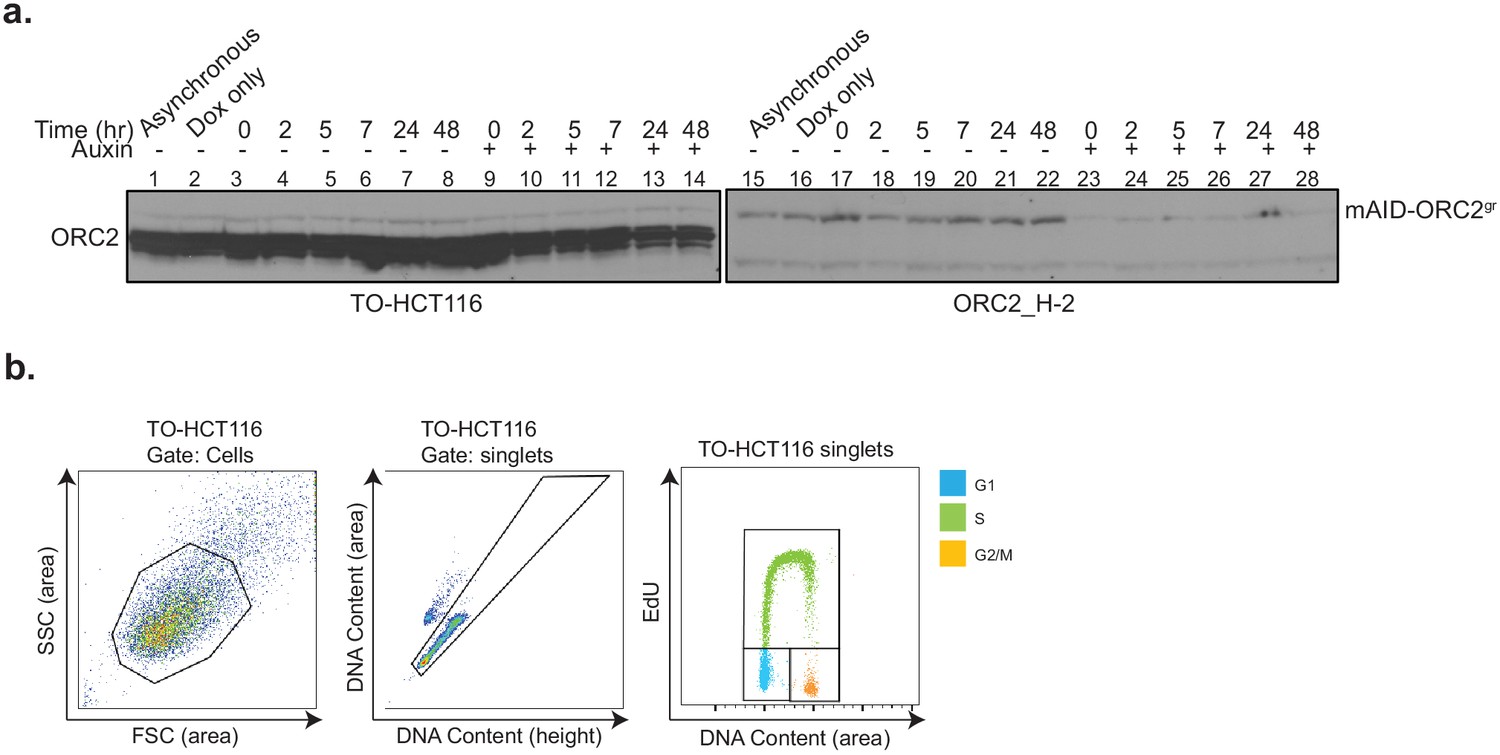
(a) Flow cytometry analysis of DNA content and chromatin-bound MCM2 in asynchronous TO-HCT116, ORC2_H-2, and ORC2_H-5 cells in different conditions. The x axis indicates DNA content, and the y axis represents cells positive for chromatin-bound MCM2 as a function of its fluorescence intensity. G1 population (gated from DNA content vs EdU plot (Figure 6—figure supplement 1c)) is shown in orange. The rest of the cells in S/G2/M phase are shown in gray. (b) Only G1 cell populations from (a) are shown here, with DNA-bound MCM2 positive cells colored in blue and negative cells in orange. Numbers at the upper right corner indicates percentage of MCM2 positive cells. The x axis indicates DNA content, and the y axis represents cells positive for chromatin-bound MCM2 as a function of its fluorescence intensity.
Figure 6—figure supplement 1
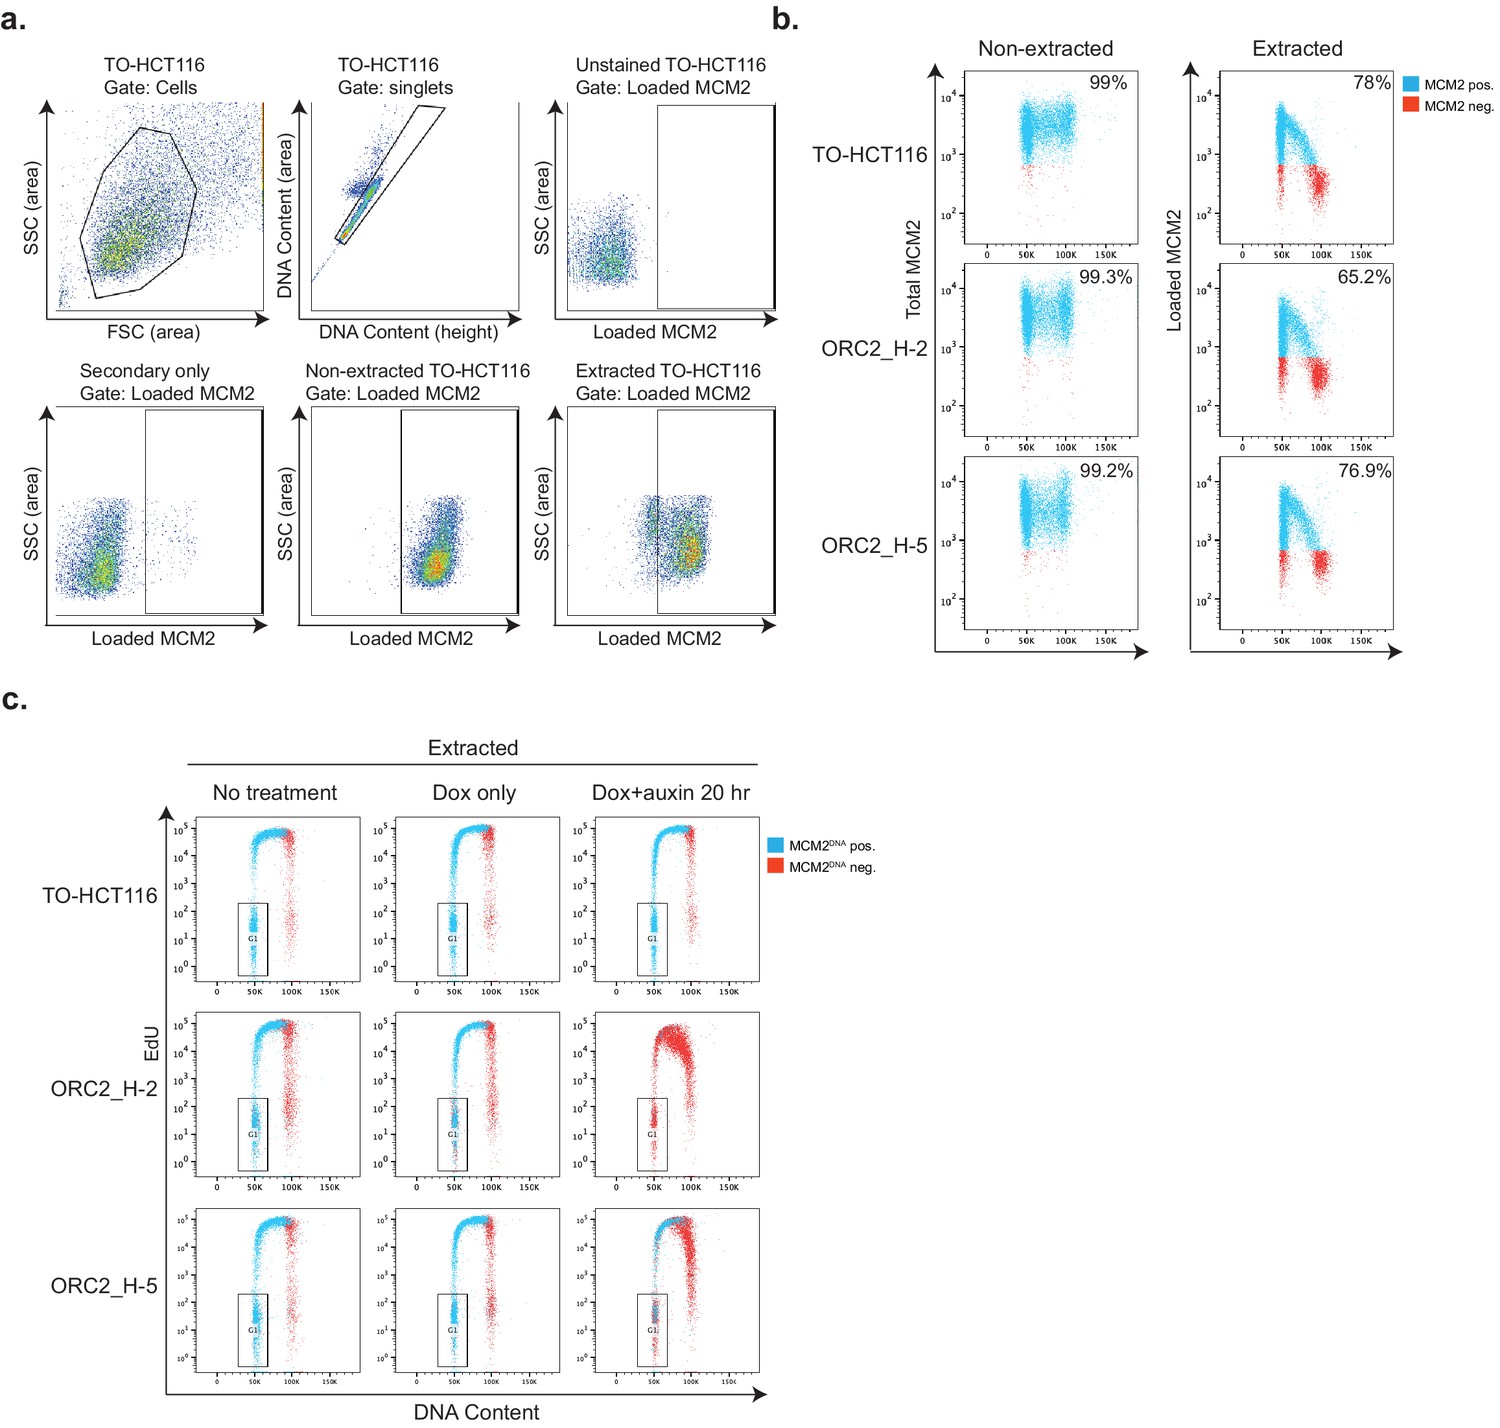
MCM2 binding to chromatin detected using flow cytomety.
(a) Flow cytometry gating strategy for Figure 6. FSC (area) vs SSC (area) gating was used to exclude the cell debris and gate for cell-type population. Singlets were gated on FxCycle Violet (DNA content) height vs area. MCM2-positive population was gated on the loaded MCM2 (area) vs SSC (area) of the unstained-negative control. Cells stained for secondary Donkey anti-Mouse Alexa Fluor 647 antibody only showed minimum background for loaded MCM2. (b) Flow cytometry analysis of DNA-bound MCM2 and total MCM2 in asynchronous cells. Extracted: Cells were treated with nonionic detergent to wash off unbound MCM2 before fixation, and then stained with anti-MCM2 antibody and Alexa Fluor 647-conjugated secondary antibody. Non-extracted: Cells were fixed right after harvest and stained with for MCM2 as before. Blue cells are MCM2 positive, and red cells are MCM2 negative. The x axis indicates DNA content, and the y axis refers to MCM2 level. Numbers at the upper right corner indicates percentage of MCM2 positive population. (c) Flow cytometry measuring DNA content, EdU incorporation, and DNA-bound MCM2 in asynchronous cells in different condition. Cells were pulse labeled with 10 μM EdU for 2 hr before harvesting. The x axis indicates DNA content, and the y axis refers to EdU incorporation. MCM2 positive and negative cells are shown as blue and red respectively. Gated area represents G1 phase cells for Figure 6.
Figure 6—figure supplement 2

Chromatin-loaded MCM2 decrease after mAID-ORC2gr depletion.
The cells were synchronized with a double thymidine block and released as described in Figure 5a, and we harvested cells at 0 hr and 12 hr timepoints after release in the condition of no treatment or Dox+auxin. Cells were pulse-labeled with EdU for 2 hr before harvest. The 12 hr time point is the start of the second cell cycle after release as shown in Figure 5b. Cell cycle profiles and chromatin-loaded MCM2 were then measured the same way as described in Figure 6. (a) Flow cytometry measuring DNA content, EdU incorporation, and chromatin-bound MCM2 at 0 hr and 12 hr timepoints in either auxin-treated or non-treated TO-HCT116, ORC2_H-2, and ORC2_H-5 cells. The x axis indicates DNA content, and the y axis refers to EdU incorporation. MCM2-positive and negative cells are shown as blue and red, respectively. Numbers at the upper right corner indicates percentage of MCM2 positive population. (b) G1 cell population (orange) gated from (a) is shown here, with chromatin-bound MCM2-positive cells colored in blue and negative cells in orange. The x axis indicates DNA content, and the y axis refers to MCM2 level.
Figure 7 with 1 supplement
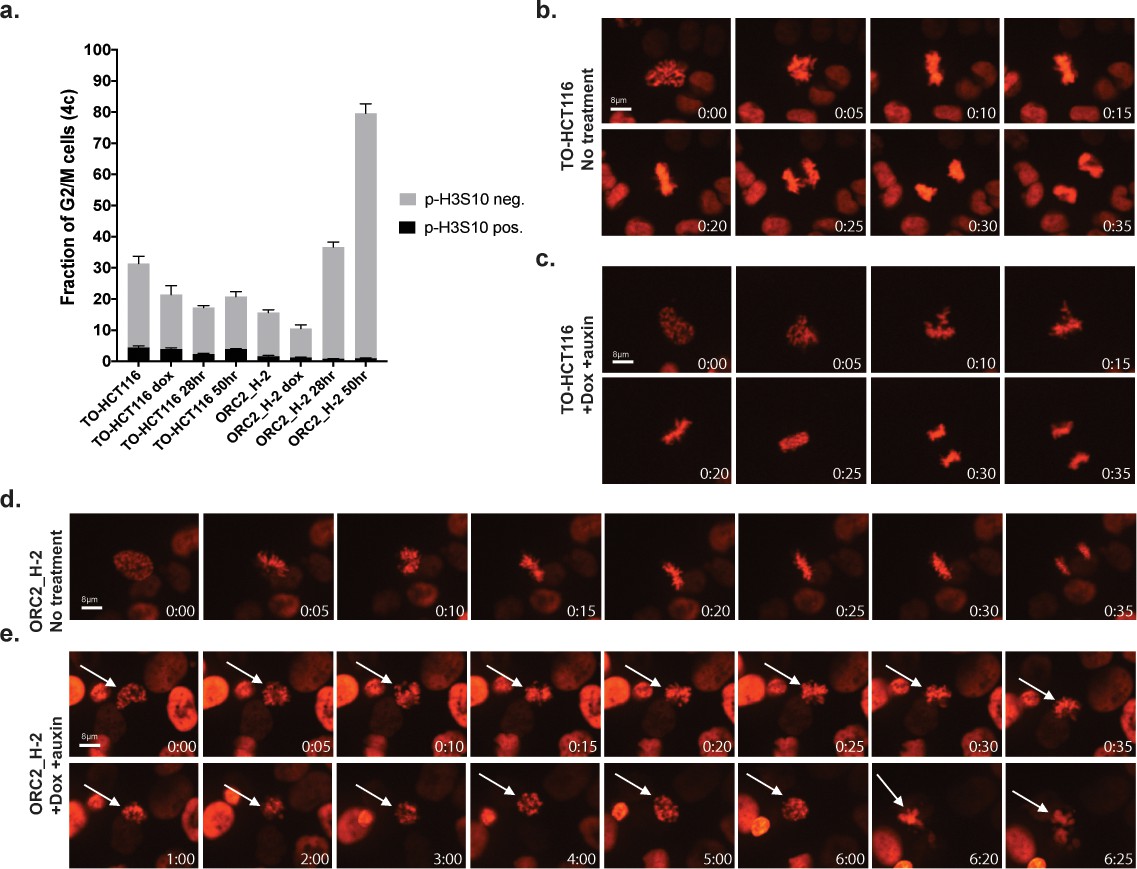
ORC2_H-2 cells have aberrant mitosis after auxin treatment.
(a) Mitotic index of TO-HCT116 and ORC2_H-2 G2/M cells with or without auxin. 0.75 µg/ml Doxycycline were added for 24 hr before auxin treatment. Cells were harvested after 0, 28, or 50 hr of auxin treatment followed by staining with anti-pH3S10 antibody for mitotic cells and FxCycle Violet for DNA content. Histograms on x axis represent each cell line under different conditions, including no treatment, doxycycline only, dox+auxin for 28 hr, and dox+auxin for 50 hr. The y axis is the fraction of 4C G2/M cells. Cell population positive or negative for p-H3S10 were shown as black or gray color respectively. n = 3 (biological repeats). See Figure 7—source data 1 for numerical data. (b–e) Time lapse imaging of TO-HCT116 and ORC2_H-2 cell lines following a single thymidine block (± dox) and release into the second cell cycle (i.e. >30 hr following release). Time shown in lower left corner indicates time (hr: min) since early prophase. (b) Images of TO-HCT116 cells without auxin. See Figure 7—source data 2 for uncropped images. (c) Auxin treated TO-HCT116 cells. See Figure 7—source data 3 for uncropped images. (d) ORC2_H-2 cells without auxin. See Figure 7—source data 4 for uncropped images. (e) Dox and auxin treated ORC2_H-2 cells. White arrows in (e) point to the same cell. Scale bars indicate 8 μM. See Figure 7—source data 5 for uncropped images.
-
Figure 7—source data 1
Numerical data table for p-H3S10 flow cytometry in Figure 7a.
- https://cdn.elifesciences.org/articles/61797/elife-61797-fig7-data1-v2.docx
-
Figure 7—source data 2
Uncropped immunofluorescence image of Figure 7b.
- https://cdn.elifesciences.org/articles/61797/elife-61797-fig7-data2-v2.pptx
-
Figure 7—source data 3
Uncropped immunofluorescence image of Figure 7c.
- https://cdn.elifesciences.org/articles/61797/elife-61797-fig7-data3-v2.pptx
-
Figure 7—source data 4
Uncropped immunofluorescence image of Figure 7d.
- https://cdn.elifesciences.org/articles/61797/elife-61797-fig7-data4-v2.pptx
-
Figure 7—source data 5
Uncropped immunofluorescence image of Figure 7e.
- https://cdn.elifesciences.org/articles/61797/elife-61797-fig7-data5-v2.pptx
Figure 7—figure supplement 1
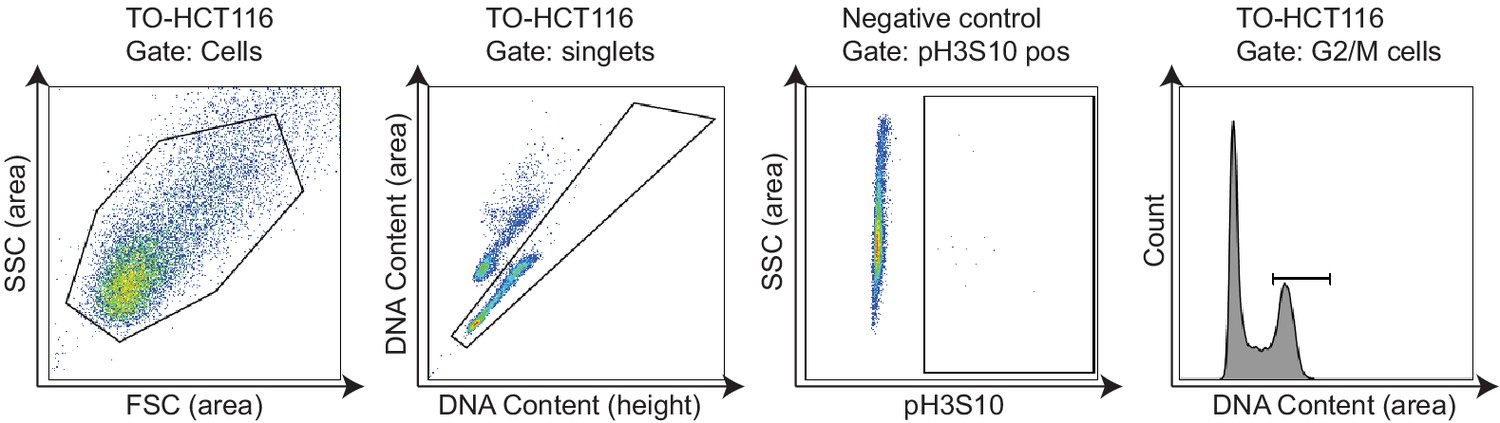
Flow cytometry gating strategy for Figure 7a.
FSC (area) vs SSC (area) gating was used to exclude the cell debris and gate for cell-type population. Next, singlets were gated on FxCycle Violet (DNA content) height vs area. Phospho-H3S10-positive population was gated on pH3S10 Alexa Fluor 647 (area) vs SSC (area) of the unstained negative control cells. G2/M cell population was gated on the DNA content (area) histogram.
Figure 8 with 6 supplements

Characterization of previously published ORC1-/- and ORC2-/- cell lines.
(a–d) Negative-selection time course assays that plot the percentages of GFP positive cells over time following transduction with the indicated sgRNAs/Cas9. Experiments were performed in HCT116 p53-/-, ORC2-/-, HCT116 p53-/-_mAID-ORC2gr, and ORC2-/-_mAID-ORC2gr cell lines. The GFP positive percentage was normalized to the Day3 measurement. n = 3. Error bars, mean ± SD. (e) Calculated fold change (FC) for each primer pairs in ORC2-/- cells compared to HCT116 p53-/- cells. The red and blue arrows indicate each primer pair. Two kinds of primers, Oligo dT and Random Hexamer, were used in the reverse transcription step. Bar diagram view is shown in Figure 8—figure supplement 1. (f) Structural variations (SVs) in the ORC2 gene. Three SNP sites were among the six heterozygous mutations found in the fourth exon. Heterozygous deletion of exon 7 is also found in ORC2-/- cells. Long ONT reads that span both the heterozygous deletion site in exon 7 and the heterozygous SNP site in exon 4 show that SNP1 is on the same haplotype that contains the deletion of exon 7. The other haplotype contains a complete copy of exon seven with heterozygous SNPs in exon 4. (g) 1–4: Immunofluorescence of HCT116 ORC1-/- (B14) cell line stained with Anti-Lamin B1 antibody (Red), Phalloidin (F-actin) (Green), Hoechst Dye (Blue). Images show either merge of all three channels or Lamin-B1 staining of the nuclei. White arrows indicate abnormal and involuted nuclei in image g1. White arrows also show extremely large (nuclear giants) that have lost nuclear membrane integrity (g2, g4). (h) Parental cell line for the ORC1-/- line as representative control for quantitative and qualitative comparison. More fields of control cells HCT116 p53+/+ and p53-/- background and ORC1-/- and ORC2-/- cell lines are shown in Figure 8—figure supplements 5 and 6. Scale bar is 25 µm (i) Quantitation of abnormal nuclei between cell lines. Nuclei per field were classified as Normal, Abnormal/Involuted or Nuclear giants (with or without Lamin B1). Multiple fields were counted to classify > 400 cells for each cell line (n = sample size indicated in legend). Significance calculated using two-way ANOVA for multiple comparisons keeping HCT116 p53-/- as control. ****p<0.0001, **p=0.0014 (See Figure 8—source data 1).
-
Figure 8—source data 1
Numerical data table and statistical analysis for graph in Figure 8i.
- https://cdn.elifesciences.org/articles/61797/elife-61797-fig8-data1-v2.docx
Figure 8—figure supplement 1
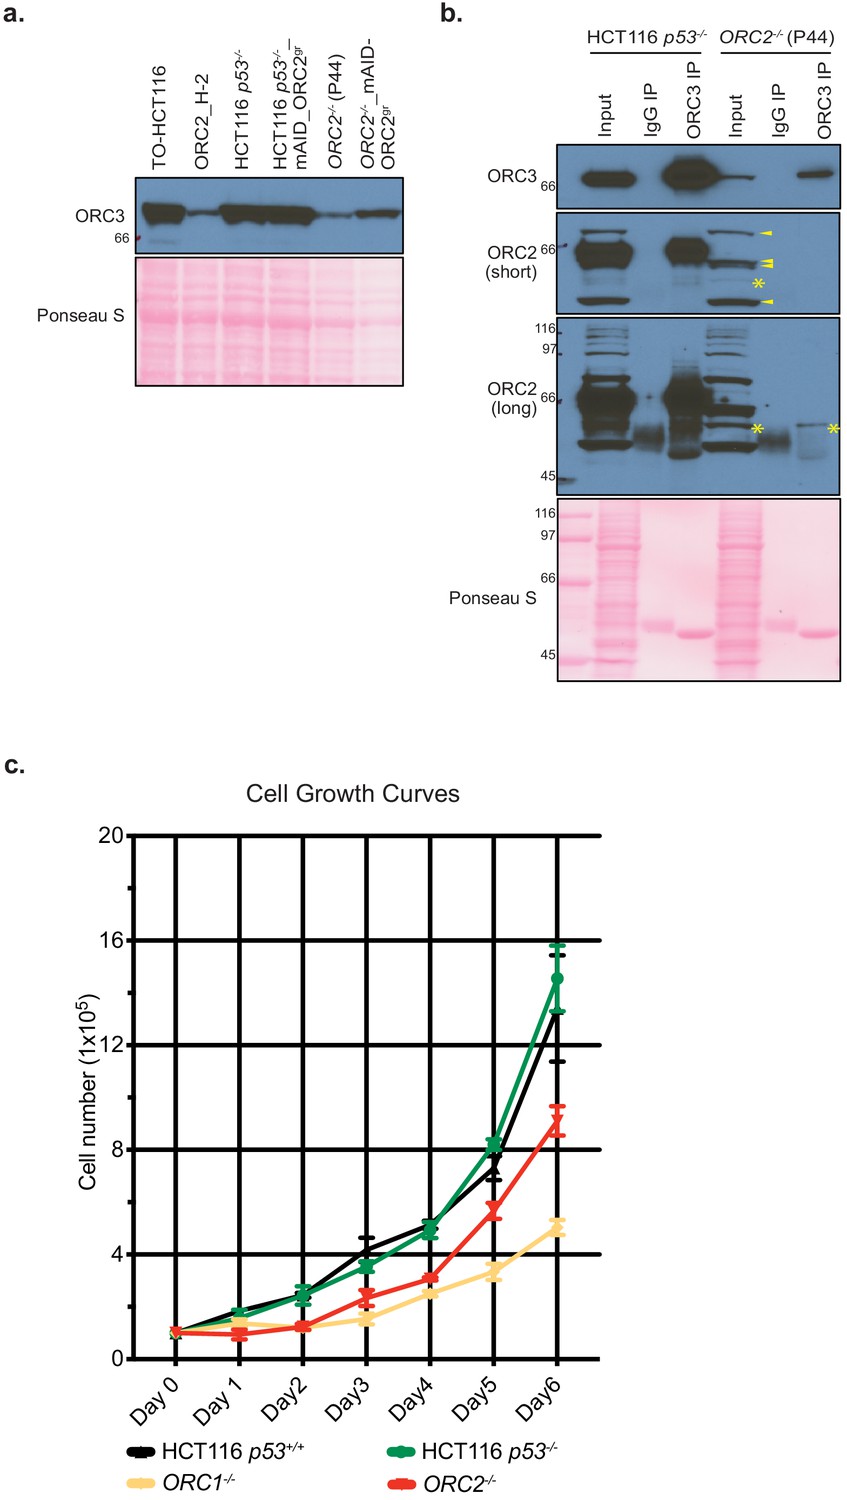
ORC3 exists in ORC2-/- cell line.
(a) ORC3 expression in TO-HCT116, ORC2_H-2, HCT116 p53-/-, HCT116 p53-/-_mAID-ORC2gr, ORC2-/-, and ORC2-/-_mAID-ORC2gr cell lines. Whole cell lysates were made in Laemmli buffer followed by western blotting with anti-ORC3 antibody. (b) ORC3 immunoprecipitation (IP) in HCT116 p53-/- and ORC2-/- cell lines. Cells were lysed in lysis buffer and incubated with mouse IgG or ORC3 mouse monoclonal antibody for immunoprecipitation, followed by western blotting detection with antibodies against ORC2 and ORC3. Input ~ 2.5% and IP ~ 30% of total was loaded for analysis. Both short and long exposure of ORC2 detection were shown here. Asterisks (*) indicate the putative truncated ORC2 which was only found in ORC2-/- cell line. In the short exposure only, arrows point to nonspecific bands detected by the anti-ORC2 antibody. (c) Cell growth curves of HCT116 p53+/+, HCT116 p53-/-, ORC1-/-, and ORC2-/- cell lines. The x axis indicates days after cell seeding (Day 0 to Day 6). The y axis reflects the cell number (x105). n = 3 (biological repeats). Error bars, mean ± SD.
Figure 8—figure supplement 2
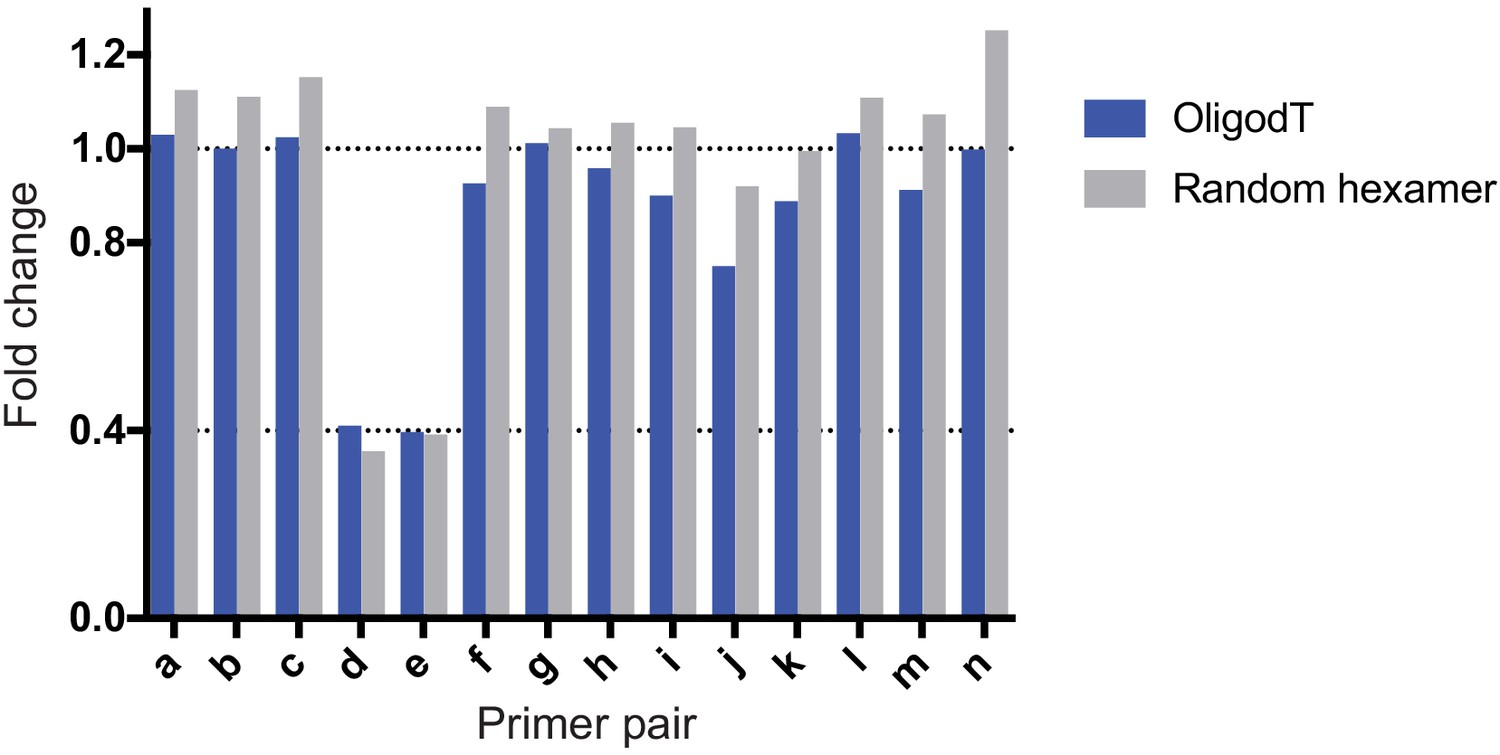
Real time quantitative PCR fold change represented as bar plot (for Figure 8e).
Blue, fold change of OligodT primer sample. Gray, fold change of random hexamer sample. Fold change (FC) for each primer pair in ORC2-/- cells compared to HCT116 p53-/- cells was calculated as FC = 2(to the power of ΔΔCt).
Figure 8—figure supplement 3

Copy number analysis of the genomes of four cell lines using the SMASH method.
The amplification of the ORC2 gene sequences in HCT116 ORC2-/- (P44) cells is shown by the green dot and filled arrow. The open arrows show acquired CNVs in the ORC1-/- and ORC2-/- cells compared to the parental cells.
Figure 8—figure supplement 4
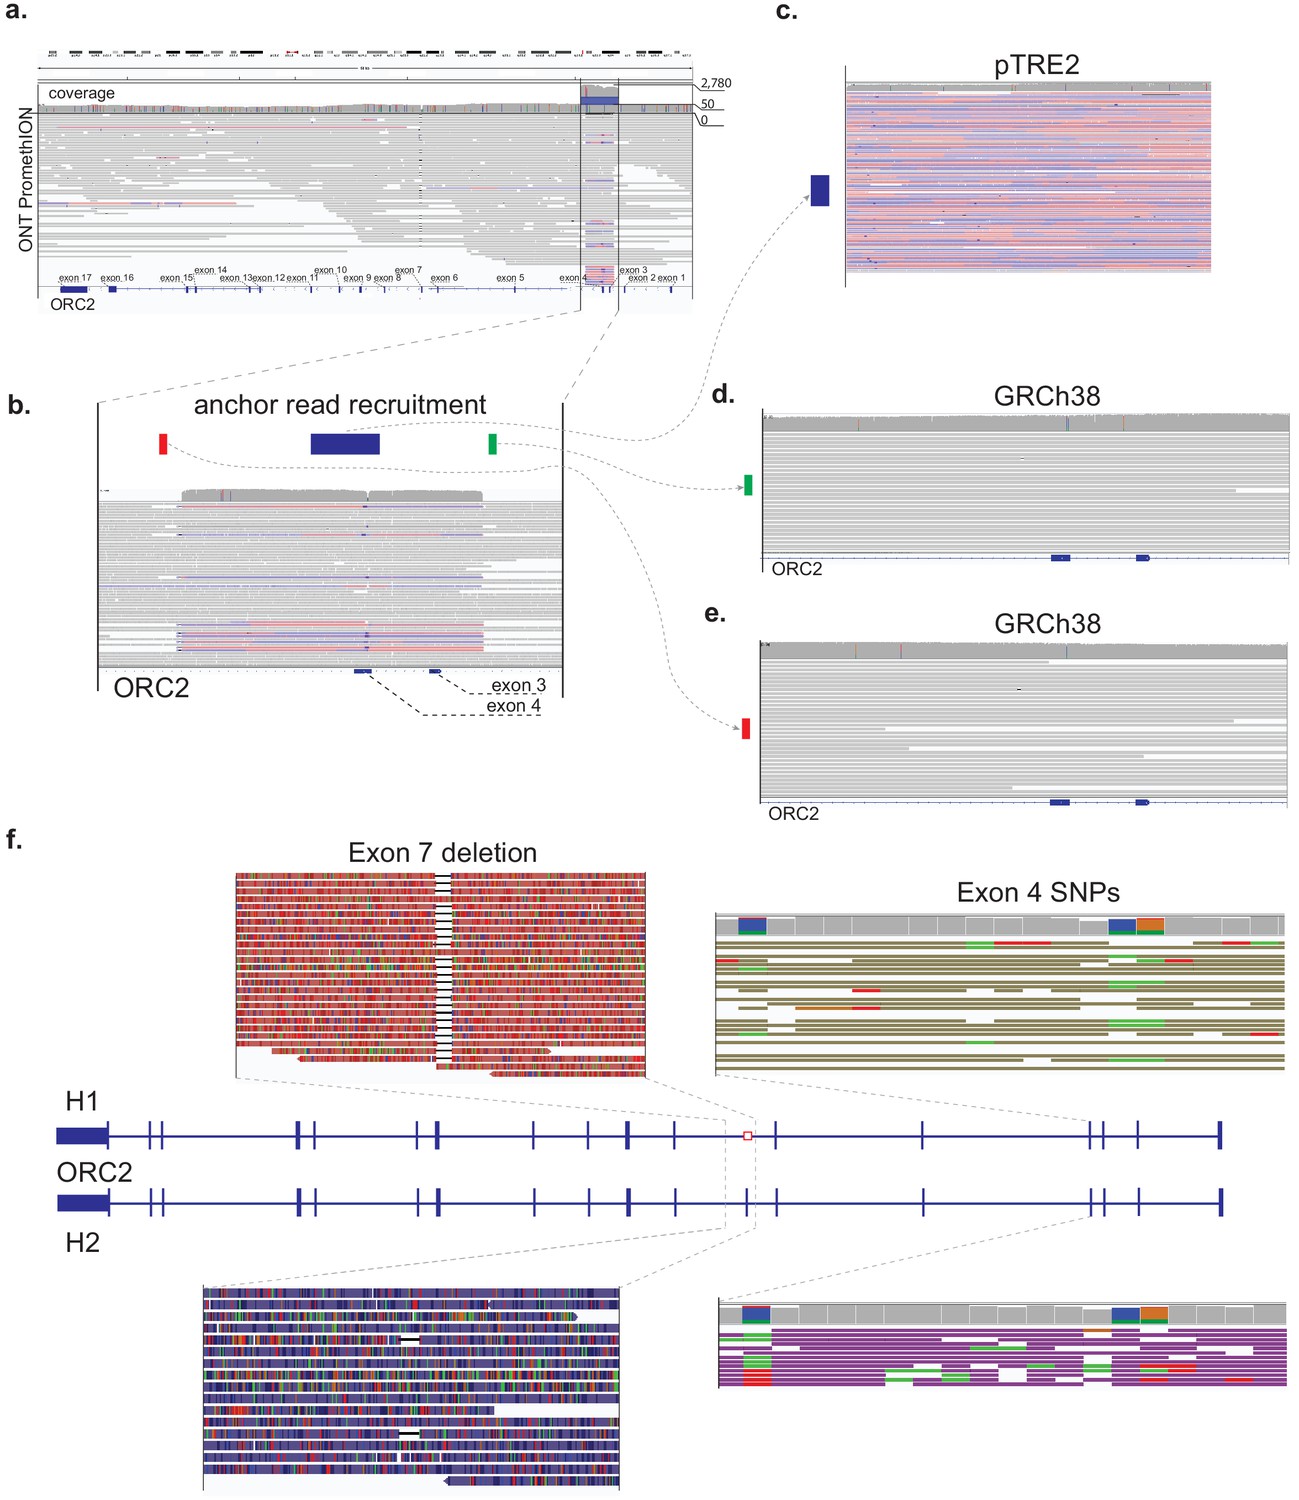
Amplified regions of the ORC2 gene and associated transfected DNA in the ORC2-/- P44 clone.
(a) Alignment of ONT PromethION long reads to ORC2 locus in GRCh38 with an average read-depth coverage of 50x only altered in a single highlighted reads alignment pileup (encompassing exons 3 and 4) with a coverage increase to ~ 2500,500x. (b) Reads alignment pileup encompassing exons 3 and 4 of ORC2 locus with schematic locations of two 100bp-long flanking anchor regions (red and green) located 200 bp outside of the pileup beginning/end coordinates, respectively, and a 1Kbp internal anchor region (blue). (c) (re)alignment of long ONT reads spanning an internal (blue) anchor region in the pileup show in panel (b) to pTRE2 reference with resulting average read depth coverage of ~ 2955,955x. In panels (d) and (e) we show (re)alignments of ONT reads spanning the ‘green’ and ‘red’ pileup-flanking anchors to the same ORC2 locus in GRCh38 with an observed read-depth coverage of ~ 50 x. (f) Phased alignments of reads which overlap the genomic region between exon 7 and a red pileup-flanking anchor, with highlights of the observed SNPs in exon 4 and a deletion encompassing exon 7.
Figure 8—figure supplement 5
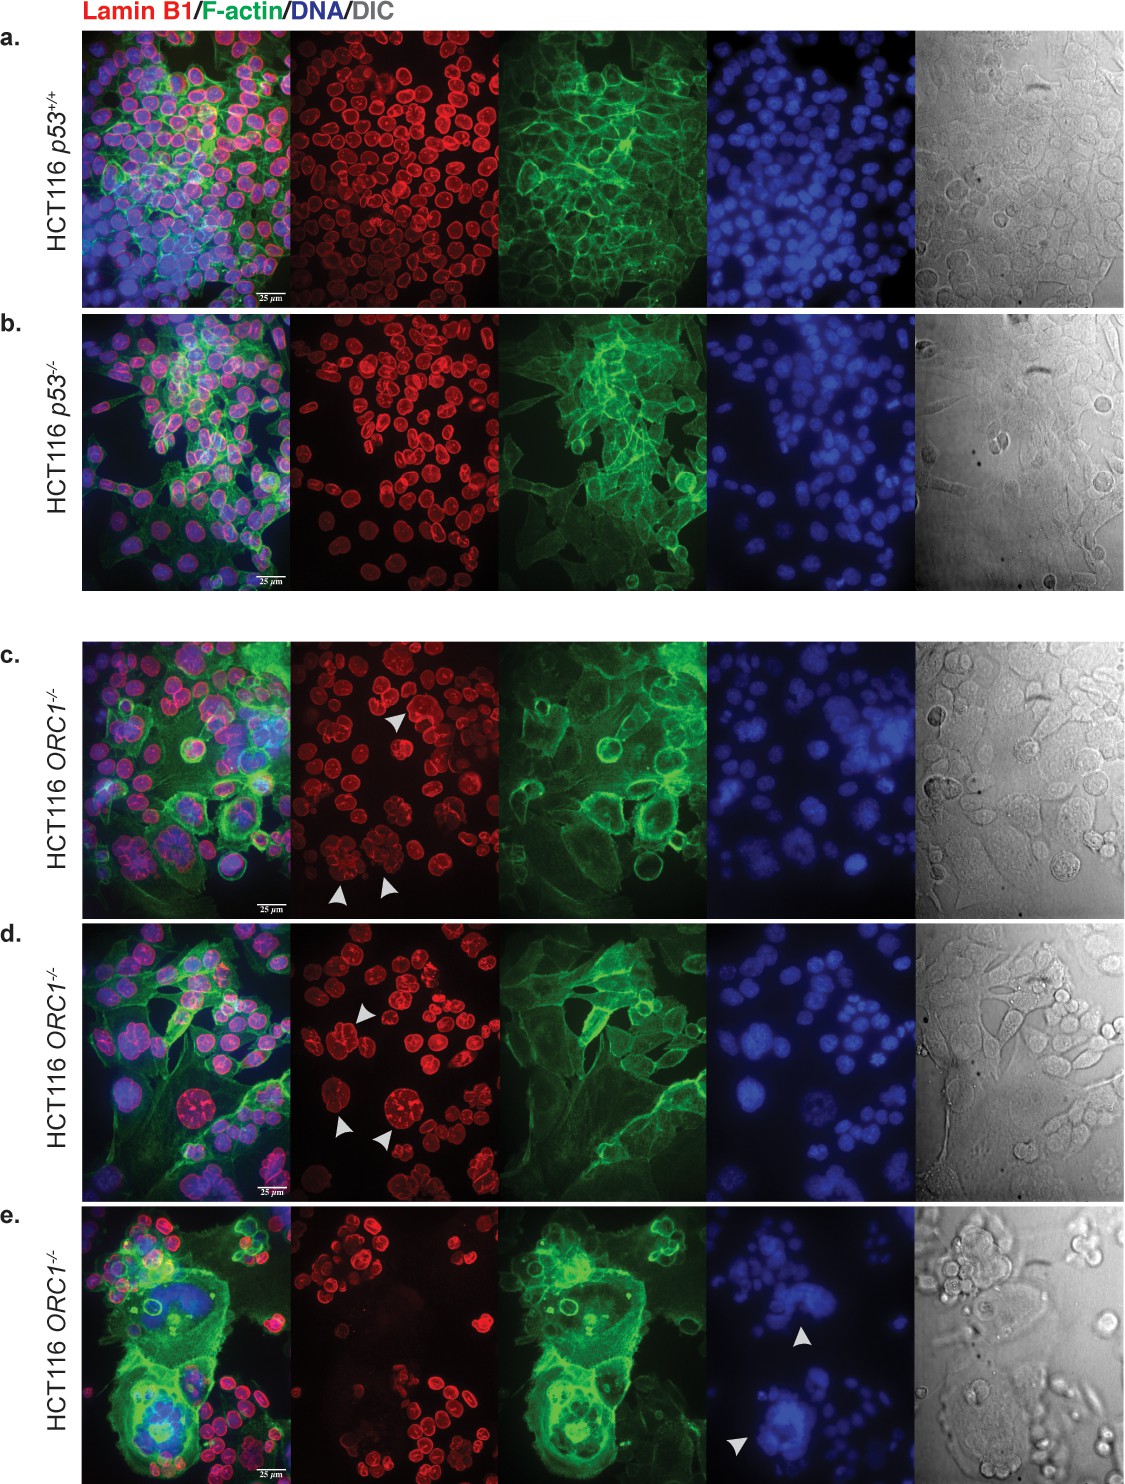
Confocal microscopy images of HCT116 cell lines.
Images acquired as z-stacks of 25 µm (z = 1 µm each). Images presented maximum intensity projections in the merge and average intensity projections in single channel images. Channel reference: Lamin B1 (Red), F-actin (Green), DNA (blue), DIC (gray) (a) HCT116 p53+/+. (b) HCT116 p53-/-. (c–e) HCT116 ORC1-/- (B14). Scale bar is 25 µm.
Figure 8—figure supplement 6
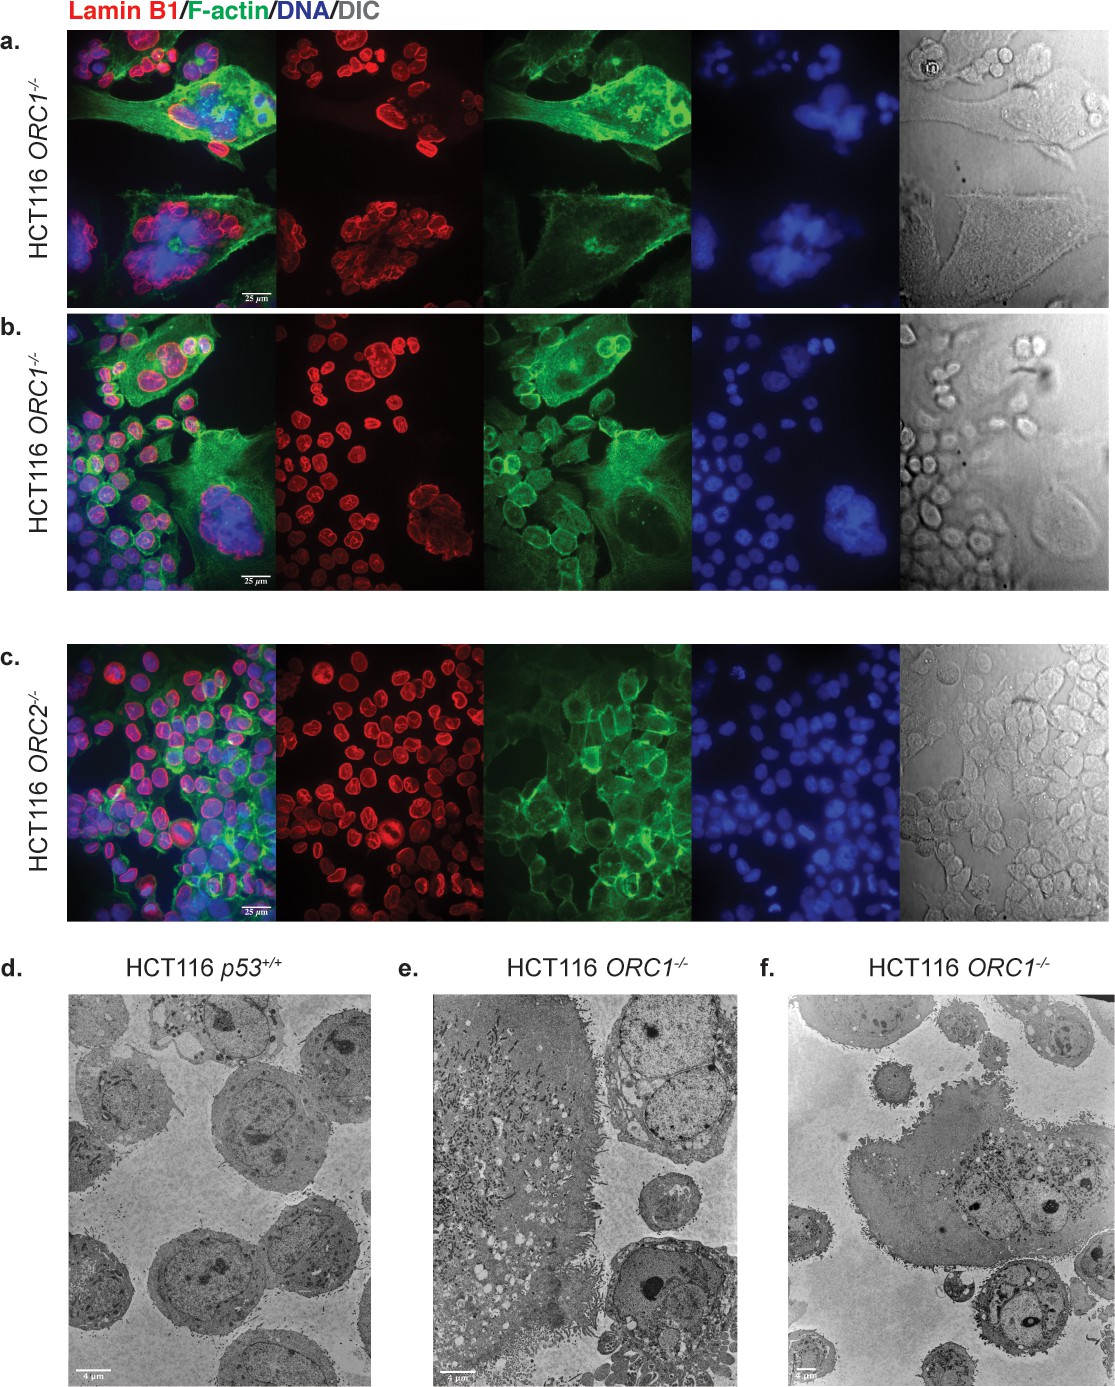
Confocal (a–c) and Transmission electron microscopy (d–f) (TEM) images of HCT116 cell lines.
Confocal: (a–b) HCT116 ORC1-/- (B14), (c) HCT116 ORC2-/-. Scale bar is 25 µm. TEM: (d) HCT116 p53+/+ cells with ×2000 magnification. (e) ORC1-/- cells with ×2000 magnification. (f) ORC1-/- cells with ×1000 magnification. Scale bar in (d–e) is 4 μm.
Tables
Key resources table
| Reagent type (species) or resource | Designation | Source or reference | Identifiers | Additional information |
|---|---|---|---|---|
| Gene (Homo sapiens) | ORC1 | GenBank | NM_004153.4 | |
| Gene (Homo sapiens) | ORC2 | GenBank | NM_006190.5 | |
| Gene (Homo sapiens) | ORC3 | GenBank | NM_181837.3 | |
| Gene (Homo sapiens) | ORC4 | GenBank | NM_001190879.3 | |
| Gene (Homo sapiens) | ORC5 | GenBank | NM_002553.4 | |
| Gene (Homo sapiens) | ORC6 | GenBank | NM_014321.4 | |
| Gene (Homo sapiens) | CDC6 | GenBank | NM_001254.4 | |
| Strain, strain background (Escherichia coli) | Stbl3 | NEB | C3040 | High efficiency chemically competent cells |
| Cell line (H. sapiens) | HCT116 p53+/+ | ATCC | Cat# CCL-247, RRID:CVCL_0291 | Cell line maintained in B. Stillman Lab |
| Cell line (H. sapiens) | RPE-1 | ATCC | Cat# CRL-4000, RRID:CVCL_4388 | Cell line maintained in B. Stillman Lab |
| Cell line (H. sapiens) | HEK293T | ATCC | Cat# CRL-3216, RRID:CVCL_0063 | Cell line maintained in B. Stillman Lab |
| Cell line (H. sapiens) | HCT116 p53-/- | Bunz et al., 1998 | RRID:CVCL_S744 | Generous gift from Anindya Dutta (University of Virginia) |
| Cell line (H. sapiens) | HCT116 p53-/- ORC1-/- (clone B14) | Shibata et al., 2016 | N/A | Generous gift from Anindya Dutta (University of Virginia) |
| Cell line (H. sapiens) | HCT116 p53-/- ORC2-/- (clone P44) | Shibata et al., 2016 | N/A | Generous gift from Anindya Dutta (University of Virginia) |
| Cell line (H. sapiens) | U2OS | ATCC | Cat# HTB-96, RRID:CVCL_0042 | Cell line maintained in B. Stillman Lab |
| Cell line (H. sapiens) | TO-HCT116 (Tet-OsTIR1 HCT116) | Natsume et al., 2016 | N/A | Generous gift from Masato T. Kanemaki (National Institute of Genetics, Japan) |
| Cell line (H. sapiens) | ORC2_H-2 | This study | N/A | Cell line derived from TO-HCT116 |
| Cell line (H. sapiens) | ORC2_H-4 | This study | N/A | Cell line derived from TO-HCT116 |
| Cell line (H. sapiens) | ORC2_H-5 | This study | N/A | Cell line derived from TO-HCT116 |
| Antibody | Lamin B1; Rabbit polyclonal | Abcam | Cat# ab16048, RRID:AB_10107828 | IF – 0.2 µg/ml |
| Antibody | ORC1, mouse monoclonal (pKS1-40) | CSHL In-house | N/A | IB – 1:1000 |
| Antibody | ORC2, rabbit polyclonal (CS205) | CSHL In-house | N/A | IB – 1:10,000 |
| Antibody | ORC3, rabbit polyclonal (CS1980) | CSHL In-house | N/A | IB – 1:10,000 |
| Antibody | CDC6, mouse monoclonal (DCS-180) | EMD Millipore | Cat# 05–550 RRID:AB_2276118 | IB – 1:1000 |
| Antibody | ATM, rabbit monoclonal (Y170) | Abcam | Cat# ab32420 RRID:AB_725574 | IB – 1:1000 |
| Antibody | p-ATM(S1981), rabbit monoclonal (EP1890Y) | Abcam | Cat# ab81292 RRID:AB_1640207 | IB – 1:1000 IF – 1:200 |
| Antibody | CHK1, rabbit monoclonal (EP691Y) | Abcam | Cat# ab40866 RRID:AB_726820 | IB – 1:1,000 |
| Antibody | p-CHK1(S345), rabbit monoclonal (133D3) | Cell Signaling | Cat# 2348 RRID:AB_331212 | IB – 1:1000 IF – 1:200 |
| Antibody | p-CHK2(T68), rabbit monoclonal (C13C1) | Cell Signaling | Cat# 2197 RRID:AB_2080501 | IB – 1:1000 |
| Antibody | p-γH2AX(S139), rabbit monoclonal (20E3) | Cell Signaling | Cat# 9718 RRID:AB_2118009 | IB – 1:1000 IF – 1:200 |
| Antibody | ATR, rabbit polyclonal | Abcam | Cat# ab2905 RRID:AB_303400 | IB – 1:1000 |
| Antibody | p-ATR(T1989), rabbit polyclonal | Abcam | Cat# ab227851 (discontinued) | IB – 1:1000 |
| Antibody | p-ATR(S428), rabbit polyclonal | Cell Signaling | Cat# 2853 RRID:AB_2290281 | IB – 1:1000 |
| Antibody | β-Actin, mouse monoclonal (8H10D10) | Cell Signaling | Cat# 3700 RRID:AB_2242334 | IB – 1:10,000 |
| Antibody | CENP-C, Mouse monoclonal (2159C5a) | Abcam | Cat# ab50974 RRID:AB_869095 | IF – 1:200 |
| Antibody | HP1α, Mouse monoclonal (2HP-1H5) | Millipore | Cat# MAB3584 RRID:AB_94938 | IF – 1:500 |
| Antibody | ECL anti-Rabbit IgG Horseradish Peroxidase linked whole antibody | GE Healthcare | Cat# NA934V | IB – 1:10,000 |
| Antibody | ECL anti-mouse IgG Horseradish Peroxidase linked whole antibody | GE Healthcare | Cat# NA931V | IB – 1:10,000 |
| Antibody | Goat Anti-Mouse IgG H and L Alexa Fluor 647 | Abcam | Cat# ab150115 RRID:AB_2687948 | IF – 1:1000 |
| Antibody | Goat Anti-Rabbit IgG H and L Alexa Fluor 488 | Abcam | Cat# ab150077 RRID:AB_2630356 | IF – 1:1000 |
| Antibody | Goat Anti-Rabbit IgG H and L (Alexa Fluor 594) | Abcam | Cat# ab150084, RRID:AB_2734147 | IF – 1:1000 |
| Antibody | MCM2 (BM28); mouse monoclonal | BD Biosciences | Cat #610700 RRID:AB_2141952 | FC – 1:200 |
| Antibody | Alexa Fluor 647 donkey anti-mouse antibody | Jackson ImmunoResearch Labs | Cat# 715-605-151, RRID:AB_2340863 | FC – 1:1000 |
| Antibody | Phospho-Histone H3 (Ser10), Mouse monoclonal (6G3) | Cell Signaling Technology | Cat# 9706, RRID:AB_331748 | FC – 1:25 |
| Recombinant DNA reagent | LentiV_Cas9_puro (plasmid) | Addgene | RRID:Addgene_108100 | Lentiviral expression of cDNA with puromycin resistance gene – used for making RPE-1 cas9 puro (generous gift from Jason Sheltzer, CSHL) |
| Recombinant DNA reagent | LentiV_Cas9_Blast (plasmid) | Addgene | RRID:Addgene_125592 | Lentiviral expression of cDNA with blasticidin resistance gene – used for making HCT116 cas9 blast (generous gift from Chris Vakoc CSHL) |
| Recombinant DNA reagent | LRG2.1 (plasmid) | Addgene | RRID:Addgene_108098 | BsmBI digestion for sgRNA cloning |
| Recombinant DNA reagent | LgCG_cc88 lentiviral vector (plasmid) | N/A | N/A | Lentiviral expression of Cas9-sgRNA-GFP – used for dropout CRISPR/Cas9 experiment (generous gift from Chris Vakoc, CSHL) |
| Recombinant DNA reagent | epCas9-1.1-mCherry (plasmid) | Chang et al., 2020 | N/A | Generous gift from David Spector (CSHL) |
| Recombinant DNA reagent | pHAGE-CMV-MCS-IZsGreen (plasmid) | N/A | N/A | Lentiviral expression vector – used to construct pHAGE-CMV-H2B-mCherry |
| Recombinant DNA reagent | mAID-mCherry2-NeoR (plasmid) | Addgene | RRID:Addgene_72830 | The plasmid was used to construct mAID-ORC2 transgene |
| Recombinant DNA reagent | pMSCV-hygro retroviral (plasmid) | TaKaRa | Cat #634401 | Retroviral expression of cDNA with hygromycin resistance gene – used to construct pMSCV-hygro-mAID-ORC2 to express mAID-ORC2 in cells |
| Transfected construct (H. sapiens) | pMSCV-hygro-mAID-ORC2 (plasmid) | This study | N/A | Retroviral construct for transduction and express mAID-ORC2 |
| Transfected construct (H. sapiens) | sgRNA_ORC2-1-epCas9-1.1-mCherry (plasmid) | This study | N/A | Construct to transfect and express Cas9 and sgRNA ORC2-1 in human cells |
| Transfected construct (H. sapiens) | pHAGE-CMV-H2B-mCherry (plasmid) | Gift from Dr. Alea Mills, Cold Spring Harbor Laboratory | N/A | Lentiviral construct for transduction and express H2B-mCherry in human cells |
| Sequence-based reagent | F2 | This paper | PCR primer for amplification of sgRNA cassette | TCTTGTGGAAAGGACGAAACACCG |
| Sequence-based reagent | R2 | This paper | PCR primer for amplification of sgRNA cassette | TCTACTATTCTTTCCCCTGCACTGT |
| Commercial assay or kit | NEBuilder HiFi DNA Assembly Cloning Kit | NEB | Cat# E5520S | |
| Commercial assay or kit | Click-iT EdU Alexa Fluor 488 Flow Cytometry Assay Kit | Invitrogen | Cat# C10420 | |
| Commercial assay or kit | DNeasy Blood and Tissue kit | Qiagen | Cat# 69504 | |
| Commercial assay or kit | RNeasy Mini kit | Qiagen | Cat# 74104 | |
| Software, algorithm | Volocity 3D Image Analysis Software | Perkin Elmer | RRID:SCR_002668 | |
| Software, algorithm | GraphPad Prism 9 | GraphPad | RRID:SCR_002798 | |
| Software, algorithm | Model-based Analysis of Genome-wide CRISPR-Cas9 Knockout (MAGeCK) | Li, et al. MAGeCK enables robust identification of essential genes from genome-scale CRISPR/Cas9 knockout screens. Genome Biology 15:554 (2014) | N/A | https://sourceforge.net/p/mageck/wiki/Home/ |
| Software, algorithm | Protiler Analysis | He et al. De novo identification of essential protein domains from CRISPR-Cas9 tiling-sgRNA knockout screens. Nat Commun 10, 4547 (2019) | N/A | https://github.com/MDhewei/protiler |
| Software, algorithm | FlowJo | BD | RRID:SCR_008520 | |
| Software, algorithm | ImageJ | NIH | RRID:SCR_003070 | |
| Chemical compound, drug | Palbociclib | Selleckchem | Cat# S1116 | 1 μM |
| Chemical compound, drug | Thymidine | Millipore Sigma | Cat# 89270 | 2 mM |
| Chemical compound, drug | Doxycycline | CalBiochem | Cat# 324385 | 0.75 ug/ml |
| Chemical compound, drug | Auxin (Indole-3-acetic acid sodium salt) | Millipore Sigma | Cat# 15148 | 500 nM |
| Chemical compound, drug | DAPI | Life Technologies | Cat# D1306 | 1 µg/ml |
| Chemical compound, drug | FxCycle Violet Stain | ThermoFisher | Cat# F10347 | 1:1000 |
| Chemical compound, drug | Hoechst dye | ThermoFisher | Cat# 62249 | 1 µg/ml |
| Chemical compound, drug | Phalloidin iFluor 488 | Abcam | Cat# ab176753 | 1:1000 |
| Chemical compound, drug | Polyethylenimine (PEI 25000) | Polysciences | Cat# 23966–100 | 1 mg/mL |
Additional files
-
Supplementary file 1
The sequences of all guide RNAs used for gene editing, including those directed to ORC1-6 and CDC6 as well as positive and negative guides for the tiling CRISPR screens.
- https://cdn.elifesciences.org/articles/61797/elife-61797-supp1-v2.xlsx
-
Supplementary file 2
Sequence of Barcode primers used for Next Gene Sequencing analysis in tiling CRISPR screens.
- https://cdn.elifesciences.org/articles/61797/elife-61797-supp2-v2.xlsx
-
Supplementary file 3
Primers used for exon analysis qPCR of the ORC2 gene cDNAs from various cell lines.
- https://cdn.elifesciences.org/articles/61797/elife-61797-supp3-v2.xlsx
-
Transparent reporting form
- https://cdn.elifesciences.org/articles/61797/elife-61797-transrepform-v2.docx
Download links
A two-part list of links to download the article, or parts of the article, in various formats.
Downloads (link to download the article as PDF)
Open citations (links to open the citations from this article in various online reference manager services)
Cite this article (links to download the citations from this article in formats compatible with various reference manager tools)
The human origin recognition complex is essential for pre-RC assembly, mitosis, and maintenance of nuclear structure
eLife 10:e61797.
https://doi.org/10.7554/eLife.61797


