Sustained TNF-α stimulation leads to transcriptional memory that greatly enhances signal sensitivity and robustness
- National Laboratory of Biomacromolecules, CAS Center for Excellence in Biomacromolecules, Institute of Biophysics, Chinese Academy of Sciences, China
- College of Life Sciences, University of Chinese Academy of Sciences, China
- Faculty of Health Sciences, University of Macau, China
Figures
Figure 1 with 1 supplement
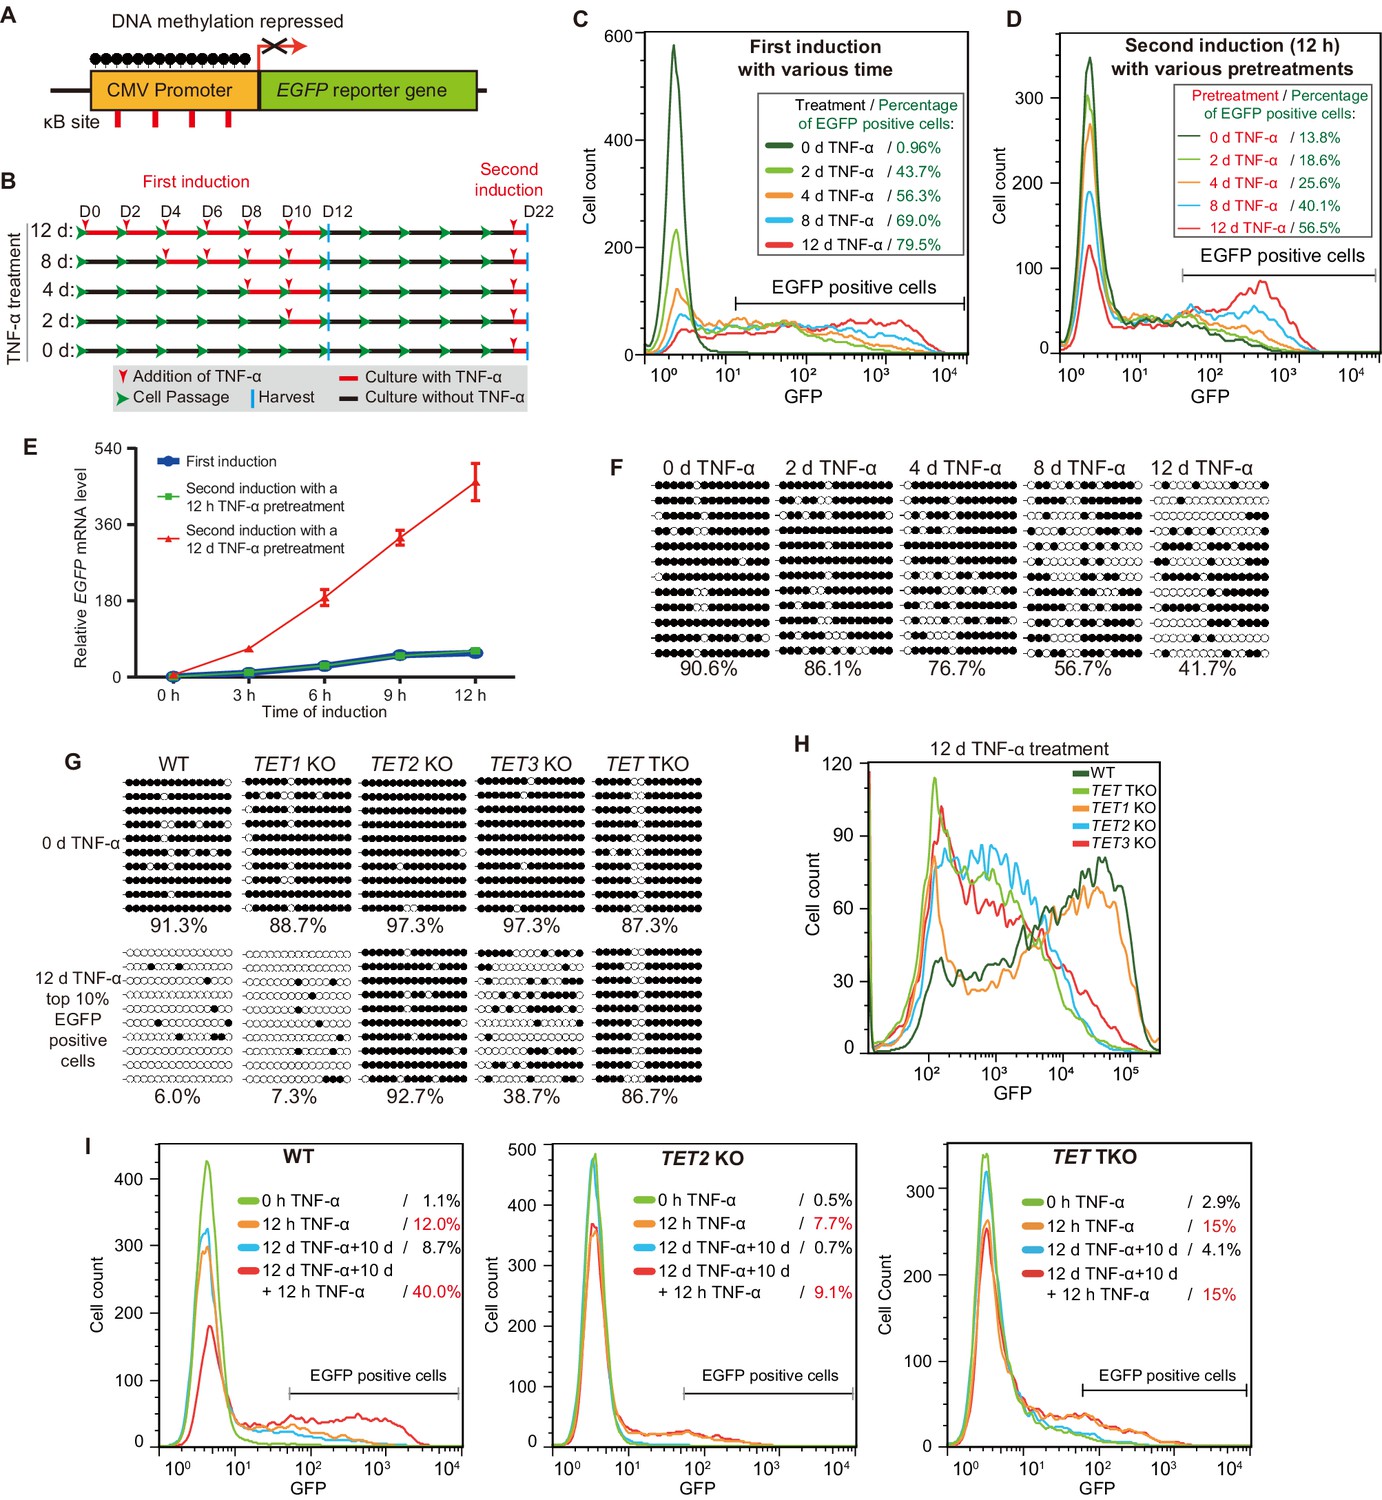
TET enzymes mediate the inflammatory transcriptional memory of a methylated CMV reporter.
(A) Schematic of the EGFP reporter gene stably inserted into the HEK293F genome. The CMV promoter is highly modified and silenced by DNA methylation. (B) Experiment scheme. (C) Flow cytometry analysis of EGFP fluorescent intensity for the cells treated with TNF-α for 0 day, 2 days, 4 days, 8 days, and 12 days. (D) Flow cytometry analysis of EGFP fluorescent intensity for the cells with various pretreatments that received a 12-hr second TNF-α stimulation. (E) RT-qPCR results show the EGFP mRNA level in cells that received a first TNF-α induction and cells that received a second TNF-α induction after 12 hr or 12-day TNF-α treatment. The cells were cultured in TNF-α-free media for 10 days before receiving a second TNF-α induction. GAPDH is used as the internal control. Data are shown as mean ± SD from three independent experiments. Note: although not observable due to the scale of Y-axis, at 0 hr, EGFP mRNA level in cells with 12-day TNF-α pretreatment is fivefold higher than that in naïve cells. (F) Locus-specific bisulfite sequencing results of the CMV promoter for the cells treated with TNF-α for 0 day, 2 days, 4 days, 8 days, and 12 days. Filled circles, methylated CpGs; open circles, unmethylated CpGs. (G) The CMV promoter DNA methylation level of the top 10% of EGFP-positive cells sorted from 12-day-TNF-α-treated WT, TET1 KO, TET2 KO, TET3 KO, and TET TKO cells by flow cytometry. (H) Flow cytometry analysis of EGFP fluorescent intensity for 12-day-TNF-α-treated WT, TET1 KO, TET2 KO, TET3 KO, and TET TKO cells. (I) Flow cytometry analysis of the inflammatory transcriptional memory of the EGFP reporter in WT, TET2 KO, and TET TKO cells.
-
Figure 1—source data 1
Related to Figure 1E.
- https://cdn.elifesciences.org/articles/61965/elife-61965-fig1-data1-v2.xlsx
Figure 1—figure supplement 1
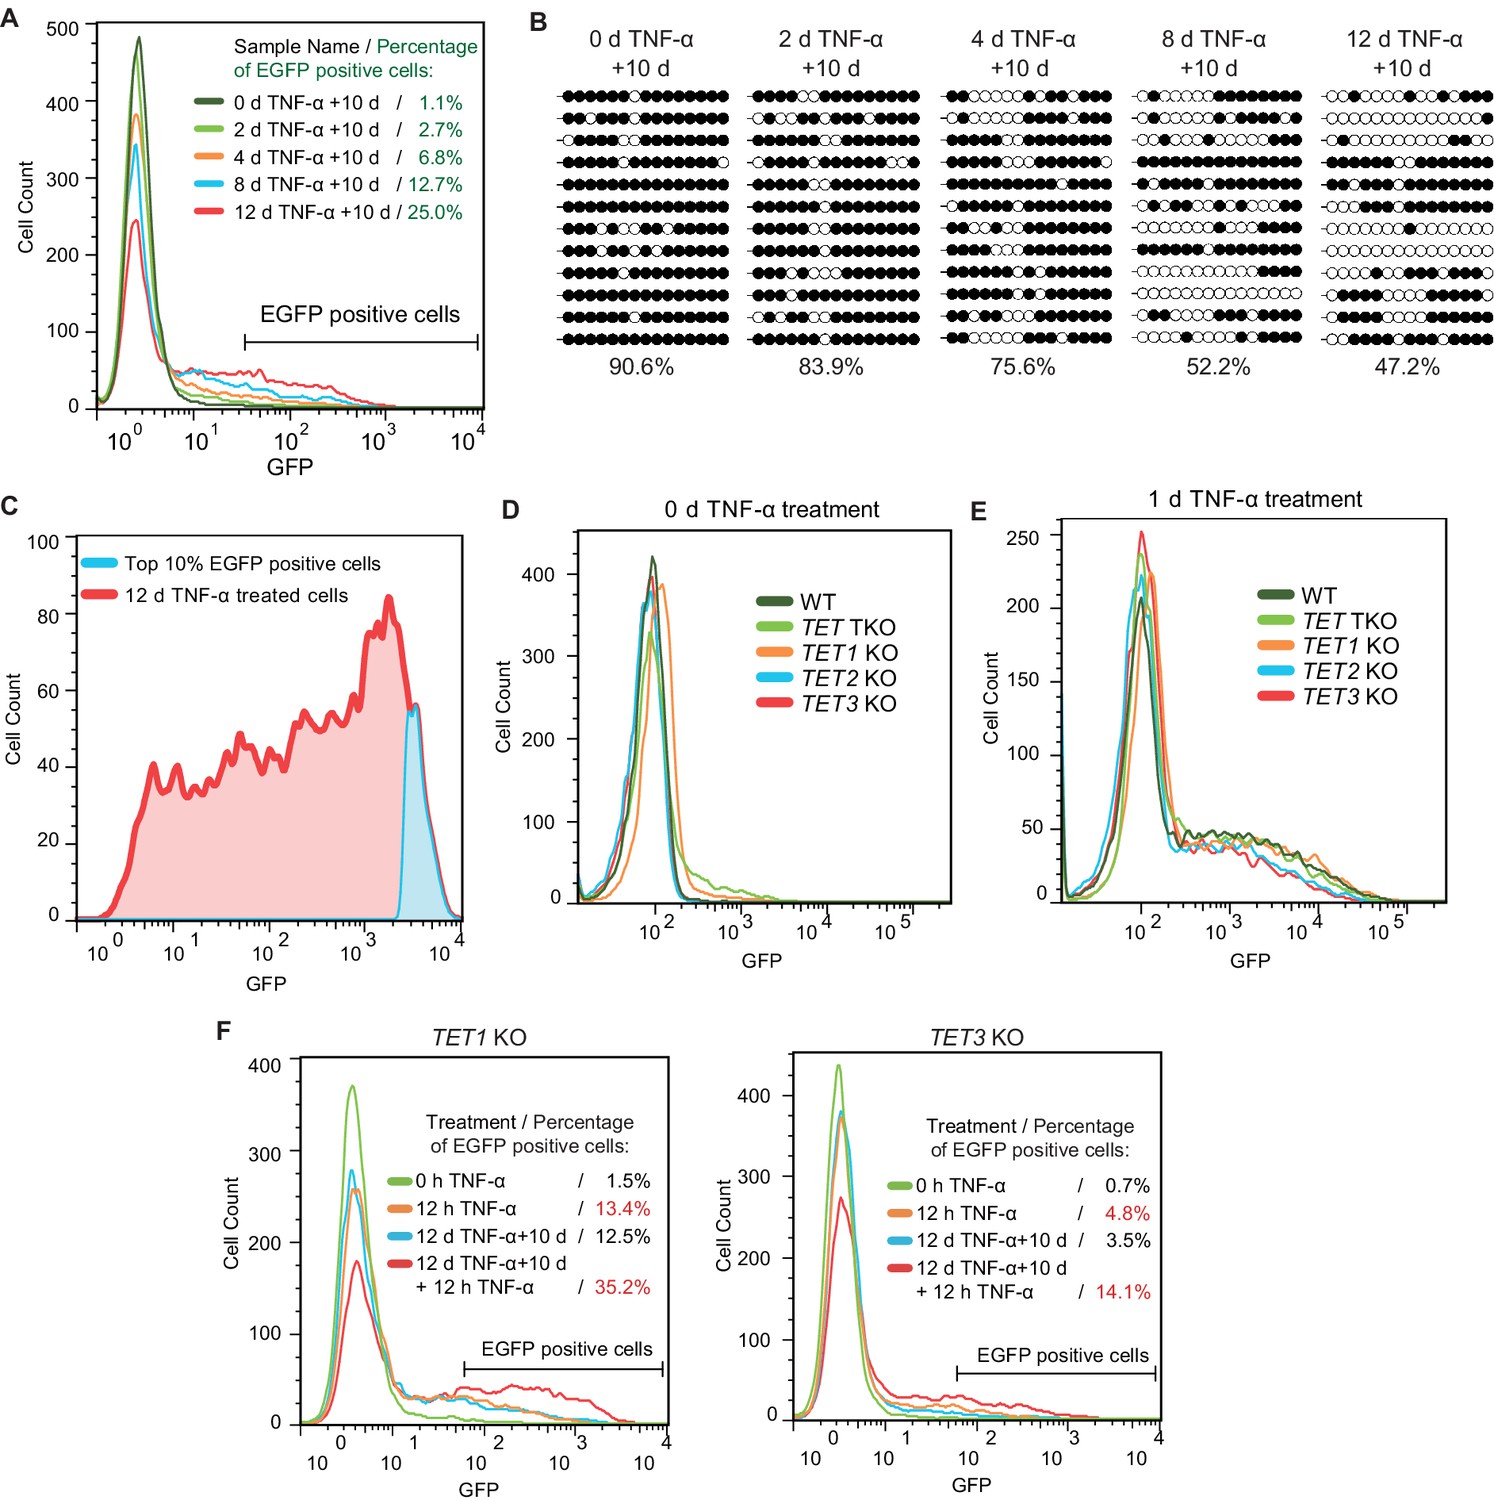
TET enzymes mediate the inflammatory transcriptional memory of a methylated CMV reporter.
(A) Flow cytometry analysis of EGFP fluorescent intensity for the cells with various pretreatments. (B) Locus-specific bisulfite sequencing results of the CMV promoter for the cells with various pretreatments. (C) Top 10% EGFP positive cells were sorted from 12-day-TNF-α-treated cell by flow cytometry. (D) Flow cytometry analysis of EGFP fluorescent intensity for 0-day-TNF-α-treated WT, TET1 KO, TET2 KO, TET3 KO, and TET TKO cells. (E) Flow cytometry analysis of EGFP fluorescent intensity for 1-day-TNF-α-treated WT, TET1 KO, TET2 KO, TET3 KO, and TET TKO cells. (F) Flow cytometry analysis of the inflammatory transcriptional memory of the EGFP reporter in TET1 KO and TET3 KO cells.
Figure 2 with 1 supplement
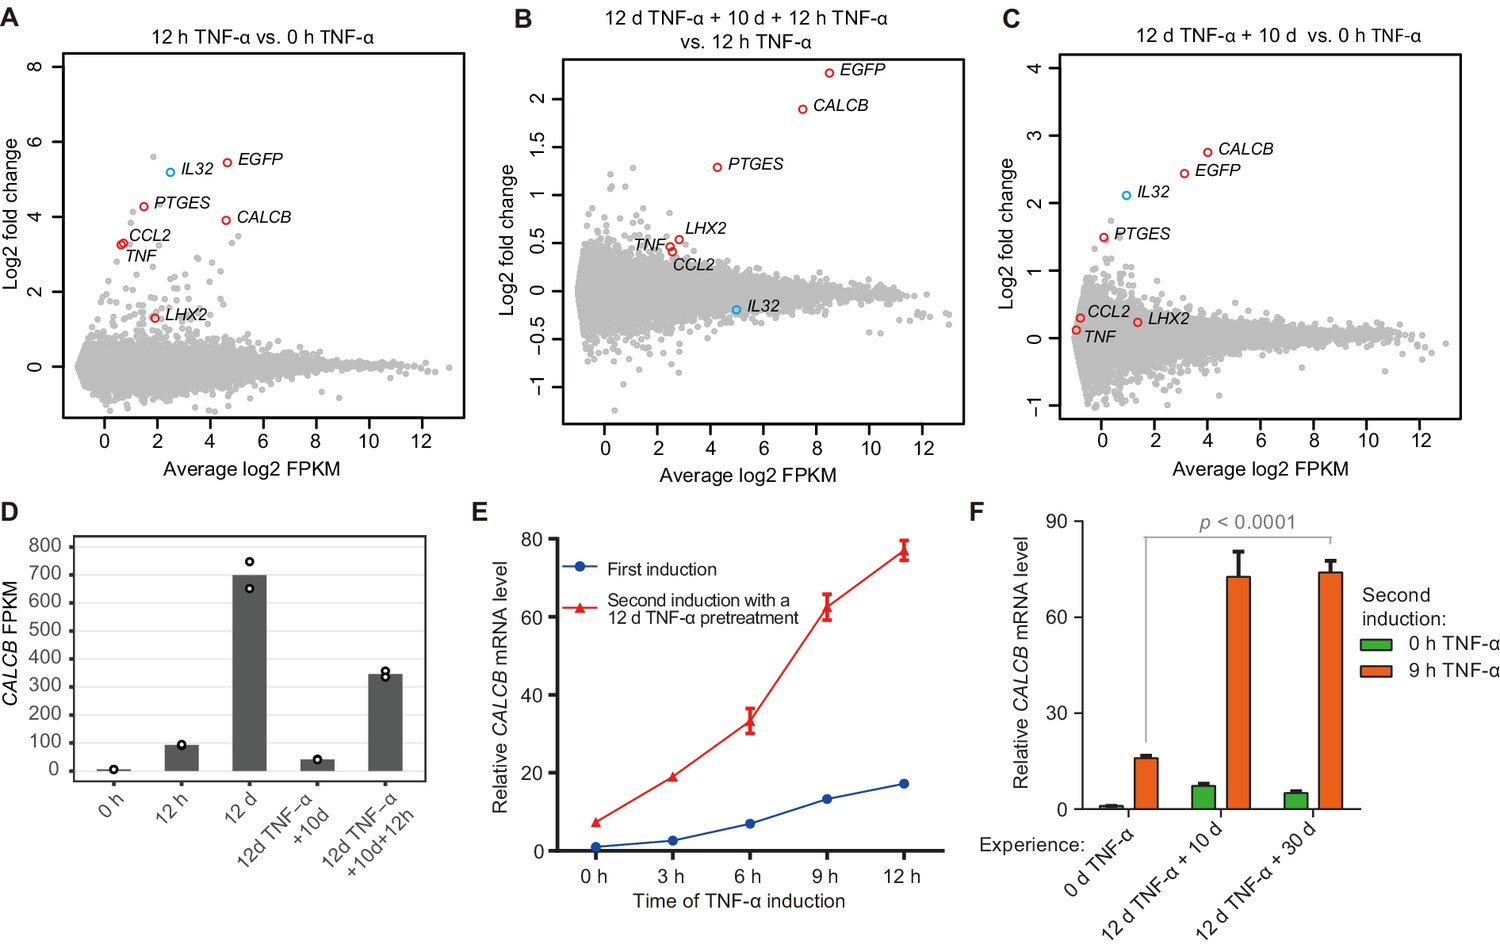
Identification of endogenous genes with inflammatory transcriptional memory.
(A) Transcriptome changes between cells treated with TNF-α for 12 hr (12 hr TNF-α) and untreated cells (0 hr TNF-α). Red circles indicate genes with memory effect, and blue circle indicates IL32. (B) Transcriptome changes between cells received the second induction (12 days TNF-α + 10 days + 12 hr TNF-α-treated cells) and the first induction (12 hr TNF-α). (C) Transcriptome changes between cells rested for 10 days following a 12-day pretreatment (12 days TNF-α + 10 days) and untreated cells (0 hr TNF-α). (D) Expression levels (in FPKM) of CALCB in various treatment conditions. (E) RT-qPCR results show the CALCB mRNA level in cells that received a first TNF-α induction and in cells that received a second TNF-α induction after prior 12-day TNF-α treatment. The cells were cultured in TNF-α-free media for 10 days before receiving a second TNF-α stimulation. GAPDH is used as the internal control. Data are shown as mean ± SD from three independent experiments. (F) RT-qPCR results show the CALCB mRNA level. The cells that experienced 12 days of TNF-α treatment were cultured in TNF-α-free media for 10 days and 30 days, and then induced with a second TNF-α treatment for 9 hr. GAPDH is used as the internal control. Data are shown as mean ± SD from three independent experiments. One-tailed t-test.
-
Figure 2—source data 1
Related to Figure 2A.
- https://cdn.elifesciences.org/articles/61965/elife-61965-fig2-data1-v2.txt.zip
-
Figure 2—source data 2
Related to Figure 2B.
- https://cdn.elifesciences.org/articles/61965/elife-61965-fig2-data2-v2.txt.zip
-
Figure 2—source data 3
Related to Figure 2C.
- https://cdn.elifesciences.org/articles/61965/elife-61965-fig2-data3-v2.txt.zip
-
Figure 2—source data 4
Related to Figure 2D.
- https://cdn.elifesciences.org/articles/61965/elife-61965-fig2-data4-v2.txt.zip
-
Figure 2—source data 5
Related to Figure 2E.
- https://cdn.elifesciences.org/articles/61965/elife-61965-fig2-data5-v2.xlsx
-
Figure 2—source data 6
Related to Figure 2F.
- https://cdn.elifesciences.org/articles/61965/elife-61965-fig2-data6-v2.xlsx
Figure 2—figure supplement 1

Identification of genes with transcriptional memory in response to TNF-α.
(A) Expression levels (in FPKM) of EGFP, CALCB, PTGES, LHX2, CCL2, TNF, and IL32 in various treatment conditions. (B) Genome browser representations of RNA-seq results at CALCB locus in various treatment conditions. (C) The left figure shows the comparison of the transcriptomes between the naïve cells (0 hr TNF-α) and memory consolidated cells (12 days TNF-α + 10 days). The right figure shows the comparison of the transcriptomes between the first induction (12 hr TNF-α) and the second induction (12 days TNF-α + 10 days + 12 hr TNF-α).
Figure 3 with 1 supplement
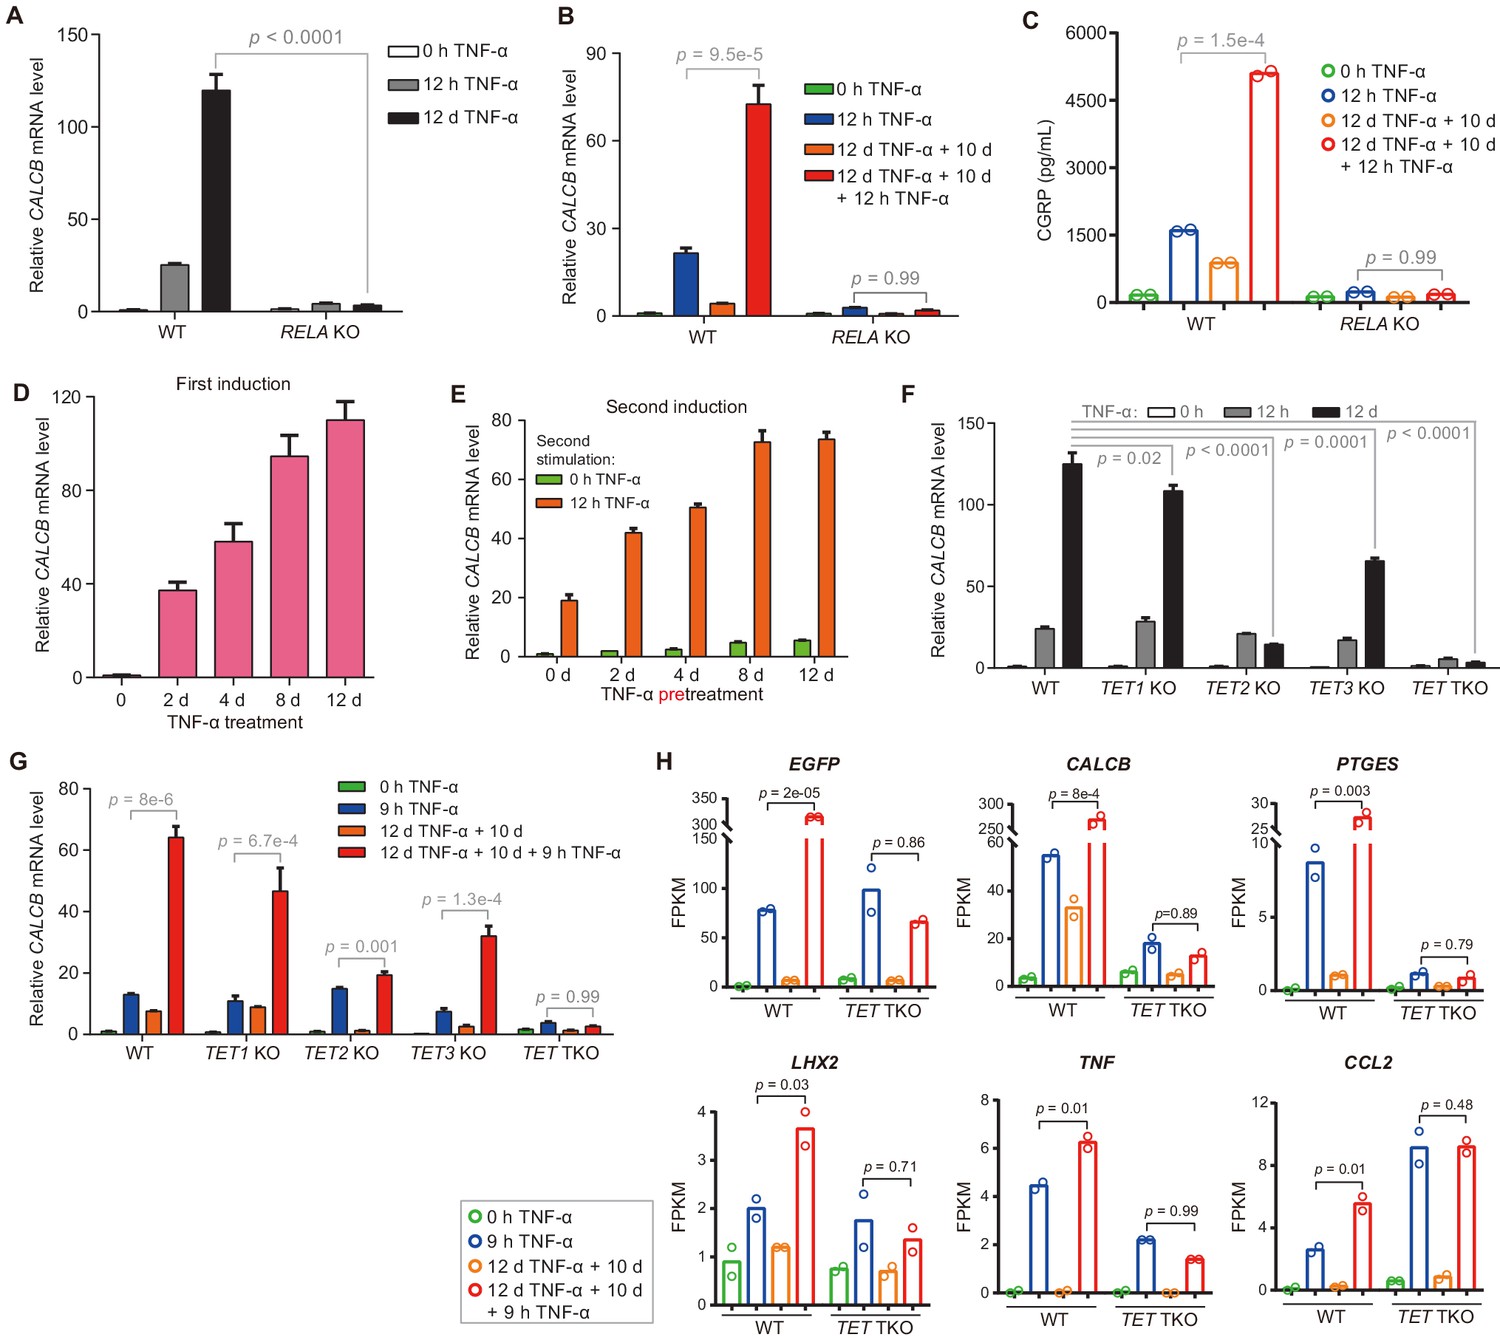
The inflammatory transcriptional memory of CALCB is dependent on p65 and TET enzymes.
(A) RT-qPCR results show the CALCB mRNA levels at 0 hr, 12 hr, and 12 days in TNF-α-treated WT and RELA KO cells. GAPDH is used as the internal control. Data are shown as mean ± SD from three independent experiments. Two-tailed t-test. (B) RT-qPCR results show the transcriptional memory of CALCB in WT and RELA KO cells in response to TNF-α. GAPDH is used as the internal control. Data are shown as mean ± SD from three independent experiments. One-tailed t-test. (C) Sandwich ELISA results show the CGRP release level in the media for WT and RELA KO cells in response to TNF-α. Data are shown as the mean from two independent experiments. One-tailed t-test. (D) RT-qPCR results show the CALCB mRNA levels in WT cells treated with TNF-α for 0 day, 2 days, 4 days, 8 days, and 12 days. GAPDH is used as the internal control. Data are shown as mean ± SD from three independent experiments. (E) RT-qPCR results show the CALCB mRNA level in WT cells with various pretreatments that received a second TNF-α induction for 12 hr. GAPDH is used as the internal control. Data are shown as mean ± SD from three independent experiments. (F) RT-qPCR results show the CALCB mRNA level in WT, TET1 KO, TET2 KO, TET3 KO, and TET TKO cells treated with TNF-α stimulation for 0 hr, 12 hr, and 12 days. GAPDH is used as the internal control. Data are shown as mean ± SD from three independent experiments. Two-tailed t-test. (G) RT-qPCR results show the transcriptional memory of CALCB in WT, TET1 KO, TET2 KO, TET3 KO, and TET TKO cells in response to TNF-α. GAPDH is used as the internal control. Data are shown as mean ± SD from three independent experiments. One-tailed t-test. (H) Expression levels (in FPKM) of EGFP, CALCB, PTGES, LHX2, TNF, CCL2 for WT, and TET TKO cell in various treatment conditions. Data are shown as the mean from two independent experiments. One-tailed t-test.
-
Figure 3—source data 1
Related to Figure 3A.
- https://cdn.elifesciences.org/articles/61965/elife-61965-fig3-data1-v2.xlsx
-
Figure 3—source data 2
Related to Figure 3B.
- https://cdn.elifesciences.org/articles/61965/elife-61965-fig3-data2-v2.xlsx
-
Figure 3—source data 3
Related to Figure 3C.
- https://cdn.elifesciences.org/articles/61965/elife-61965-fig3-data3-v2.xlsx
-
Figure 3—source data 4
Related to Figure 3D.
- https://cdn.elifesciences.org/articles/61965/elife-61965-fig3-data4-v2.xlsx
-
Figure 3—source data 5
Related to Figure 3E.
- https://cdn.elifesciences.org/articles/61965/elife-61965-fig3-data5-v2.xlsx
-
Figure 3—source data 6
Related to Figure 3F.
- https://cdn.elifesciences.org/articles/61965/elife-61965-fig3-data6-v2.xlsx
-
Figure 3—source data 7
Related to Figure 3G.
- https://cdn.elifesciences.org/articles/61965/elife-61965-fig3-data7-v2.xlsx
-
Figure 3—source data 8
Related to Figure 3H.
- https://cdn.elifesciences.org/articles/61965/elife-61965-fig3-data8-v2.xlsx
Figure 3—figure supplement 1
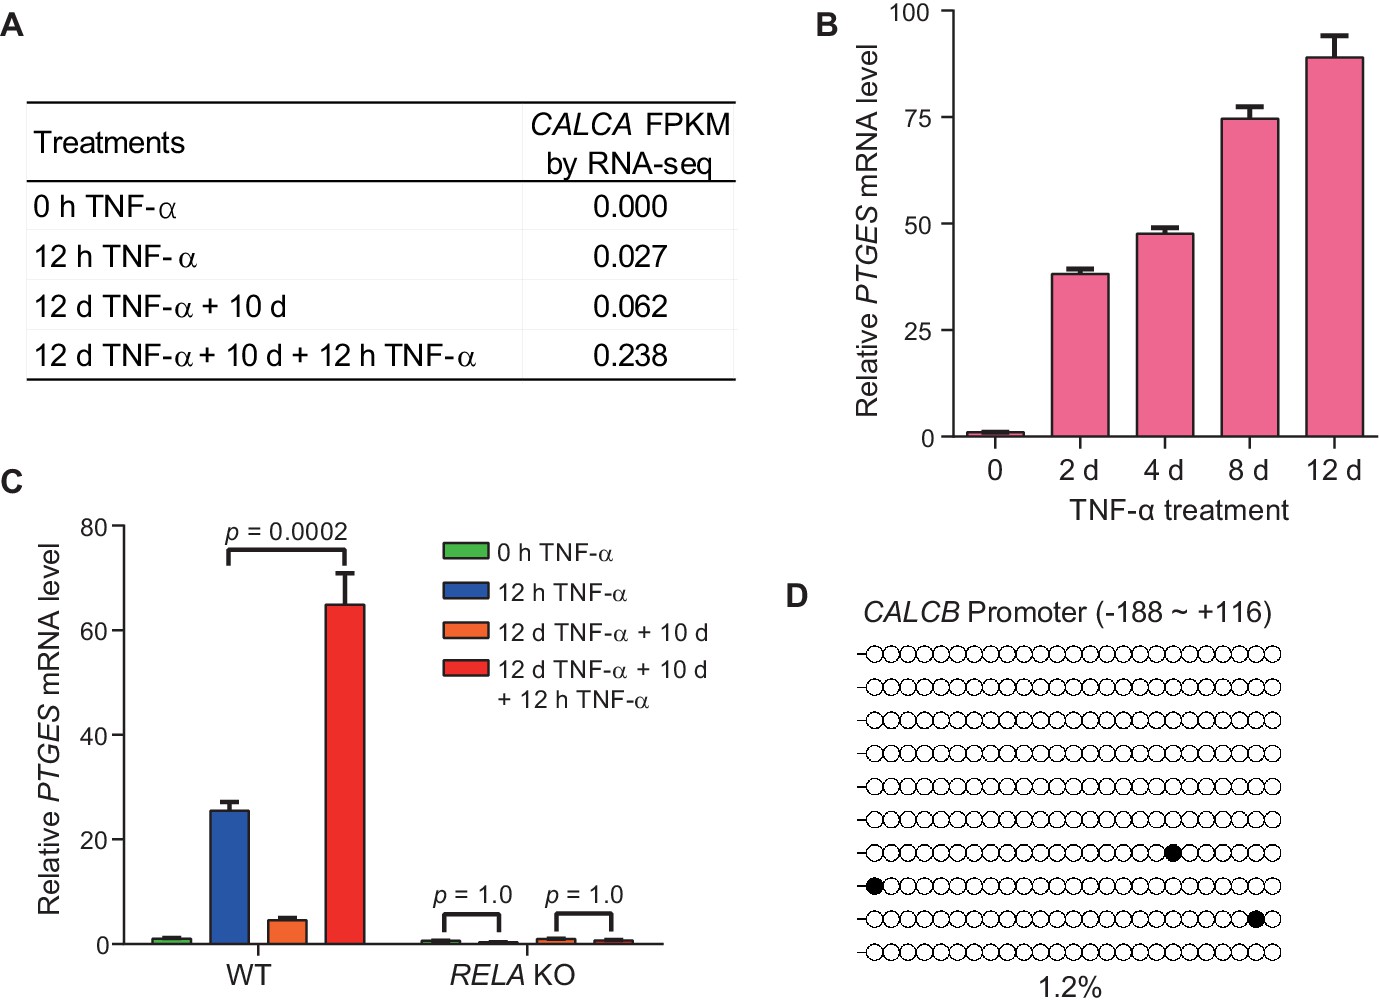
The inflammatory transcriptional memory of CALCB and PTGES.
(A) Expression levels (in FPKM) of CACLA in various treatment conditions. (B) RT-qPCR results show the PTGES mRNA levels in WT cells treated with TNF-α for 0 day, 2 days, 4 days, 8 days, and 12 days. Data are shown as mean ± SD from three independent experiments. (C) RT-qPCR results show the transcriptional memory of PTGES in WT and RELA KO cells in response to TNF-α. Data are shown as mean ± SD from three independent experiments. One-tailed t-test. (D) Locus-specific bisulfite sequencing results of the CALCB promoter for the naïve cells. Filled circles, methylated CpGs; open circles, unmethylated CpGs.
Figure 4 with 1 supplement
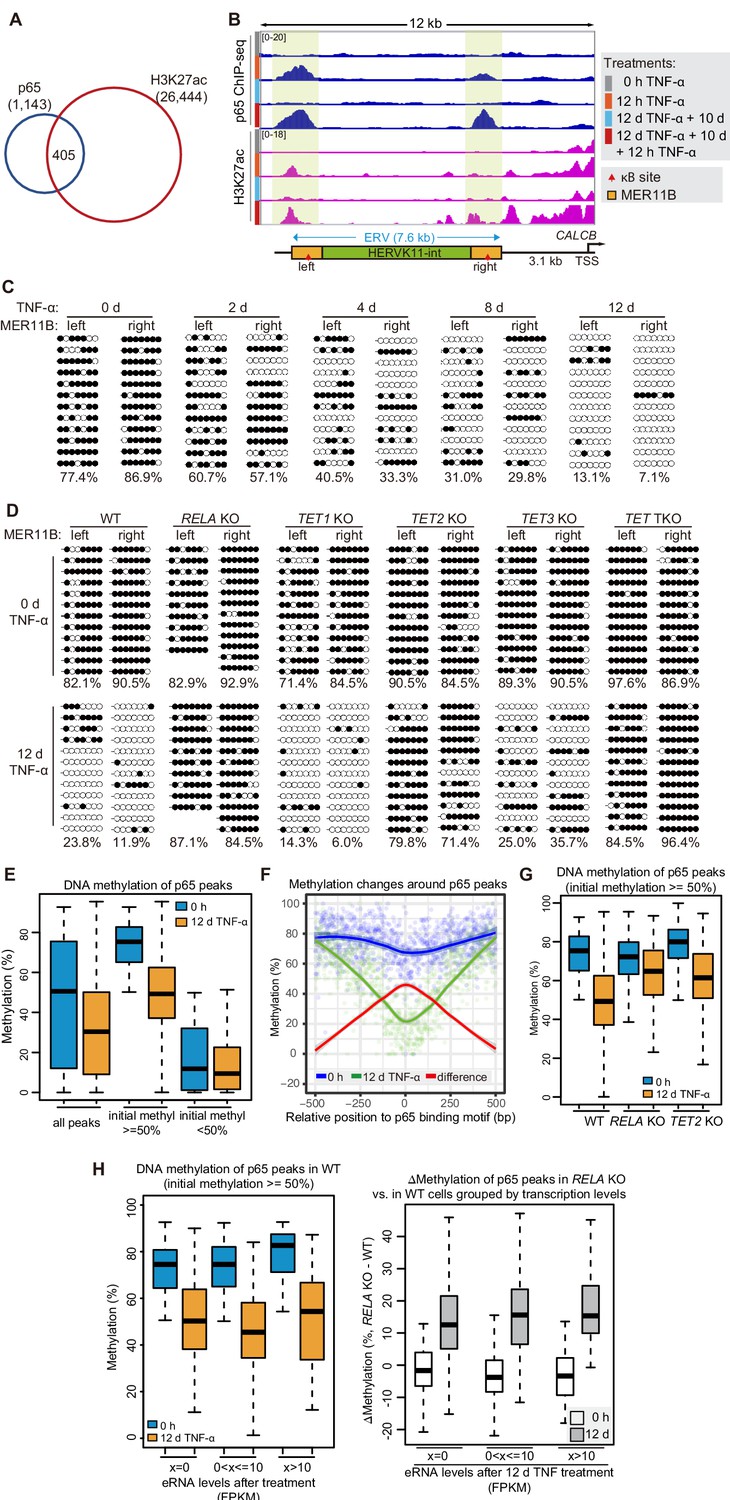
DNA demethylation of TNF-α-responsive elements during memory consolidation depends on TET enzymes and p65.
(A) Overlap between p65 ChIP-seq peaks and H3K27ac ChIP-seq peaks in cells treated with TNF-α for 12 hr. (B) Genome browser view shows p65 occupancy and H3K27ac ChIP-seq signal at the endogenous retrovirus (ERV) region upstream of CALCB gene. (C) Locus-specific bisulfite sequencing results of MER11B-left LTR and MER11B-right elements for the cells treated with TNF-α for 0 day, 2 days, 4 days, 8 days, and 12 days. (D) Locus-specific bisulfite sequencing results show the DNA methylation level of MER11B-left LTR and MER11B-right elements for 0-day and 12-day TNF-α-treated WT, TET1 KO, TET2 KO, TET3 KO, TET TKO, and RELA KO cells. (E) Changes of DNA methylation of p65 peaks in 12-day TNF-α-treated cells vs. 0 hr treated cell. Highly methylated and lowly methylated regions are also shown separately. (F) DNA methylation around p65 peaks. Colored dots indicate each CpG by relative positions to the binding motif with the highest score. Lowess-smoothed curves were drawn for 0 hr (blue), 12-day TNF-α treatment (green), and the differences between them (red). (G) Average methylation level of p65 peaks in WT, RELA KO, and TET2 KO cell with 0 hr or 12-day TNF-α treatment. Only p65 peaks that were initially methylated (methylation level ≥50%) are plotted. (H) Left panel shows average methylation level of p65 peaks in WT cells with 0 hr or 12 days TNF-α treatment, categorized by three indicated transcription levels (eRNA at peaks normalized in RPKM). Right panel shows the methylation difference of p65 peaks in RELA KO in comparison to that in WT cells, with or without 12-day TNF-α treatment. Similar to panel G, p65 peaks that were initially methylated (methylation level ≥50%) are used in panel H.
-
Figure 4—source data 1
Related to Figure 4E and G.
- https://cdn.elifesciences.org/articles/61965/elife-61965-fig4-data1-v2.txt.zip
-
Figure 4—source data 2
Related to Figure 4F.
- https://cdn.elifesciences.org/articles/61965/elife-61965-fig4-data2-v2.txt.zip
Figure 4—figure supplement 1
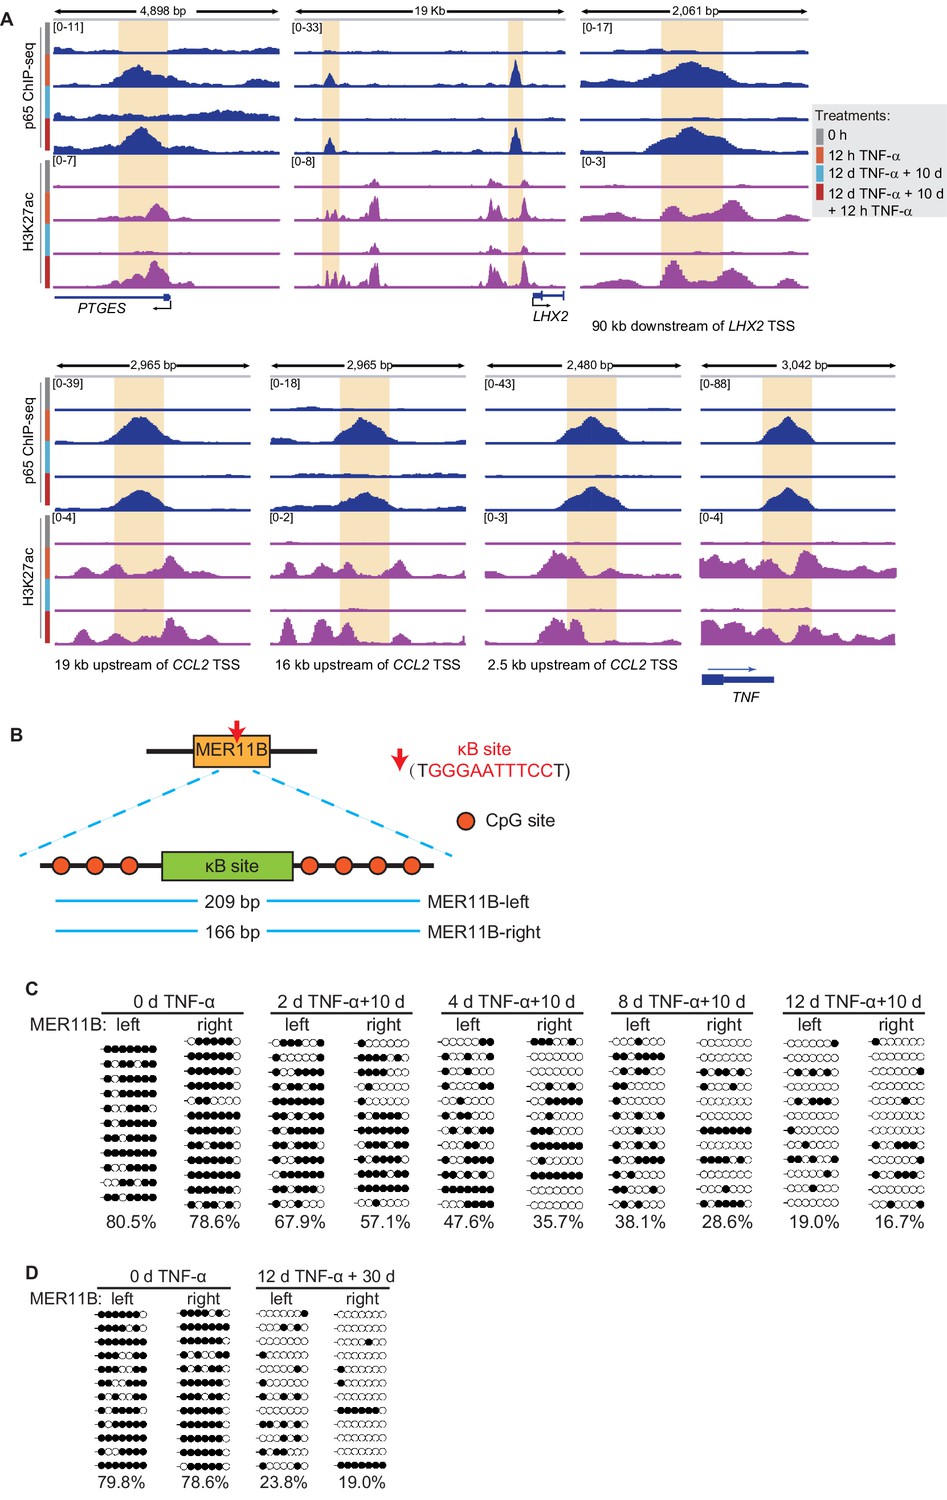
The DNA methylation of MER11B elements adjacent to CALCB can be maintained after TNF-α withdrawal.
(A) Genome browser view shows p65 occupancy and H3K27ac ChIP-seq signal at the TNF-α- responsive elements of PTGES, LHX2, CCL2, and TNF genes. (B) The schematic of κB site (GGGAATTTCC) and its surrounding CpG sites in the MER11B elements adjacent to CALCB. (C) Locus-specific bisulfite sequencing results of MER11B-left and MER11B-right elements for the cells with various pretreatments. (D) Locus-specific bisulfite sequencing results of MER11B-left and MER11B-right elements for the naïve cells, and the cells that experienced 12 days of TNF-α treatment were cultured in TNF-α-free media for 30 days.
Figure 5 with 2 supplements
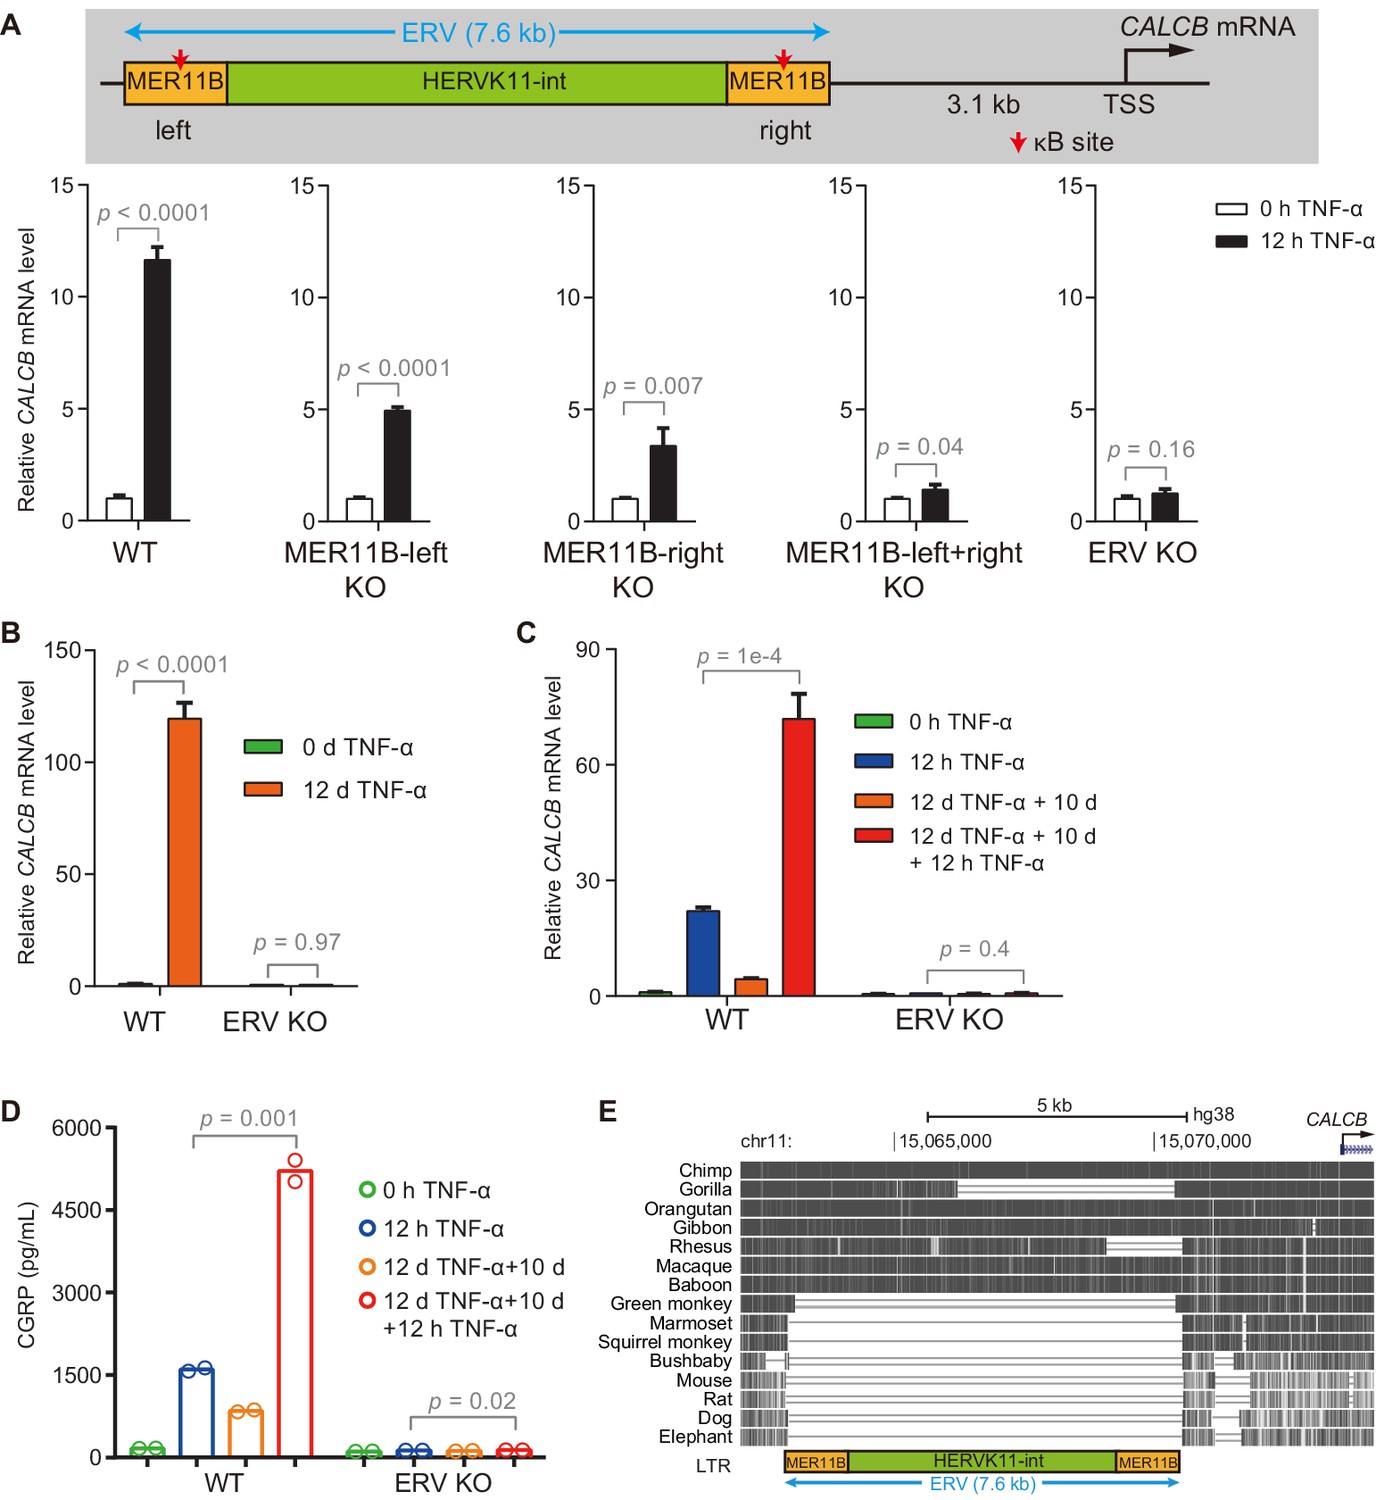
The ERV upstream of CALCB is required for its TNF-α-induced activation and transcriptional memory.
(A) RT-qPCR results show the CALCB mRNA level of WT, MER11B-left KO, MER11B-right KO, MER11B-left+right KO, and ERV KO cells treated with TNF-α for 0 hr and 12 hr. GAPDH is used as the internal control. Data are shown as mean ± SD from three independent experiments. Two-tailed t-test. (B) RT-qPCR results show CALCB transcriptional levels at 0 hr and 12 days in TNF-α-treated WT and ERV KO cells. GAPDH is used as the internal control. Data are shown as mean ± SD from three independent experiments. Two-tailed t-test. (C) RT-qPCR results show the transcriptional memory of CALCB in WT and ERV KO cells in response to TNF-α. GAPDH is used as the internal control. Data are shown as mean ± SD from three independent experiments. One-tailed t-test. (D) Sandwich ELISA results show the CGRP release level in the media for WT and ERV KO cells in response to TNF-α. Data are shown as the mean from two independent experiments. One-tailed t-test. (E) UCSC genome browser track shows multiple alignments of the ERV region upstream of the CALCB gene in selected vertebrate species.
-
Figure 5—source data 1
Related to Figure 5B.
- https://cdn.elifesciences.org/articles/61965/elife-61965-fig5-data1-v2.xlsx
-
Figure 5—source data 2
Related to Figure 5C.
- https://cdn.elifesciences.org/articles/61965/elife-61965-fig5-data2-v2.xlsx
-
Figure 5—source data 3
Related to Figure 5D.
- https://cdn.elifesciences.org/articles/61965/elife-61965-fig5-data3-v2.xlsx
Figure 5—figure supplement 1
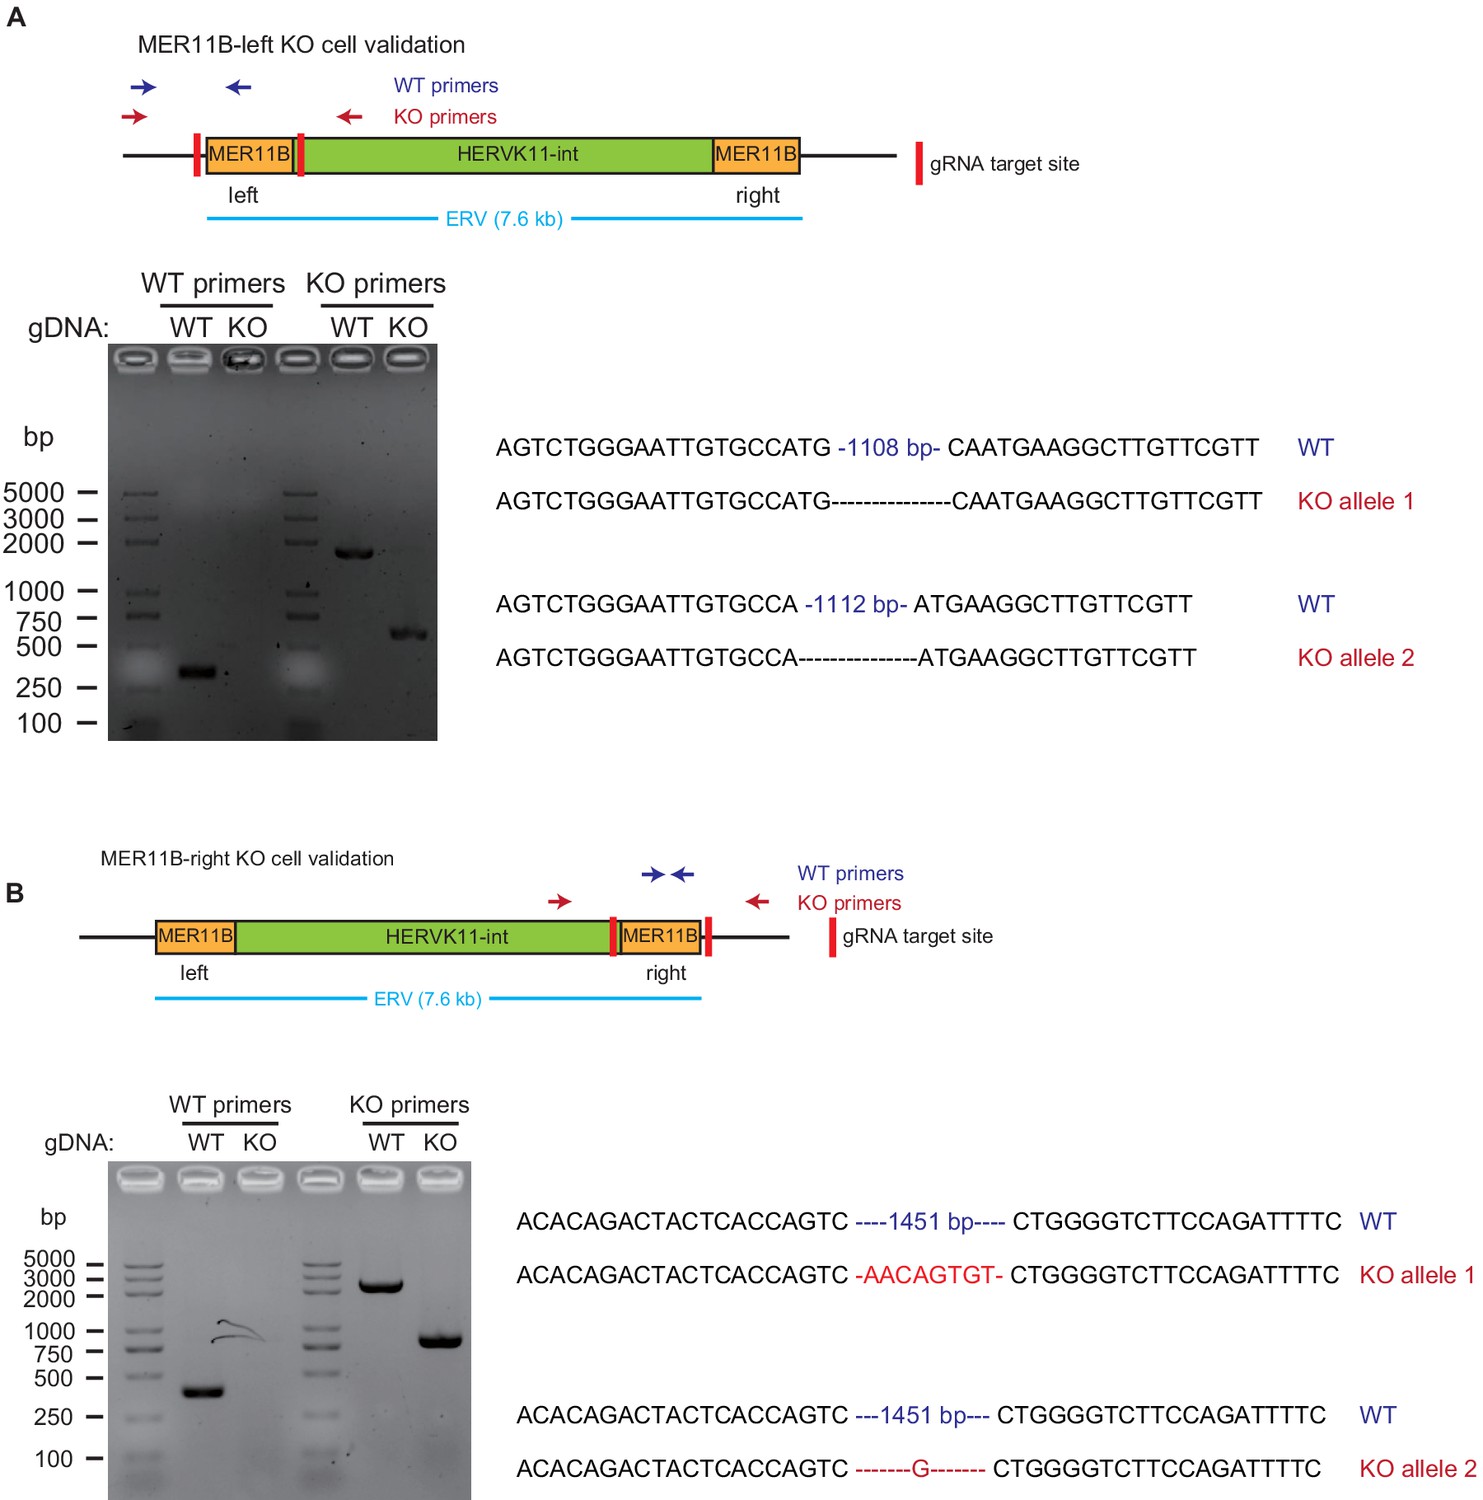
Validation of MER11B-left KO cells and MER11B-right KO cells.
For each panel, the upper part is a schematic illustration of the KO design, the lower left is the gel image of PCR validation, and the lower right is the sequences of WT and KO alleles. Panel A is for MER11B-left KO cells, and panel B is for MER11B-right KO cells.
Figure 5—figure supplement 2
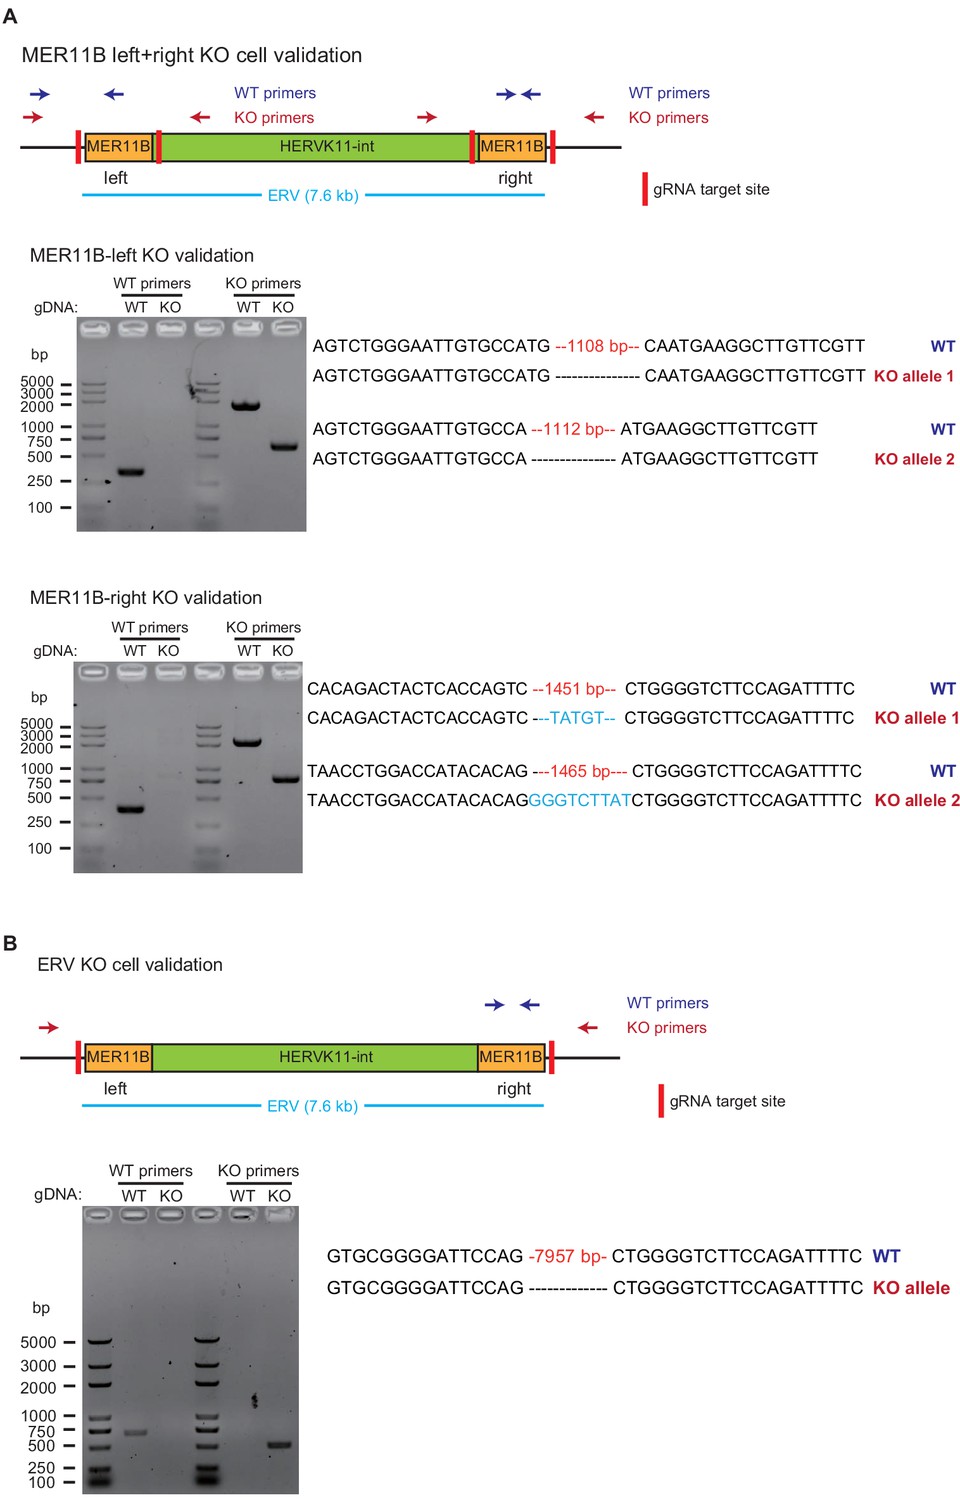
Validation of MER11B-left+right KO cells and ERV KO cells.
The layout is the same as that of Figure 5—figure supplement 1. Panel A is for MER11B-left+right KO cells, and panel B is for ERV KO cells.
Figure 6 with 1 supplement
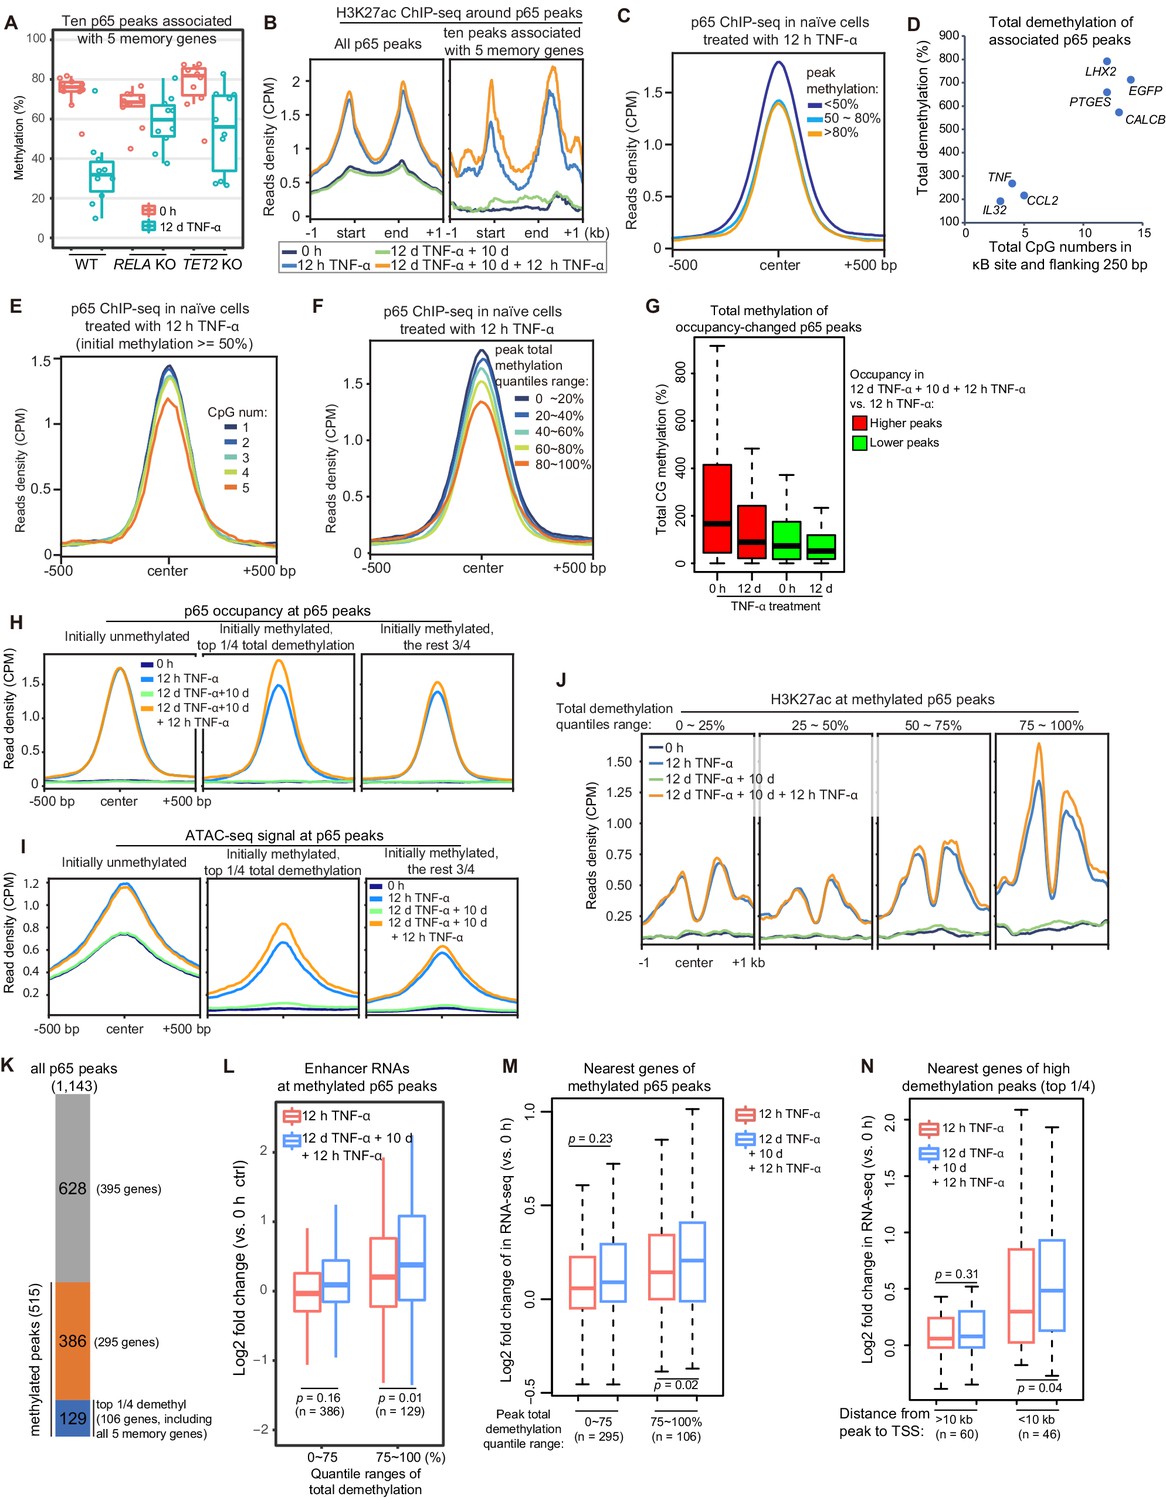
High initial methylation level and CpG density determine the functional potential of transcriptional memory modules in response to TNF-α stimulation.
(A) Methylation levels of ten p65 peaks that are associated with the five memory genes. Average values of p65 peaks are shown as circles for 0 hr and 12 days TNF-α-treated WT, RELA KO and TET2 KO cells, respectively. (B) H3K27ac ChIP-seq profiles around all p65 peaks (left) and ten peaks that are associated with five memory genes (right). Different colors indicate cells with various treatments. (C) Averaged profile of p65 ChIP-seq at p65 peaks grouped by various peak methylation levels. In addition to sequencing depth, read counts located at initially unmethylated p65 peaks (methylation level less than 20%) were used to determine the scale factor for normalization of ChIP-seq signals. Peak-centered 1 kb region are shown. (D) Five memory genes, together with EGFP and IL32, are plotted for their CpG numbers and total demethylation of associated p65 peaks in the flanking 250 bp regions of κB sites. (E) Averaged profile of p65 ChIP-seq at methylated p65 peaks grouped by CpG numbers. (F) Averaged profile of p65 ChIP-seq at p65 peaks grouped by total methylations in five ranges of quantiles. (G) Total methylation level of occupancy-changed p65 peaks that were treated with 0 hr or 12 days TNF-α. Red columns stand for p65 peaks that are relatively higher in the second induction, and green ones stand for p65 peaks that are relatively lower in the second induction (as indicated in Figure 6—figure supplement 1). (H) Averaged p65 occupancy at p65 peaks that are categorized into three groups by initial methylation level and total demethylations in 12-day TNF-α treatment vs. 0 hr. The left plot shows initially unmethylated p65 peaks (mCG <20%), the middle one shows initially methylated p65 peaks with the top 25% total demethylation after 12-day TNF-α treatment (higher than the upper quartile, Q3), and the right one shows initially methylated p65 peaks with the lowest 75% total demethylation. The four treatments are shown in indicated colors. (I) Averaged ATAC-seq profile at p65 peaks that are categorized into three groups by the same criteria as that used in panel H. (J) Averaged profile of H3K27ac ChIP-seq at methylated p65 peaks that are grouped into four ranges of quantiles by total demethylations in 12-day TNF-α treatment vs. 0 hr. The four treatments are shown in indicated colors. (K) The number of p65 peaks and their associated genes in designated groups. (L) Expression changes of enhancer RNAs at p65 peaks with different degree of demethylation. Paired two-tailed t-test. (M) Expression changes of nearest genes of methylated p65 peaks. Paired two-tailed t-test. (N) Impact of distance between p65 peaks and TSSs of neighboring genes. Paired two-tailed t-test.
-
Figure 6—source data 1
Related to Figure 6A.
- https://cdn.elifesciences.org/articles/61965/elife-61965-fig6-data1-v2.txt.zip
-
Figure 6—source data 2
Related to Figure 6D.
- https://cdn.elifesciences.org/articles/61965/elife-61965-fig6-data2-v2.xlsx
-
Figure 6—source data 3
Related to Figure 6L.
- https://cdn.elifesciences.org/articles/61965/elife-61965-fig6-data3-v2.txt.zip
-
Figure 6—source data 4
Related to Figure 6M.
- https://cdn.elifesciences.org/articles/61965/elife-61965-fig6-data4-v2.txt.zip
-
Figure 6—source data 5
Related to Figure 6N.
- https://cdn.elifesciences.org/articles/61965/elife-61965-fig6-data5-v2.xlsx
Figure 6—figure supplement 1
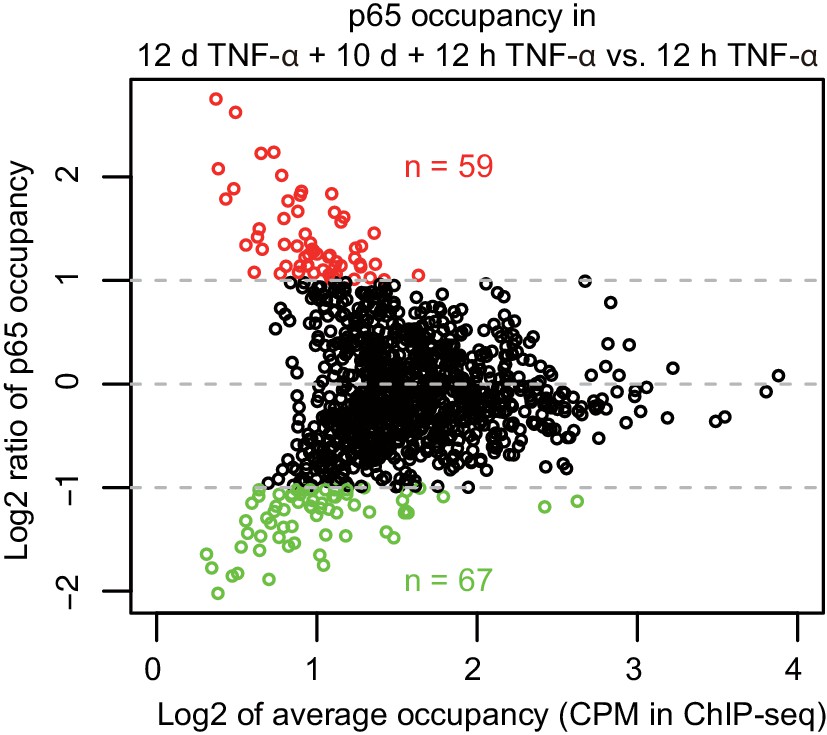
MA-plot of p65 occupancy in two times of induction.
Aligned reads within p65 peaks were counted and normalized by sequencing depth and peak length of 1 kb, for ChIP-seq in cells treated with 12 hr TNF-α (first induction) and 12 days TNF-α + 10 days + 12 hr TNF-α (second induction), respectively. p65 peaks identified in the two times of induction were combined together. Peaks that are higher or lower than twofold in the second induction are colored in red or green, respectively.
Figure 7
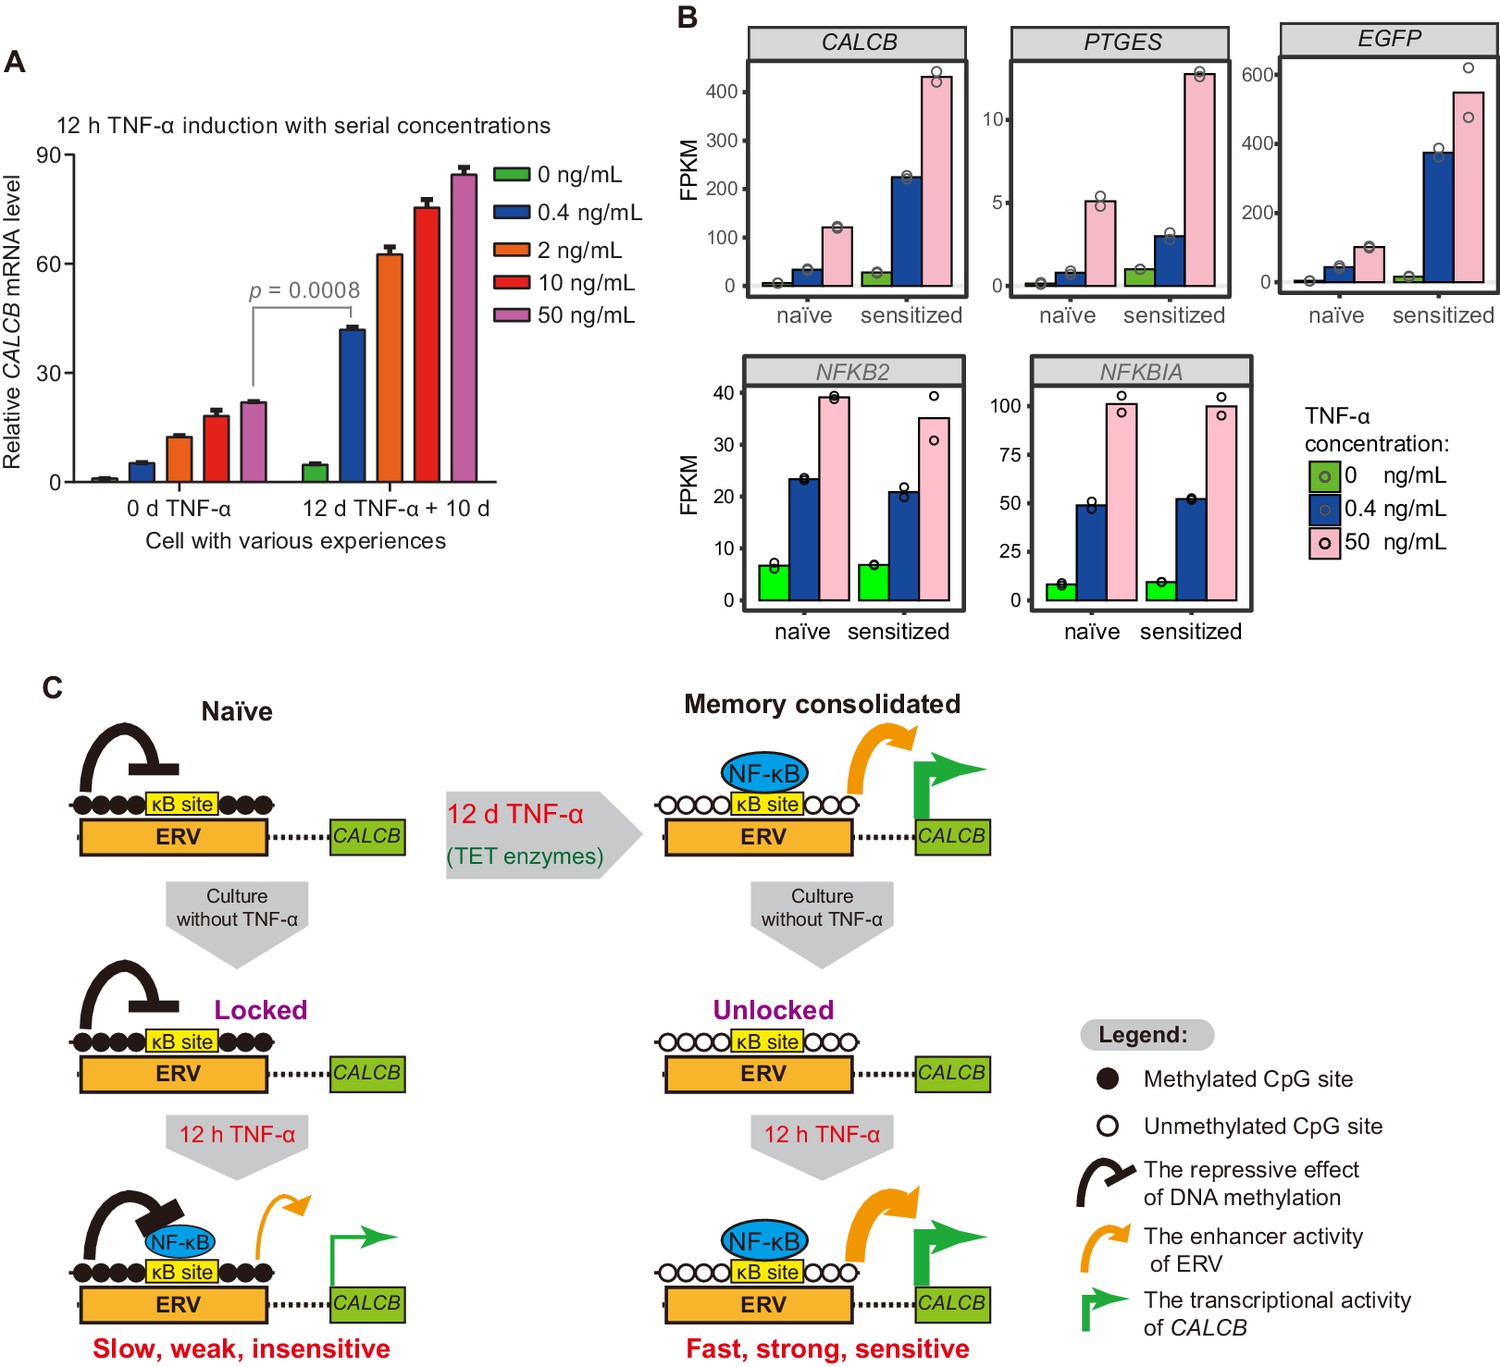
The memory consolidated cells are highly sensitive to low-dose TNF-α induction.
(A) RT-qPCR results show the CALCB transcriptional level of naïve cells and of cells that had experienced 12 days of TNF-α treatment following 12 hr of 0.4 ng/mL, 2 ng/mL, 10 ng/mL, and 50 ng/mL TNF-α treatments. The cells were cultured in TNF-α-free media for 10 days before receiving a second TNF-α stimulation. GAPDH is used as the internal control. Data are shown as mean ± SD from two independent experiments. Two-tailed t-test. (B) Expression levels (in FPKM) of EGFP, CALCB, and PTGES for naïve cells and memory consolidated cells in response to 12 hr TNF-α induction with various TNF-α concentrations. NFKB2 and NFKBIA, two TNF-α induced genes with no memory effect, are shown for comparison. Data are shown as the mean from two independent experiments. (C) Model illustration for the co-option of an ERV into the transcriptional memory module of CALCB in response to TNF-α. Memory consolidation offers faster, stronger, and more sensitive subsequent induction.
-
Figure 7—source data 1
Related to Figure 7A.
- https://cdn.elifesciences.org/articles/61965/elife-61965-fig7-data1-v2.xlsx
-
Figure 7—source data 2
Related to Figure 7B.
- https://cdn.elifesciences.org/articles/61965/elife-61965-fig7-data2-v2.txt.zip
Author response image 1
Author response image 2
Author response image 3
Author response image 4
Tables
Key resources table
| Reagent type (species) or resource | Designation | Source or reference | Identifiers | Additional information |
|---|---|---|---|---|
| Cell line (Homo sapiens) | HEK293F with a stable reporter | PMID:29559556 | ||
| Cell line (Homo sapiens) | HEK293F with a stable reporter, TET1 KO | PMID:30824537 | ||
| Cell line (Homo sapiens) | HEK293F with a stable reporter, TET2 KO | PMID:30824537 | ||
| Cell line (Homo sapiens) | HEK293F with a stable reporter, TET3 KO | PMID:30824537 | ||
| Cell line (Homo sapiens) | HEK293F with a stable reporter, TET TKO | PMID:30824537 | ||
| Cell line (Homo sapiens) | HEK293F with a stable reporter, RELA KO | PMID:30824537 | ||
| Cell line (Homo sapiens) | HEK293F with a stable reporter, MER11B-left KO | This paper | Available upon request | |
| Cell line (Homo sapiens) | HEK293F with a stable reporter, MER11B-right KO | This paper | Available upon request | |
| Cell line (Homo sapiens) | HEK293F with a stable reporter, MER11B-left+right KO | This paper | Available upon request | |
| Cell line (Homo sapiens) | HEK293F with a stable reporter, ERV KO | This paper | Available upon request | |
| Antibody | Rabbit anti-NF-κB p65 | Santa Cruz | Cat# sc-372; RRID:AB_632037 | 6 μL/ChIP |
| Antibody | Rabbit anti-H3K27ac | Active Motif | Cat# 39133; RRID:AB_2561016 | 2 μL/ChIP |
| Recombinant DNA reagent | lentiCRISPR v2 | Addgene | Cat# 52961 | |
| Peptide, recombinant protein | Recombinant human TNF-α | Peprotech | Cat# 300-01A | |
| Commercial assay or kit | KAPA HiFi Hotstart Uracil+ ReadyMix PCR kit | Kapa Biosystems | Cat# KK2801 | |
| Commercial assay or kit | CGRP (human) ELISA Kit | Cayman Chemical | Cat# 589101 | |
| Commercial assay or kit | EpiTect Bisulfite Kit | Qiagen | Cat# 59104 | |
| Commercial assay or kit | NEBNext Enzymatic Methyl-seq Conversion Module | NEB | Cat# E7125L | |
| Software, algorithm | BiQ Analyzer | Bock et al., 2005 | version 2.00 | |
| Software, algorithm | FlowJo | Becton, Dickinson and Company | version 7.6.1 | |
| Software, algorithm | GraphPad Prism | GraphPad Software, La Jolla California USA | version 7.00 | |
| Software, algorithm | Bismark v0.22.3 | Krueger and Andrews, 2011; https://github.com/FelixKrueger/Bismark | PMID:21493656 | |
| Software, algorithm | Bowtie2 v2.3.5.1 | http://bowtie-bio.sourceforge.net/bowtie2/ | PMID:22388286 | |
| Software, algorithm | IGV v2.7.2 | http://software.broadinstitute.org/software/igv/ | PMID:21221095 | |
| Software, algorithm | Bedtools | Quinlan laboratory at the University of Utah | PMID:20110278 | |
| Software, algorithm | R software v3.6.0 | https://www.r-project.org/ | The R Foundation | |
| Software, algorithm | Rstudio v1.2.5042 | https://rstudio.com/ | Rstudio Software | |
| Software, algorithm | FastQC v0.11.9 | https://www.bioinformatics.babraham.ac.uk/projects/fastqc/ | Simon Andrews | |
| Software, algorithm | Cuffdiff v2.2.1 | Trapnell et al., 2012; http://cole-trapnell-lab.github.io/cufflinks/cuffdiff/ | PMID:22383036 | |
| Software, algorithm | STAR v2.7.3a | Dobin et al., 2013; https://github.com/alexdobin/STAR | PMID:23104886 | |
| Software, algorithm | DSS v2.34.0 | https://bioconductor.org/packages/DSS/ | PMID:26819470 | |
| Software, algorithm | deepTools v3.4.2 | Ramírez et al., 2016; https://github.com/deeptools/deepTools | PMID:27079975 | |
| Software, algorithm | Perl v5.26.2 | https://www.perl.org/ | Perl-5.26.2 |
Author response table 1
| Treatment | TET1 | TET2 | TET3 |
|---|---|---|---|
| 0 h | 2.31 | 2.97 | 6.05 |
| 12 h TNF-α | 2.33 | 2.90 | 9.29 |
| 12 d TNF-α | 3.04 | 2.77 | 6.89 |
| 12 d TNF-α + 10 d | 2.05 | 2.79 | 5.92 |
| 12 d TNF-α + 10 d + 12 h TNF-α | 2.47 | 3.29 | 9.97 |
Author response table 2
| TNF-α Treatment | 5hmdC/106 dC | SD |
|---|---|---|
| 0 d | 22.6 | 1.2 |
| 2 d | 30.2 | 1.3 |
| 4 d | 31.2 | 0.6 |
| 6 d | 32.2 | 1.9 |
| 8 d | 37.8 | 4.2 |
| 12 d | 37.6 | 1.6 |
Additional files
-
Source code 1
The source code file for high-throughput data analysis in this study.
- https://cdn.elifesciences.org/articles/61965/elife-61965-code1-v2.r.zip
-
Supplementary file 1
Sequence of the DNA oligonucleotides used in this study.
- https://cdn.elifesciences.org/articles/61965/elife-61965-supp1-v2.docx
-
Supplementary file 2
Genomic sequences for locus-specific bisulfite PCR sequencing analysis.
- https://cdn.elifesciences.org/articles/61965/elife-61965-supp2-v2.docx
-
Supplementary file 3
QC metrics for high-throughput experiments.
Sheet 1: Basic QC stats for mRNA-seq experiments; Sheet 2: List of differentially expressed genes and FPKM values. Two replicates are shown; Sheet 3: Basic QC stats for WGBS experiments; Sheet 4: Differentially methylated regions (DMRs) between cells treated with 12 days TNF-α vs. 0 hr TNF-α cells; Sheet 5: DMRs between cells treated with 12 days TNF-α vs. 0 hr TNF-α RELA KO cells; Sheet 6: DMRs between cells treated with 12 days TNF-α vs. 0 hr TNF-α TET2 KO cells; Sheet 7: Basic QC stats for ChIP-seq experiments; Sheet 8: Read counts of p65 peaks in various treated samples, normalized in reads per million per kb peak; Sheet 9: Basic QC stats for ATAC-seq experiments.
- https://cdn.elifesciences.org/articles/61965/elife-61965-supp3-v2.xlsx
-
Transparent reporting form
- https://cdn.elifesciences.org/articles/61965/elife-61965-transrepform-v2.pdf
Download links
A two-part list of links to download the article, or parts of the article, in various formats.
Downloads (link to download the article as PDF)
Open citations (links to open the citations from this article in various online reference manager services)
Cite this article (links to download the citations from this article in formats compatible with various reference manager tools)
Sustained TNF-α stimulation leads to transcriptional memory that greatly enhances signal sensitivity and robustness
eLife 9:e61965.
https://doi.org/10.7554/eLife.61965


