SUV39 SET domains mediate crosstalk of heterochromatic histone marks
- Department of Molecular Biology, Faculty of Science, University of Geneva, Switzerland
- Institute of Chemical Sciences and Engineering (ISIC), Ecole Polytechnique Fédérale de Lausanne (EPFL), Switzerland
- Leicester Institute for Structural and Chemical Biology, University of Leicester, United Kingdom
- Department of Molecular and Cell Biology, University of Leicester, United Kingdom
- University Medical Center, University of Geneva, Switzerland
- School of Pharmaceutical Sciences, Faculty of Science, University of Geneva, Switzerland
Figures
Figure 1 with 1 supplement
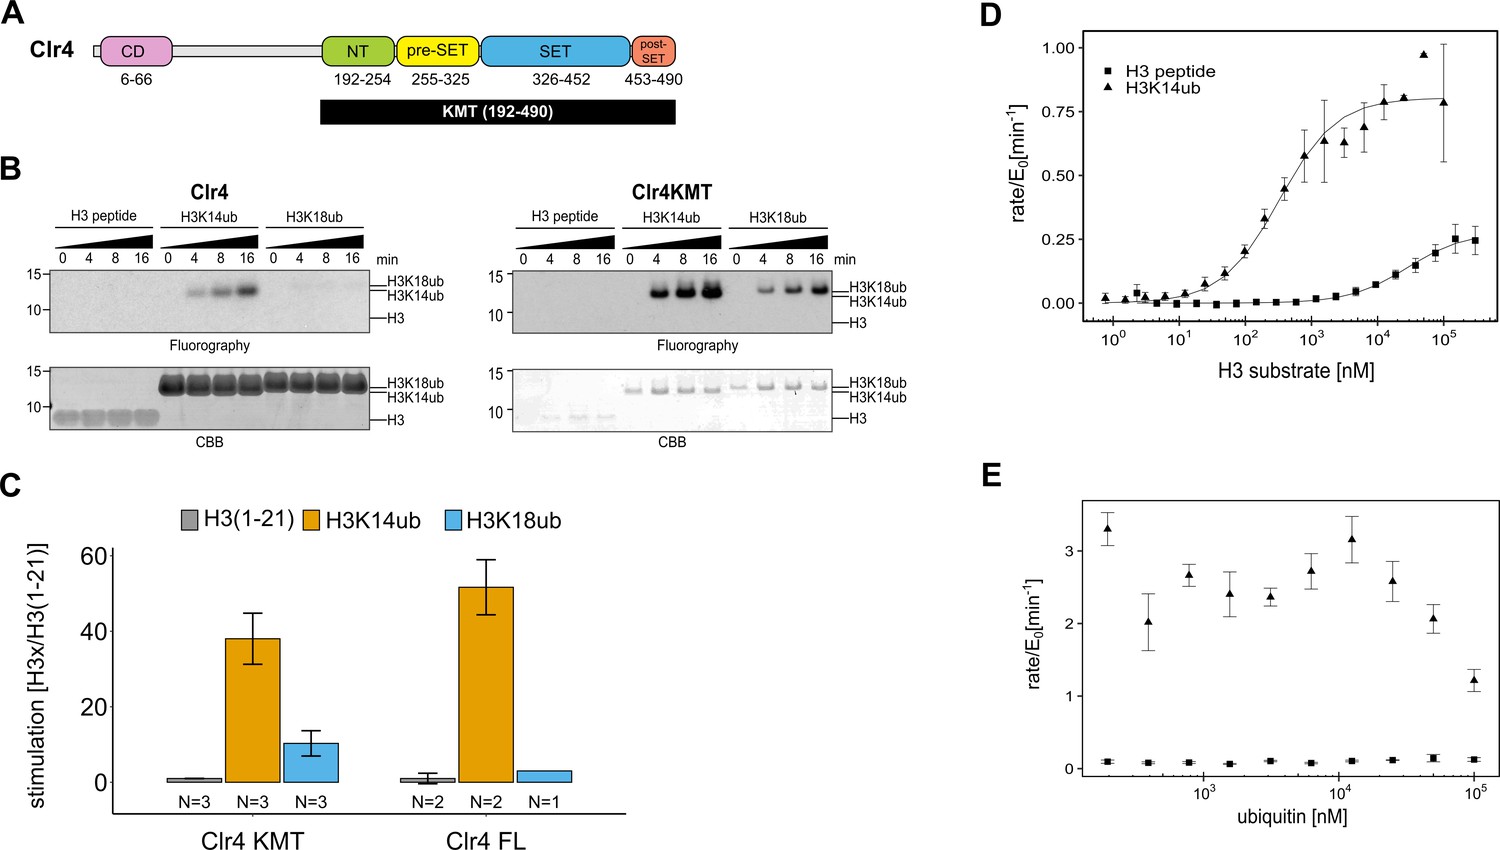
The catalytic domain of Clr4 senses the H3K14ub mark.
(A) Domain organization of the Clr4 protein. CD: chromodomain; NT: N-terminal domain; SET: Su-var39/enhancer of zeste/trithorax domain; KMT: lysine methyltransferase domain. (B) Methyltransferase time course on H3K14ub versus unmodified H3 peptides shows strong stimulation of full-length Clr4 and the isolated KMT domain by H3K14ub. Peptide concentration was held constant at 20 μM, 3H-SAM was used as methyl donor with 20 nM enzyme. CBB: Coomassie Brilliant Blue. (C) Stimulation of methyltransferase activity of Clr4 (20 nM) comparing indicated substrates with unmodified H3 peptide by radiometric filter binding assay with 3H-SAM as methyl donor. (D) Michaelis–Menten kinetics of SAH production of the Clr4 KMT domain on unmodified versus H3K14ub peptides. Measured using TR-FRET competition assay (Cisbio EPIgeneous Methyltransferase Assay kit). (E) Ubiquitin competition assay demonstrates the specificity of Clr4 for ubiquitin and shows that covalent linkage in cis is required for activation. (C–E) Error bars indicate standard error of the mean, N = 3 unless indicated.
Figure 1—figure supplement 1
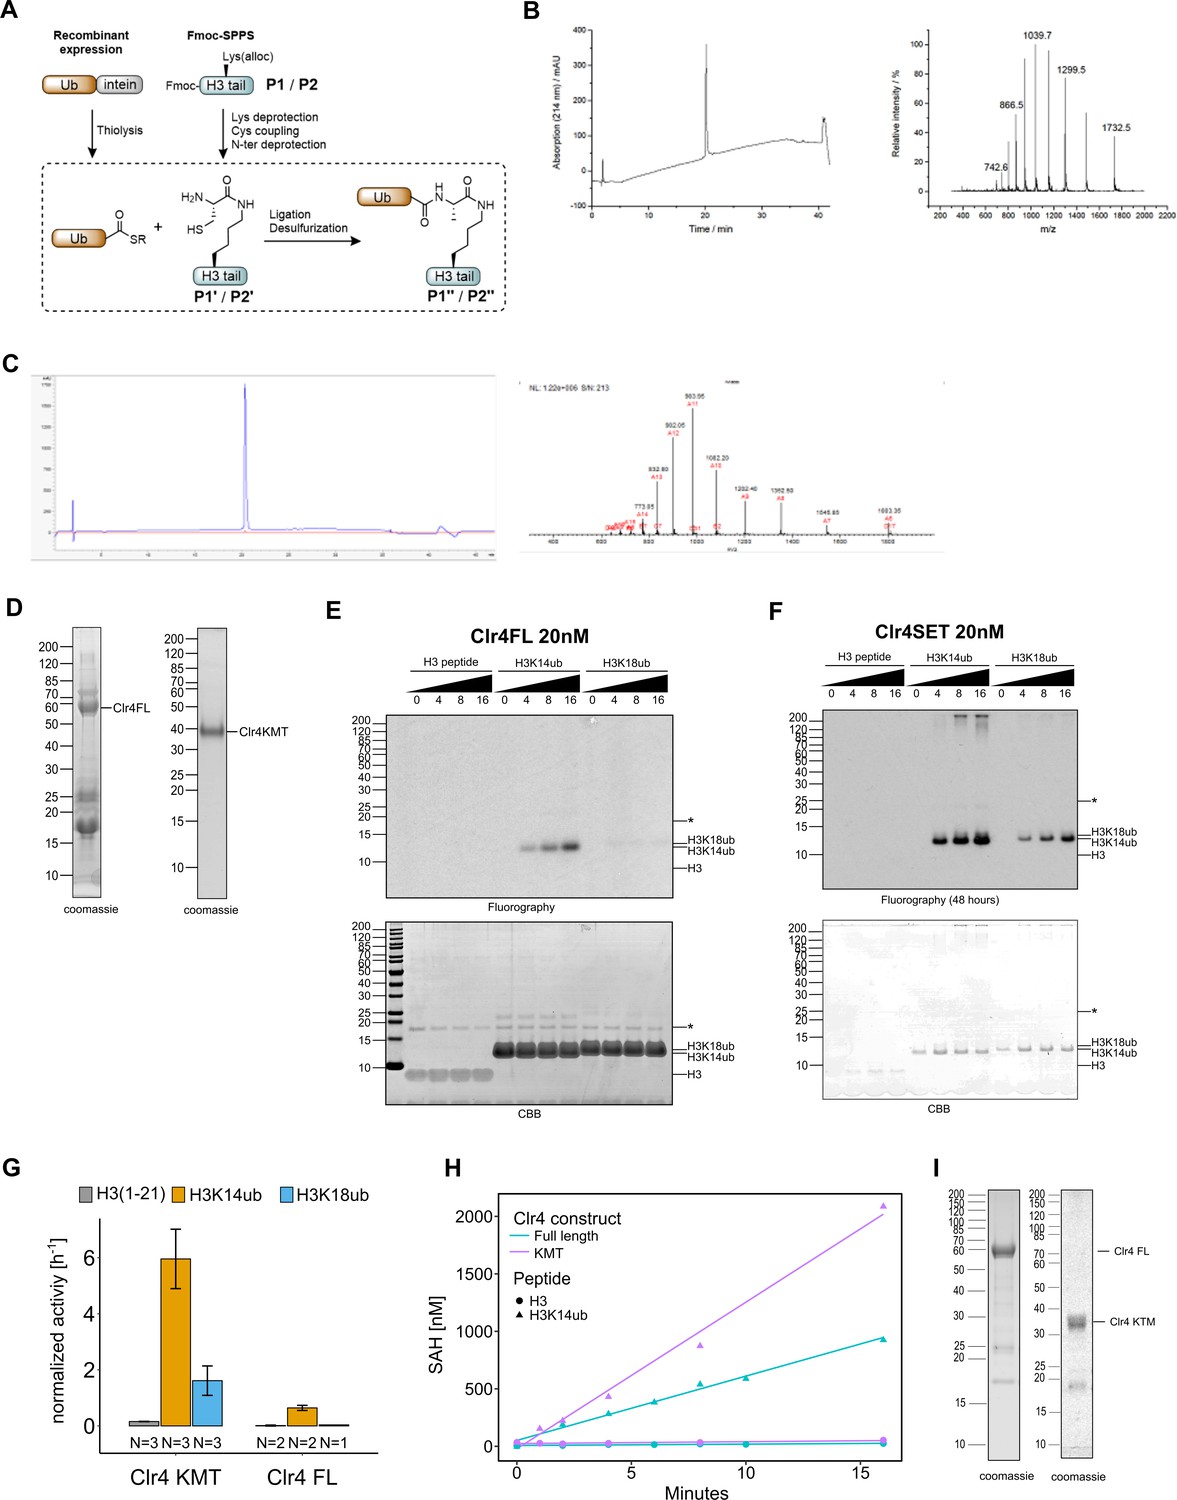
H3K14ub activates Clr4 enzymatic activity.
(A) Scheme for synthesis of ubiquitinated peptides. (B, C) Reverse-phase HPLC chromatography and electrospray ionization mass spectrometric (ESI-MS) analysis of ubiquitinated, purified peptides P1″ (B) and P2″ (C). (D) Protein preparations analyzed by SDS-PAGE that were used for activity assays in Figure 1B and C. (E, F) Full-size images for data shown in Figure 1B. (G) Representation of data in Figure 1C as rates derived from 3H incorporation by filter binding and scintillation counting. (H) Methyltransferase assays with indicated Clr4 truncation constructs on ubiquitinated versus unmodified H3 peptides. Measured using a TR-FRET competition assay (Cisbio EPIgeneous Methyltransferase Assay kit). (I) Protein preparations analyzed by SDS-PAGE that were used for activity assays in Figure 1D and E and Figure 1—figure supplement 1H. Asterisk indicates a contaminating band.
Figure 2 with 1 supplement
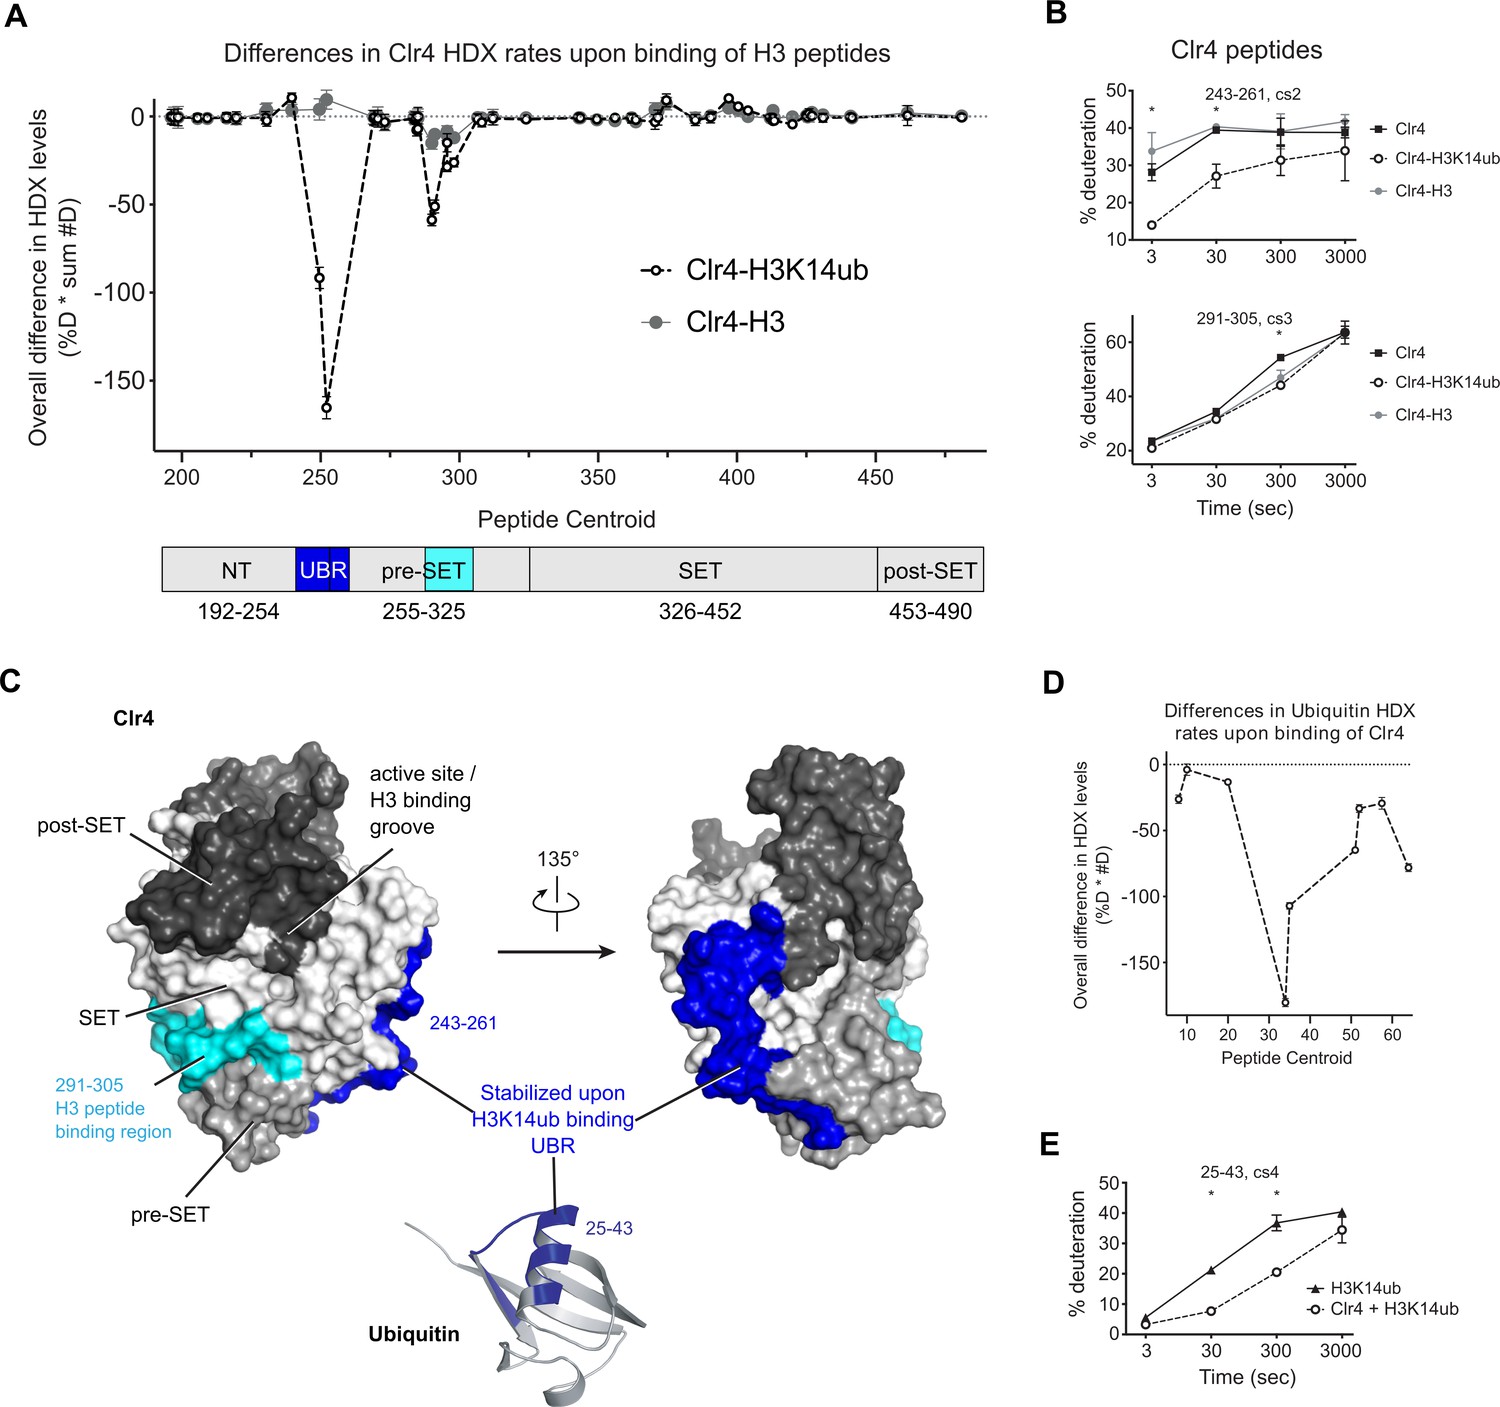
H3K14ub binding stabilizes residues 243–262 on Clr4.
(A) Differences in Clr4 hydrogen/deuterium exchange (HDX) rates upon binding of H3 and H3K14ub peptides are shown for each analyzed peptide. Values are plotted as the product of [deuteration percentage] * [number of deuterons] to minimize the influence of peptide length on the results. Domain diagram indicates the regions showing stabilization upon interaction with H3 peptides in general (cyan) and more specifically with H3K14ub (blue). (B) Uptake plot for two peptides representative of regions showing differences in HDX rate of Clr4 upon peptide binding. (C) Surface representation of Clr4 structure (PDBID:6BOX) and cartoon representation of ubiquitin (PDBID:1UBQ). UBR: ubiquitin binding region. (D) Differences in ubiquitin HDX rates for the H3-K14ub peptide in the absence and presence of Clr4. Results are shown as in (A). (E) Uptake plot for peptide 25–43 of ubiquitin linked to H3K14 showing a marked reduction in HDX rate at 30 s and 300 s incubation time in deuterated buffer.
Figure 2—figure supplement 1
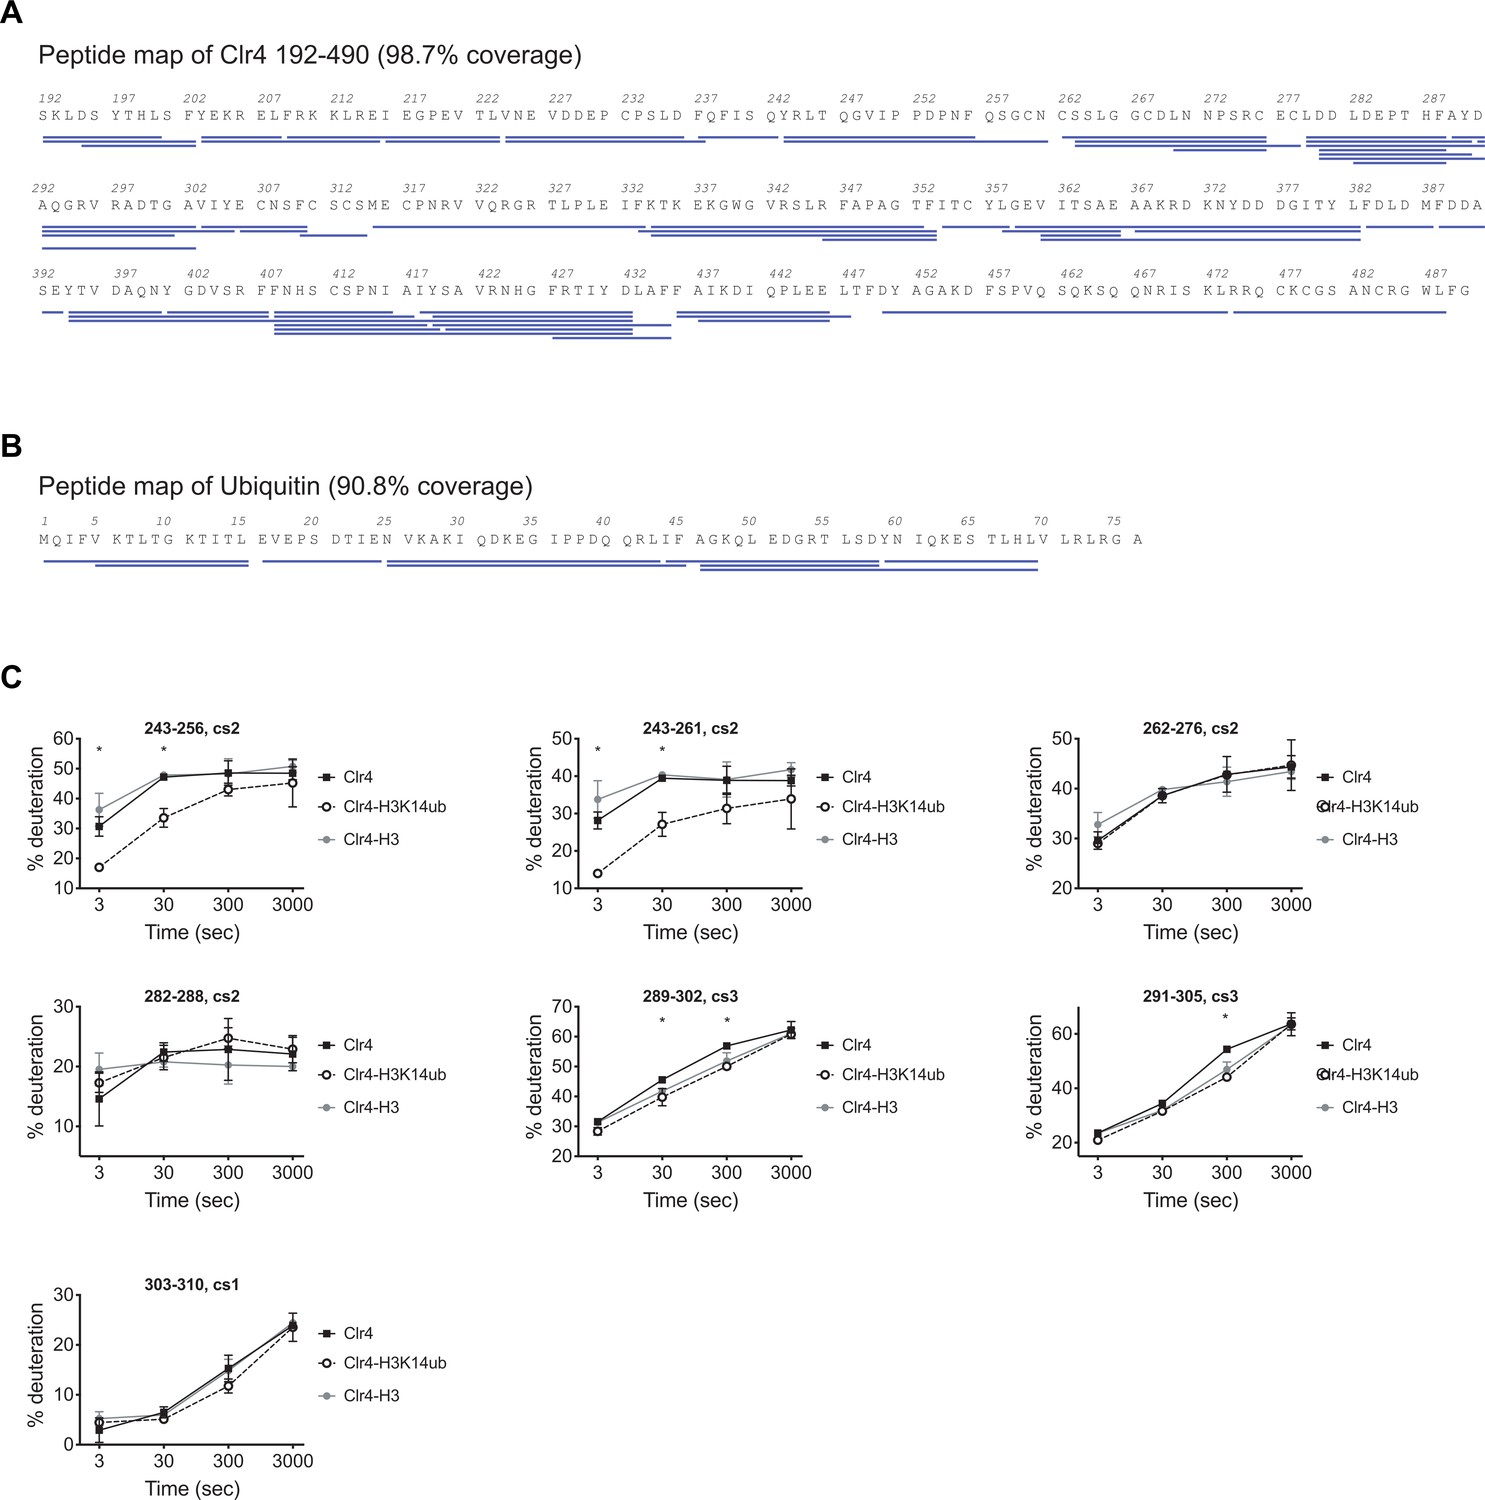
H3K14ub binding stabilizes residues 243–262 on Clr4.
(A) Peptide map of Clr4 peptides used for hydrogen deuterium exchange mass spectrometry (HDX-MS) analysis of Clr4. (B) Peptide map showing peptides used for the HDX-MS analysis of H3K14ub dynamics. (C) Selection of Clr4 peptides comparing the deuteration levels for Clr4 alone (Clr4) or when in complex with H3K14ub peptide (Clr4-H3K14ub) or with H3 unmodified peptide (Clr4-H3). Values shown as percentage deuteration compared to a theoretical maximal level.
Figure 3 with 1 supplement
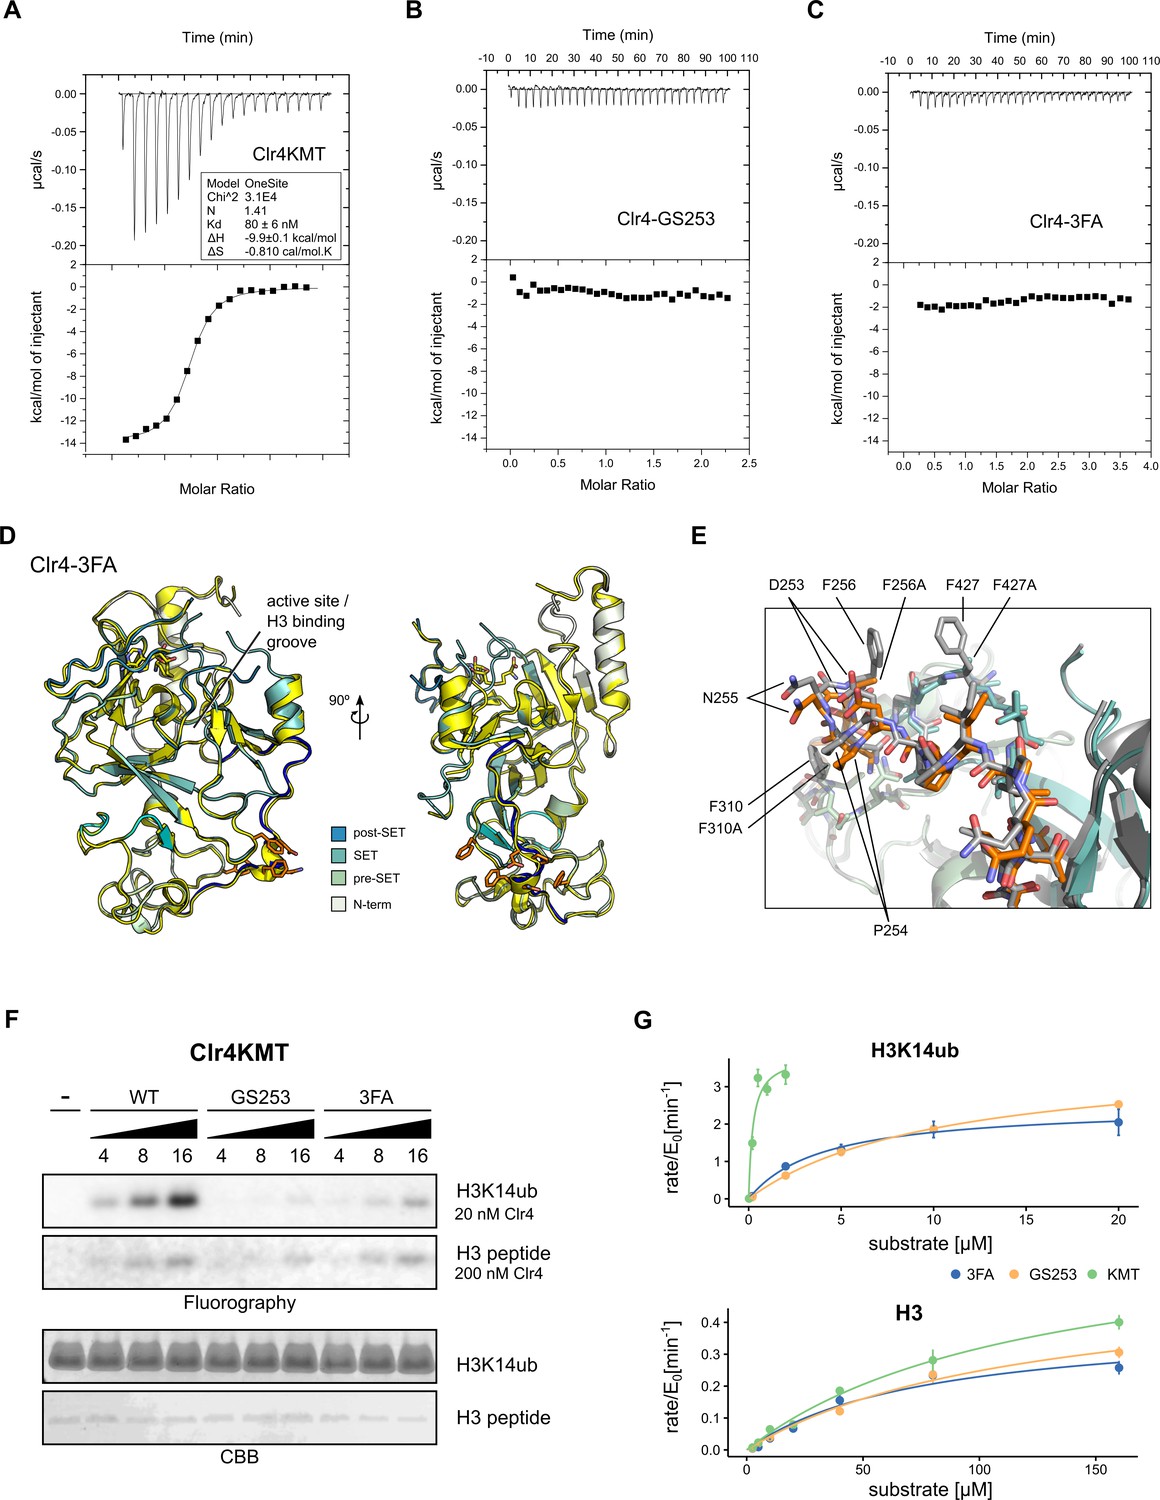
Mutants in the Clr4-H3K14ub interface are defective for substrate binding.
(A–C) Thermodynamic parameters of H3K14ub substrate binding to wild-type and mutant Clr4KMT proteins were measured using isothermal titration calorimetry (ITC). Heat rates (top panel) were integrated and plotted as a binding isotherm (bottom panel). Fit to a one-site model is shown as a solid line where fitting was possible. (D) Overview and detail view of superimposition of Clr4-3FA crystal structure (shades of teal) to wild-type Clr4 (yellow) (PDBID:6BOX) indicate absence of major differences in global folding. Residues 243–262 are colored in blue. Mutated residues (orange) and SAH co-factor are shown in stick representation. (E) Superposition of mutated region in stick representation for Clr4-3FA (orange) and Clr4 (gray) (PDBID:6BOX). (F) Methyltransferase kinetics of wild-type and Clr4KMT mutants measured by detection of 3H incorporation on SDS-PAGE gels shows loss of stimulation by H3K14ub for GS253 and 3FA mutants. To observe sufficient signal, differing enzyme concentrations of 20 and 200 nM were used for H3K14ub and H3 peptides, respectively. (G) Michaelis–Menten kinetics for Clr4 wild-type, 3FA, and GS253 mutants measured using the Promega MTase-Glo methyltransferase assay. Error bars correspond to standard error of mean based on three or four measurements.
Figure 3—figure supplement 1
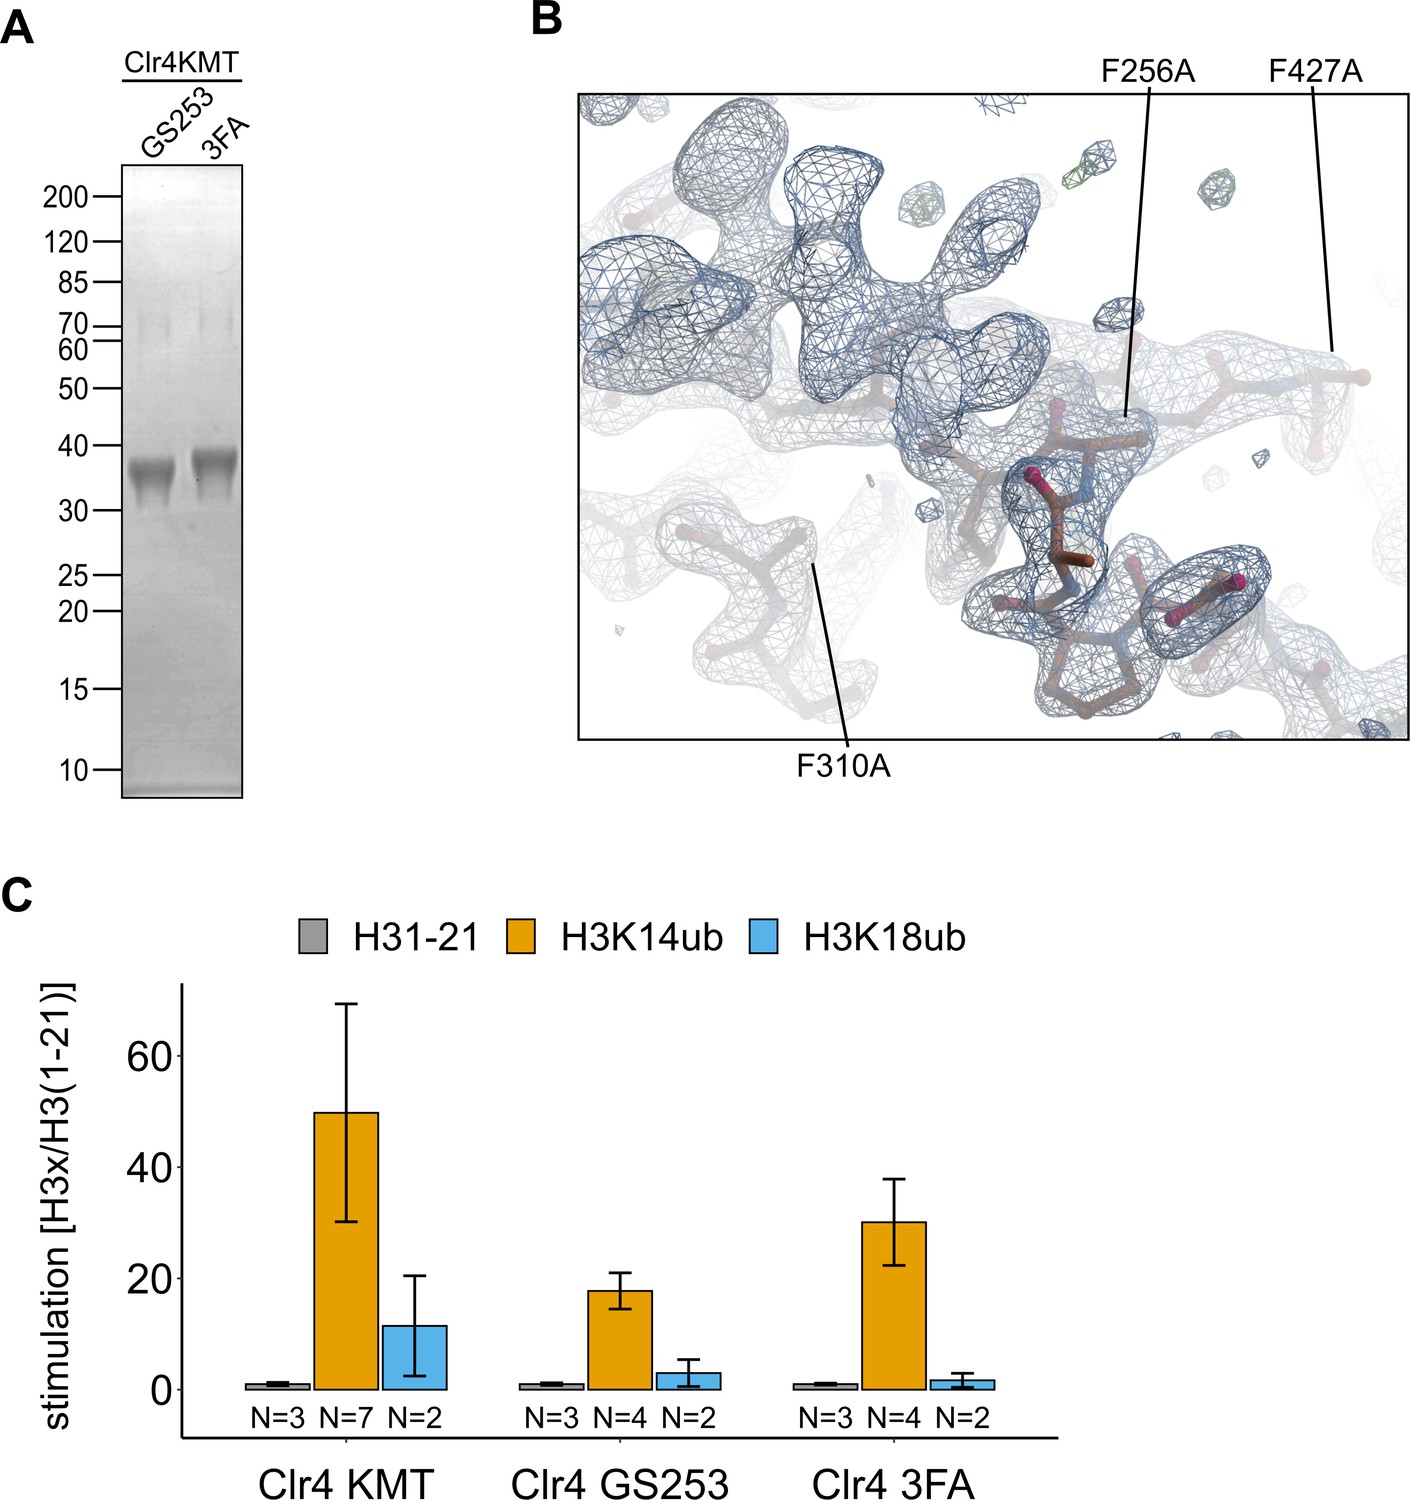
Clr4F3A folds similarly to Clr4.
(A) Representative protein preparations of Clr4 mutants analyzed by SDS-PAGE and Coomassie Brilliant Blue staining that were used for isothermal titration calorimetry (ITC) and activity assays in Figure 3. (B) Detail of Clr4-3FA electron density map in the region containing the mutations F256A/F310A/F427A. (C) Stimulation by H3K14ub and H3K18ub is shown as relative rates of 3H incorporation quantified by filter binding and scintillation counting using the same experimental setup as in Figure 1C. Error bars indicate standard error of mean.
Figure 4
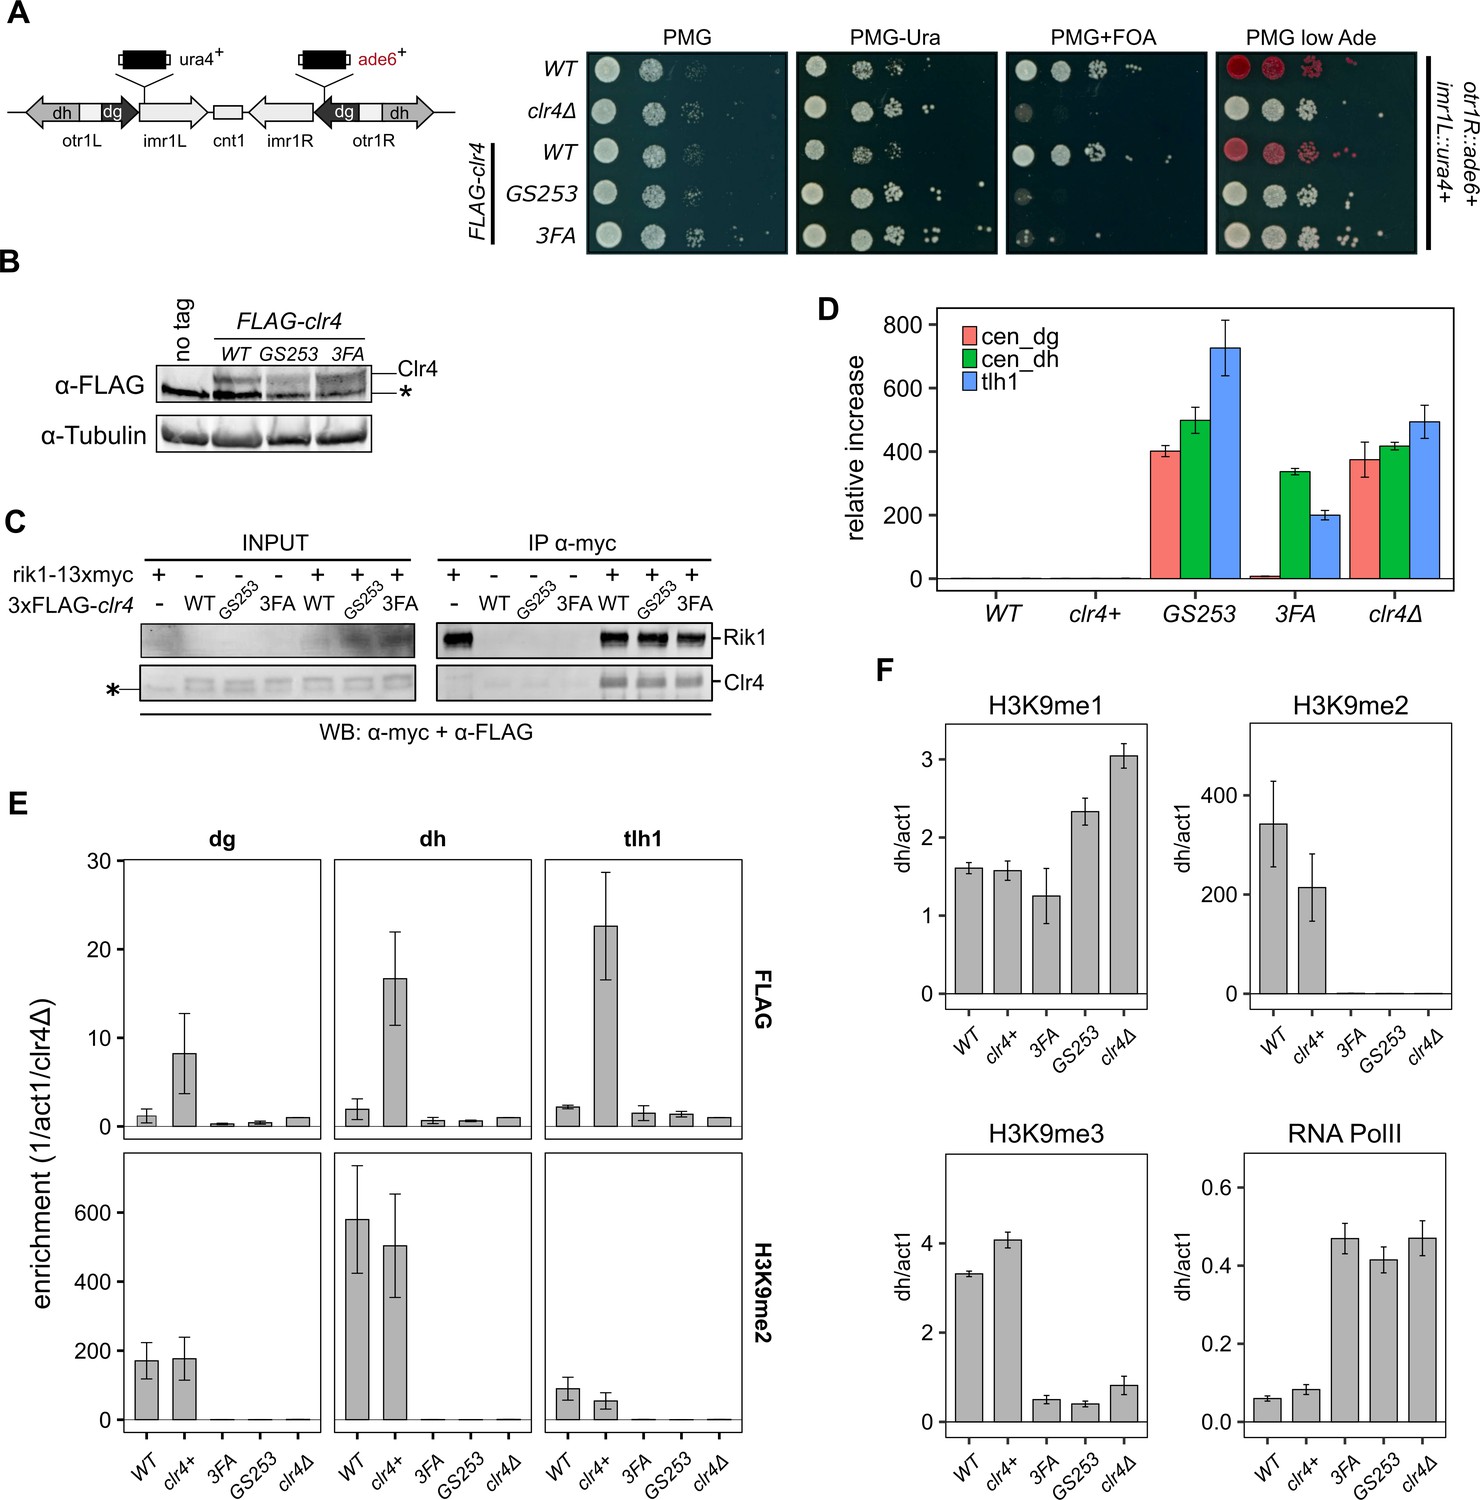
Clr4 mutants lose heterochromatin.
(A) Serial dilution growth assays of wild-type and the Clr4 mutants. Strains were assessed for growth on PMG media, PMG-ura to monitor imr1L::ura4+ expression, and PMG+FOA to monitor silencing of imr1L::ura4+. Expression of otr1R::ade6+ was tested on PMG containing low adenine. (B) Immunoblot for FLAG-Clr4 on cell lysates from clr4 mutant strains. Asterisk indicates a non-specific band. (C) Co-IP experiment to assess the stability of the CLRC complex in clr4-GS253 and clr4-3FA mutants. (D) Changes in steady-state transcript levels in clr4 mutant strains relative to wild-type cells were measured by RT-qPCR for centromeric dg, dh repeats, and tlh1 transcripts at telomeres. act1 was used as an internal standard for all measurements. (E) ChIP for wild-type and indicated mutant strains against FLAG-Clr4 and H3K9me2 at centromeric dg, dh repeats, and telomeric tlh1. Enrichment was normalized to clr4Δ. (F) ChIP for H3K9me1, H3K9me2 and H3K9me3, and RNA polymerase II at centromeric dh repeats. act1 was used as an internal standard for all measurements. Mean and standard errors in (D–F) were calculated from a minimum of three independent biological replicates.
Figure 5 with 1 supplement
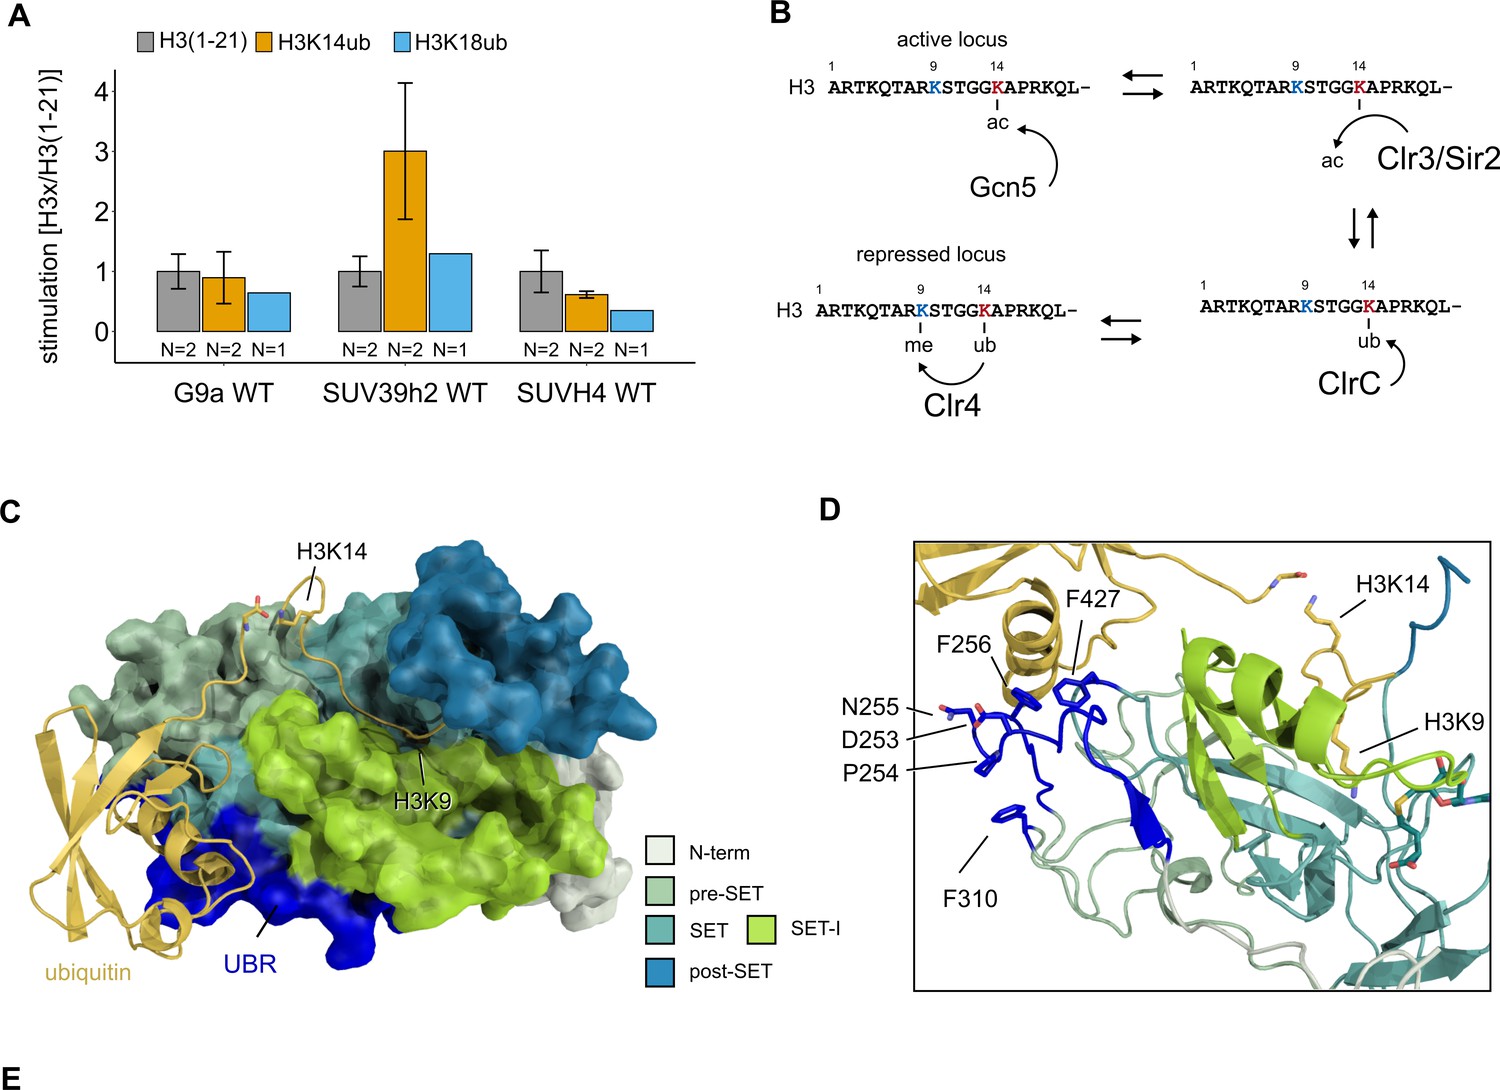
Conservation and mechanistic model of H3K14ub stimulation in the SUV39 methyltransferase family.
(A) Methyltransferase rates of human G9a and human SUV39H2 and Arabidopsis SUVH4 on indicated substrates were determined by quantifying 3H-methyl incorporation using filter binding assays. Error bars correspond to standard error of mean. (B) Schematic of how H3K14 ubiquitylation licenses H3K9me2/3 deposition and how H3K14ac specifically prevents this. (C, D) Overview and detail view of the Clr4-H3K14ub model calculated with HADDOCK using restraints obtained by HDX-MS and mutagenesis.
Figure 5—figure supplement 1
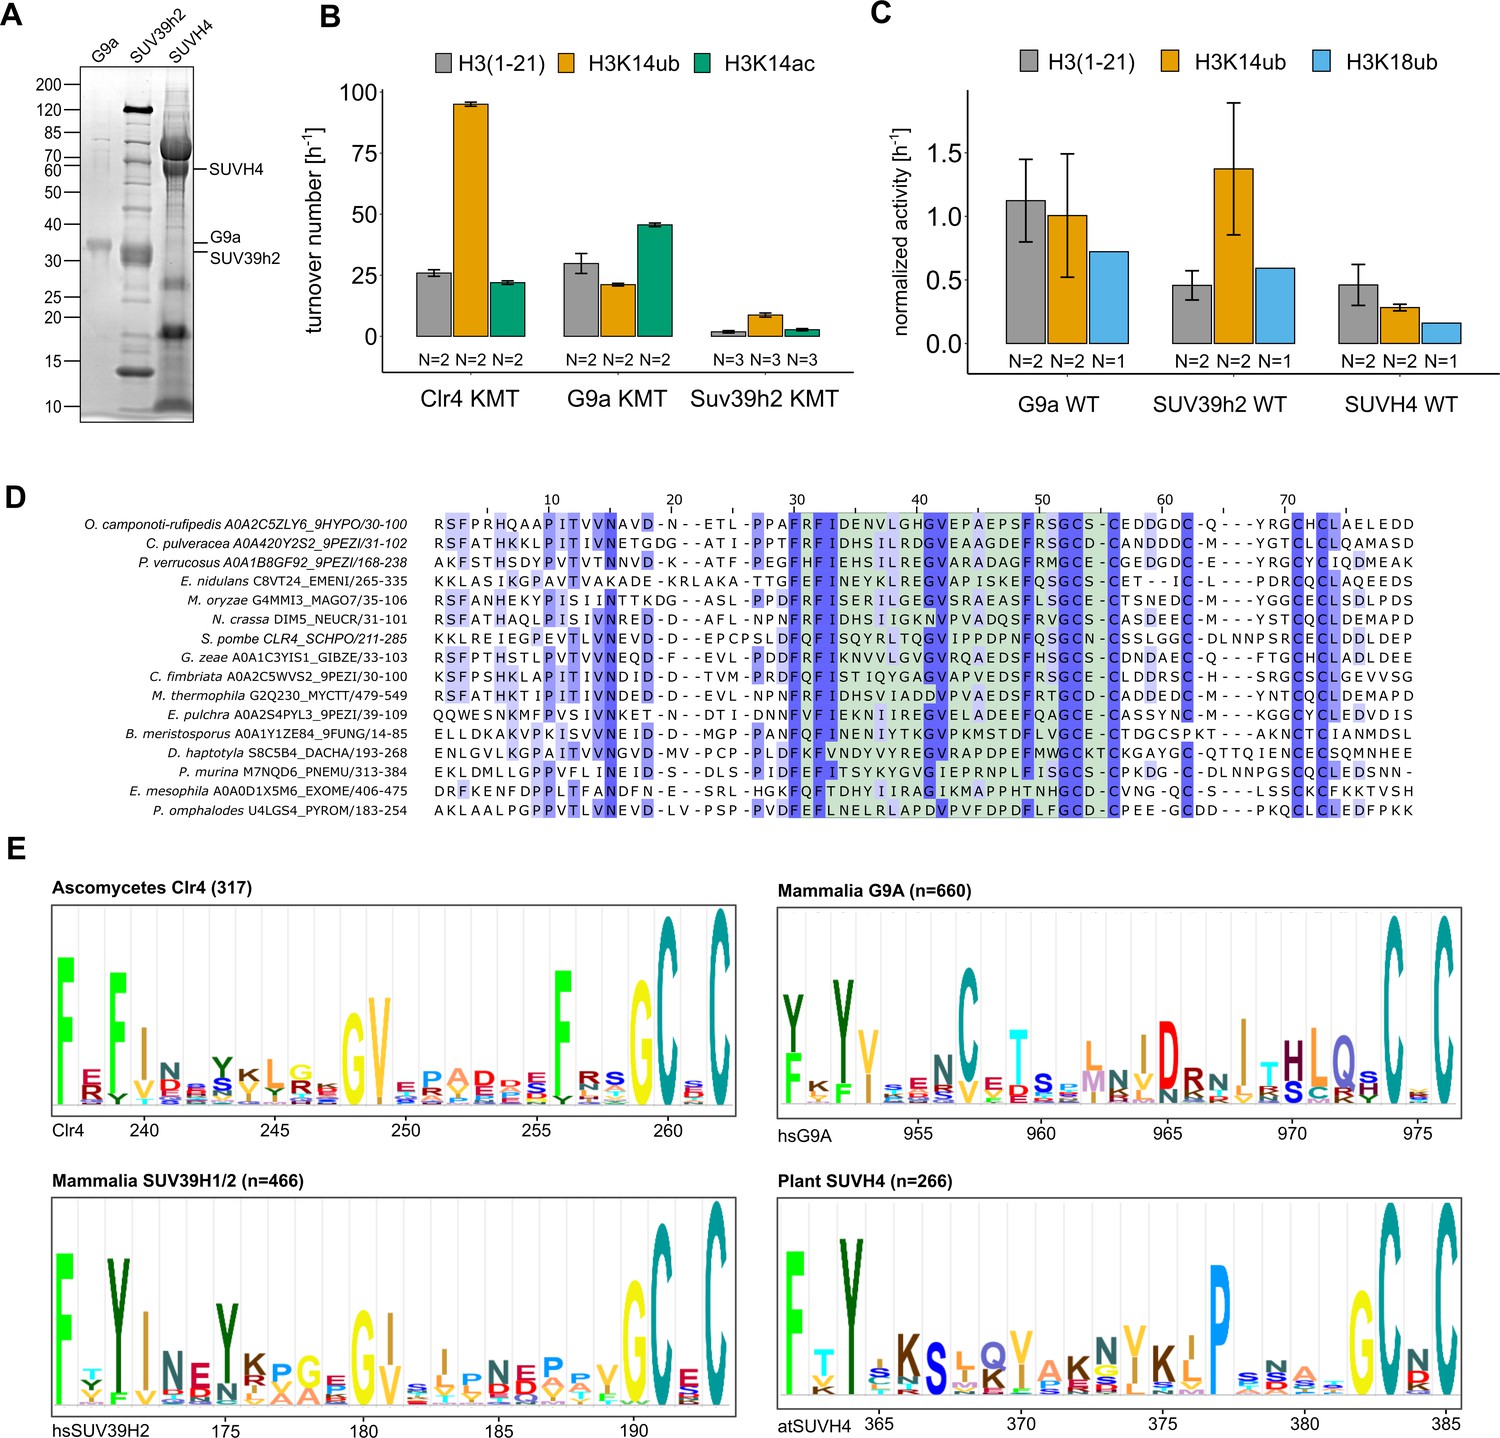
Conservation and mechanistic model of H3K14ub stimulation in the SUV39 methyltransferase family.
(A) SDS-PAGE of protein preparations used for methyltransferase assays in Figure 5A. (B) Methyltransferase activity of human G9a and SUV39H2 versus indicated H3 peptides. Measured using the TR-FRET competition assay (Cisbio EPIgeneous Methyltransferase Assay kit). (C) Representation of data in Figure 5A as rates for SUV39 proteins derived from 3H incorporation by filter binding and scintillation counting. Standard errors of the mean were calculated from the indicated number of replicates. (D) Multiple sequence alignment of representative fungal species that show conservation in the UBR (green shaded region). (E) Motifs identified by Hidden Markov Model search (JACKHMMER [Potter et al., 2018]) with S. pombe Clr4, human SUV39H2, human G9A, and Arabidopsis SUVH4 sequence covering the regions corresponding to the Clr4 UBR.
Tables
Table 1
Enzyme kinetics.
| Clr4KMT | Substrate | KM(µM) | kcat(min–1) | kcat/KM(mM–1 min–1) | Figure |
|---|---|---|---|---|---|
| WT | H3(1–21) | 28.1 ± 8.0 | 0.277 ± 0.024 | 9.86 ± 2.18 | Figure 1D |
| WT | H3K14ub | 0.329 ± 0.060 | 0.809 ± 0.029 | 2456 ± 405 | Figure 1D |
| WT | H3(1–19) | 124 ± 26 | 0.713 ± 0.085 | 5.75 ± 0.59 | Figure 3G |
| WT | H3K14ub | 0.234 ± .0.068 | 3.85 ± 0.29 | 16459 ± 3,796 | Figure 3G |
| 3FA | H3(1–19) | 76.8 ± 17.5 | 0.406 ± 0.045 | 5.29 ± 0.68 | Figure 3G |
| 3FA | H3K14ub | 4.00 ± 1.60 | 2.49 ± 0.32 | 623 ± 180 | Figure 3G |
| GS253 | H3(1–19) | 121 ± 29 | 0.548 ± 0.071 | 4.53 ± 0.52 | Figure 3G |
| GS253 | H3K14ub | 10.4 ± 1.2 | 3.83 ± 0.21 | 370 ± 25 | Figure 3G |
-
Values represent fitting estimates and corresponding standard error.
Table 2
Crystallographic table.
| Native | ||
|---|---|---|
| Data | ||
| Wavelength (Å) | 0.97950 | |
| Resolution range (Å) | 70.68–2.46 (2.68–2.46) | |
| Space group | P 21 21 2 | |
| Unit-cell parameters (Å, °) | 92.44, 110.29, 70.68, 90.00, 90.00, 90.00 | |
| Total reflections | 120,264 (3409) | |
| Unique reflections | 19,571 (979) | |
| Multiplicity | 6.1 (3.5) | |
| Completeness (%) spherical | 72.2 (16.2) | |
| Completeness (%) ellipsoidal | 93.1 (56.9) | |
| Mean I/σ(I) | 6.6 (1.4) | |
| Wilson B factor (Å2) | ||
| Rmerge | 0.214 (0.898) | |
| Rmeas | 0.233 (1.046) | |
| Rpim | 0.093 (0.525) | |
| CC1/2 | 0.993 (0.627) | |
| CC | 0.998 (0.878) | |
| Refinement | ||
| Resolution range | 2.46 | |
| Total number of reflections | 18,561 | |
| Number of reflections in test set | 973 | |
| Rwork (%) | 23.8 | |
| Rfree (%) | 24.9 | |
| CC (work) | 0.923 | |
| CC (free) | 0.910 | |
| No. of non-hydrogen atoms | 4495 | |
| Macromolecule | 4411 | |
| Ligands | 62 | |
| Solvent | 22 | |
| No. of protein residues | 549 | |
| R.m.s.d., bonds (Å) | 0.014 | |
| R.m.s.d., angles (°) | 1.73 | |
| Ramachandran favored (%) | 96.54 | |
| Ramachandran outliers (%) | 0 | |
| Ramachandran allowed (%) | 3.46 | |
| Clash score | 2.42 | |
| Average B factor (Å2) | ||
| Macromolecule | 31.85 | |
| Ligands | 24.61 | |
| Solvent | 21.63 |
-
Statistics for the highest resolution shell are shown in parentheses.
Key resources table
| Reagent type (species) or resource | Designation | Source or reference | Identifiers | Additional information |
|---|---|---|---|---|
| Gene (S. pombe) | clr4 | PomBase | SPBC428.08c | |
| Gene (S. pombe) | rik1 | PomBase | SPCC11E10.08 | |
| Strain, strain background (S. pombe) | h + leu1-32 ura4DS/E ade6-M210 imr1R(NcoI)::ura4 ori1 | Allshire et al., 1995 | FY498 | |
| Strain, strain background (S. pombe) | h- mat1m::cyhS smtO rpl42- P56Q (cyhR) ade6M210 leu1-32 ura4-D18 | Roguev et al., 2007 | P392 | |
| Strain, strain background (S. pombe) | h− ade6-M210 his1-102 leu1-32 ura4-D18 otr1 R(dg-glu)Sph1::ade6 imr1L(Nco1)::ura4 | Ekwall et al., 1997 | FY1191 | |
| Strain, strain background (S. pombe) | h + ade6 DN/N leu1-32 ura4-DS/E imr1L(Nco1)::ura4 otr1R(Sph1)::ade6 | Ekwall et al., 1997 | FY2002 | |
| Strain, strain background (S. pombe) | h- ura4-D18 | Simanis Lab | S.057 | Figure 4D and E |
| Strain, strain background (S. pombe) | h- 3xFLAG-Clr4 imrlR(NcoI)::ura4 ade6-M210 leu1-32 ura4DS/E oriI | This study* | S.0AT | |
| Strain, strain background (S. pombe) | h + rpl42-P56Q (cyhR) ade6M210 ura4-D18 clr4Δ::rpl42-natMX | This study* | S.0CT | - |
| Strain, strain background (S. pombe) | h + rpl42-P56Q (cyhR) ade6M210 ura4-D18 clr4Δ::KanMX | This study* | S.0D7 | - |
| Strain, strain background (S. pombe) | h- clr4Δ::KanMX ura4-D18 | This study* | S.0H1 | Figure 4D andE |
| Strain, strain background (S. pombe) | h- rik1::rik1-13myc-KanR | This study* | S.0JE | Figure 4C |
| Strain, strain background (S. pombe) | h + rik1::rik1-13myc-KanR ura4-D18 his2-? leu1-32 | This study* | S.0JL | - |
| Strain, strain background (S. pombe) | h- 3xFLAG-clr4-D253G/P254G/N255S/F256G imr1R(NcoI)::ura4 oriI ade6-M210 leu1-32 ura4DS/E | This study* | S.0KK | - |
| Strain, strain background (S. pombe) | h- 3xFLAG-Clr4 ade6-M210 leu1-32 ura4-D18 | This study* | S.0LL | Figure 4C, D and E |
| Strain, strain background (S. pombe) | h- 3xFLAG-clr4-D253G/P254G/N255S/F256G ade6-M210 ura4-D18 | This study* | S.0LN | Figure 4C, D and E |
| Strain, strain background (S. pombe) | h- 3xFLAG-Clr4 imr1L(Nco1)::ura4 otr1R(Sph1)::ade6 ade6-? leu1-32 ura4-DS/E | This study* | S.0LP | Figure 4A and B |
| Strain, strain background (S. pombe) | h- 3xFLAG-clr4-D253G/P254G/N255S/F256G imr1L(Nco1)::ura4 otr1R(Sph1)::ade6 ade6-? leu1-32 ura4-DS/E | This study* | S.0LS | Figure 4A and B |
| Strain, strain background (S. pombe) | h + clr4Δ::KanMX ade6-DN/N ura4-? | This study * | S.0MS | - |
| Strain, strain background (S. pombe) | h + rik1::rik1-13myc-KanR 3xFLAG-Clr4 his2-? leu1-32 ura4-D18 | This study* | S.0MT | Figure 4C |
| Strain, strain background (S. pombe) | h- rik1-13myc 3xFLAG-clr4-D253G/P254G/N255S/F256G his2-? leu1-32 ura4-D18 | This study* | S.0MU | Figure 4C |
| Strain, strain background (S. pombe) | h- 3xFLAG-clr4-F256A/F310A/F427A rpl42-P56Q (cyhR) ade6M210 ura4-D18 | This study* | S.0MX | Figure 4C |
| Strain, strain background (S. pombe) | h- clr4Δ::KanMX otr1R(dg-glu)Sph1::ade6 imr1L(Nco1)::ura4 ade6-? leu1-32 ura4-? | This study* | S.0NC | Figure 4A |
| Strain, strain background (S. pombe) | h- 3xFLAG-clr4-F256A/F310A/F427A otr1R(dg-glu)Sph1::ade6 imr1L(Nco1)::ura4 ade6-M210 ura4-D18 | This study* | S.0ND | Figure 4A and B |
| Strain, strain background (S. pombe) | h- 3xFLAG-clr4-F256A/F310A/F427A rik1::rik1-13myc-KanR ade6-M210 ura4-D18 | This study* | S.0NF | Figure 4C, D and E |
| Sequence-based reagent | Oligonucleotides | Supplementary file 1A | ||
| Sequence-based reagent | Peptides | Supplementary file 1B | ||
| Sequence-based reagent | sgRNAs | Supplementary file 1C | ||
| Recombinant DNA reagent | pSMT3 (6xHIS tag) | Chris Lima – Cornell University Mossessova and Lima, 2000 | 6xHIS-Sumo tagging plasmid | |
| Recombinant DNA reagent | pSMT3_Clr4(1-490) | This study* | P.0PI | Figure 1 |
| Recombinant DNA reagent | pSMT3_Clr4KMT (192-490) | This study* | P.0QW | Figures 1 and 2, and 3 |
| Recombinant DNA reagent | pSMT3_Clr4KMT (192-490)-GS253 | This study* | P.18B | Figure 3 |
| Recombinant DNA reagent | pSMT3_Clr4KMT (192-490)–3FA | This study* | P.18C | Figure 3 |
| Recombinant DNA reagent | pSumo-RSFDuet SUVH4 (93–624) | Steven Jacobsen – University of California Los Angeles Du et al., 2014 | Figure 5 | |
| Recombinant DNA reagent | pet28a_SUV39H2 | Addgene, Cheryl Arrowsmith | RRID:Addgene_25115 | Figure 5 |
| Recombinant DNA reagent | pET38a_G9a | Addgene, Cheryl Arrowsmith | RRID:Addgene_25503 | Figure 5 |
| Antibody | Rabbit polyclonal anti-H3K9me1 | Abcam | ab8896 | (ChIP: 1 µg) |
| Antibody | Mouse monoclonal anti-H3K9me2 | Abcam | ab1220 | (ChIP: 1 µg) |
| Antibody | Recombinant mono clonal anti-H3K9me3 | Diagenode | C15500003 | (ChIP: 1 µg) |
| Antibody | Mouse monoclonal anti-RNA PolII | Abcam | ab817 | (ChIP: 1 µg) |
| Antibody | Mouse monoclonal anti-FLAG-M2 | Sigma | F1804 | (ChIP: 1 µg, WB: 1:5000) |
| Antibody | Rabbit recombinant monoclonal anti-H3K14ac | Abcam | ab52946 | (ChIP: 1 µg) |
| Antibody | Mouse monoclonal anti-Myc-Tag | Cell Signaling Technology | 9B11 | (WB: 1:3000) |
| Antibody | Mouse monoclonal anti-γ-Tubulin | Sigma-Aldrich | T6557 | (WB: 1:5000) |
| Chemical compound, drug | 5-Fluoroorotic acid (FOA) | US Biological | F5050 | |
| Chemical compound, drug | Geneticin (G418 sulfate) | Invitrogen | 10131019 | |
| Chemical compound, drug | Cycloheximide | Alfa Aesar | J66901.03 | |
| Chemical compound, drug | Nourseothricin | Werner Bioagents | 5.001.000 | |
| Chemical compound, drug | Formaldehyde | Sigma-Aldrich | F8775 | |
| Chemical compound, drug | Ethylene glycol bis-succinimidyl succinate (EGS) | Thermo Fisher Scientific | 21565 | |
| Chemical compound, drug | Dynabeads Protein A | Thermo Fisher Scientific | 10001D | |
| Chemical compound, drug | Dynabeads MyOne Streptavidin C1 | Thermo Fisher Scientific | 65001 | |
| Chemical compound, drug | Trizol | Thermo Fisher Scientific | 15596026 | |
| Chemical compound, drug | cOmplete EDTA free | Roche | 11873580001 | |
| Chemical compound, drug | Myc-Trap | Chromotek | ytma-20 | |
| Chemical compound, drug | Adenosyl-L-methionine, S-[methyl-3H]/SAM | Perkin Elmer | NET155V250UC | |
| Chemical compound, drug | Phosphocellulose paper 541 | Jon Oakhill, St Vincent’s Institute of Medical Research, Melbourne, Australia | ||
| Commercial assay or kit | EvoScript Universal cDNA Master | Roche | 07912439001 | |
| Commercial assay or kit | LightCycler 480 SYBR Green I Master | Roche | 04707516001 | |
| Commercial assay or kit | EPIgeneous Methy ltransferase Assay kit | Cisbio | 62SAHPEB | |
| Commercial assay or kit | MTase-Glo Methyl transferase Assay | Promega | V7601 | |
| Software, algorithm | RStudio | RStudio, Inc | Version 1.2.5042 | Fitting enzyme kinetics and plotting graphs |
| Software, algorithm | R | R Foundation | Version 3.6.3 | Fitting enzyme kinetics and plotting graphs |
-
*Reagent is available upon request from the authors.
Additional files
-
Supplementary file 1
Oligonucleotide and peptide sequences.
(A) Oligonucleotides used in qPCR experiments in Figure 4. (B) Peptide sequences used for synthesis of ubiquitinated H3 substrates. (C) sgRNA sequences used for CRISPR mutagenesis.
- https://cdn.elifesciences.org/articles/62682/elife-62682-supp1-v1.docx
-
Supplementary file 2
Hydrogen deuterium exchange mass spectrometry (HDX-MS) data for Clr4 alone and in complex with H3 or H3K14ub peptides.
- https://cdn.elifesciences.org/articles/62682/elife-62682-supp2-v1.xlsx
-
Supplementary file 3
Hydrogen deuterium exchange mass spectrometry (HDX-MS) data for H3K14ub alone and in complex with Clr4.
- https://cdn.elifesciences.org/articles/62682/elife-62682-supp3-v1.xlsx
-
Supplementary file 4
Hydrogen deuterium exchange mass spectrometry (HDX-MS) data collection statistics.
- https://cdn.elifesciences.org/articles/62682/elife-62682-supp4-v1.xlsx
-
Transparent reporting form
- https://cdn.elifesciences.org/articles/62682/elife-62682-transrepform1-v1.docx
Download links
A two-part list of links to download the article, or parts of the article, in various formats.
Downloads (link to download the article as PDF)
Open citations (links to open the citations from this article in various online reference manager services)
Cite this article (links to download the citations from this article in formats compatible with various reference manager tools)
SUV39 SET domains mediate crosstalk of heterochromatic histone marks
eLife 10:e62682.
https://doi.org/10.7554/eLife.62682


