Ongoing repair of migration-coupled DNA damage allows planarian adult stem cells to reach wound sites
- Department of Zoology, University of Oxford, United Kingdom
- CRUK/MRC Oxford Institute for Radiation Oncology, ORCRB Roosevelt Drive, University of Oxford, United Kingdom
Figures
Figure 1 with 3 supplements

Planarian stem cell resistance to doses up to 15 Gy of gamma IR requires conserved DDR pathways.
(A) smedwi-1 FISH of planarians exposed to different doses of gamma IR (5, 10, 15, 20, and 30 Gy) after 1 and 3 days post-IR (dpi) showing a dose-dependent decrease in stem cell number. Scale bar: 300 μm. (B) Quantification of smedwi-1+ cells/mm2 (yellow) showing the repopulation kinetics of surviving stem cells after different doses of IR post-IR (n = 5 per dose, per time point). Results are expressed as mean ± SD. (C) COMET assay showing the extent of DNA breaks (comet shape) in isolated planarian cells at 24 hr after exposure to 5, 15, and 30 Gy of IR. (D) Quantification of the percentage of tail DNA in COMET assay post-IR at 24 hr. Results are expressed as mean ± SD. Each dot represents the tail DNA in individual planarian cells. (***p<0.0001, one-way ANOVA using Tukey’s multiple comparison test). (E) Double immunostaining with Anti-TUD-1 (Yellow) and Anti-PAR (Magenta) showing DNA damage in stem cells (Tud-1+) and post-mitotic differentiated cells (Tud-1−) at 5 min post 5 Gy IR. Nucleus is stained with Hoechst (blue). (F–G) Quantification of PAR fluorescence in Tud1+ and Tud1− cells normalised to the nuclear area in irradiated and unirradiated cells (0 Gy) (*p<0.0001. Student’s t-test). (H) Representative FISH showing stem cell repopulation in Control (gfp) RNAi and after knockdown of different DNA repair genes (involved in homologous recombination [atr, atm, brca2, fancJ, rad51] and Alt-NHEJ [parp1, parp2, parp3]) after 7 days post 15 Gy IR. Gene name represents the RNAi condition. (I) Repopulation of smedwi-1+ cells/mm2 in DDR RNAi worms after 7 days post 15 Gy IR (n = 5 per condition). Results are expressed as mean ± SD in log10 scale (***p<0.0001, **p<0.001, one-way ANOVA using Tukey’s multiple comparison test).
-
Figure 1—source data 1
Numerical data used to make Graphs B, D, F, G, and I.
- https://cdn.elifesciences.org/articles/63779/elife-63779-fig1-data1-v2.zip
Figure 1—figure supplement 1
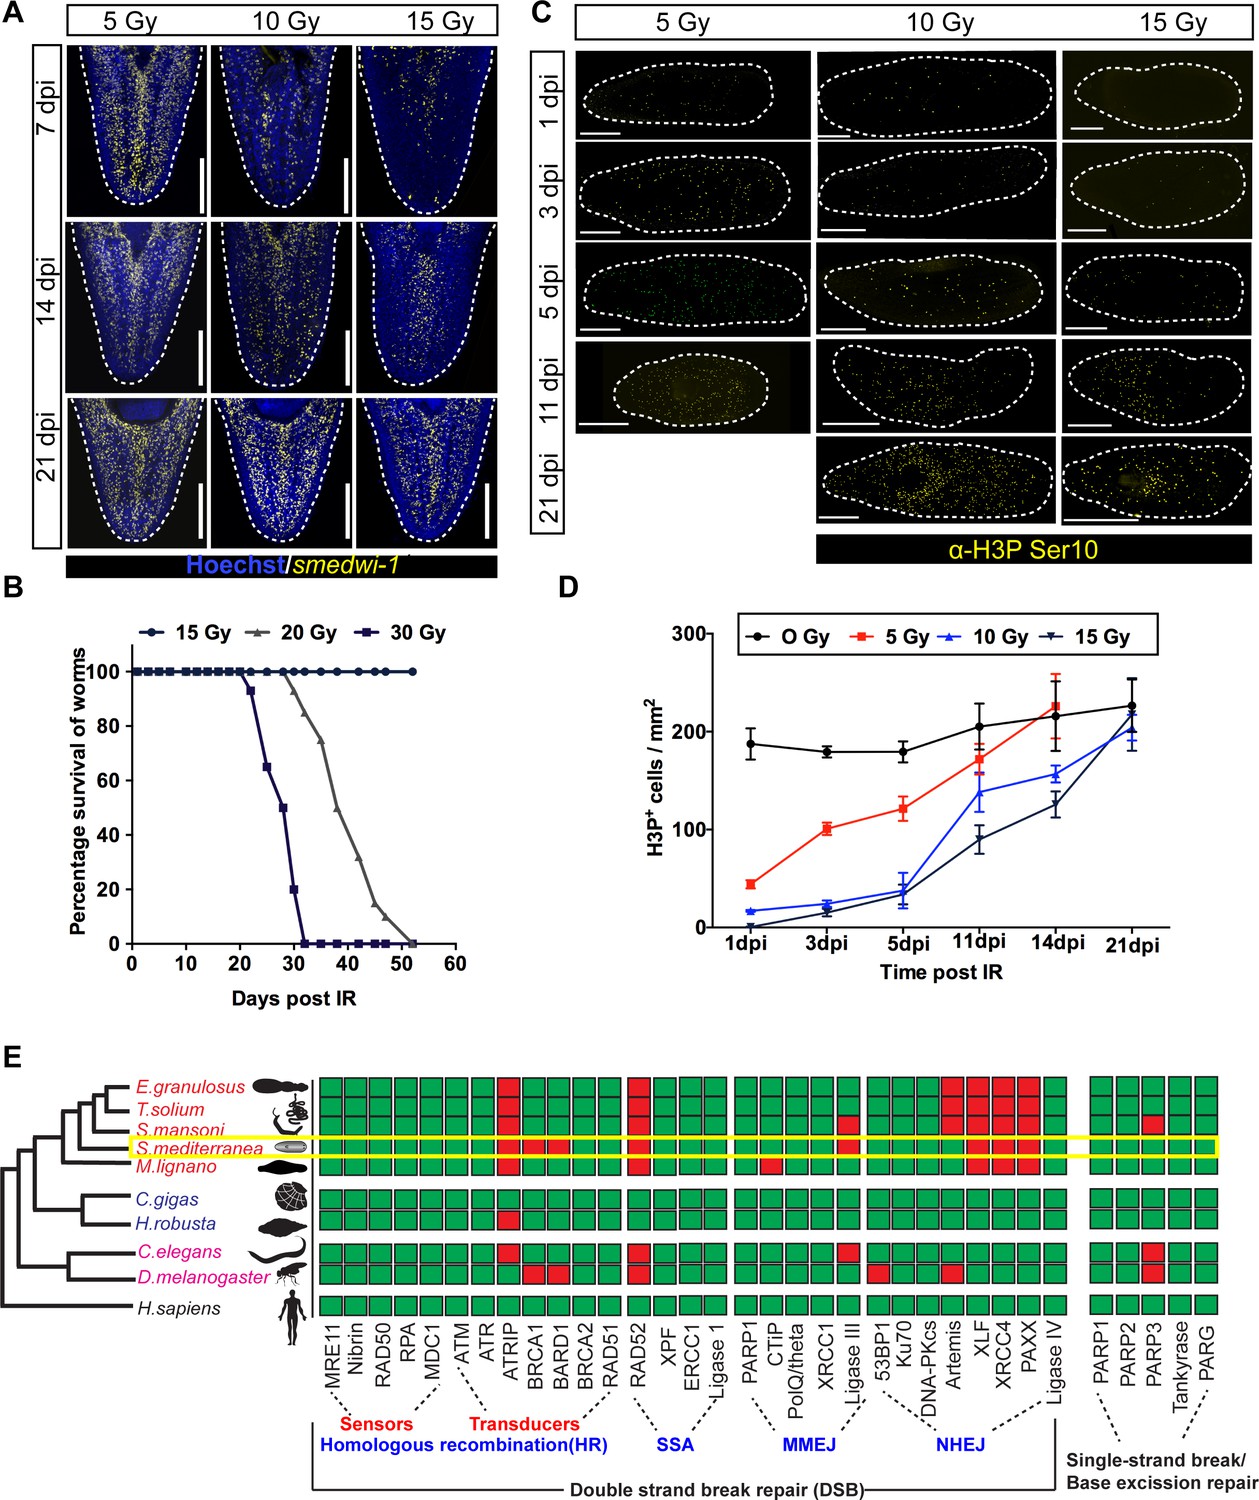
Dynamics of stem cell proliferation and repair kinetics of DNA damage in planarian stem cells.
(A) FISH showing repopulation of smedwi-1+ stem cells after different doses of IR at indicated days post-IR (dpi). Scale bar: 300 μm. (B) Survival curve indicating the percentage of animals alive after exposure to different doses of ionising radiation, n = 15 per dose. Unirradiated and worms exposed up to 15 Gy IR showed 100% survival. (C) Immunostaining with mitotic marker Anti-H3 phosphorylated-ser10 (H3pSer10) showing the repopulation of mitotic cells (yellow) after exposure to different doses of gamma IR (5, 10, 15 Gy) at indicated days post-IR (dpi). Scale: 500 μm. (D) Quantification shows the repopulation kinetics of mitotic cells at different doses of irradiation (n = 5 per condition). Results are expressed as mean ± SD. (E) The presence (green) or absence (red) of conserved DNA repair genes involved during double-stranded break repair (DSB) as sensors and transducers in homologous recombination, single-stranded annealing (SSA), microhomology-mediated end-joining (MMEJ), and non-homologous end-joining (NHEJ), single-stranded break repair in metazoans. The yellow box highlights the DNA repair proteins in S. mediterranea. The phylogenetic tree is based on Grohme et al., 2018.
-
Figure 1—figure supplement 1—source data 1
Numerical data used to make Graphs B and D.
- https://cdn.elifesciences.org/articles/63779/elife-63779-fig1-figsupp1-data1-v2.zip
Figure 1—figure supplement 2
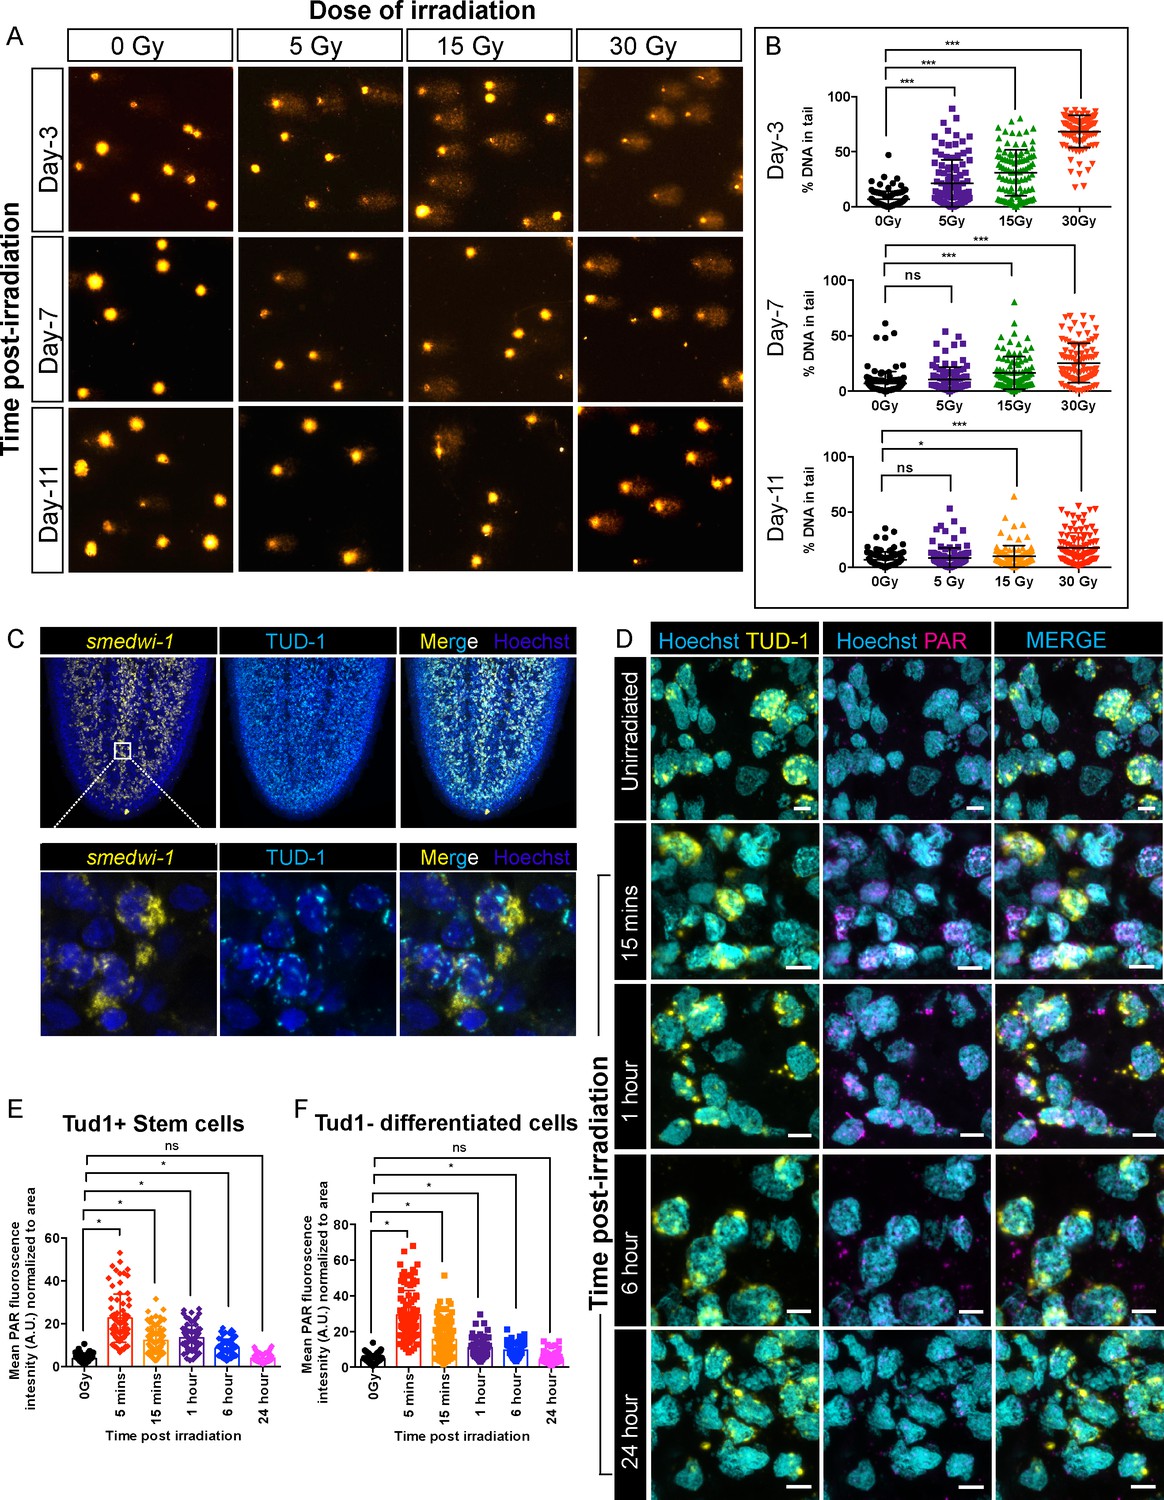
Detection of DNA breaks and DNA damage response in planarian cells after irradiation.
(A) COMET assay showing the extent of DNA breaks (Comet-shaped tails) on dissociated planarian cells at 3, 7, and 11 days post-exposure to 5, 15, and 30 Gy of gamma IR. (B) Quantification of the percentage of tail DNA in individual comet at indicated time points and dose of IR. (n = 100 comets per condition/time point) (*p<0.0001, Tukey’s multiple comparison test). (C) Smedwi-1 FISH and Tudor-1 (TUD1) immunostaining showing the presence of perinuclear chromatoid bodies (TUD1+, Cyan) in smedwi-1+ stem cells (Yellow). Nucleus is stained with Hoechst (Blue). (D) Double immunostaining with Anti-TUD1 (yellow) and Anti-Poly ADP Ribose (PAR, magenta) antibodies showing increase in nuclear PAR formation in irradiated planarian cells compared to unirradiated controls; scale bar: 10 µm. (E, F) Quantification of PAR fluorescence normalised to the area of nucleus from individual TUD1+ stem cells (E) and TUD1− differentiated cells (F) at 5 min, 15 min, 1 hr, 6 hr, and 24 hr post-exposure to 5 Gy IR. The nucleus is stained with Hoechst and pseudo-coloured to cyan. The perinuclear TUD1 staining and Hoechst stained nucleus is used to measure the area of individual nuclei. (*p<0.0001, ANOVA using Tukey’s multiple comparison test).
-
Figure 1—figure supplement 2—source data 1
Numerical data used to make Graphs B, E, and F.
- https://cdn.elifesciences.org/articles/63779/elife-63779-fig1-figsupp2-data1-v2.zip
Figure 1—figure supplement 3
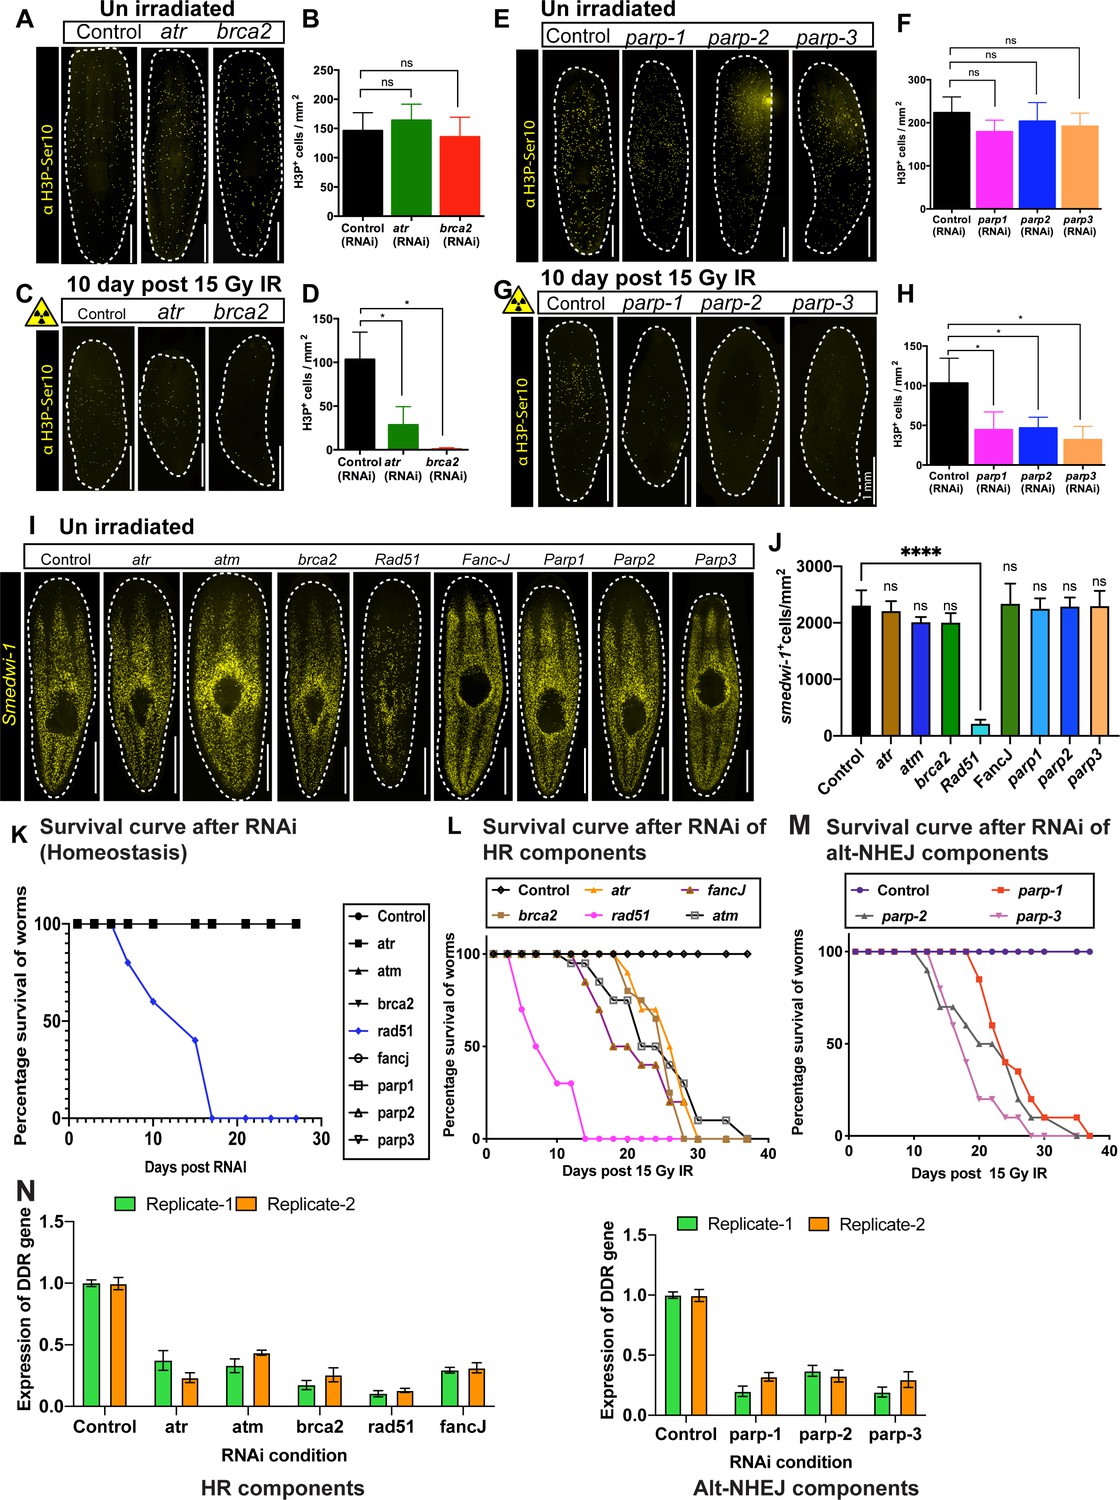
Role of DNA repair gene in planarian stem cell maintenance.
(A) Immunostaining with H3pSer10 shows the presence of mitotic cells in control worms and after atr and brca2 RNAi. (B) Quantification of H3P+ cells show no significant difference in cell division after atr and brca2 RNAi. (n = 5 per RNAi). Results are expressed as mean ± SD and (p=0.6442 [atr], p=0.8506 [brca2], ns = not significant, Tukey’s multiple comparison test). (C) Immunostaining with H3pSer10 showing the repopulation of mitotic cells in control worms and after atr and brca2 RNAi worms, 10 days post 15 Gy IR. (D) Quantification of H3p+ cells shows a significant difference in the repopulation of mitotic cells after atr and brca2 RNAi after irradiation, 10 days post 15 Gy IR. (n = 5 per RNAi). Results are expressed as mean ± SD (*p<0.0001, Tukey’s multiple comparison test). (E) Immunostaining with H3pSer10 shows the presence of mitotic cells in control worms and after parp1, parp2, and parp3 RNAi. (F) Quantification of H3p+ cells shows no significant difference in cell division after parp1, parp2 and parp3 RNAi. (n = 5 per RNAi) Results are expressed as mean ± SD and Student’s t-test used for analysis (p=0.2279 [parp1], p=0.8074 [parp2], p=0.5001 [parp3], ns = not significant, Tukey’s multiple comparison test). (G) Immunostaining with H3pSer10 showing the repopulation of mitotic cells in control worms and after parp1, parp2, and parp3 RNAi worms, 10 days post 15 Gy IR. (H) Quantification of H3p+ cells show a significant difference in the repopulation of mitotic cells after parp1, parp2, and parp3 RNAi after irradiation. (n = 5 per RNAi) (*p<0.0001, Tukey’s multiple comparison test). (I) Representative FISH showing stem cell density in Control (gfp) RNAi and after knockdown of different DNA repair genes [involved in homologous recombination (atr, atm, brca2, fancJ, rad51) and Alt-NHEJ (parp1, parp2, parp3)] at unirradiated/homeostatic condition. (J) Quantification of smedwi-1+ cells/mm2 in DDR RNAi worms (n = 3–5 per condition). Results are expressed as mean ± SD (***p<0.0001, ns = not significant, one-way ANOVA using Tukey’s multiple comparison test). (K) Survival curve of DDR RNAi worms showing lethality of Rad51 RNAi worms in homeostatic condition (n = 10 worms per condition). (L, M) Survival curve of DDR RNAi worms after exposed to 15 Gy IR (n = 15 worms per condition). (N) qPCR results showing the efficiency of knockdown of DNA repair genes.
-
Figure 1—figure supplement 3—source data 1
Numerical data used to make Graphs B, D, F, H, J, K, L, M, and N.
- https://cdn.elifesciences.org/articles/63779/elife-63779-fig1-figsupp3-data1-v2.zip
Figure 2 with 3 supplements
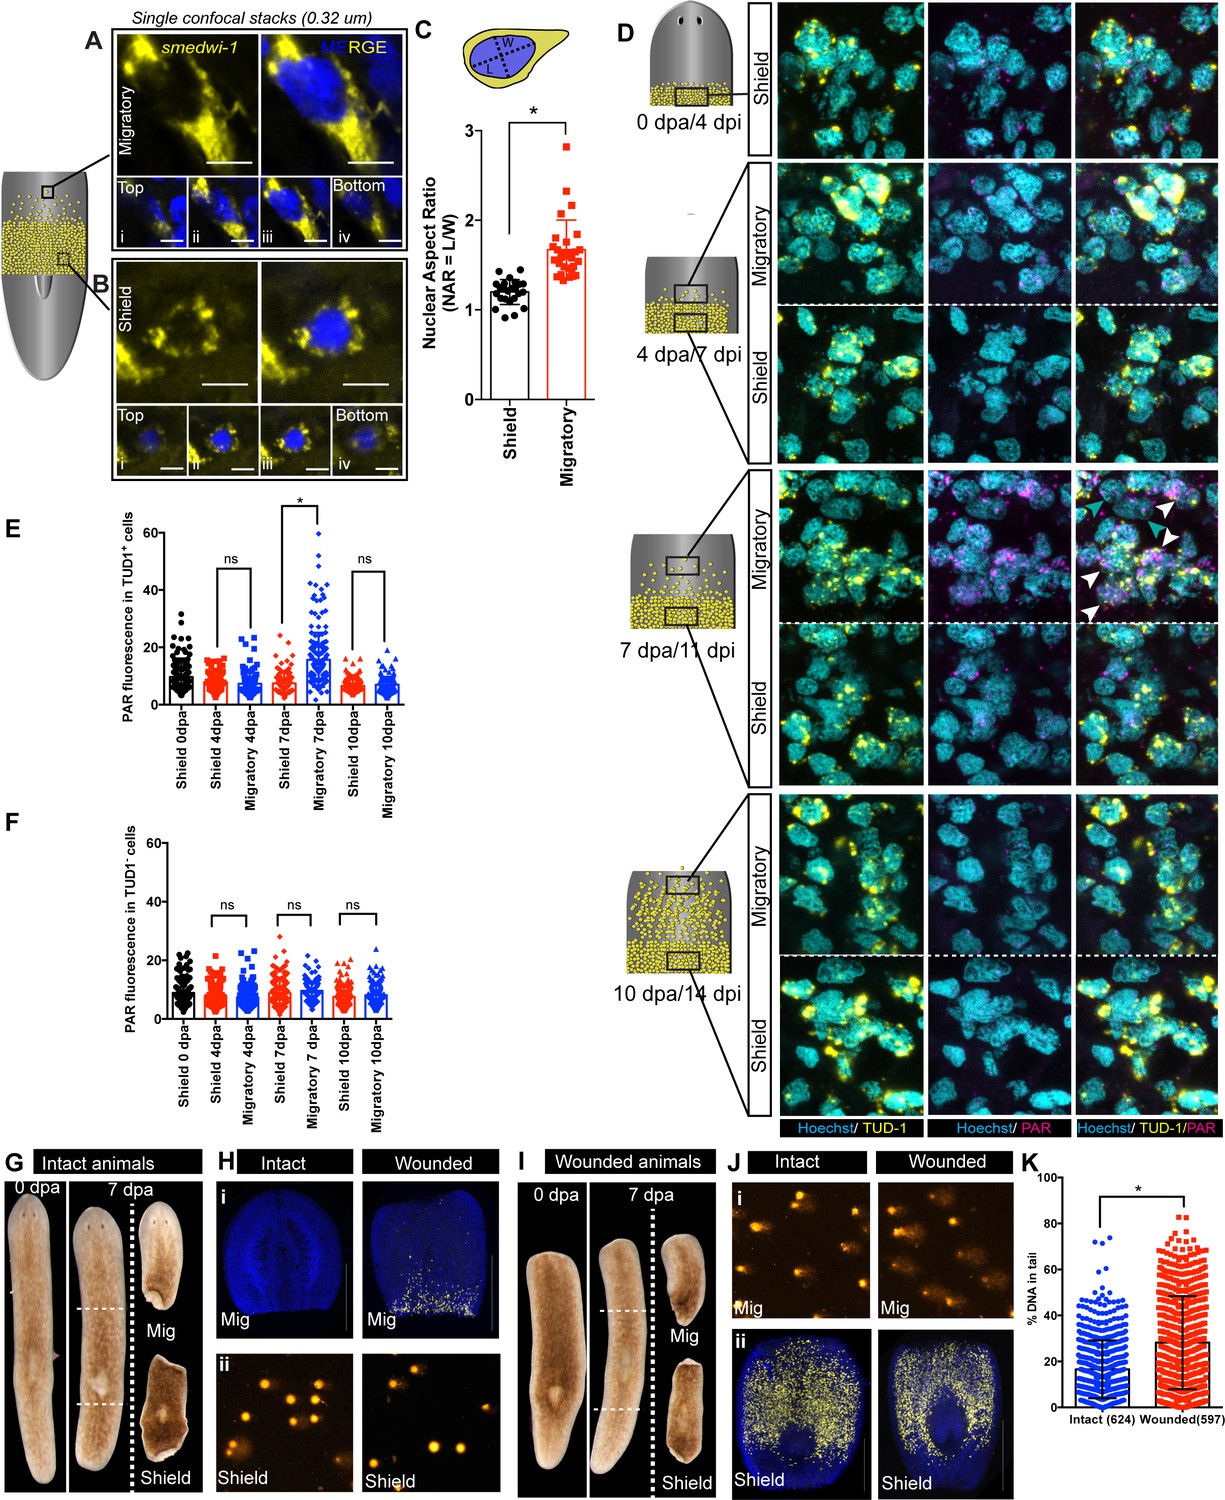
Migration-coupled DNA damage (MCDD) in stem cells.
Representative FISH showing stem cells (smedwi-1+) with extended protrusions in migratory cells (A) and stationary cells from the shielded region (B). Nuclei stained with Hoechst (blue). Images are shown as single confocal Z-stack (0.32 μm). (i–iv) is the single Z-stack from top to bottom. Scale bar: 5 μm. The cartoon explains the setup of shielded irradiation assay where a lead shield is placed in the middle and a lethal dose of 30 Gy is given to these worms. Cells under the shield (Yellow) are protected from IR and starts to migrate after amputation. (C) Quantification of nuclear aspect ratio (NAR) in the migratory cells compared to stationary cells (n = 28 cells in migratory region and n = 24 cells from the shield at 7 dpa/11 dpi [shielded irradiation assay]) (*p<0.0001. Student’s t-test). (D) Immunostaining with anti-PAR (magenta) in migrating stem cells (anti-TUD-1, yellow) after 0, 4, 7, and 10 days post-amputation showing MCDD in TUD-1+ migrating stem cells. Box denotes the field of cells imaged for analysis. Nuclei stained with Hoechst (cyan). Scale bar: 5 μm. White arrows denote increased nuclear PAR staining in Tud1+ stem cells at 7 dpa, and gray arrow denotes lack of PAR fluorescence in Tud1− cells. Quantification showing the PAR fluorescence normalised to the nuclear area from Tud1+ stem cells (E) and post-mitotic differentiated Tud1− cells (F) in the migrating region compared to stem cells in the shield. The measurement of PAR fluorescence is strictly nuclear and results are expressed as mean ± SD. (*p<0.0001; one-way ANOVA using Tukey’s multiple comparison test). Brightfield images of intact (G) and wounded (I) animals at 0 dpa and 7 dpa showing the amputated migratory region and shielded region. Dotted lines denote the position of the shield. The migratory region was used for smedwi-1 FISH and the corresponding shielded region was used for COMET assay and vice versa depending on the context (refer to Figure 2—figure supplement 3). (H) smedwi-1 FISH of the migratory tissues at 7 dpa showing the presence of migrating stem cells in wounded animals compared to no migration in intact animals. Cells corresponding to the shielded region were used for COMET assay to check for the extent of DNA damage. (J) smedwi-1 FISH of the shielded tissue at 7 dpa showing the presence of stem cells under the shield in intact and wounded animals. Cells corresponding to the migratory region from the animals were used for COMET assay to check for the extent of DNA damage in migrating stem cells in wounded animals. (K) Quantification of COMET assay showing the extent of DNA breaks in migrating cells in wounded animals compared to intact animals (absence of migrating stem cells). Each dot represents the percentage of tail DNA from single cells after COMET assay (n = 624 cells from intact animals, and 597 cells in wounded animals). Results are expressed as mean ± SD (student’s t-test; *p<0.0001).
-
Figure 2—source data 1
Numerical data used to make Graphs C, E, F, and K.
- https://cdn.elifesciences.org/articles/63779/elife-63779-fig2-data1-v2.zip
Figure 2—figure supplement 1
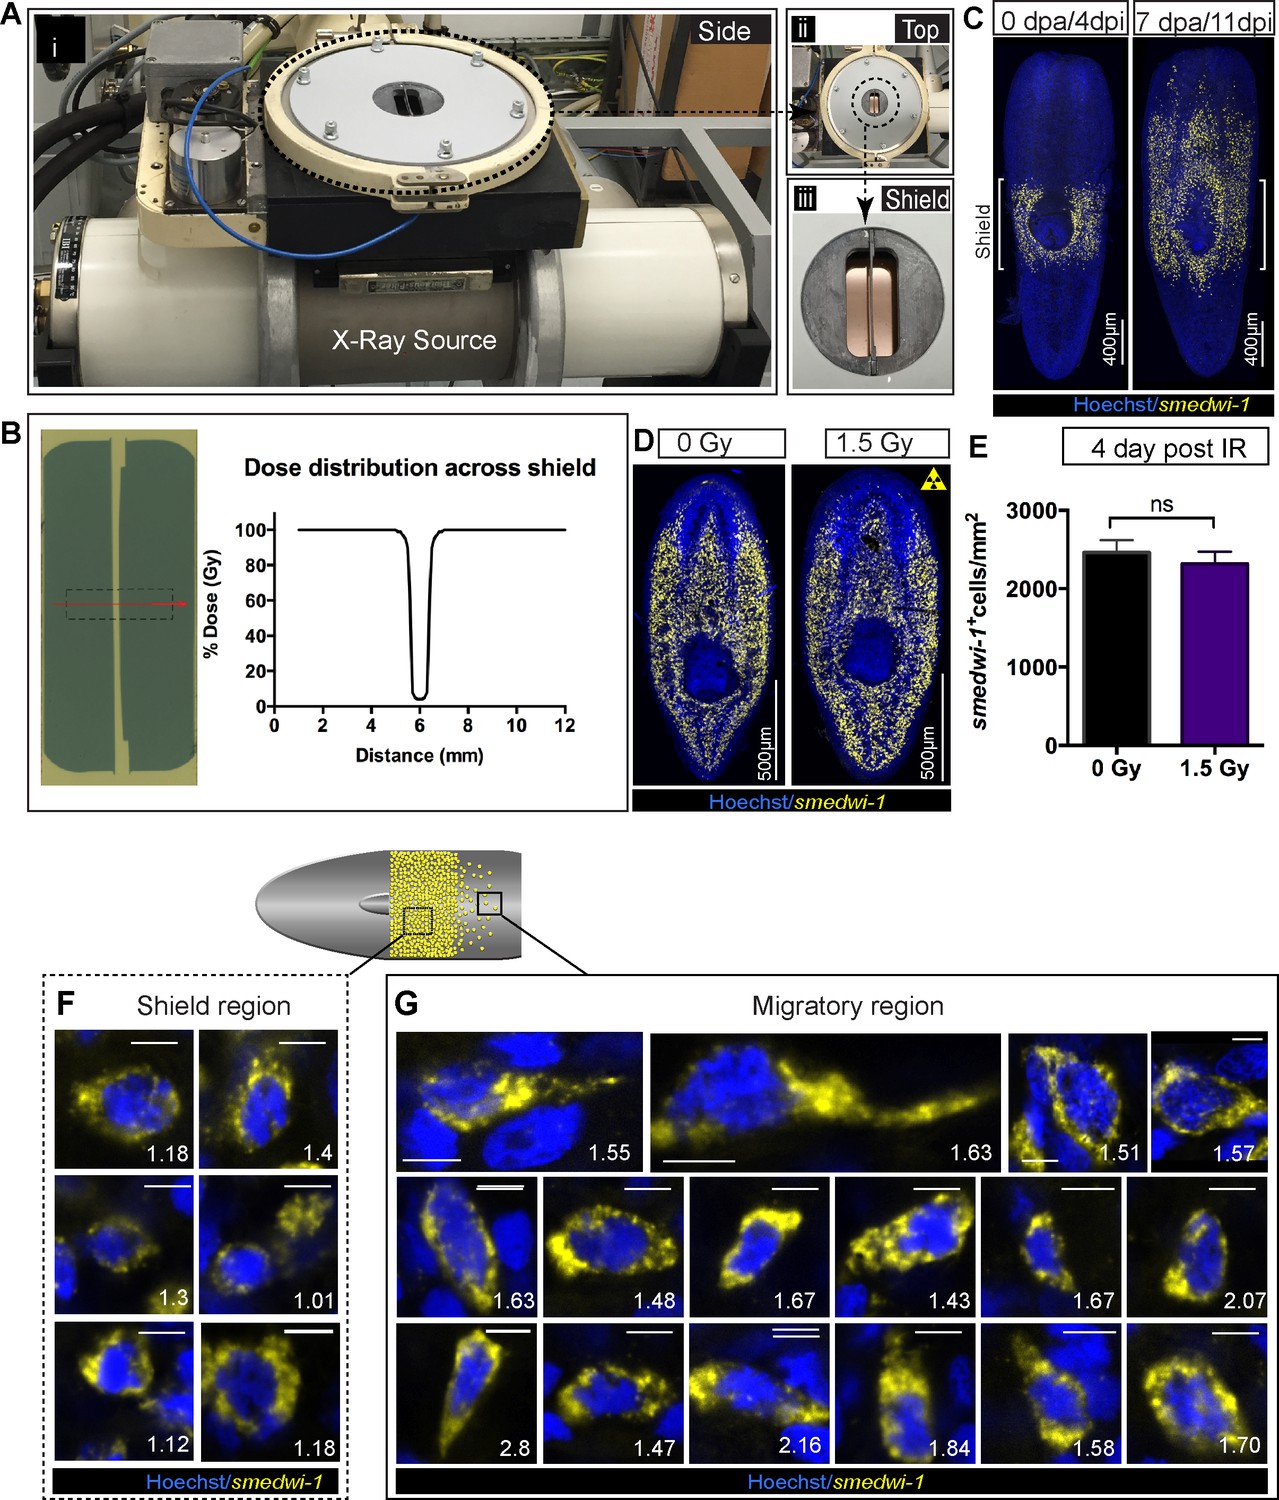
Shielded irradiation assay to study stem cell migration and change in nuclear aspect ratio in migrating cells.
(A) Experimental set up showing the shielded irradiation assay (i), with a top view showing the position of the shield (ii) and focusing on the shield (iii). (B) Dose distribution across the lead strip showing greater than 95% attenuation of X-ray (Abnave et al., 2017). An exposure of 30 Gy corresponds to a dose to the cells directly above the shield-protected region of less than 1.5 Gy. (C) Representative FISH of smedwi-1 showing the distribution of stem cells (yellow) after shielded irradiation assay and the migration of stem cells from the shield after 7 day post-head amputation. Brackets ‘[]’ represents the position of the shield. Scale bar = 400 μm. (D) Representative smedwi-1 FISH showing survival of stem cell after 4 day post 1.5 Gy of IR. (E) Graph represents smedwi-1+ cells/mm2 showed no significant difference in stem cell maintenance after 1.5 Gy IR. (n = 3, p=0.3148, Student’s t-test). (F–G) Representative FISH showing stem cells (smedwi-1+) with extended protrusions in migratory cells (F) and stationary cells from the shielded region (E). Nuclei stained with Hoechst (blue). Images are shown as single confocal Z-stack (0.32 μm). Number represents the NAR value of individual cells, plotted in Figure 2C. Scale bar = 5 μm.
-
Figure 2—figure supplement 1—source data 1
Numerical data used to make Graph E.
- https://cdn.elifesciences.org/articles/63779/elife-63779-fig2-figsupp1-data1-v2.zip
Figure 2—figure supplement 2
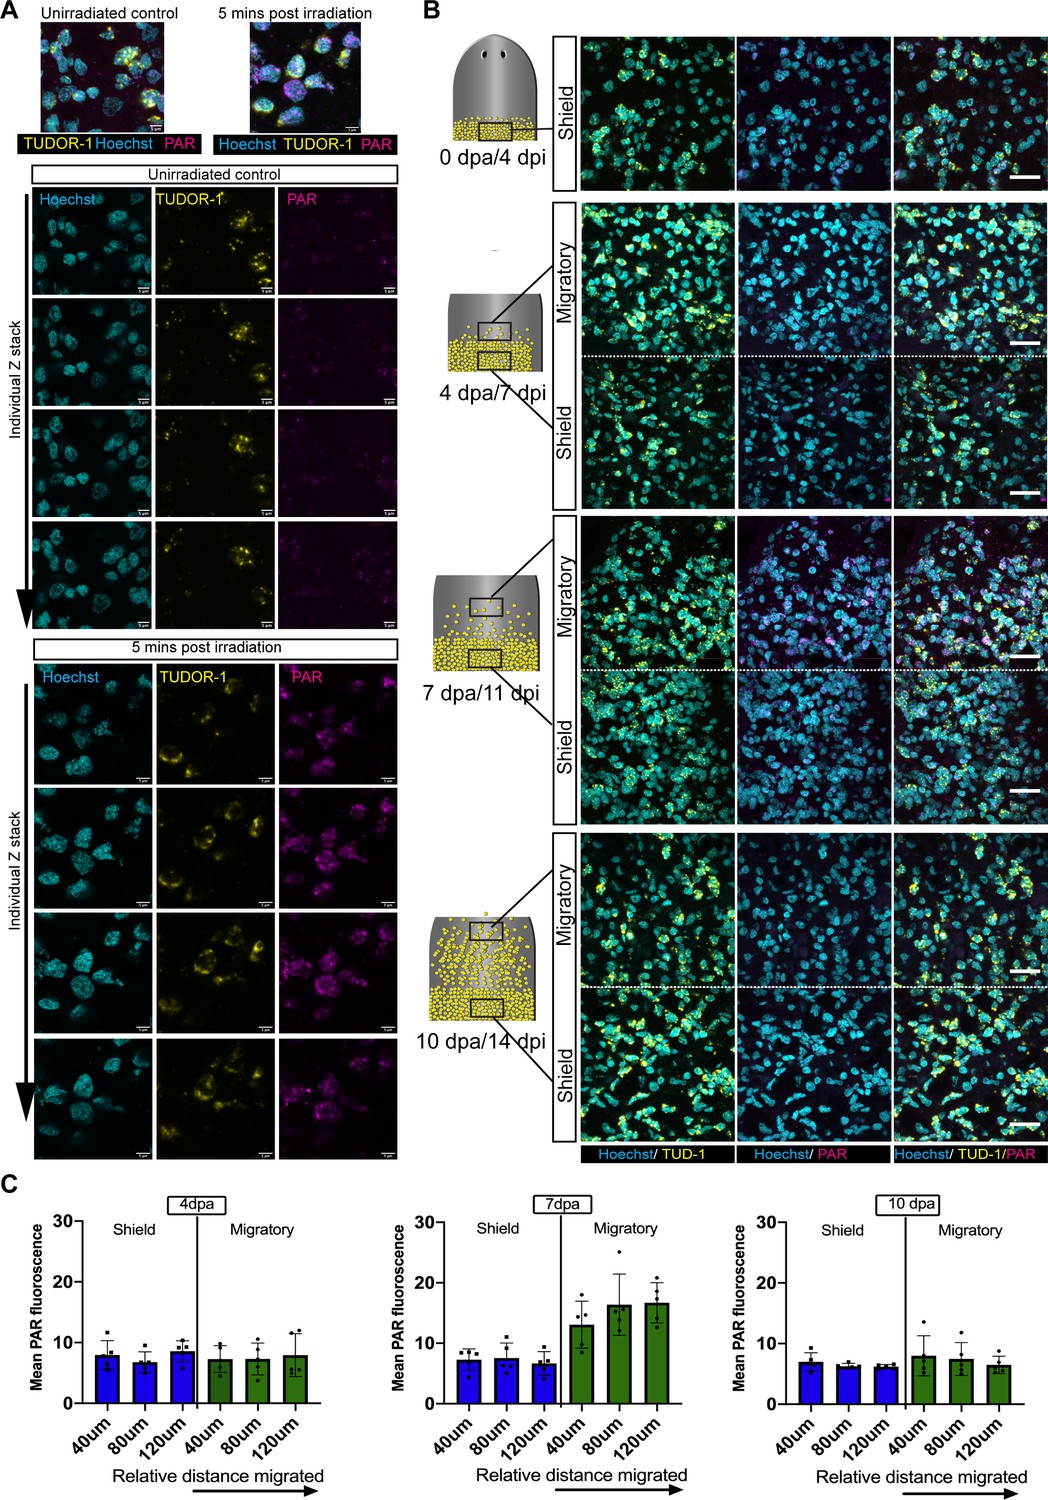
Migration coupled DNA damage in stem cells.
(A) Maximum projection of individual nucleus showing the localisation of nuclear PAR (magenta) surrounded by perinuclear Tudor one staining (yellow). The nucleus is stained by Hoechst (cyan). Single confocal z stacks of the representative image clearly show the Tud-1 staining to be perinuclear and evidence of strong nuclear PAR expression in the nucleus (after IR exposure) in all the stacks. The nuclear outline is measured based on the Hoechst channel, and total PAR fluorescence was then measured and normalised to the area. Nuclei is stained with Hoechst (cyan), scale bar: 5 µm. (B) Zoomed out images of Tud-1+ stem cells showing expression of PAR in the migratory region as compared to shielded region (related to Figure 2D). (C) Measurement of DNA damage response in Tud-1+ stem cells with distance travelled during migration. PAR fluorescence in stem cells at a 4 dpa, 7 dpa, and 10 dpa in the shielded irradiation assay within 40 µm slices along the anterior posterior axis starting at the most anterior cell and going back towards the shield. We observed an increase in PAR fluorescence at 7 dpa as cells migrate further away from the shield. This increasing trend of damage along the gradient is not evident in the shielded region, or at 10 days when cells have reached the wound site and stoppe migrating. Each dot represents the average of the total number of cells present in each 40 µm section within each worm (n = 5).
-
Figure 2—figure supplement 2—source data 1
Numerical data used to make Graph E.
- https://cdn.elifesciences.org/articles/63779/elife-63779-fig2-figsupp2-data1-v2.zip
Figure 2—figure supplement 3
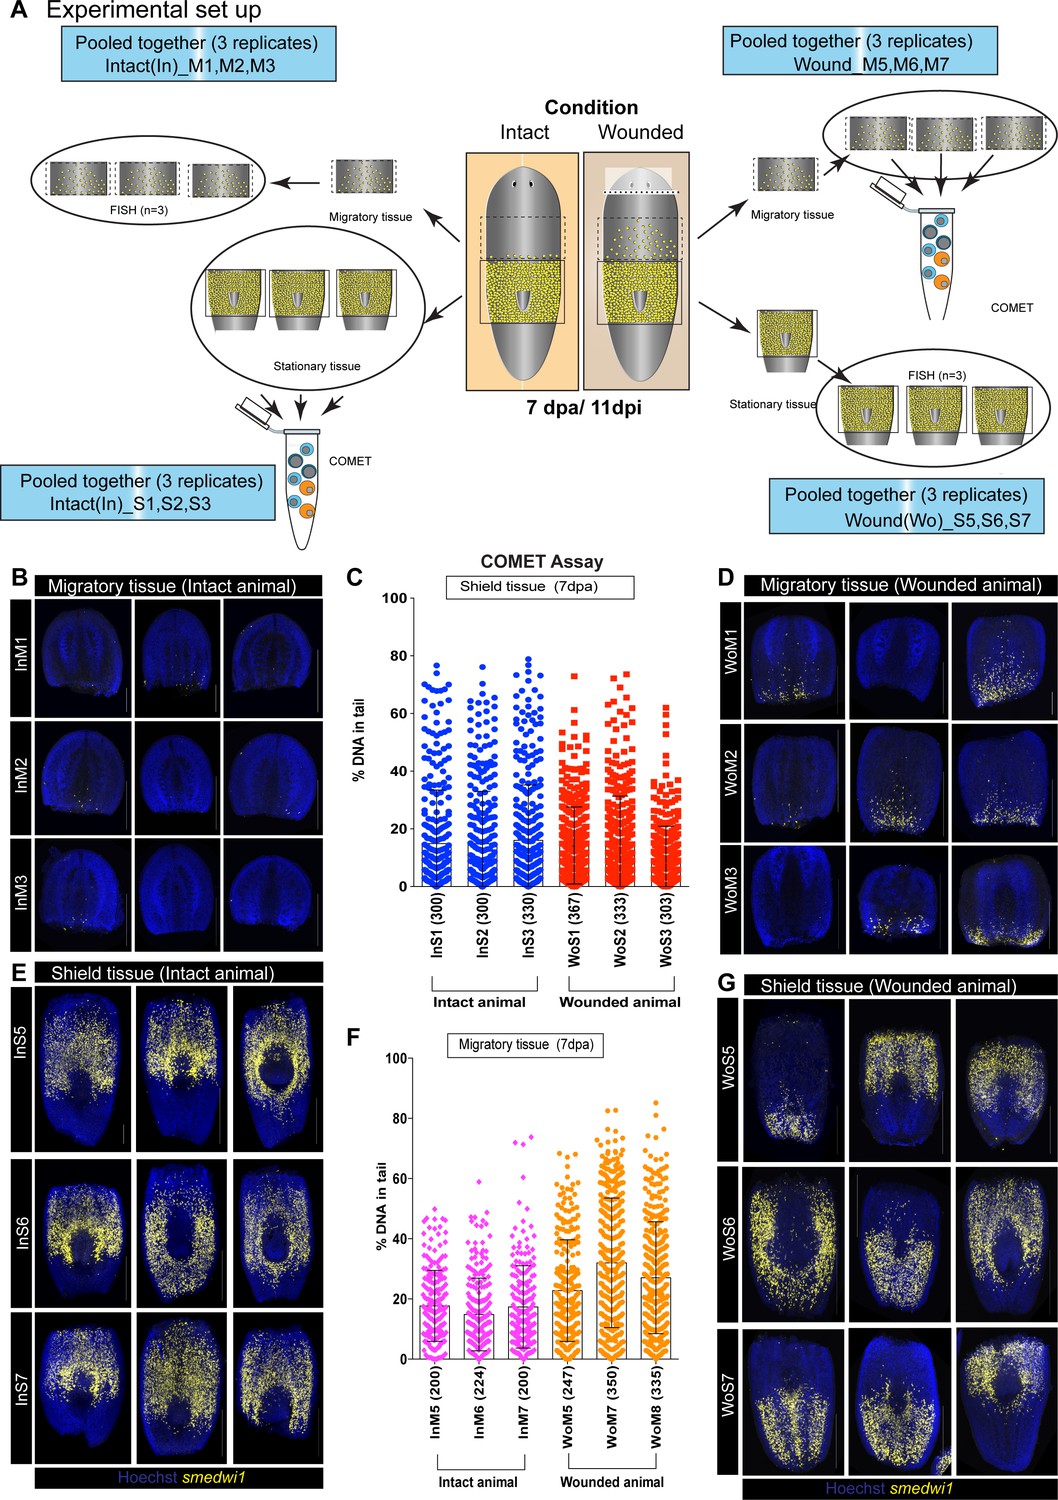
COMET assay to detect DNA breaks during stem cell migration.
(A) A schematic showing the experimental strategy to perform COMET assay coupled with smedwi-1 FISH to accurately measure DNA breaks in shielded tissue and migratory tissue. Planarian worms were amputated (Wounded) 4 days after the shielded irradiation assay and at 7 day post-amputation (7 dpa/11 dpi) the shielded tissue and the migratory tissue were amputated. Individual migratory tissue fragments from intact and wounded animals were used for COMET assay and the corresponding shielded tissue were used for smedwi-1 FISH and vice verse. Each FISH is performed in three batches (InM1, InM2, InM3) with three worms per batch. The panels are named as ‘In’ or ‘Wo’ corresponding to Intact or Wounded. ‘M’ and ‘S’ correspond to Migratory tissue or Shielded tissue. The numbers denote different batch of experiment. The corresponding shielded tissue from these worms were pooled for COMET assay. (B, D) smedwi-1 FISH from migratory tissue of intact animals showing no migration compared to migrating smedwi-1+ stem cells in wounded animals (D). (C) Graph represents the percentage of DNA in tail from individual comets from cells in the shielded tissue from intact and wounded animals (300 comets were analysed per condition, n = 900 comets from intact animals and n = 900 from wounded animals). (E, G) smedwi-1 FISH from shielded tissue of intact (E) and wounded animals (G) showing the accuracy of cutting the migratory region. The tip of the tail was also amputated before the COMET assay/FISH to reduce the number of dead cells from the irradiated tissue. (F) Graph represents the percentage of DNA in the tail of individual comets from cells in the migratory tissue from intact and wounded animals showing an increase in DNA breaks in cells from the migratory region compared to the shielded region. Numbers in parenthesis depicts the total number of comets analysed. The data from (F) is used in Figure 2L.
-
Figure 2—figure supplement 3—source data 1
Numerical data used to make Graph E.
- https://cdn.elifesciences.org/articles/63779/elife-63779-fig2-figsupp3-data1-v2.zip
Figure 3 with 1 supplement

DNA damage delays migration and migrating stem cells with MCDD are more sensitive to ionising radiation.
(A) Experimental scheme showing worms pre-exposed to irradiation (5 and 10 Gy) followed by a shielded irradiation and amputation after 24 hr. Worms are fixed at 4 dpa and 6 dpa (dpa = days post-amputation). Box represents the migratory region, represented in the figure below. (B, C) FISH showing worms pre-exposed to IR (5 and 10 Gy) show delayed stem cell migration after 4 and 6 dpa. Dotted line represents anterior boundary of the shield. Scale bar: 350 μm. (D) Distance migrated by 10 most distant cells are counted from individual worms (n = 5 per condition). Results are expressed as mean ± SD. Statistical significance determined by multiple t-test using the Holm–Sidak method, *p<0.05. (E) Schematic of experimental set up to study sensitivity of migrating cells to IR. In addition to the initial shielded irradiation, the worms were irradiated with a low dose of IR (5 Gy, whole body) when MCDD is high (7 dpa) and are fixed after 24 hr to check the survival of the migratory stem cells to IR. (F–K) Representative smedwi-1 FISH showing migrating cells are more sensitive to IR than the cells in the shielded region. The region counted for analysis is marked with a box (bold: migratory region, dotted: shielded region). (n = 5 per condition, scale bar: 200 μm F, I; ;100 μm G, H, J, K). (L) Quantification of smedwi-1+ cells/mm2 cells in the shielded region and in the migratory region. The decrease in cells/ mm2 in the migratory field is significant compared to the decrease in the shielded region indicating that MCDD sensitises cells to IR. Cartoon showing the region counted for analysis. Each dot represents number of surviving cells from individual worms, n = 5. Statistical significance determined by two-way ANOVA using Tukey’s multiple comparison test (*p<0.05). (M) Distance migrated by stem cells showing that cells are more sensitive to low-dose IR the further they have migrated. Each dot represents the distance migrated by individual cells. Distance migrated by 11 most distant cells are counted from individual worms (n = 5 per condition). Results are expressed as mean ± SD (student’s t-test; *p<0.0001, ns = not significant).
-
Figure 3—source data 1
Numerical data used to make Graphs D, L, and M.
- https://cdn.elifesciences.org/articles/63779/elife-63779-fig3-data1-v2.zip
Figure 3—figure supplement 1
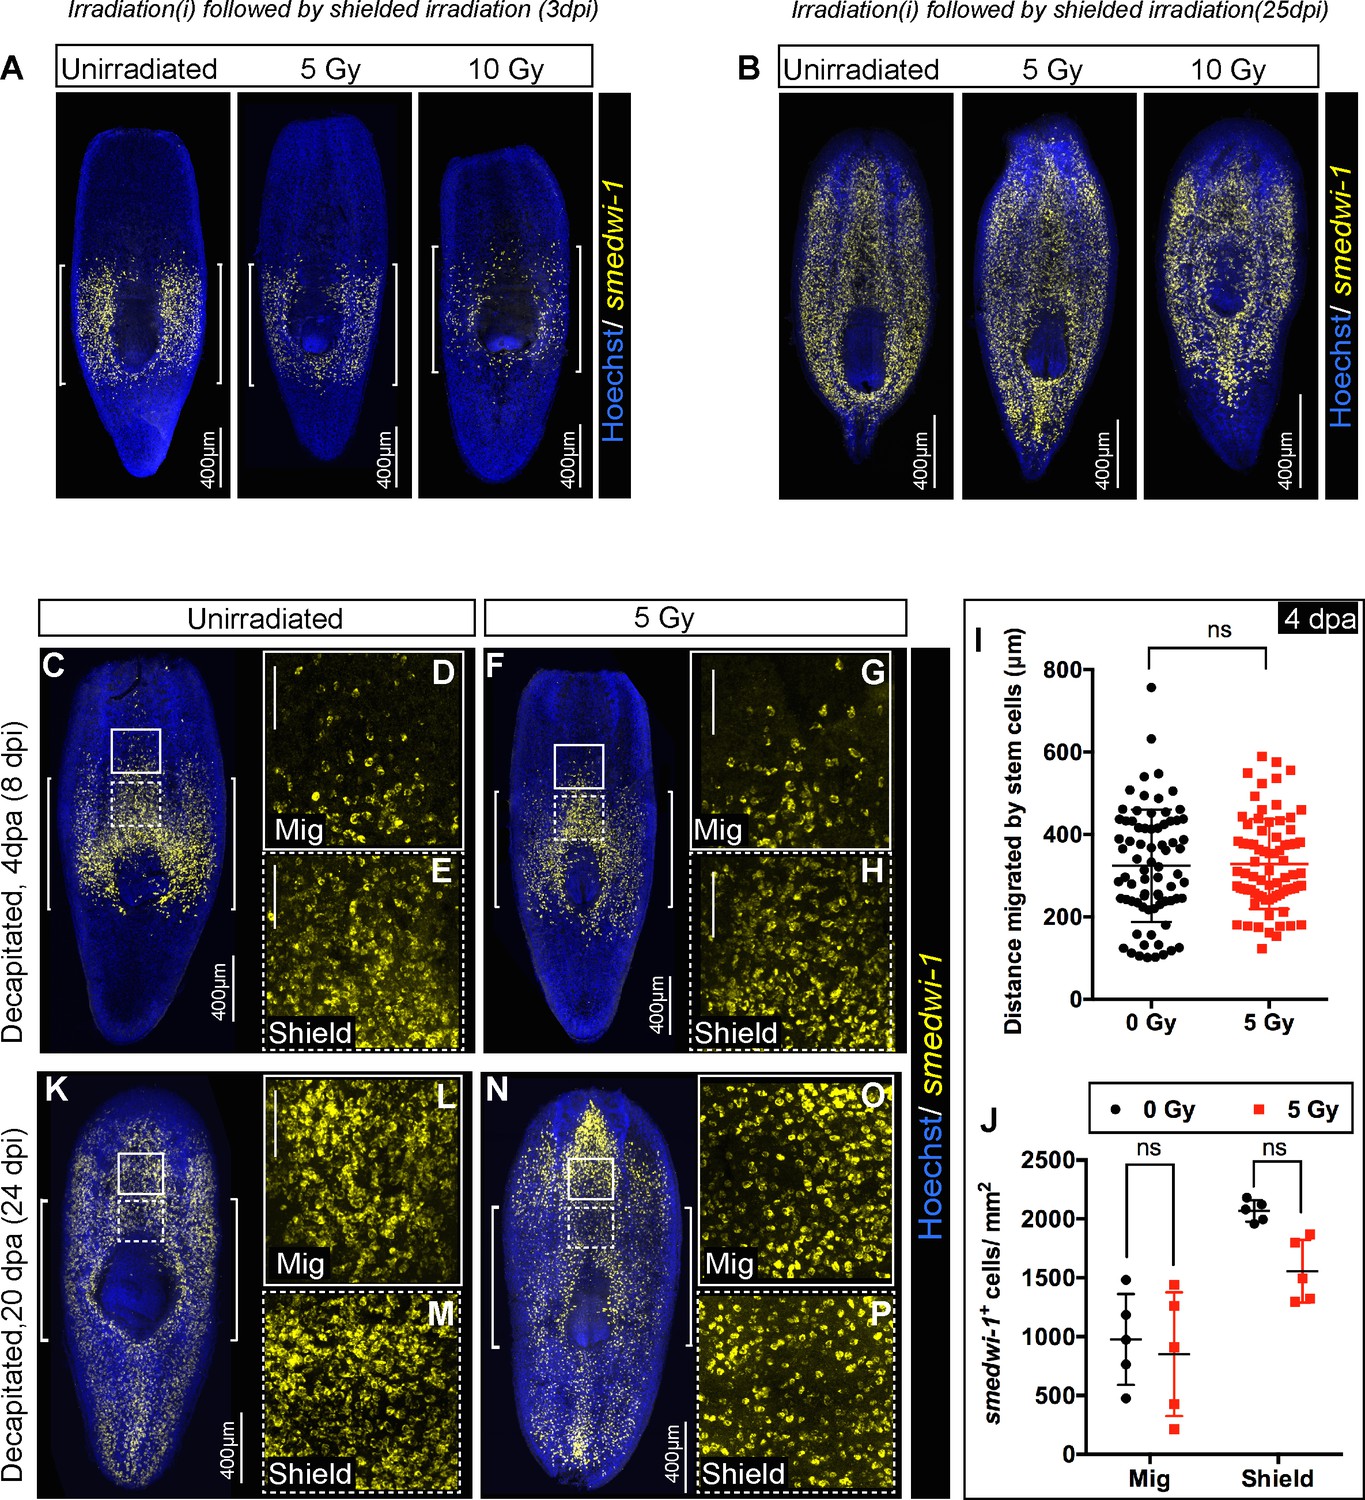
Stem cells pre-loaded with damage before wounding show delays in migration.
(A) Representative FISH showing the distribution of stem cells in the shield after 5 and 10 Gy of IR followed by the shielded irradiation assay (3 day post-IR). [] brackets indicate the shielded area. Scale bar: 400 μm. (B) The stem cells can eventually migrate and rescue the whole animal. Representative FISH showing the stem cells migrate and reach the wound and rescue the worm (25 day post-IR). Scale bar: 400 μm. (C–P) Worms are irradiated with a low dose of IR (5 Gy) when cells start to migrate (4 dpa, C–H) and cells reach the wound (20 dpa, K–P). Worms are fixed after 24 hr to check the survival of the migratory stem cells. Representative smedwi-1 FISH showing the sensitivity of migrating cells and cells in the shielded region. The region counted for analysis is marked with a box (bold: migratory region, dotted: shielded region). (n = 5 per condition). (I) Distance migrated by stem cells suggests no significant sensitivity of stem cells to IR (at least 11 distant cells are counted from individual worms and plotted in the graph. Results are expressed as mean ± SD (p=0.48, ns = not significant, student’s t-test) n = 5 worms/condition. (J) Quantification of smedwi-1+ cells/mm2 cells (yellow) in the shielded region and in the migratory region. Rate of decrease in the migratory field and in the shielded region is plotted in the graph. The region counted for analysis is marked with a box (bold: migratory region G, J, M, P; dotted: shielded region H, K, N, Q). Cells are counted by making a 300 × 300 box anterior to the shield (counted as migratory field) and 300 × 300 box posterior to the shield (counted as shielded region). Results are expressed as mean ± SD and Tukey’s multiple comparison test is used to check for significance. Each dot corresponds to smedwi-1+ cells/mm2 in individual worm, n = 5, *p<0.05, ns = not significant).
-
Figure 3—figure supplement 1—source data 1
Numerical data used to make Graphs I and J.
- https://cdn.elifesciences.org/articles/63779/elife-63779-fig3-figsupp1-data1-v2.zip
Figure 4
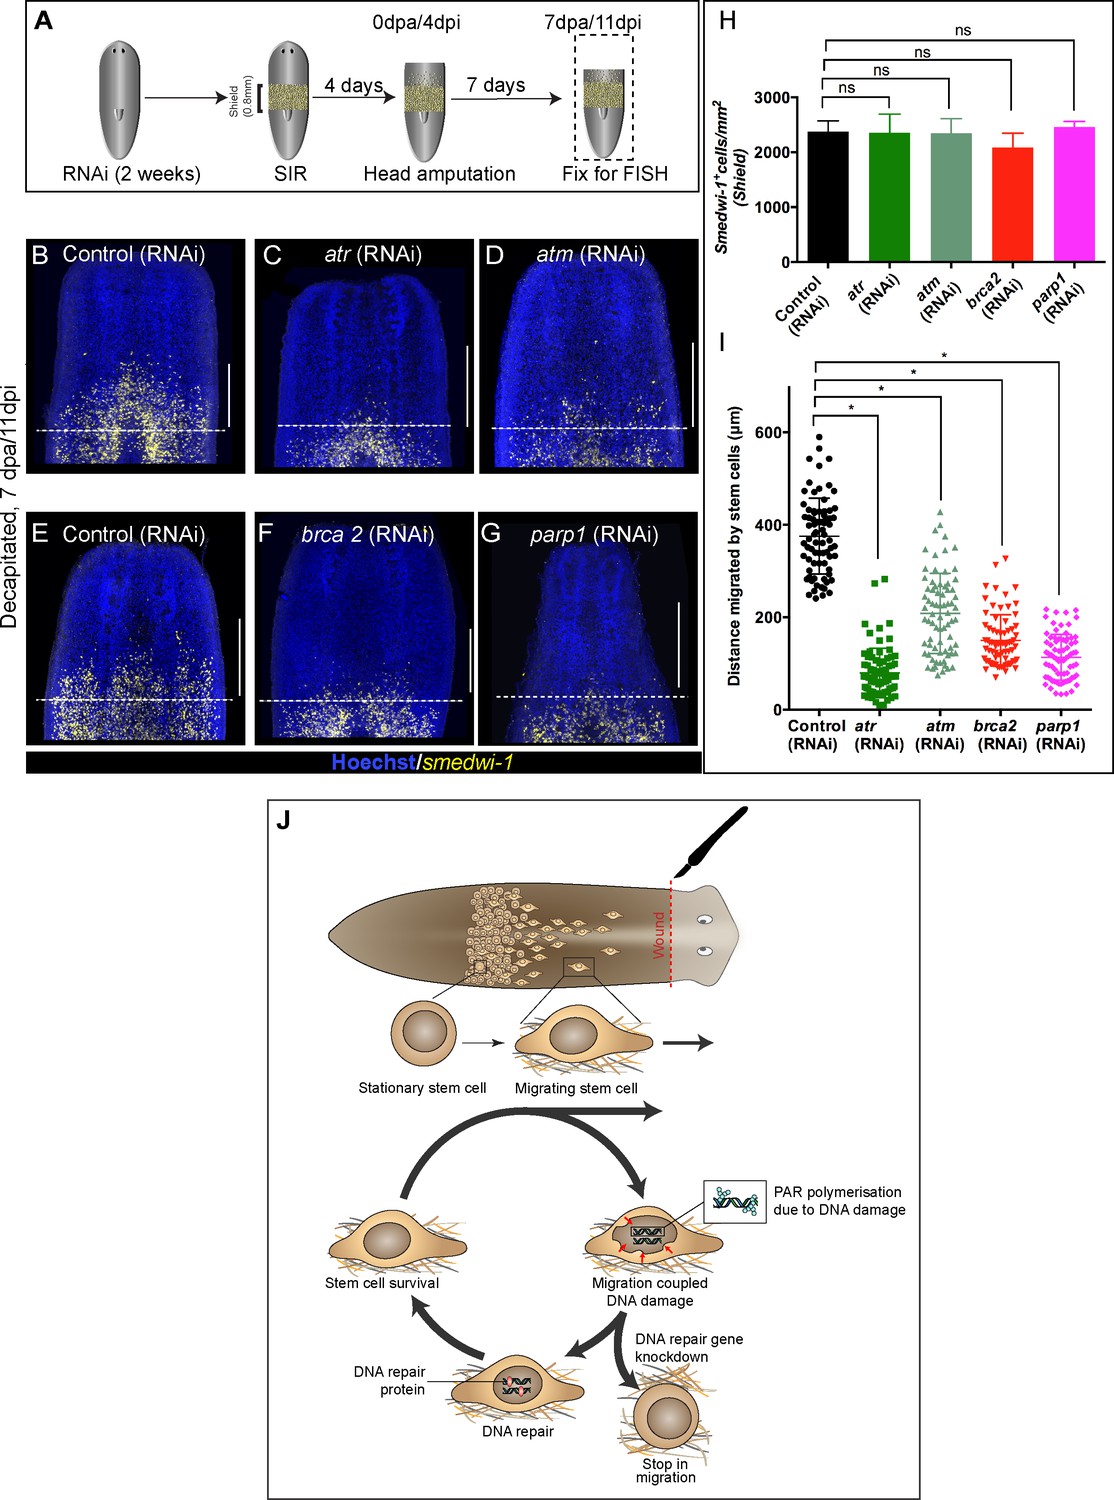
Wound-induced stem cell migration requires active DNA repair mechanisms to resolve ongoing MCDD.
(A) Experimental scheme to study the role of DDR genes in stem cell migration. Worms are injected for 2 weeks (RNAi) followed by the shielded irradiation assay and fixed for FISH 7 days post-head amputation. (B–G) Representative smedwi-1 FISH shows migration of stem cells (yellow) at 7 dpa in control (RNAi) (B and E) worms, but migration is inhibited in atr (C), atm (D) brca2 (F), and parp1 (G) RNAi worms. (n = 5 per RNAi condition). Scale bar: 400 μm, dotted line represents the anterior boundary of the shielded region. (H) Stem cells in the shielded region show no significant changes in the stem cell turnover. (*p<0.05, ns = not significant, p>0.9999 [atr], 0.9818 [atm], 0.99997 [brca2], 0.3722 [parp1], respectively), (n = 5 per RNAi condition, Tukey’s multiple comparison test). (I) Quantification showing the distance travelled by stem cells after knockdown of DNA repair genes compared to the control RNAi. Each dot represents the distance migrated by individual cells. Distance migrated by 15 most distant cells are counted from individual worms. Results are expressed as mean ± SD n = 75 cells; n = 5 worms/RNAi condition (Tukey’s multiple comparison test; *p<0.0001, ns = not significant). (J) Stem cells undergo changes in nuclear shape during migration compared to stationary cells in the shield. This model proposes that stem cells undergo migration, followed by MCDD and DNA repair. In the absence of functional DNA repair machinery stem cells fail to migrate.
-
Figure 4—source data 1
Numerical data used to make Graphs H and I.
- https://cdn.elifesciences.org/articles/63779/elife-63779-fig4-data1-v2.zip
Tables
Key resources table
| Reagent type (species) or resource | Designation | Source or reference | Identifiers | Additional information |
|---|---|---|---|---|
| Strain, strain background (species) (Schmidtea mediterranea) | Asexual clonal line CIW4 | Inhouse laboratory cultured | All animals used in this study | |
| Gene (Schmidtea mediterranea) | RAD51 | GenBank | KM487300.1 | RNAi |
| Gene (Schmidtea mediterranea) | BRCA2 | GenBank | KT375435.1 | RNAi |
| Gene (Schmidtea mediterranea) | ATR | Planmine | dd_Smed_v6_8754_0_1 | RNAi |
| Gene (Schmidtea mediterranea) | ATM | Planmine | dd_Smed_v6_14586_0_1 | RNAi |
| Gene (Schmidtea mediterranea) | FANC-J | Planmine | dd_Smed_v6_16638_0_2 | RNAi |
| Gene (Schmidtea mediterranea) | PARP1 | Planmine | dd_Smed_v6_10338_0_1 | RNAi |
| Gene (Schmidtea mediterranea) | PARP2 | Planmine | dd_Smed_v6_6154_0_1 | RNAi |
| Gene (Schmidtea mediterranea) | PARP3 | Planmine | dd_Smed_v6_2611_0_1 | RNAi |
| Antibody | Anti-digoxigenin-POD, Fab fragments (rabbit polyclonal) | Sigma/Roche | # 11207733910 RRID:AB_514500 | FISH (1:2000) |
| Antibody | Anti-fluorescein-POD, Fab fragments (rabbit polyclonal) | Sigma/Roche | #11426346910 RRID:AB_840257 | FISH (1:2000) |
| Antibody | Anti-H3P (phosphorylated serine 10 on histone H3 (rabbit polyclonal)) | Millipore | #09–797 RRID:AB_1977177 | IF (1:1000) |
| Antibody | Anti-Poly (ADP) Ribose (PAR) monoclonal antibody (clone 10H) (mouse monoclonal) | Santacruz | #SC-56198 RRID:AB_785249 | IF (1:250) |
| Antibody | Anti-TUDOR-1(Tud1) (rabbit polyclonal) | Aboobaker Lab Solana et al., 2009 | IF (1:250) | |
| Antibody | Goat-Anti-rabbit-HRP (goat polyclonal) | Invitrogen | #65–6120 | IF (1:2000) |
| Antibody | Goat-Anti-mouse HRP (goat polyclonal) | Invitrogen | #62–6520 | IF (1:2000) |
| Chemical compound, drug | Formaldehyde | EMD Millipore | FX0410-5 | Used at 4% for fixing animals |
| Chemical compound, drug | Platinum Taq | Invitrogen | #10966026 | PCR |
| Chemical compound, drug | Trizol | Invitrogen | #15596026 | RNA isolation |
| Chemical compound, drug | Superscript III Reverse transcriptase | Invitrogen | #18080093 | cDNA synthesis |
| Chemical compound, drug | Absolute qPCR mix, SYBR Green | Thermo Fisher | #AB1159A | RT-qPCR expression |
| Chemical compound, drug | Chloretone | Sigma | #112054 | Anaesthetising worms |
| Chemical compound, drug | Instant ocean Sea Salt | Instant Ocean | #SS15-10 | Culturing animals |
| Sequence-based reagent | ATR_F | Sigma | GCGCAGGAATTCAGAAACTC | dsRNA for RNAi |
| Sequence-based reagent | ATR_R | Sigma | GACGGTCACCGAGACCTAAA | dsRNA for RNAi |
| Sequence-based reagent | ATM_F | Sigma | ATTCACTGGGCCAACGTTGA | dsRNA for RNAi |
| Sequence-based reagent | ATM_R | Sigma | TCTTCCCTCGACACCAAACG | dsRNA for RNAi |
| Sequence-based reagent | BRCA2_F | Sigma | ATGGACGGGATGTGATGAGC | dsRNA for RNAi |
| Sequence-based reagent | BRCA2_R | Sigma | ATGCACCTTCCACGAGCAAT | dsRNA for RNAi |
| Sequence-based reagent | Rad51_F | Sigma (Peiris et al., 2016) | TTTGCAAGGTGGTGTTGAAA | dsRNA for RNAi |
| Sequence-based reagent | Rad51_R | Sigma (Peiris et al., 2016) | ATCAGCCAACCGTAACAAGG | dsRNA for RNAi |
| Sequence-based reagent | FancJ_F | Sigma | AGCGGAAAGGAAGACTGTCA | dsRNA for RNAi |
| Sequence-based reagent | FancJ_R | Sigma | TAGGCACGACTTCACTGCAC | dsRNA for RNAi |
| Sequence-based reagent | PARP1_F | Sigma | AACGTGCAATGCTGGAGTTT | dsRNA for RNAi |
| Sequence-based reagent | PARP1_R | Sigma | TCCTACCCCTTTGCAACTGT | dsRNA for RNAi |
| Sequence-based reagent | PARP2_F | Sigma | TGACTGGCAAGATCGTCAGA | dsRNA for RNAi |
| Sequence-based reagent | PARP2_R | Sigma | AGTTGTTCTTGAACCGTGCC | dsRNA for RNAi |
| Sequence-based reagent | PARP3_F | Sigma | AACTCTTGTGGCATGGAACC | dsRNA for RNAi |
| Sequence-based reagent | PARP3_R | Sigma | CGCAGAGTTCGTGAAATGAA | dsRNA for RNAi |
| Sequence-based reagent | Atr_qPCR_F | Sigma | ACGCGTGGTATAGGAGCGTG | qPCR |
| Sequence-based reagent | Atr_qPCR_R | Sigma | TATGACGGTCACCGAGACC | qPCR |
| Sequence-based reagent | Atm_qPCR_F | Sigma (Peiris et al., 2016) | CTGATTGGTCGGCTTTCATT | qPCR |
| Sequence-based reagent | Atm_qPCR_R | Sigma (Peiris et al., 2016) | AGCTAACCAATCCCCCAAAG | qPCR |
| Sequence-based reagent | Brca2_qPCR_F | Sigma (Peiris et al., 2016) | CAAAGAGACCCTGCTTGAGG | qPCR |
| Sequence-based reagent | Brca2_qPCR_R | Sigma (Peiris et al., 2016) | AGCCGGAACACAGTACCATC | qPCR |
| Sequence-based reagent | Rad51_qPCR_F | Sigma (Peiris et al., 2016) | ATGTCAGAATCCCGATACGC | qPCR |
| Sequence-based reagent | Rad51_qPCR_R | Sigma (Peiris et al., 2016) | ATCAGCCAACCGTAACAAGG | qPCR |
| Sequence-based reagent | FancJ_qPCR_F | Sigma | CACCAGTGGAACCTTATCTCC | qPCR |
| Sequence-based reagent | FancJ_qPCR_R | Sigma | GGACGGTCCGTTTCCGATGCT | qPCR |
| Sequence-based reagent | Parp1_qPCR_F | Sigma | CGATTCTATACAATGATGCC | qPCR |
| Sequence-based reagent | Parp1_qPCR_R | Sigma | CTGCTTCCATCAGTTTATAGGC | qPCR |
| Sequence-based reagent | Parp2_qPCR_F | Sigma | CAAGAACAACTAATTACGGTGG | qPCR |
| Sequence-based reagent | Parp2_qPCR_R | Sigma | GATCTCGTCGGGTAATATAG | qPCR |
| Sequence-based reagent | Parp3_qPCR_F | Sigma | GATATTGAAAGTACTCAAGC | qPCR |
| Sequence-based reagent | Parp3_qPCR_R | Sigma | CAACATCTAGCATCTTGAACC | qPCR |
| Software algorithm | TBLASTX | U.S. National Library of Medicine | RRID:SCR_011823 | Human gene comparison |
| Software algorithm | BLASTX | U.S. National Library of Medicine | RRID:SCR_001653 | Homology searches |
| Software algorithm | eggNOG.5.0 | European Molecular Biology Laboratory, Hiedelberg | RRID:SCR_002456 | Identify orthologs |
| Software algorithm | Inparanoid | http://inparanoid.sbc.su.se/cgi-bin/index.cgi | RRID:SCR_006801 | Identify orthologs |
| Software algorithm | Planmine | MPI-CBG, Dresden (Dr. Jochen Rink) | http://planmine.mpi-cbg.de/ | Identify flatworm sequences |
| Software algorithm | Fiji/Image-J | MPI-CBG, Dresden/National Institutes of Health (NIH) | PMID:22743772 RRID:SCR_002285 | Image processing and analysis |
| Software algorithm | KOMET (andor) | Oxford instruments | https://andor.oxinst.com/products/komet-software/ | Comet assay analysis |
| Software algorithm | Graphpad Prism v6 | Graphpad | RRID:SCR_002798 | Graphs and statistical analysis |
| Software algorithm | Illustrator CC | Adobe | RRID:SCR_010279 | Making figures |
Additional files
Download links
A two-part list of links to download the article, or parts of the article, in various formats.
Downloads (link to download the article as PDF)
Open citations (links to open the citations from this article in various online reference manager services)
Cite this article (links to download the citations from this article in formats compatible with various reference manager tools)
Ongoing repair of migration-coupled DNA damage allows planarian adult stem cells to reach wound sites
eLife 10:e63779.
https://doi.org/10.7554/eLife.63779


