SAM homeostasis is regulated by CFIm-mediated splicing of MAT2A
- Department of Microbiology, UT Southwestern Medical Center, United States
- Department of Biochemistry, UT Southwestern Medical Center, United States
- Eugene McDermott Center for Human Growth and Development, UT Southwestern Medical Center, United States
- Department of Bioinformatics, UT Southwestern Medical Center, United States
- Department of Population and Data Sciences, UT Southwestern Medical Center, United States
Figures
Figure 1 with 1 supplement
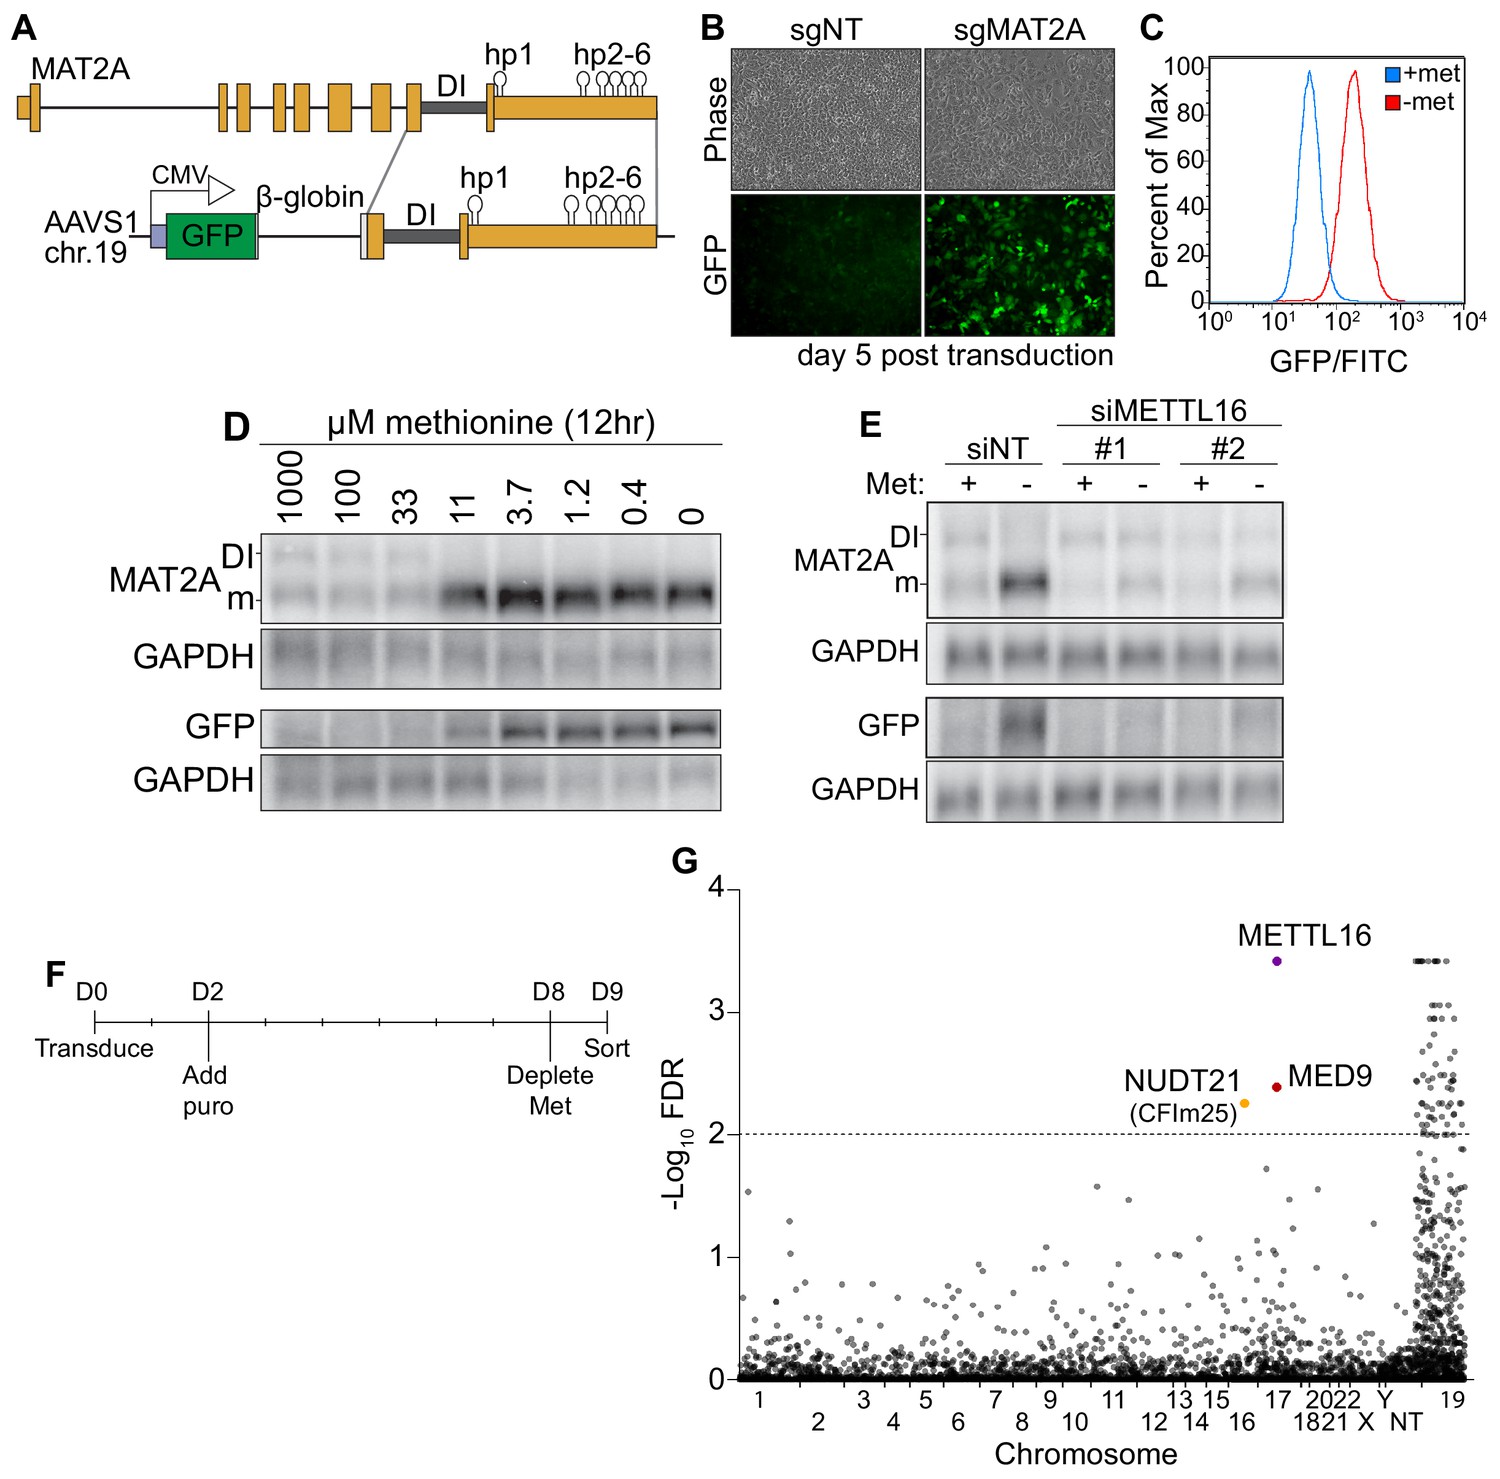
A CRISPR screen identifies CFIm25 as a candidate MAT2A splicing factor.
(A) Diagram of endogenous MAT2A gene (top) and GFP-MAT2A reporter (bottom). DI, detained intron; hp, hairpins; diagram is not to scale. (B) Representative images of reporter cells (phase) and GFP 5 days after transduction with lentivirus expressing Cas9 and sgRNA targeting MAT2A or non-targeting (sgNT) control. Cells were maintained in methionine-rich media. (C) Flow cytometry results monitoring GFP production in the reporter cell line after 24 hr conditioning in methionine-rich (blue) or methionine-free (red) media. Displayed as percent of maximum cell count for a given GFP intensity. (D) Northern blot analysis of GFP and endogenous MAT2A RNAs produced from the reporter line after 12 hr in media with the indicated methionine concentrations. In all figures, ‘DI’ and ‘m’ mark the MAT2A detained intron and mRNA isoforms, respectively. (E) Northern blot analysis of GFP and endogenous MAT2A RNA expression after four hours ± methionine depletion in the reporter line. Cells were treated with non-targeting control (siNT) or METTL16 (siMETTL16) siRNAs. (F) CRISPR screen timeline. (G) CRISPR screen results. CRISPR screen was performed in biological triplicate before analysis by MAGeCK. The -log10(FDR) of the analysis is plotted on the y-axis and genes are organized alphabetically by chromosome number on the x-axis. Non-targeting (NT) guides are also included. Genes above the dotted line have an FDR < 0.01.
Figure 1—figure supplement 1
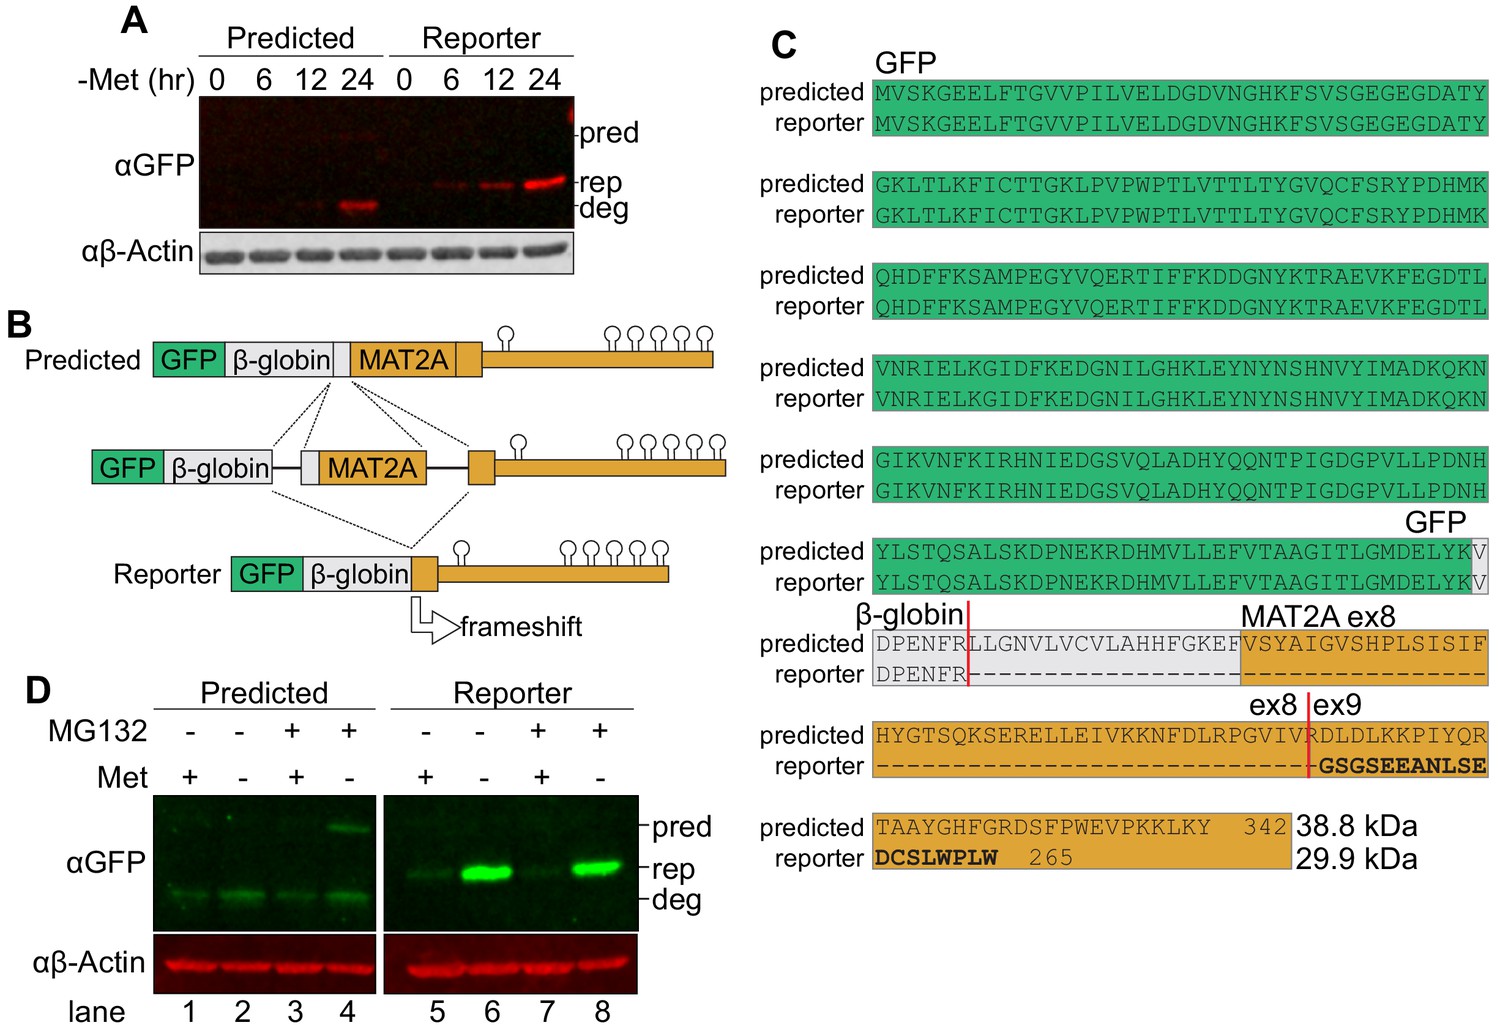
An alternatively spliced reporter provides a more robust GFP signal.
(A) Western analysis of GFP expression in two clonal reporter cell lines, the ‘Predicted’ line splices in the expected pattern and ‘Reporter’ line which we used in our CRISPR screen. The ‘Predicted’ cell line appeared to have two bands, one faint band at the predicted MW (pred) and a second band of higher motility which is possibly a degradation product (deg). The reporter cell line had a single band at the size corresponding to the MW predicted from the alternative splicing pattern (rep). Actin serves as a loading control. (B) Diagram of GFP reporter mRNA splicing. Splicing from the β-globin 5´ splice site to the MAT2A 3´ splice site in our SAM-responsive clonal cell line results in a frameshift encoding a smaller protein. The frameshift occurs within the last exon, and only extends the 3´ UTR by 63 nt, so it is unlikely to induce nonsense-mediated RNA decay. Diagram not to scale. (C) Sequence alignment of proteins produced from the predicted and observed splicing of the reporter cell line. Green, GFP. Gray, β-globin. Orange, MAT2A exon 8–9. Predicted splice junctions shown by vertical red lines. (D) Western analysis of GFP protein in a cell line with predicted splicing pattern or the reporter after 12 hr methionine depletion and 6 hr 50 μM MG132 treatment. Images cropped from the same blot at same exposure. pred, predicted GFP-fusion protein size from predicted splicing pattern. rep, GFP product produced from reporter cell line. deg, potential degradation product from predicted splicing pattern product.
Figure 2 with 2 supplements
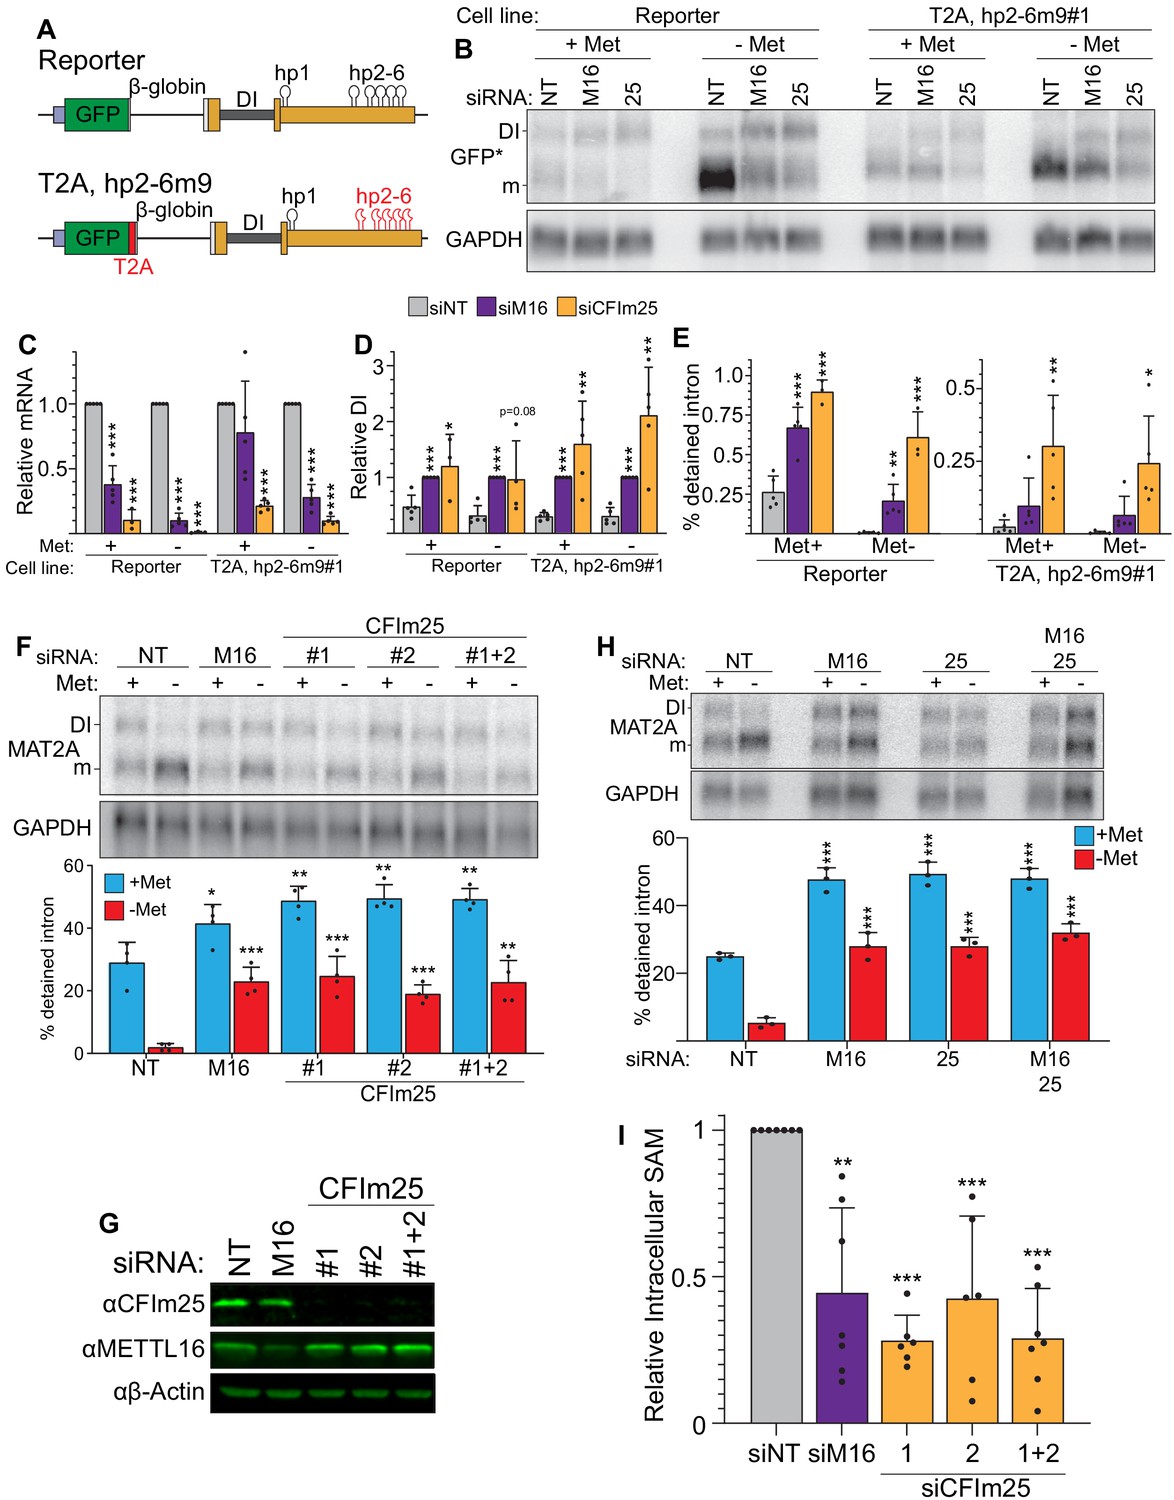
CFIm25 regulates MAT2A splicing and activity.
(A) Diagram of the original and hp2-6m9 mutant reporters. The latter reporter contains a T2A element (red) and nine point mutations (m9) in each of the hp2-6 (Pendleton et al., 2017). The modified reporter construct was inserted into the AAVS1 site of HCT116 cells and sorted to produce clonal cell lines. Diagram not to scale. (B) Northern analysis of GFP expression after knockdown with non-targeting (NT), METTL16 (M16), or CFIm25 siRNAs in the original and modified reporter cell lines. Cells were conditioned with methionine-rich or -free media for 4 hr before harvesting. To increase signal-to-noise compared to preceding blots (Figure 1), we used poly(A)-selected RNA and developed an improved GFP northern probe (GFP*). Overexposed versions of this blot are included to more easily visualize the signal from the DI isoforms (Figure 2—figure supplement 1A). (C and D) Quantification of northern analyses as shown in panel B. Values were first normalized to GAPDH and are shown relative to siNT for the mRNA (C) or to siM16 for the DI isoform (D). Statistical analysis was performed relative to the siNT for both mRNA and DI isoforms. n ≥ 3. (E) Quantification of the northern analysis in as in panel B expressed as percent detained intron. Statistical analysis was performed relative to the siNT. n ≥ 3. (F) Northern analysis of MAT2A expression in 293A-TOA cells upon CFIm25 or METTL16 knockdown. Two independent CFIm25 siRNAs were tested. Cells were conditioned in methionine-rich or methionine-free media for 4 hr. n = 4. (G) Western analysis of CFIm25 and METTL16 after the indicated knockdown in 293A-TOA cells. Actin serves as a loading control. n ≥ 3. (H) Northern analysis of MAT2A expression after individual or co-depletion of METTL16 and CFIm25. Knockdown proceeded for 4 days before conditioning cells in methionine-rich or methionine-free media for 4 hr. Quantified by percent detained intron. n = 3. (I) Intracellular SAM levels relative to non-targeting control after METTL16 or CFIm25 knockdown in 293A-TOA cells. Statistical analysis compared all knockdowns to non-targeting control. n ≥ 6. Unless otherwise noted, data are represented as mean ± SD and analyzed by a two-tailed, unpaired student’s t-test compared to matched control. Significance is annotated as not significant (ns), *p≤0.05, **p≤0.01, or ***p≤0.001.
Figure 2—figure supplement 1
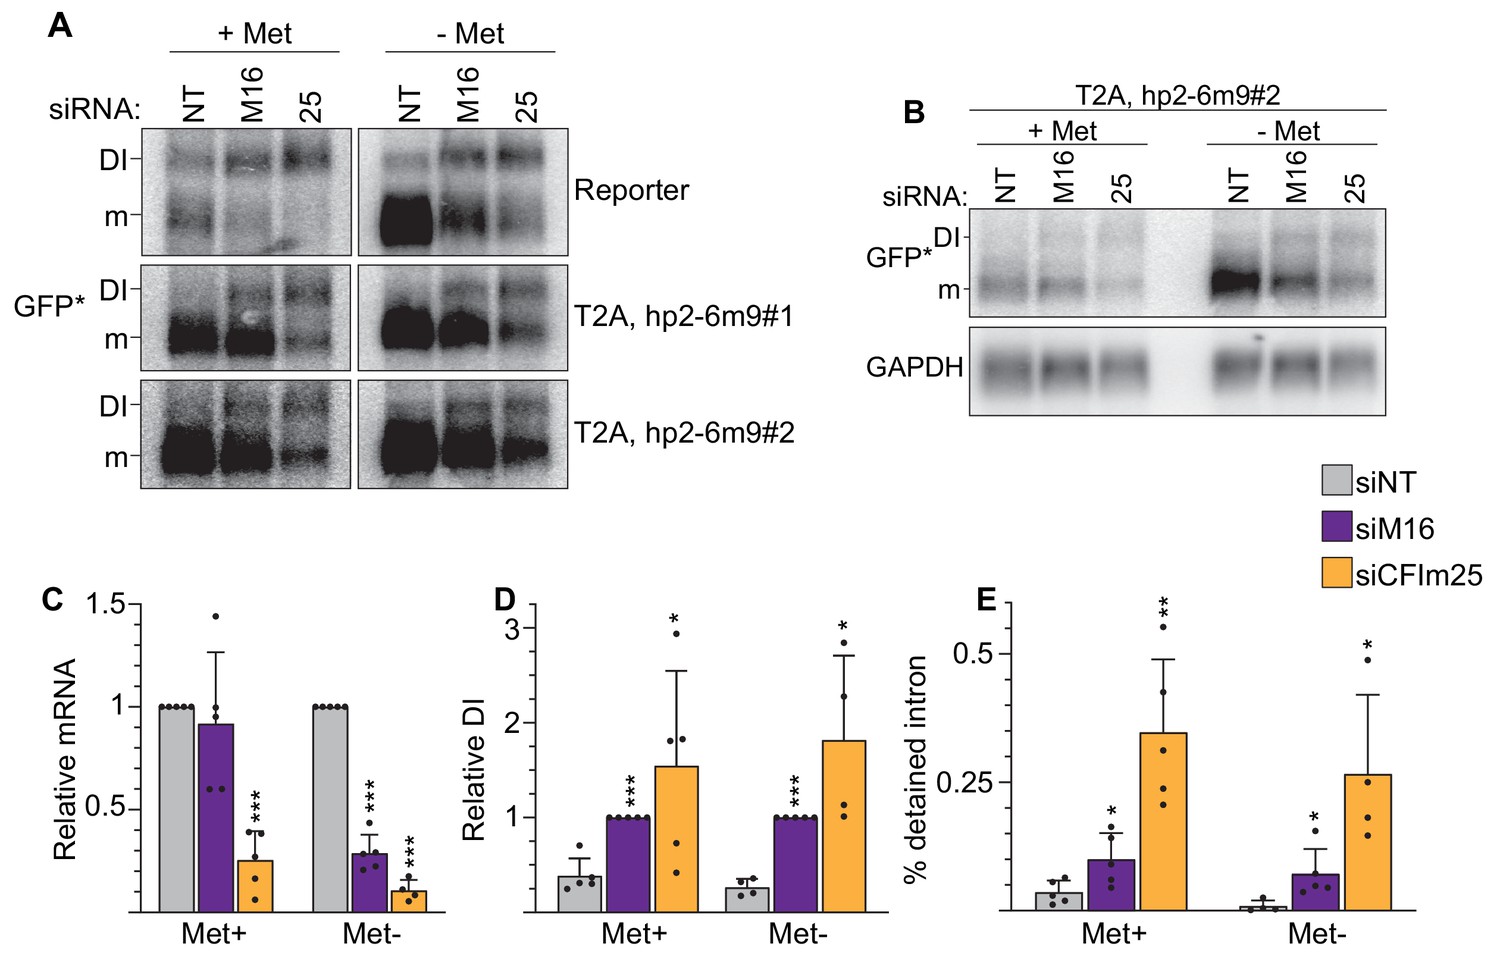
Validation of CFIm25 effects on reporter gene splicing.
Figure 2—figure supplement 2
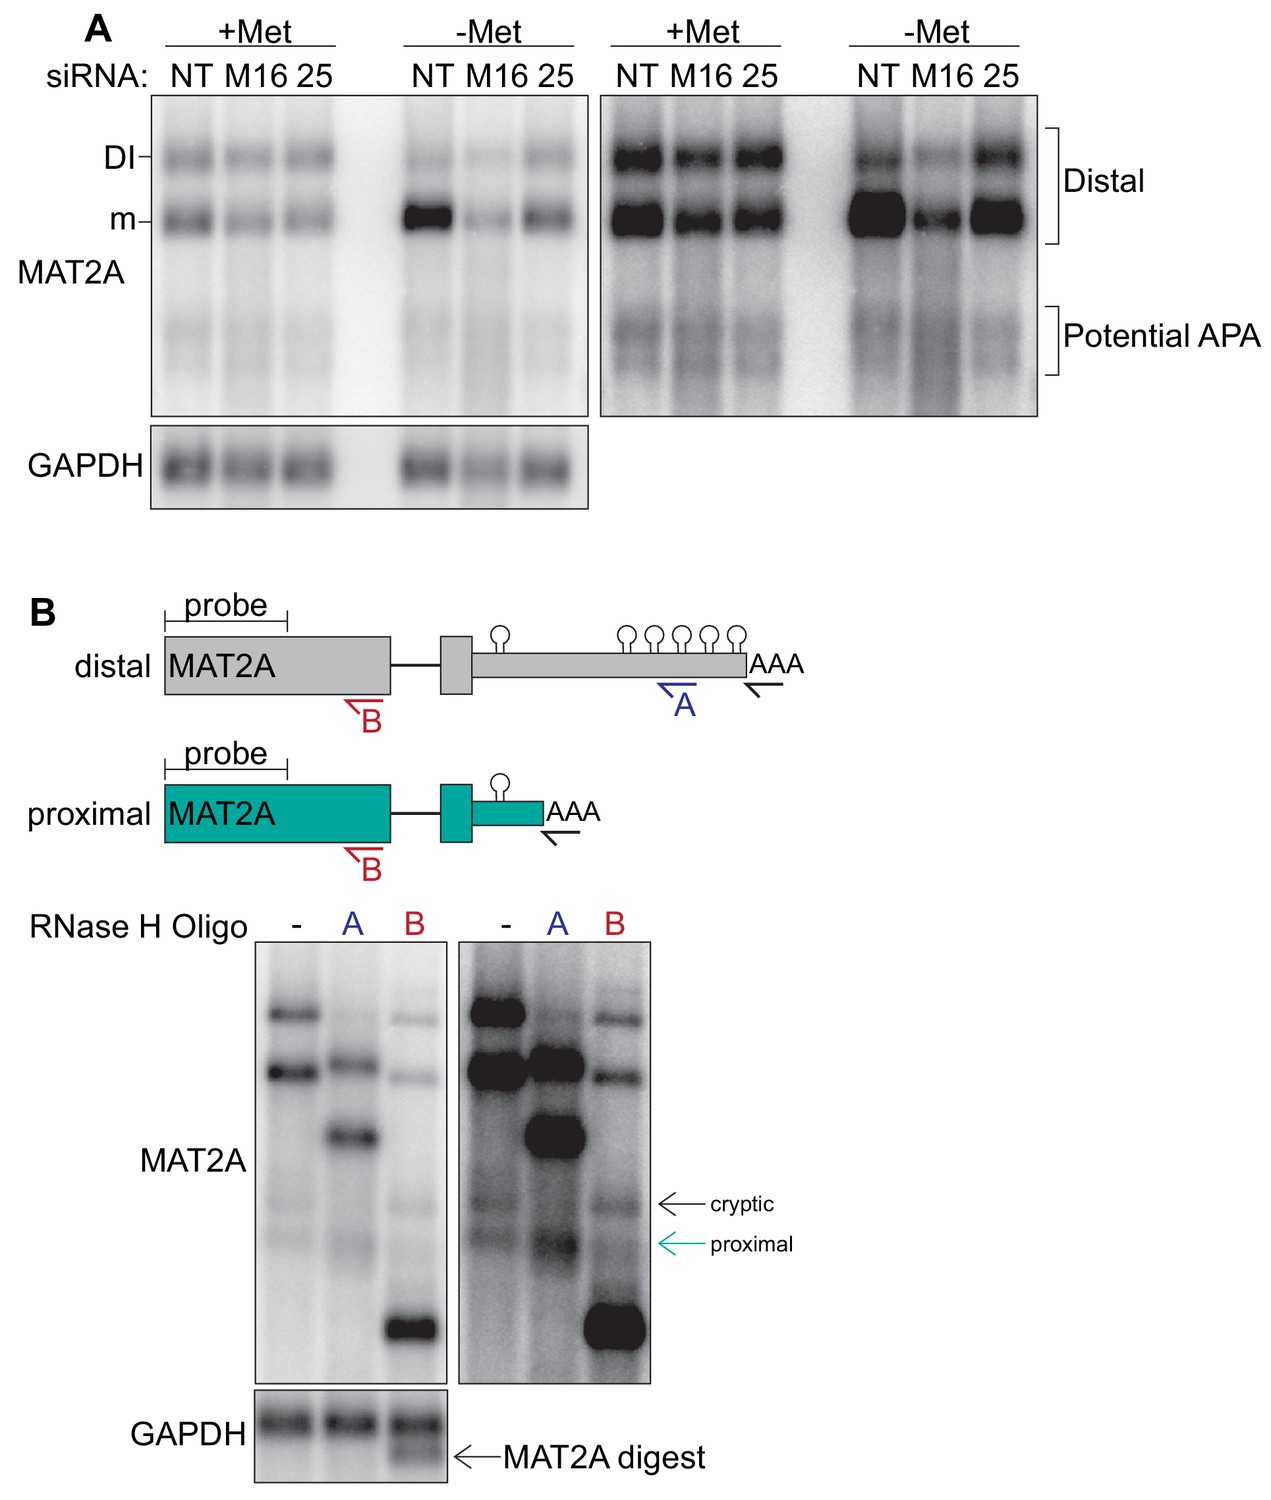
CFIm25, METTL16, and methionine levels do not regulate MAT2A APA in 293-ATOA cells.
(A) Poly(A) selected RNAs were used for northern analysis of MAT2A isoforms after knockdown with non-targeting (NT), METTL16 (M16), or CFIm25 (25) siRNAs. Prior to harvesting, cells were conditioned in methionine-rich or -free media for 4 hr. The blot on the right is overexposed image of the left. Distal refers to the distal poly(A) site used by the full-length MAT2A DI and mRNA isoforms. (B) RNase H mapping of MAT2A isoforms using poly(A) selected RNAs and detected by northern analysis. Top, diagrams including DNA oligonucleotide positions used to target RNase H; both predicted distal and proximal isoforms are shown (not to scale). All samples were treated with dT20 (black) to create sharper bands by removing poly(A) heterogeneity. Oligonucleotide A (blue) is in MAT2A 3´UTR downstream of the predicted proximal poly(A) site, so it should not digest the proximally terminated RNA. In contrast, oligonucleotide B (red) hybridizes immediately upstream of the MAT2A exon 7–8 junction, so it should cleave both proximal and distal transcripts. Bottom, orthern analysis of RNase H mapping; the blot on the right is an overexposed version. Since oligonucleotide B did not cleave the upper isoform, we labeled it ‘cryptic’ due to its unknown origin. However, the pattern of the band marked ‘proximal’ is consistent with usage of the proximal poly(A) site.
Figure 3 with 1 supplement

CFIm25’s roles in APA and SAM regulation are separable.
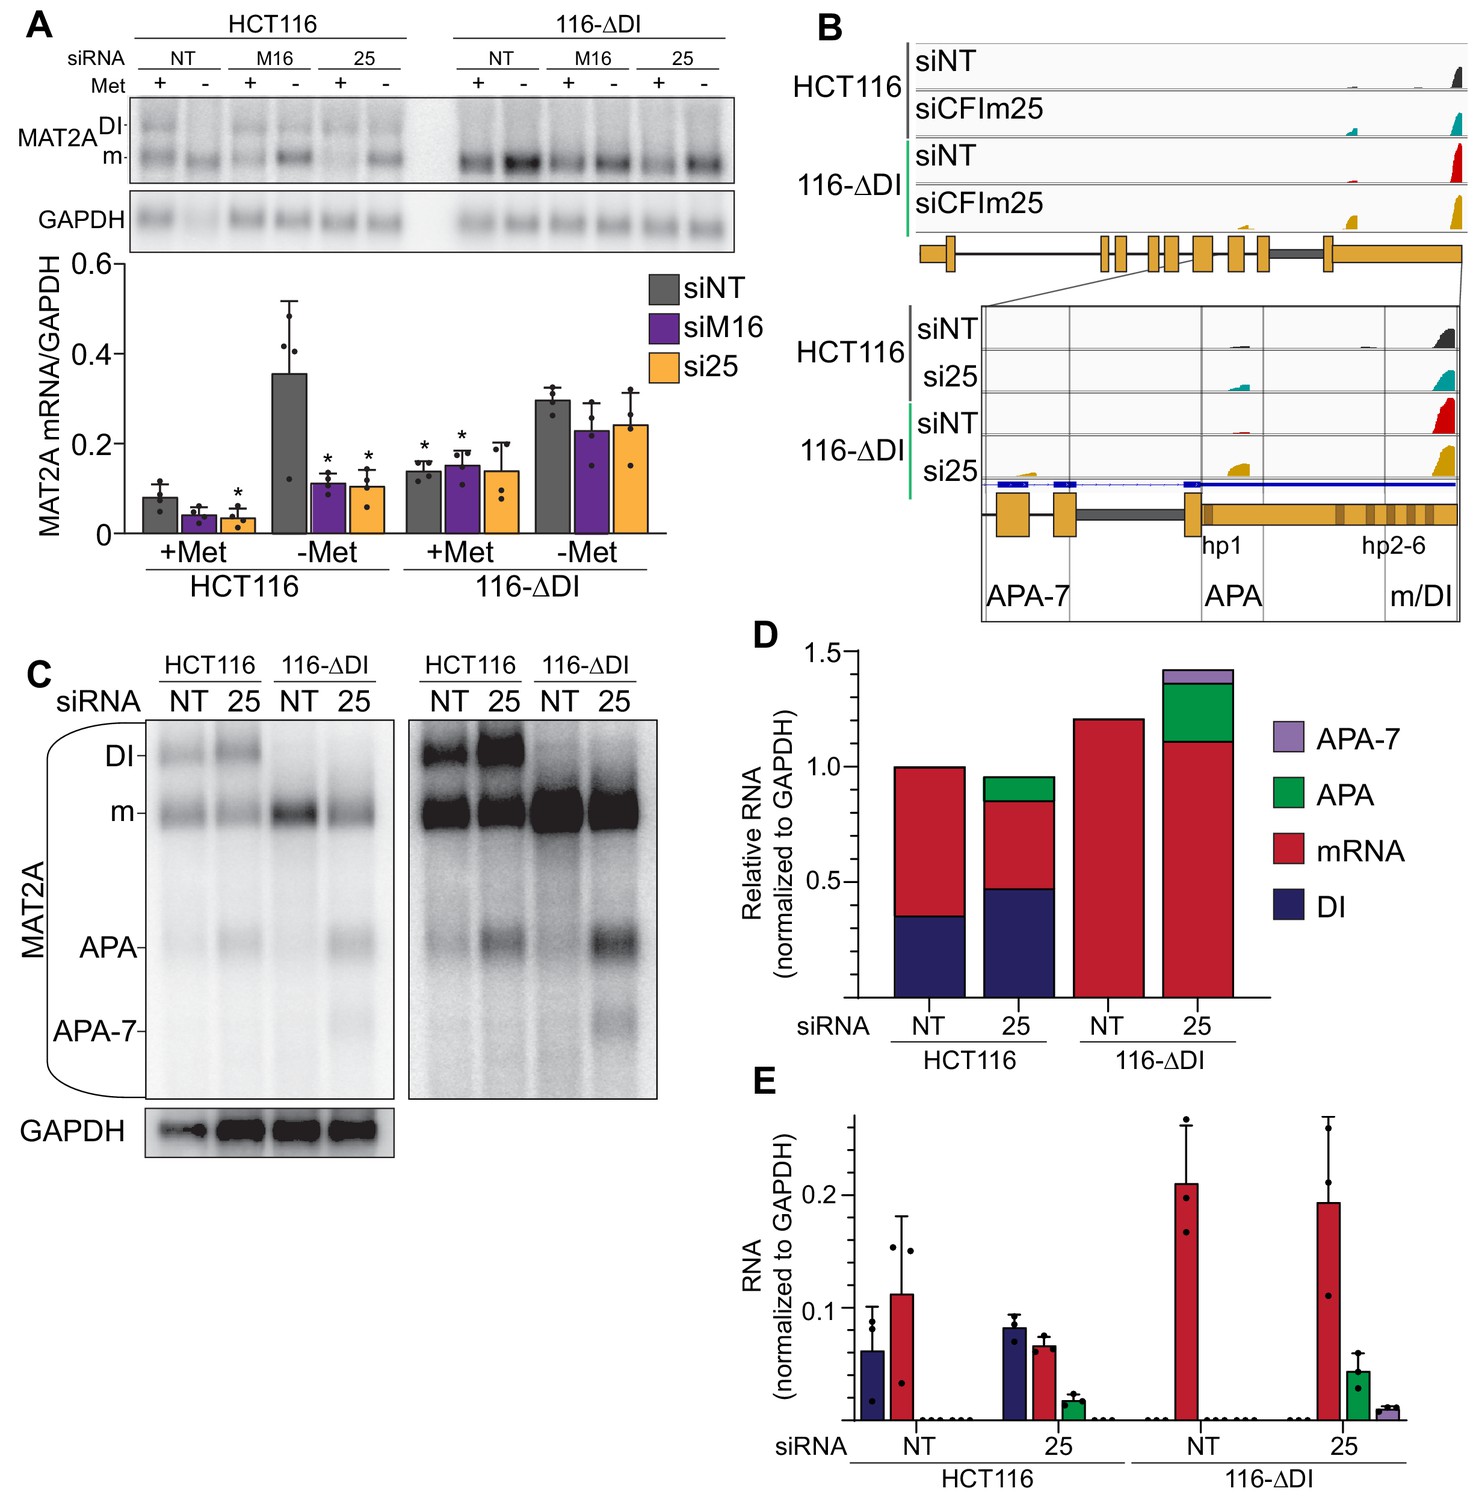
(A) Schematic of the HCT116 ΔDI (116-ΔDI) cell line. Endogenous MAT2A gene was cut with Cas9 and two sgRNAs (red lines) and repaired with an HR donor plasmid lacking the DI. However, one allele was the result of NHEJ. (B) Northern analysis and quantification of MAT2A expression in the HCT116 parental and 116-ΔDI cell lines after the stated methionine depletion times. Samples were normalized to GAPDH and values are relative to HCT116 at 0 hr. Data are mean ± SD; n = 3. Statistics compare 116-ΔDI cells to HCT116 parental line. (C) Intracellular SAM levels of HCT116 and 116-ΔDI cell lines after a 4-day knockdown with the indicated siRNAs. All values are relative to HCT116 parental non-targeting control. Two statistical comparisons are shown. Significance relative to the matched cell type non-targeting control is annotated with asterisks or NS. The p-values listed above the bars compare the two cell types within each knock-down condition. D-E. APA patterns in HCT116 parental and 116-ΔDI upon CFIm25 depletion. siCFIm25 vs siNT for HCT116 parental (D) and 116-ΔDI (E) plotted by percent distal usage (PDU). Each dot represents a gene with multiple poly(A) clusters, with statistically significant shortening (red), lengthening (blue), or both (dark gray) APA events. Light gray dots are not statistically changed between samples (NS). (F-G) Same as D-E, except HCT116 parental and 116-ΔDI cell lines were compared under siNon-targeting (F) and siCFIm25 (G) conditions. (H-J). Venn diagrams comparing genes with shortening (H), Lengthening (I), or complex APA (Both, J) under CFIm25 depletion for HCT116 (gray) and 116-ΔDI (green) cell lines. p-Values calculated using SuperExactTest (Wang et al., 2015).
Figure 3—figure supplement 1
MAT2A isoforms in HCT116 and 116-ΔDI.
(A) Northern blot analyses of MAT2A expression in HCT116 and 116-ΔDI cells upon knockdown of the indicated factor after 4 hr methionine depletion as indicated. Asterisks denote significance relative to HCT116 siNT sample under the same methionine conditioning. n = 4. (B) PAC-seq genome browser trace for MAT2A. The magnified region is from exon seven to the end of the 3´UTR. Black and blue, HCT116 siNT and siCFIm25, respectively. Red and yellow, 116-ΔDI siNT and siCFIm25, respectively. APA-7, alternative poly(A) site found near the beginning of intron 8. APA, proximal poly(A) site found between hp1 and 2. m/DI, distal poly(A) site used in prevalent mRNA and DI isoforms. One representative sequencing trace shown of three biological replicates. C-E. Representative northern blot with short and long exposures (C) and quantification (D, E) of MAT2A isoforms after CFIm25 knockdown and poly(A) selection in HCT116 and 116-ΔDI cell lines. Quantification shown as stacked (D) or individually with error bars (E). Blue, DI. Red, mRNA. Green, APA site found in the 3´UTR. Purple, APA-7, the APA site found within intron 7. n = 3.
Figure 4 with 1 supplement
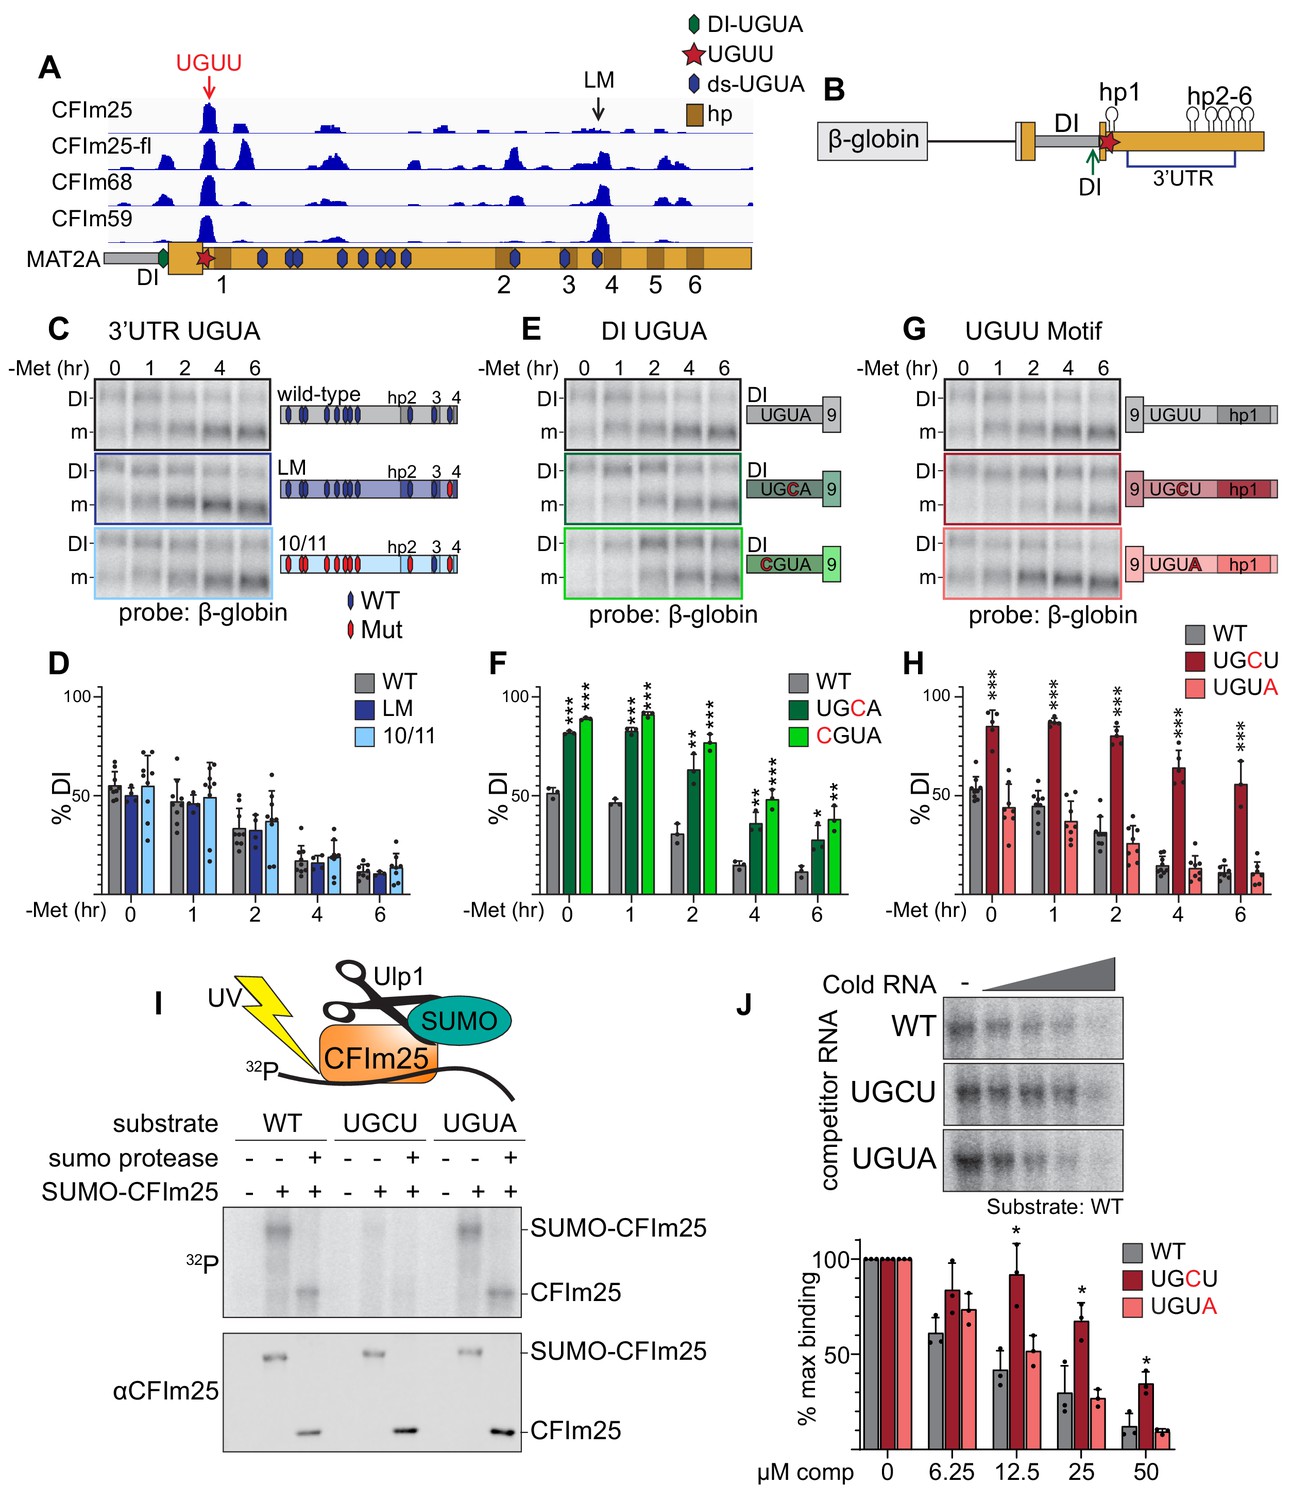
CFIm25 binds a non-canonical UGUU motif in MAT2A’s 3´UTR.
(A) IGV browser screen shot of CLIP-seq data of endogenous CFIm25, CFIm68, CFIm59, and flag-tagged CFIm25 (CFIm25-fl) to the MAT2A 3´UTR (Martin et al., 2012). Hexagons overlaid on the MAT2A schematic represent UGUA sites (blue, 3´UTR; green, DI UGUA). The UGUU-centered peak is denoted by a red star and red arrow. The last UGUA motif (LM) in the 3´UTR is denoted by a black arrow. MAT2A hairpins are denoted by brown boxes labeled 1–6. (B) Schematic of the MAT2A β-globin reporter. The reporter consists of a β-globin gene excluding the first intron but maintaining intron two fused to MAT2A exon eight through the end of the 3´UTR. Point mutations were categorized by potential binding site location. Blue bracket denoted 3´UTR includes the 11 downstream UGUA motifs (C and D). Green arrow denoted DI, the detained intron UGUA (E and F). Red star, the CLIP peak containing a UGUU (G and H). (C and D) Representative northern blot and quantification of β-globin expression using reporters mutating UGUA motifs in the 3´UTR. In the schematics, hexagons represent UGUA elements, blue hexagons are wild-type, red are mutant. Gray, wild-type reporter (wt). Dark blue, mutation of the LM only (LM). Light blue, 10 of 11 dsUGUA motifs mutated (10/11). n ≥ 3. Note that the representative northern blot data in panels 4C, 4E, and 4G are from the same blot at the same exposure. Wild-type samples were run only once on that gel but are duplicated in the figure for easy formatting and comparison within each group. (E and F) Representative northern blot and quantification of β-globin expression using reporters mutating UGUA motif in the MAT2A DI. Gray, wild-type reporter (wt). Green, DI mutants UGCU (dark green) and CGUA (light green). n ≥ 3. (G and H) Representative northern blot and quantification of β-globin expression using reporters mutating the UGUU motif immediately upstream of hp1. The UGUU was mutated to UGCU or to the canonical CFIm binding motif (UGUA). Gray, wild-type reporter (wt). Dark red, UGCU. Pink, UGUA. n ≥ 3. (I) Representative label transfer assay for the CFIm25 UGUU-binding motif. SUMO-CFIm25 was incubated with radiolabeled 21-nt wild-type substrate centered on the UGUU in the natural sequence; two point-mutants, UGCU and UGUA were also tested. In vitro binding was performed ±SUMO-CFIm25 and ±Upl1 SUMO protease as indicated. The top panel is a label transfer (phosphorimager), and the bottom is a western blot showing SUMO-CFIm25 loading in each lane. (J) Competition label transfer assay. SUMO-CFIm25 was incubated with radiolabeled wild-type substrate (UGUU) plus increasing concentrations of cold wild-type or mutant substrate (UGCU, UGUA). Concentrations of competitor RNA increase from left to right (0, 6.25, 12.5, 25, 50 μM). Gray, WT competitor. Red, UGCU competitor. Pink, UGUA competitor. n = 3.
Figure 4—figure supplement 1
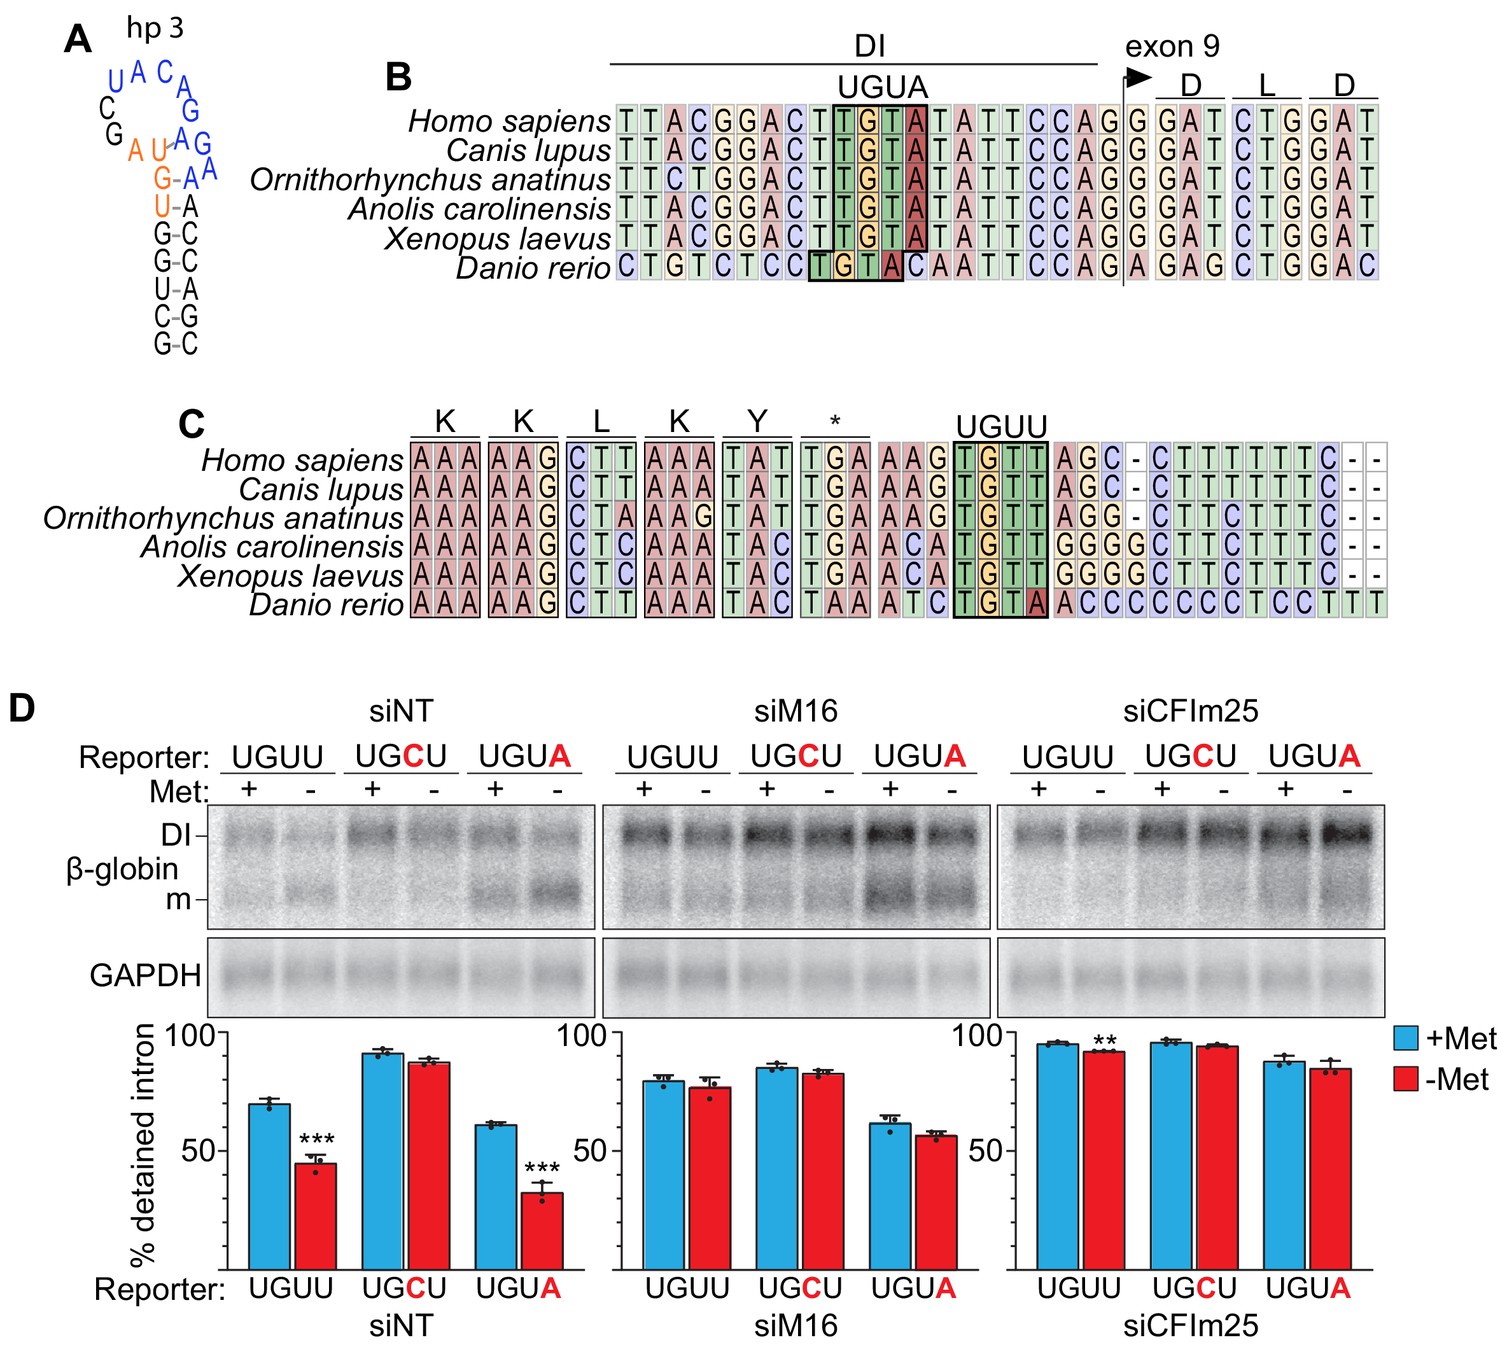
MAT2A contains conserved CFIm25-binding sites in the detained intron and 3´UTR.
(A) MAT2A hp3 diagram modeled on crystallographic data of hairpin 1 (Doxtader et al., 2018). A UGUA site (orange) is embedded in critical structural nucleotides for hairpin folding and recognition by METTL16. Blue, METTL16-binding motif. The upstream GU is also conserved in METTL16 binding sites to generate the appropriate RNA structure, but only hp3 has the GU within a UGUA motif. (B) Vertebrate sequence alignment of MAT2A surrounding the predicted UGUA-binding motif in the detained intron (boxed). (C) Vertebrate sequence alignment of MAT2A surrounding the predicted UGUU-binding motif (boxed). (D) Northern analysis of reporter construct expression upon METTL16 or CFIm25 depletion. 293A-TOA cells were treated with non-targeting (siNT), METTL16 (siM16), or CFIm25 (siCFIm25) siRNAs for four days. Approximately 24 hr before harvest, cells were transfected with reporter constructs containing the wild-type UGUU, UGCU, or the UGUA mutants (Figure 4). Cells were conditioned for 4 hr in methionine-rich or -free media before analysis by northern blotting. Data are quantified by percent detained intron. n = 3. These experiments were performed in 293-ATOA cells which give a stronger baseline intron detention than HEK293 cells used in Figure 4. Thus, it is difficult to conclude whether there is any additive effect of CFIm25 or METTL16 knockdown on intron detention in the UGCU mutant. Also, although mutation of the UGUU to UGUA in the HEK293 cells did not more effectively induce splicing, there may be a slight baseline increase in splicing in these cells (siNT), consistent with enhanced binding of CFIm25 to its canonical binding site. However, more experimentation is required to make strong conclusions regarding any distinctions between UGUA or UGUU at this position.
Figure 5 with 1 supplement
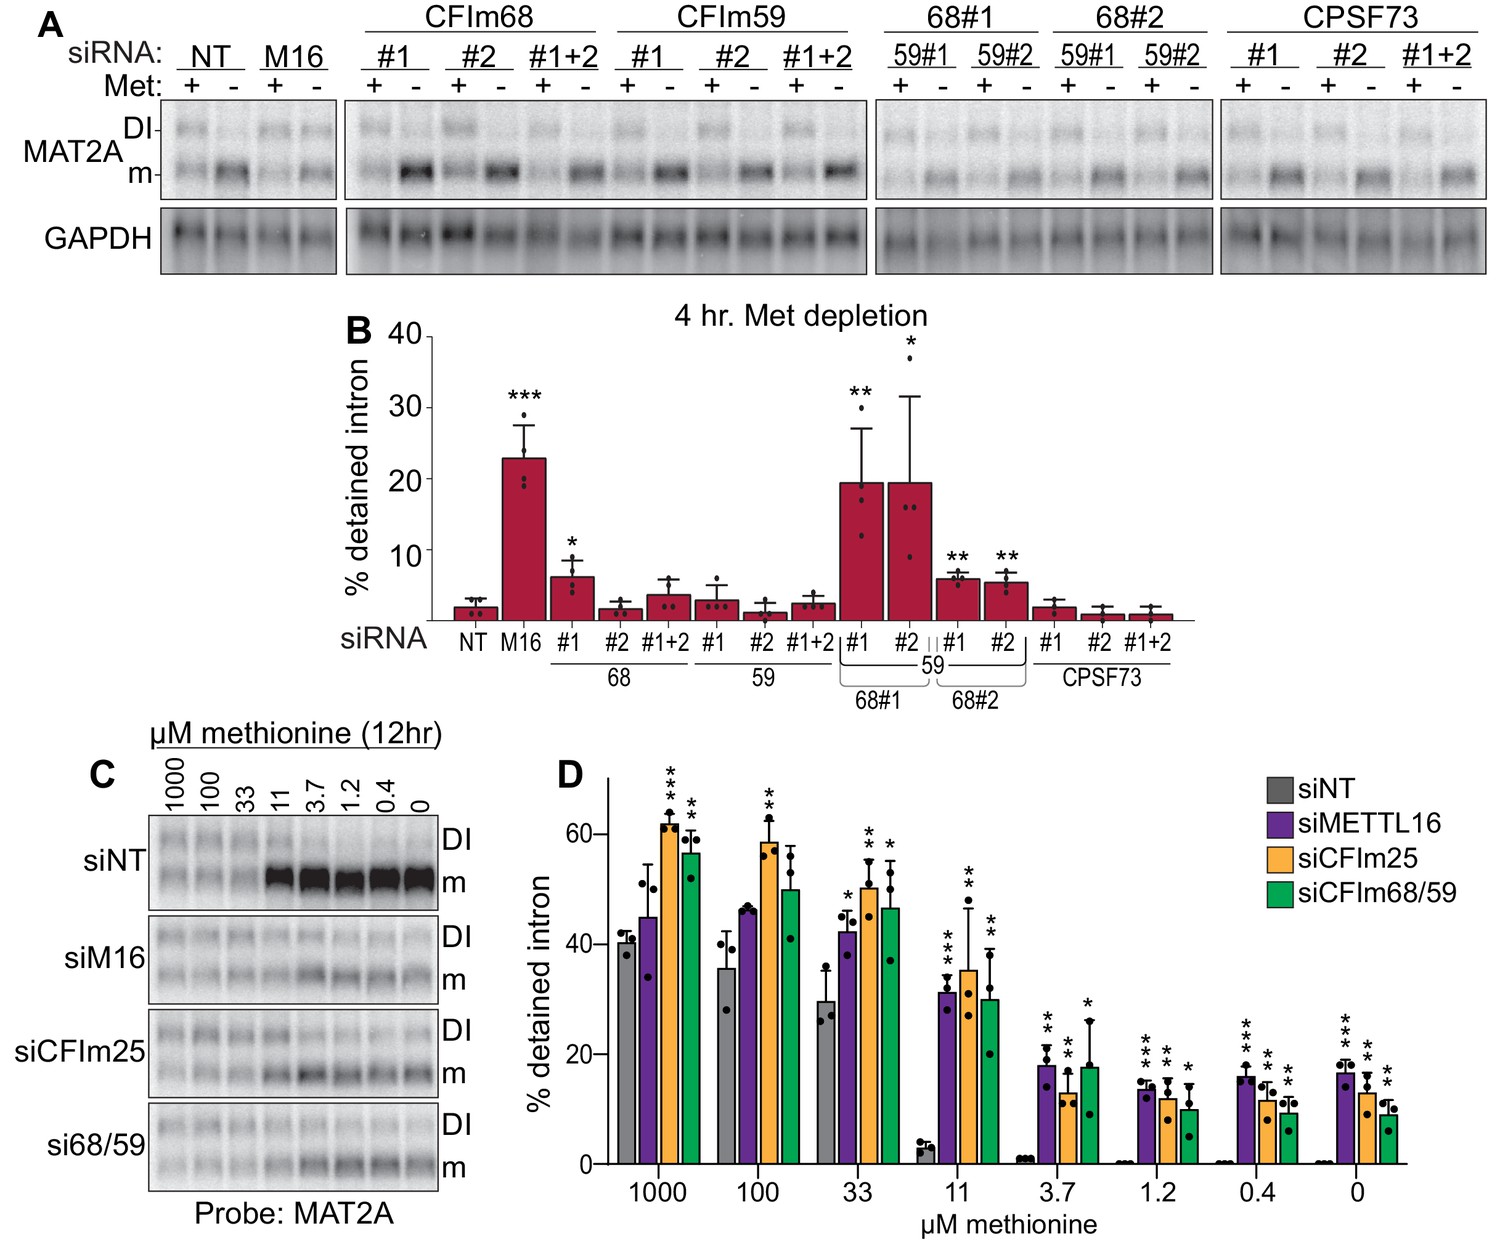
Co-depletion of CFIm68 and CFIm59 reduces induction of splicing of the MAT2A DI.
(A-B) Representative northern blot and quantification of MAT2A intron detention after CFIm68 and CFIm59 depletion. Two independent siRNAs for each factor were used (labeled #1 and #2). 293A-TOA cells were conditioned with methionine-rich or methionine-free media for 4 hr prior to harvesting. n ≥ 3. (C-D) Representative northern blot and quantification of MAT2A expression after methionine titration after depletion of the indicated factors. 293A-TOA cells were conditioned with media containing the specified methionine concentration for 12 hr prior to harvesting. Non-targeting control, siNT, gray. METTL16, siM16, purple. siCFIm25, orange. siCFIm68 and siCFIm59 co-depletion, green. n = 3.
Figure 5—figure supplement 1
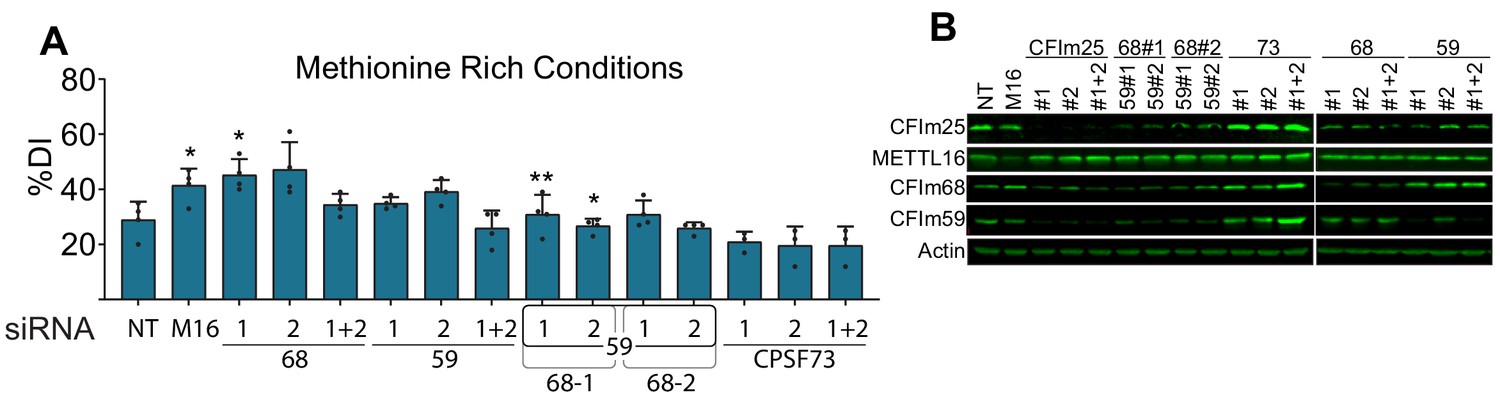
Additional controls for the CFIm complex knockdown experiments.
(A) Quantification of MAT2A intron detention after CFIm68 and CFIm59 depletion in methionine-rich conditions. Two independent siRNAs for each factor were used (labeled #1 and #2). CPSF73 knockdown serves as a negative control. Matched representative northern blot and methionine-depleted quantification in 5A-B. n ≥ 3. (B) Western analysis of protein expression after knocking down the indicated factors individually or in combination. Same blot as Figure 2C but including additional knock-down conditions.
Figure 6 with 1 supplement
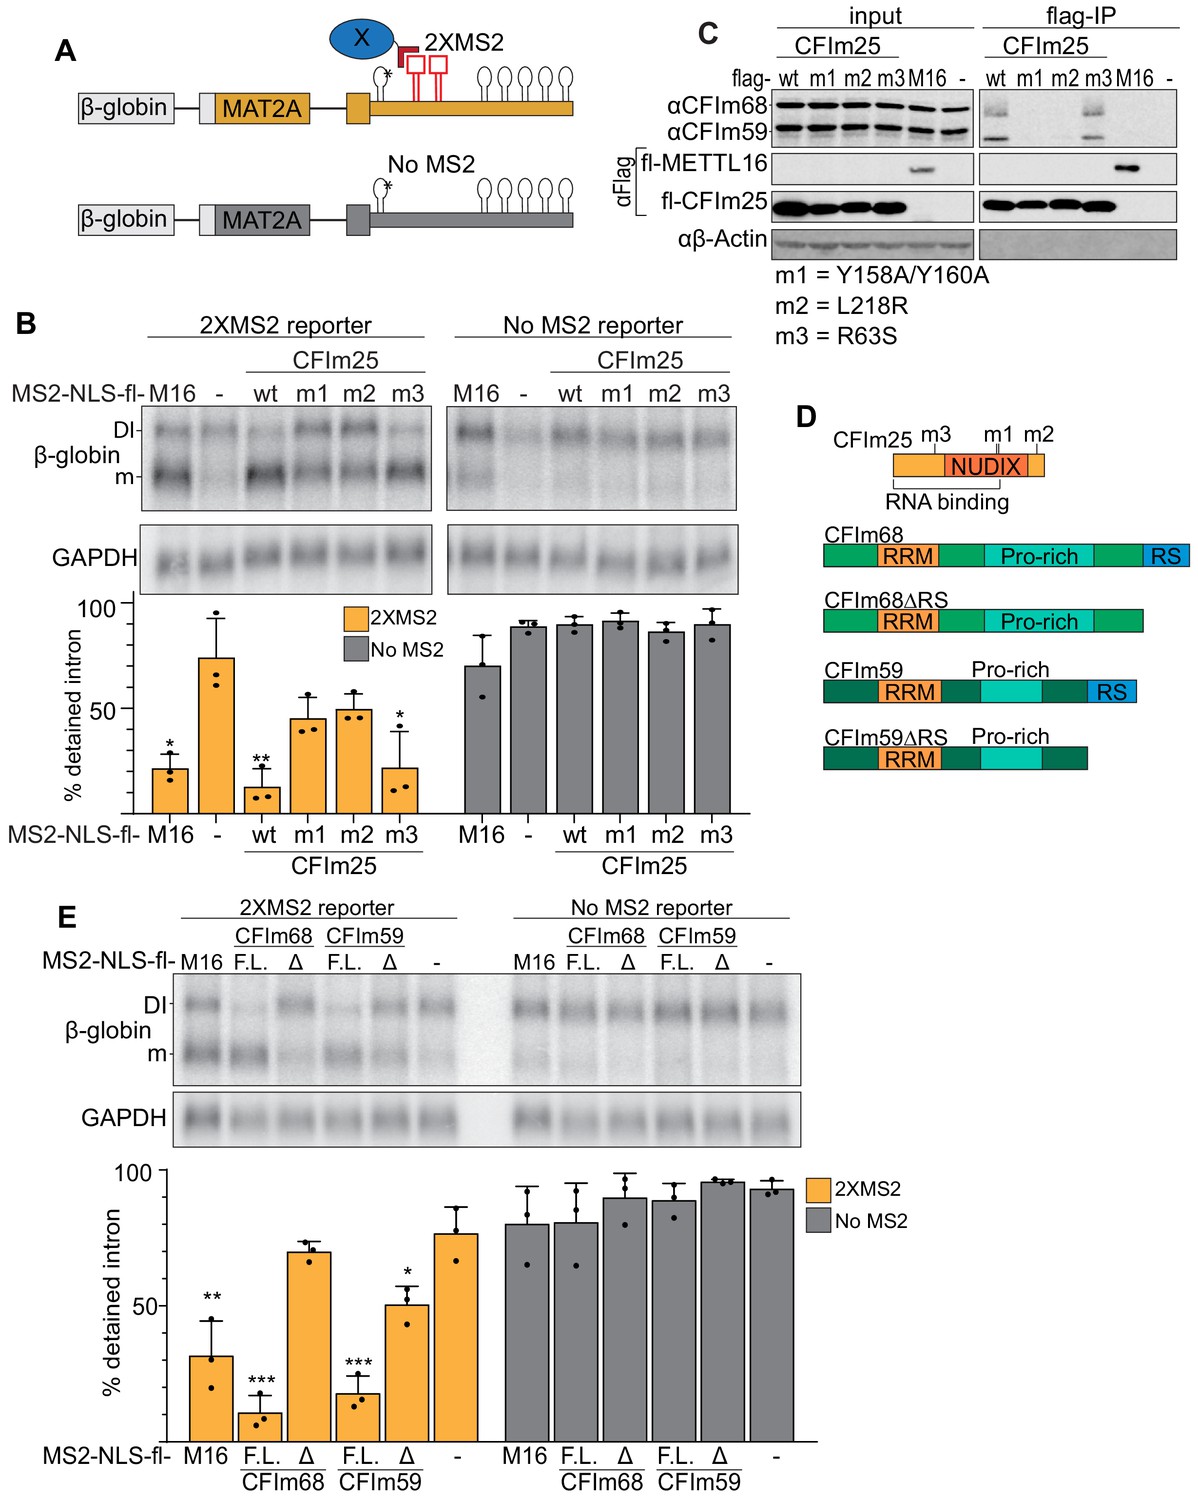
Binding of the CFIm complex is sufficient to promote MAT2A splicing.
(A) Diagram of the tethering assay. The 2XMS2 β-globin reporter consists of MAT2A exon 8, the detained intron, exon 9, and the full-length 3´UTR with two bacteriophage MS2-coat protein binding sites inserted 3´ of A4G mutant hp1 (asterisk). A matched reporter lacking the MS2 site (‘No MS2’) is used to measure background. All MS2 fusion proteins have an N-terminal MS2 coat protein, an SV40 nuclear localization signal, and flag tag (MS2-NLS-fl). The MS2-NLS-fl alone is expressed as negative control. Diagram not to scale. (B) Northern analysis of β-globin reporter RNA after tethering CFIm25 variants. MS2-NLS-fl fusions to METTL16 (M16), CFIm25 variants (wt, m1, m2, m3), or MS2-NLS-fl alone (-) and were expressed with the indicated reporters. Statistical analysis is relative to matched MS2-vector control. Orange, 2XMS2 reporter. Gray, No MS2 reporter. n = 3. (C) Coimmunoprecipitation of CFIm68 and CFIm59 with flag-CFIm25. Flag-tagged wild-type CFIm25 (wt) or mutants (m1, m2, m3), flag-tagged METTL16 (M16), or flag-vector (-) were expressed in HEK293 cells before immunoprecipitation with anti-flag beads. The immunoprecipitates were then probed for endogenous CFIm68 and CFIm59, flag, or β-actin. Input is 10% of the lysate volume applied to flag beads. n = 3. (D) Diagrams of CFIm25, CFIm68, CFIm68ΔRS, CFIm59, and CFIm59ΔRS proteins; diagrams to scale. (E) Northern analysis of β-globin reporter RNA after tethering CFIm68 or CFIm59. MS2-NLS-flag-tagged METTL16, CFIm68, CFIm68ΔRS, CFIm59, CFIm59ΔRS, or vector (-) were co-transfected with the 2XMS2 β-globin reporter or no MS2 reporter control. Statistical analysis is relative to matched MS2-vector control. F.L., full length; Δ, ΔRS domain. n = 3.
Figure 6—figure supplement 1
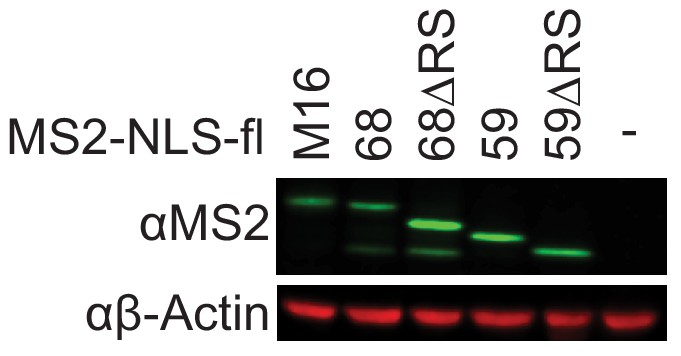
Expression of full-length and RS-deletion MS2-NLS-fl CFIm68 and CFIm59 proteins.
Western analysis of protein expression for MS2-NLS-fl tagged METTL16, CFIm68 and CFIm59 using anti-MS2 antibodies. Expression of the 17 kDa MS2-NLS-fl has been confirmed, but it is too small to be detected under these conditions.
Figure 7 with 1 supplement
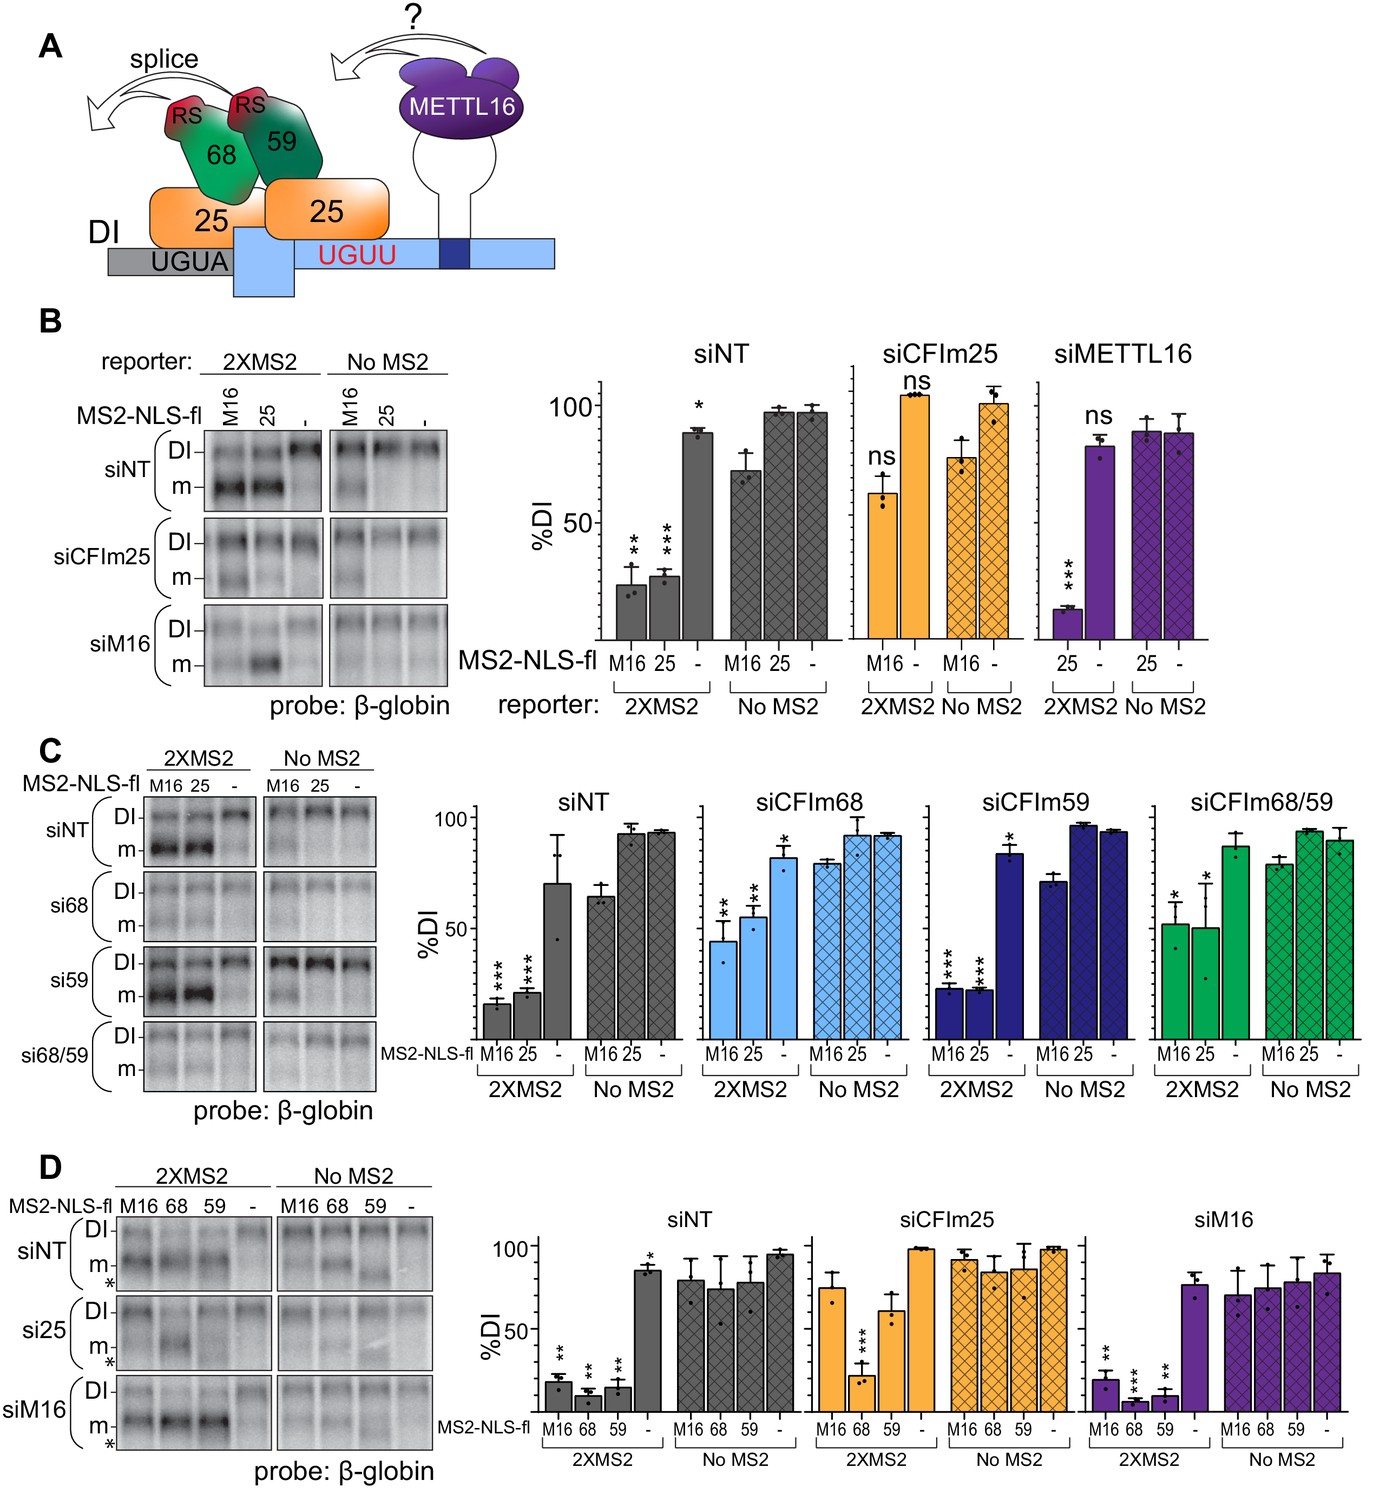
CFIm is the downstream splicing effector of METTL16.
(A) Working model for CFIm-induced MAT2A splicing. The CFIm complex binds to a non-canonical UGUU motif in the MAT2A 3´UTR and UGUA in the detained intron. The model depicts a single complex binding both sites through CFIm25 dimers, but our data are equally consistent with independent binding of CFIm complexes to each site (see Discussion). In either case, we propose CFIm binding promotes MAT2A splicing by proximity of the RS domains in CFIm68 or CFIm59. How this is integrated with METTL16 binding remains unknown. For simplicity, this model focuses solely on splicing activity and does not depict the contributions of METTL16 and hp2-6 in MAT2A RNA stability. (B) Northern analysis of β-globin reporter RNA after knockdown of the indicated factor and tethering of MS2-NLS-fl tagged METTL16 (M16), CFIm25 RNA binding mutant (m3, 25), or MS2-NLS-fl vector (-). Left, representative northern blot. Right, quantification by percent detained intron for non-targeting siRNA (siNT, gray), or siRNAs targeting CFIm25 (si25, orange) or METTL16 (siM16, purple). n = 3. (C) Same as (B). Non-targeting siRNA (siNT, gray), siCFIm68 (si68, light blue), siCFIm59 (si59, dark blue), and siCFIm68/59 co-depletion (si68/59, green). n = 3. (D) Same as (B) except tethering of MS2-NLS-fl-METTL16 (M16), -CFIm68 (68), -CFIm59 (59), or MS2-NLS-fl vector (-) to the MS2 reporter constructs in cells depleted of METTL16 or CFIm25. Overexpression of CFIm59 caused a band of unknown identity to appear (asterisk). The band was cell-type specific: it did not appear in HEK293 cells (Figure 6E), but it does in 293A-TOA cells used here. Non-targeting siRNA (siNT, gray), siCFIm25 (si25, orange), and siMETTL16 (siM16, purple). n = 3. Statistical analyses in (A, B, C, D) compare 2XMS2 reporter to matched, no-MS2 reporter.
Figure 7—figure supplement 1
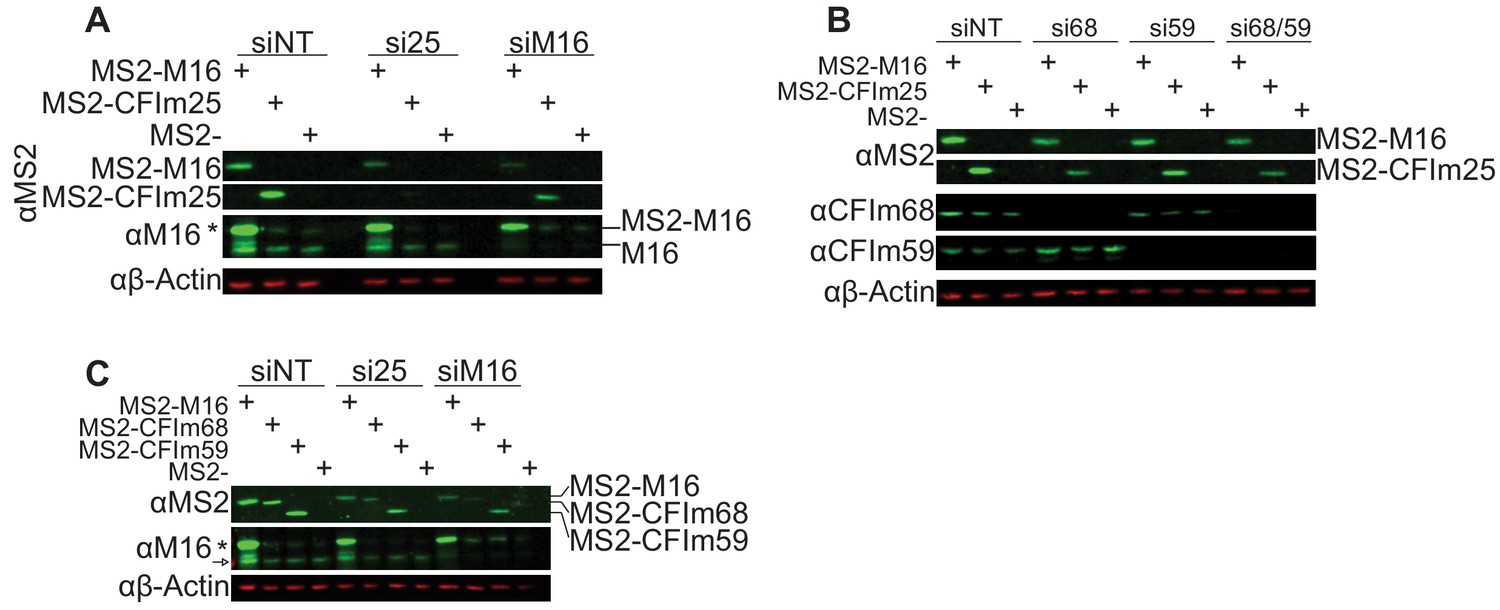
Expression of MS2-NLS-fl proteins after depletion of METTL16 or CFIm components.
(A) Western analysis of MS2-NLS-fl-tagged METTL16 and CFIm25 RNA binding mutant after knocking down the indicated protein. The METTL16 construct is siRNA-resistant to siM16, while the CFIm25 construct is not resistant to siCFIm25. Asterisk denotes MS2-NLS-fl-tagged METTL16 detected by METTL16 antibody. Related to Figure 7B. (B) Western analysis of MS2-NLS-fl-tagged METTL16 and CFIm25 RNA binding mutant after CFIm68/59 depletion. Related to Figure 7C. (C) Western analysis of MS2-NLS-fl-tagged METTL16, CFIm68, and CFIm59 after METTL16 or CFIm25 depletion. Asterisk denotes MS2-NLS-fl-tagged METTL16 detected by METTL16 antibody. Arrow denotes endogenous METTL16. Related to Figure 7D. In some cases, the knockdown of these essential factors lowers the expression of the MS2 transgenes (A, B, C). However, it is important to note that the reduced levels of MS2-CFIm25 observed upon METTL16 knockdown potently drive splicing (Figure 7B, purple). Conversely, the levels of MS2-NLS-fl-METTL16 observed upon CFIm25 knockdown is reduced, but these levels are the same to those observed upon METTL16 knockdown and they remain well above the endogenous levels (C). In this case, these levels of expression also are sufficient to drive splicing (Figure 7C, purple). Therefore, we conclude that the changes in transgene expression are not responsible for the observed changes in β-globin-MAT2A reporter splicing.
Tables
Key resources table
| Reagent type (species) or resource | Designation | Source or reference | Identifiers | Additional information |
|---|---|---|---|---|
| Strain, strain background (E. coli) | Bacterial: ElectroMAX Stbl4 Competent Cells | Thermo Fisher | Cat#: 11635018 | Electrocompetent Cells |
| Strain, strain background (E. coli) | Bacterial: Rosetta (DE3) cells | EMD Millipore | Cat#: 70954 | For production of SUMO-CFIm25 |
| Cell line (H. sapiens) | HEK293 | Dr. Joan A. Steitz (Yale University) | Conrad and Steitz, 2005 | |
| Cell line (H. sapiens) | HEK293T | Dr. Joshua Mendell | UT Southwestern Medical Center | |
| Cell line (H. sapiens) | 293A-TOA | Dr. Nicholas K. Conrad | UT Southwestern Medical Center (Sahin et al., 2010) | |
| Cell line (H. sapiens) | HCT116 | ATCC | CCL-247 | |
| Cell line (H. sapiens) | HCT116-GFP-β-MAT8-3´ | This paper | ‘Reporter’ | Maintained by Nicholas K. Conrad lab |
| Cell line (H. sapiens) | HCT116-ΔDetainedIntron (116-ΔDI) | This paper | ‘116-ΔDI’ | Maintained by Nicholas K. Conrad lab |
| Cell line (H. sapiens) | HCT116-GFP-T2A-β-MAT8-3´-hp2-6m9#1 | This paper | ‘T2A, hp2-6m9#1’ | Maintained by Nicholas K. Conrad lab |
| Cell line (H. sapiens) | HCT116-GFP-T2A-β-MAT8-3´-hp2-6m9#2 | This paper | ‘T2A, hp2-6m9#2’ | Maintained by Nicholas K. Conrad lab |
| Antibody | Rabbit polyclonal anti-GFP | Abcam | Cat#: ab6556; RRID:AB_305564 | (1:2000) |
| Antibody | Rabbit polyclonal anti-MAT2A | Novus | Cat#: NB110-94158; RRID:AB_1237164 | (1:2000) |
| Antibody | Mous monoclonal anti-β-actin | Abcam | Cat# ab6276; RRID:AB_2223210 | (1:5000) |
| Antibody | Rabbit polyclonal anti-METTL16 | Bethyl | Cat# A304-192A; RRID:AB_2620389 | (1:5000) |
| Antibody | Rabbit monoclonal anti-CFIm25 | Invitrogen | Cat#: 702871; RRID:AB_2723420 | (1:2000) |
| Antibody | Rabbit polyclonal anti-CFIm59 | Bethyl | Cat# A301-360A; RRID:AB_937864 | (1:2000) |
| Antibody | Rabbit polyclonal anti-CFIm68 | Bethyl | Cat#: A301-358A; RRID:AB_937785 | (1:2000) |
| Antibody | Rabbit polyclonal anti-flag | Sigma | Cat#: F7425; RRID:AB_439687 | (1:5000) |
| Antibody | Mouse monoclonal anti-Bacteriophage MS2 Coat Protein | Kerafast | Cat#: ED0005 | (1:2000) |
| Antibody | Mouse monoclonal anti-flag | Sigma | Cat#: F3165; RRID:AB_259529 | (1:2000) |
| Antibody | Goat anti-mouse | IRDye | Cat#:926–68020; RRID:AB_10706161 | (1:10,000) |
| Antibody | Goat anti-mouse | IRDye | Cat#: 926–32210; RRID:AB_621842 | (1:10,000) |
| Antibody | Goat anti-rabbit | IRDye | Cat#: 926–32211; RRID:AB_621843 | (1:10,000) |
| Recombinant DNA reagent | Plasmid: pcDNA-flag | Sahin et al., 2010 | N/A | |
| Recombinant DNA reagent | Plasmid: pcMS2-NLS-flag | Sahin et al., 2010 | N/A | |
| Recombinant DNA reagent | Plasmid: β-MAT-WT | Pendleton et al., 2017 | ‘WT’ | |
| Recombinant DNA reagent | Plasmid: β-MAT-preHP1-UGCU | This paper | ‘UGCU’ | Contains UGUU upstream of hp1 to UGCU mutation in β-MAT-WT backbone. See details in‘Plasmids’ section of‘Materials and Methods’ |
| Recombinant DNA reagent | Plasmid: β-MAT- preHP1-UGUA | This paper | ‘UGUA’ | Contains UGUU upstream of hp1 to UGUA mutation in β-MAT-WT backbone. See details in‘Plasmids’ section of‘Materials and Methods’ |
| Recombinant DNA reagent | Plasmid: β-MAT-3´UTR-Last-Motif-UGCA | This paper | ‘LM’ | Contains UGUA LM 3'UTR to UGCA mutation in β-MAT-WT backbone. See details in ‘Plasmids’ section of ‘Materials and Methods’ |
| Recombinant DNA reagent | Plasmid: β-MAT-3´UTR-10/11 | This paper | ‘10/11’ | Contains point mutations in 10/11 UGUA motifs of 3'UTR in β-MAT-WT backbone. See details in‘Plasmids’ section of‘Materials and Methods’ |
| Recombinant DNA reagent | Plasmid: β-MAT-DI-UGCA | This paper (Materials and Methods) | ‘UGCA’ | Contains detained intron UGUA to UGCA mutation in β-MAT-WT backbone. See details in‘Plasmids’ section of ‘Materials and Methods’ |
| Recombinant DNA reagent | Plasmid: β-MAT-DI-CGUA | This paper | ‘CGUA’ | Contains detained intron UGUA to CGUA mutation in β-MAT-WT backbone. See details in ‘Plasmids’ section of ‘Materials and Methods’ |
| Recombinant DNA reagent | Plasmid: β-MAT-hp1G4 | Pendleton et al., 2017 | ‘No MS2’ | |
| Recombinant DNA reagent | Plasmid: β-MAT-hp1G4, 2XMS2 | This paper | ‘2XMS2’ | Contains two MS2 binding sites inserted immediately downstream of hp1. See details in ‘Plasmids’ section of‘Materials and Methods’ |
| Recombinant DNA reagent | Plasmid: pcMS2-NLS-Flag-METTL16 | Pendleton et al., 2017 | ‘MS2-NLS-fl-M16’ | |
| Recombinant DNA reagent | Plasmid: Flag-METTL16 | Pendleton et al., 2017 | ‘M16’ | |
| Recombinant DNA reagent | Plasmid: pcMS2-NLS-Flag-CFIm25 | This paper | ‘wt’ | CFIm25 inserted into pcMS2-NLS-Flag vector. See details in‘Plasmids’ section of ‘Materials and Methods’ |
| Recombinant DNA reagent | Plasmid: pcMS2-NLS-Flag-CFIm25-m1 (Y158A/Y160A) | This paper | ‘m1’ | Y158A/Y160A mutations made in pcMS2-NLS-Flag-CFIm25. See details in ‘Plasmids’ section of ‘Materials and Methods’ |
| Recombinant DNA reagent | Plasmid: pcMS2-NLS-Flag-CFIm25-m2 (L218R) | This paper | ‘m2’ | L218R mutation made in pcMS2-NLS-Flag-CFIm25. See details in ‘Plasmids’ section of‘Materials and Methods’ |
| Recombinant DNA reagent | Plasmid: pcMS2-NLS-Flag-CFIm25-m3 (R63S) | This paper | ‘m3’; ‘MS2-NLS-fl-25’ | R63S mutation made in pcMS2-NLS-Flag-CFIm25. See details in ‘Plasmids’ section of ‘Materials and Methods’ |
| Recombinant DNA reagent | Plasmid: pcMS2-NLS-Flag-CFIm68 | This paper | ‘CFIm68 F.L.”, ‘68’,‘MS2-NLS-fl-68’ | CFIm68 inserted into pcMS2-NLS-Flag vector. See details in‘Plasmids’ section of‘Materials and Methods’ |
| Recombinant DNA reagrent | Plasmid: pcMS2-NLS-Flag-CFIm68ΔRS | This paper | ‘CFIm68 Δ” or ‘68ΔRS’ | CFIm68 with the RS domain deleted inserted into pcMS2-NLS-Flag vector. See details in‘Plasmids’ section of‘Materials and Methods’ |
| Recombinant DNA reagent | Plasmid: pcMS2-NLS-Flag-CFIm59 | This paper | ‘CFIm59 F.L.”, ‘59’,‘MS2-NLS-fl-59’ | CFIm59 inserted into pcMS2-NLS-Flag vector. See details in ‘Plasmids’ section of ‘Materials and Methods’ |
| Recombinant DNA reagent | Plasmid: pcMS2-NLS-Flag-CFIm59ΔRS | This paper | ‘CFIm59 Δ” or ‘59ΔRS’ | CFIm59 with the RS domain deleted inserted into pcMS2-NLS-Flag vector. See details in‘Plasmids’ section of‘Materials and Methods’ |
| Recombinant DNA reagent | Plasmid: pcNMS2-NLS-Flag | Sahin et al., 2010 | “-“ | |
| Recombinant DNA reagent | Plasmid: pE-SUMO | LifeSensors | Cat#: 1001K | |
| Recombinant DNA reagent | Plasmid: pE-SUMO-CFIm25 | This paper | N/A | CFIm25 inserted into pE-SUMO vector. See details in ‘Plasmids’ section of‘Materials and Methods’ |
| Recombinant DNA reagent | Plasmid: pcDNA3-Flag | Sahin et al., 2010 | “-“ | |
| Recombinant DNA reagent | Plasmid: Flag-CFIm25 | This paper | “wt“ | CFIm25 inserted into pcDNA3-flag vector. See details in ‘Plasmids’ section of ‘Materials and Methods’ |
| Recombinant DNA reagent | Plasmid: Flag-CFIm25-m1 (Y158A/Y160A ) | This paper | “m1“ | CFIm25 with Y158A/Y160A mutations inserted into pcDNA3-flag vector. See details in ‘Plasmids’ section of ‘Materials and Methods’ |
| Recombinant DNA reagent | Plasmid: Flag-CFIm25-m2 (L218R) | This paper | “m2“ | CFIm25 with L218R mutation inserted into pcDNA3-flag vector. See details in ‘Plasmids’ section of ‘Materials and Methods’ |
| Recombinant DNA reagent | Plasmid: Flag-CFIm25-m3 (R63S) | This paper | “m3“ | CFIm25 with R63S mutation inserted into pcDNA3-flag vector. See details in ‘Plasmids’ section of ‘Materials and Methods’ |
| Recombinant DNA reagent | Plasmid: pcDNA3 | Thermo Fisher | Cat#: V79020 | |
| Recombinant DNA reagent | Plasmid: pc∆1,2 (B-A) | Conrad et al., 2006 | N/A | |
| Recombinant DNA reagent | Plasmid: pcGFP-β1-MAT-E8-3´ | This paper | N/A | Used to create reporter cell line. See details in ‘Plasmids’ section of ‘Materials and Methods’ |
| Recombinant DNA reagent | Plasmid: hAAVS1-GFP-β2-MAT-E8-3´ | This paper | N/A | Used to create reporter cell line. See details in ‘Plasmids’ section of ‘Materials and Methods’ |
| Recombinant DNA reagent | Plasmid: hAAVS1-GFP-T2A-β2-MAT-E8-3 ́hp2-6m9 | This paper | N/A | Use to create T2A, hp2-6m9 reporter cell lines. See details in ‘Plasmids’ section of‘Materials and Methods’ |
| Recombinant DNA reagent | Plasmid: pSCRPSY | Clontech | Cat#V001595 | |
| Recombinant DNA reagent | Plasmid: pcEGFP | This paper (Materials and methods) | N/A | EGFP cloned into pcDNA. See details in ‘Plasmids’ section of‘Materials and Methods’ |
| Recombinant DNA reagent | Plasmid: AAVS1 1L TALEN | Dr. Feng Zhang Sajana et al., 2014 | RRID:Addgene#35431 | |
| Recombinant DNA reagent | Plasmid: AAVS1 1R TALEN | Dr. Feng Zhang Sajana et al., 2014 | RRID:Addgene#35432 | |
| Recombinant DNA reagent | Plasmid: pEGFP-N1 | Clontech | Cat#6085–1 | |
| Recombinant DNA reagent | Plasmid: pAAVS- EGFP-DONOR | Dr. Joshua Mendell Manjunath et al., 2019 | N/A | |
| Recombinant DNA reagree | Plasmid: LentiCRISPRv2 | Dr. Feng Zhang Sajana et al., 2014 | RRID:Addgene#52961 | |
| Recombinant DNA reagent | Plasmid: pLentiV2-MAT2A | This paper | ‘sgMAT2A’ | sgMAT2A cloned into LentiCRISPRv2. See details in ‘Plasmids’ section of ‘Materials and Methods’ |
| Recombinant DNA reagent | Plasmid: pLentiV2-NT | This paper | ‘sgNT’ | sgNT cloned into LentiCRISPRv2.See details in ‘Plasmids’ section of ‘Materials and Methods’ |
| Recombinant DNA reagent | Plasmid: pX458-MAT2A-E9 | This paper | Used to create 116-ΔDI cell line. See details in ‘Plasmids’ section of ‘Materials and Methods’ | |
| Recombinant DNA reagent | Plasmid: pX459-MAT2A-E8 | This paper | Used to create 116-ΔDI cell line. See details in ‘Plasmids’ section of ‘Materials and Methods’ | |
| Recombinant DNA reagent | Plasmid: pSpCas9(BB)−2A-GFP (pX458) | Dr. Feng Zhang Ran et al., 2013 | RRID:Addgene#48138 | |
| Recombinant DNA reagent | Plasmid: pSpCas9(BB)-Puro (pX459) | Dr. Feng Zhang Ran et al., 2013 | RRID:Addgene#62988 | |
| Recombinant DNA reagent | Plasmid: pBS-ΔRI-Donor | This paper | N/A | Used to create 116-ΔDI cell line. See details in ‘Plasmids’ section of ‘Materials and Methods’ |
| Recombinant DNA reagent | Plasmid: pBluescript II SK + | Stratagene, La Jolla, California | Cat#212205 | |
| Recombinant DNA reagent | Plasmid library: Human CRISPR Knockout Pooled Library (Brunello) | Drs. David Root and John Doench Doench et al., 2016 | RRID:Addgene#73179 | |
| Sequence-based reagent | Primers for Northern probes | This paper | N/A | See Supplementary file 3 |
| Sequence-based reagent | Primers for RNase H cleavage | This paper | N/A | See Supplementary file 3 |
| Sequence-based reagent | Primers for Making Plasmids | This paper | N/A | See Supplementary file 3 |
| Sequence-based reagent | Insert for β-MAT-3´ UTR-Last-Motif-UGCA | GeneWiz | N/A | See Supplementary file 3 |
| Sequence-based reagree | Insert for β-MAT-3´UTR-10/11 | GeneWiz | N/A | See Supplementary file 3 |
| Sequence-based reagent | Negative Control No. 2 siRNA | Thermo Fisher | Cat#: 4390846 | Silencer Select |
| Sequence-based reagent | siMETTL16#1 | Thermo Fisher | Cat#: s35508 | Silencer Select |
| Sequence-based reagent | siMETTL16#2; siMETTL16 | Thermo Fisher | Cat#: s35507 | Silencer Select |
| Sequence-based reagent | siCFIm25#1 | Thermo Fisher | Cat#: s21770 | Silencer Select |
| Sequence-based reagent | siCFIm25#2 | Thermo Fisher | Cat#: s21772 | Silencer Select |
| Sequence-based reagent | siCFIm68#1 | Thermo Fisher | Cat#: s21773 | Silencer Select |
| Sequence-based reagent | siCFIm68#2 | Thermo Fisher | Cat#: s21774 | Silencer Select |
| Sequence-based reagent | siCFIm59#1 | Thermo Fisher | Cat#: s224836 | Silencer Select |
| Sequence-based reagent | siCFIm59#2 | Thermo Fisher | Cat#: s224837 | Silencer Select |
| Sequence-based reagent | siCFIm73#1 | Thermo Fisher | Cat#: s28531 | Silencer Select |
| Sequence-based reagent | siCFIm73#2 | Thermo Fisher | Cat#: s28532 | Silencer Select |
| Peptide, recombinant protein | rSUMO-CFIm25 | This paper | N/A | |
| Commercial assay or kit | CellTiter-Glo | Promega | Cat#G7570 | |
| Commercial assay or kit | AMPure XP | Beckman Coulter | Cat#A63880 | |
| Chemical compound, drug | MG132 | Sigma | Cat # M8699-1MG | 50 μM |
| Software, algorithm | ImageQuant (v 8.1) | GE Healthcare Life Sciences | N/A | |
| Software, algorithm | Graphpad Prism (v 8) | GraphPad Software | RRID:SCR_000306 | |
| Software, algorithm | GelQuant.NET (v 1.8.2) | BiochemLab Solutions, 2011 | N/A | |
| Software, algorithm | RStudio (v 3.5.1) | RStudio Team, 2018 | N/A | |
| Software, algorithm | Image Studio (v 5.2) | LI-COR | RRID:SCR_015795 | |
| Software, algorithm | SuperExactTest | Wang et al., 2015 | doi:10.1038/srep16923 | |
| Software, algorithm | MAGeCK | Li et al., 2014 | https://sourceforge.net/projects/mageck/files/ | |
| Software, algorithm | Fastqc | Andrews, 2019 | https://www.bioinformatics.babraham.ac.uk/projects/fastqc/ | |
| Software, algorithm | Fastp (v 0.19.5) | Chen et al., 2018 | doi:10.1093/bioinformatics/bty560 | |
| Software, algorithm | Cutadapt (v 1.18) | Martin et al., 2012 | https://cutadapt.readthedocs.io/en/stable/ | |
| Software, algorithm | HISAT2 (v 2.1.0) | Kim et al., 2015 | https://www.ncbi.nlm.nih.gov/pmc/articles/PMC4655817/ | |
| Software, algorithm | DESeq2 (v 1.22.1) | Love et al., 2014 | doi:10.1186/s13059-014-0550-8 | |
| Software, algorithm | DPAC (v 1.10) | Routh, 2019a Routh, 2019b | https://sourceforge.net/projects/dpac-seq/ | |
| Software, algorithm | FloJo (v 9.9.5) | FlowJo LLC | N/A | |
| Software, algorithm | CellCapTure (v3.1) | Stratedigm, Inc., 2021 | N/A |
Additional files
-
Supplementary file 1
Analysis of genome-wide CRISPR-Cas9 screen.
MAGeCK analysis of biological replicates of CRISPR screen. Table shows MAGeCK analysis for each individual replicate (rep1-3) and analysis of the replicates together (triplicate). The triplicate analysis is referenced in text and Figure 1.
- https://cdn.elifesciences.org/articles/64930/elife-64930-supp1-v2.xlsx
-
Supplementary file 2
Analysis of Poly(A)-ClickSeq results.
Poly(A)-ClickSeq analysis of HCT116 and 116-ΔDI cell lines with either siNon-targeting or siCFIm25 treatment.
- https://cdn.elifesciences.org/articles/64930/elife-64930-supp2-v2.xlsx
-
Supplementary file 3
Nucleic acid reagents.
DNA oligonucleotide sequences for cloning primers, northern blotting probe primers, RNase H oligonucleotides, CRISPR screen primers, and synthesized DNA for cloning. RNA oligonucleotides sequences for label transfer assay substrates.
- https://cdn.elifesciences.org/articles/64930/elife-64930-supp3-v2.xlsx
-
Transparent reporting form
- https://cdn.elifesciences.org/articles/64930/elife-64930-transrepform-v2.docx
Download links
A two-part list of links to download the article, or parts of the article, in various formats.
Downloads (link to download the article as PDF)
Open citations (links to open the citations from this article in various online reference manager services)
Cite this article (links to download the citations from this article in formats compatible with various reference manager tools)
SAM homeostasis is regulated by CFIm-mediated splicing of MAT2A
eLife 10:e64930.
https://doi.org/10.7554/eLife.64930


