Pervasive duplication of tumor suppressors in Afrotherians during the evolution of large bodies and reduced cancer risk
- Department of Human Genetics, The University of Chicago, United States
- Department of Biological Sciences, University at Buffalo, United States
Figures
Figure 1
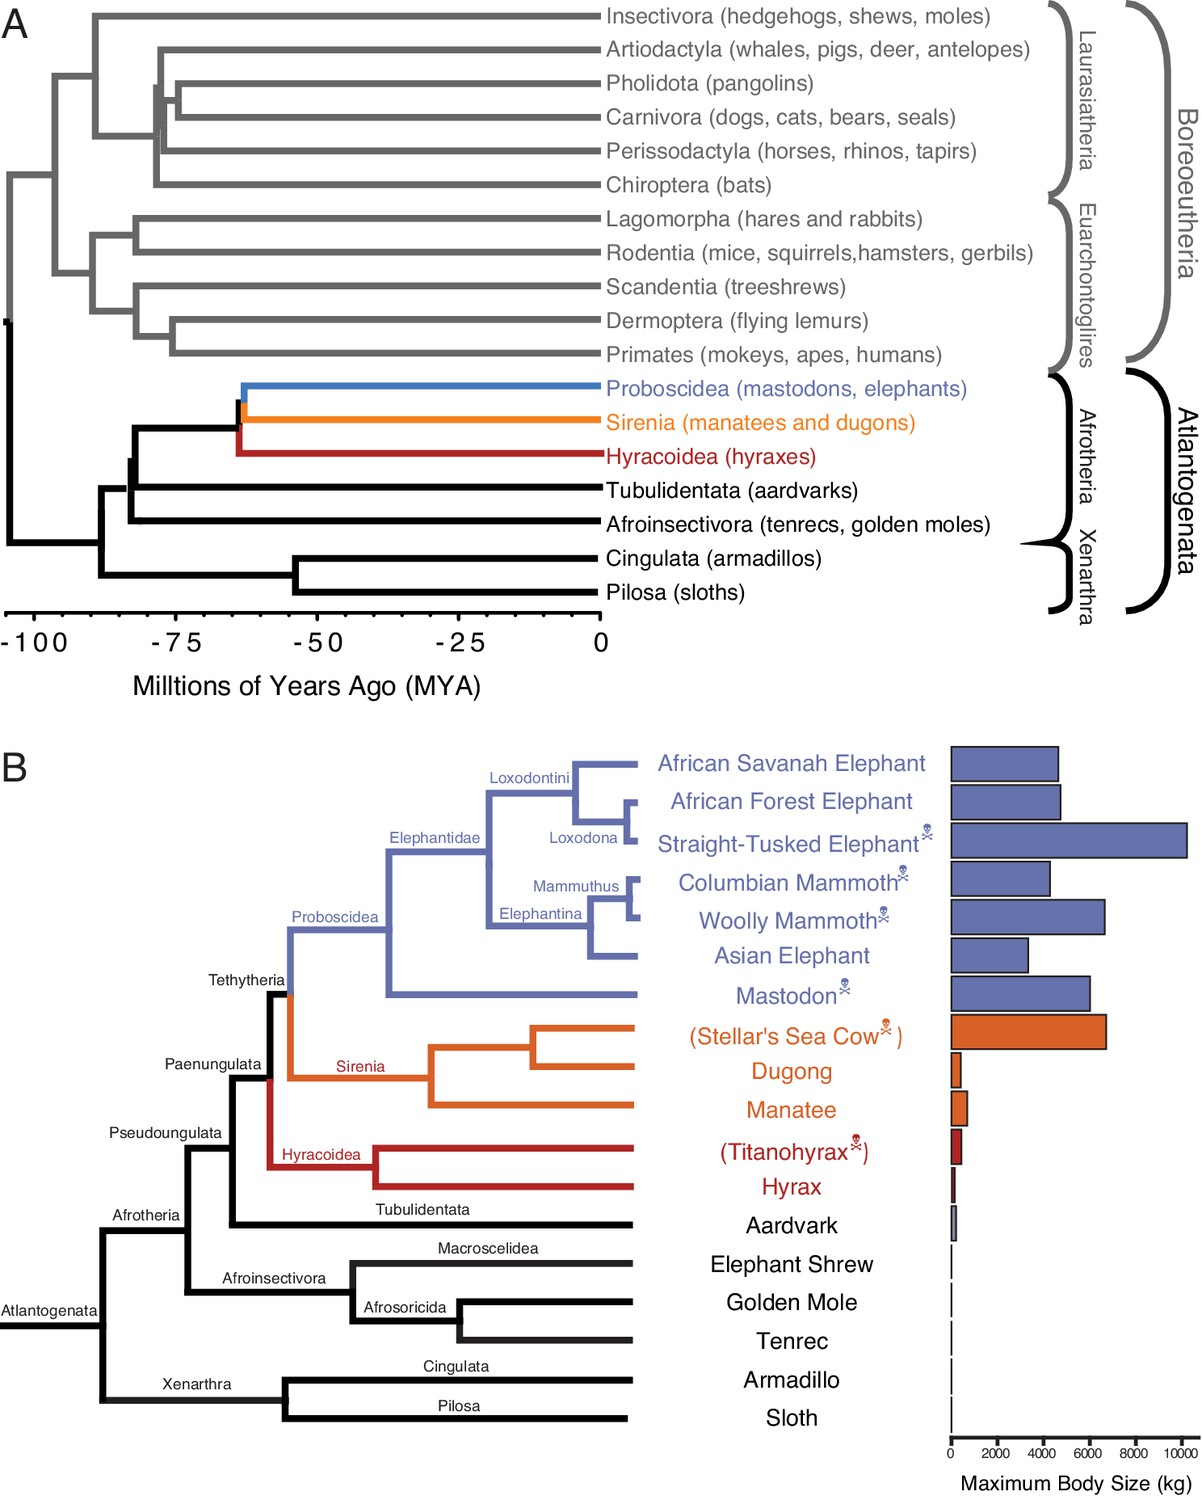
Large-bodied Afrotherians are nested within species with smaller body sizes (Tacutu et al., 2013; Puttick and Thomas, 2015).
(A) Phylogenetic relationships between Eutherian orders, examples of each order are given in parenthesis. Horizontal branch lengths are proportional to time since divergence between lineages (see scale, Millions of Ago [MYA]). The clades Atlantogenata and Boreoeutheria are indicated, the order Proboscidea is colored blue, Sirenia is colored orange, and Hyracoidea is colored red. (B) Phylogenetic relationships of extant and recently extinct Atlantogenatans with available genomes are shown along with clade names and maximum body sizes. Note that horizontal branch lengths are arbitrary, species indicated with skull and crossbones are extinct, and those in parentheses do not have genomes. The order Proboscidea is colored blue, Sirenia is colored orange, and Hyracoidea is colored red.
Figure 2
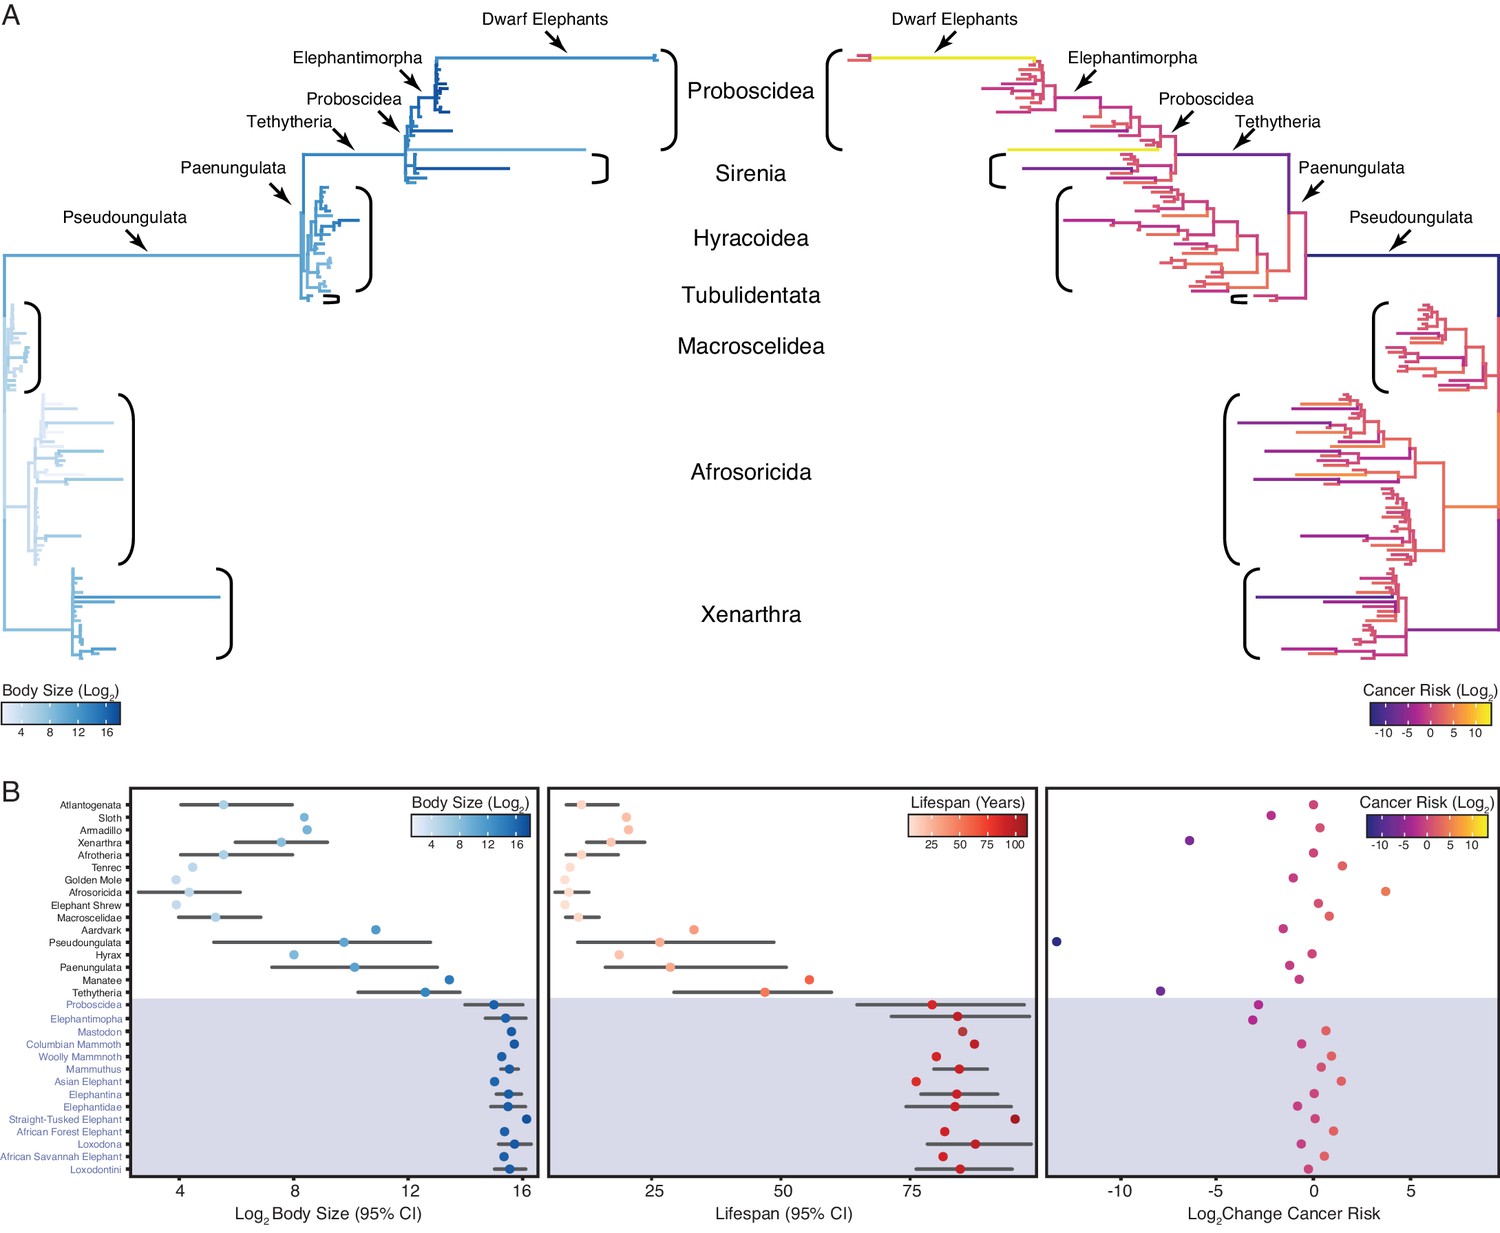
Convergent evolution of large-bodied, cancer resistant Afrotherians.
(A) Atlantogenatan phylogeny, with branch lengths scaled by log2 change in body size (left) or log2 change in intrinsic cancer risk (right). Branches are colored according to ancestral state reconstruction of body mass or estimated intrinsic cancer risk. Clades and lineages leading to extant Proboscideans and dwarf elephants are labeled. (B) Extant and ancestral body size (left), lifespan (middle), and estimated intrinsic cancer risk reconstructions; data are shown as mean (dot) and 95% confidence interval (CI, whiskers).
Figure 3 with 2 supplements
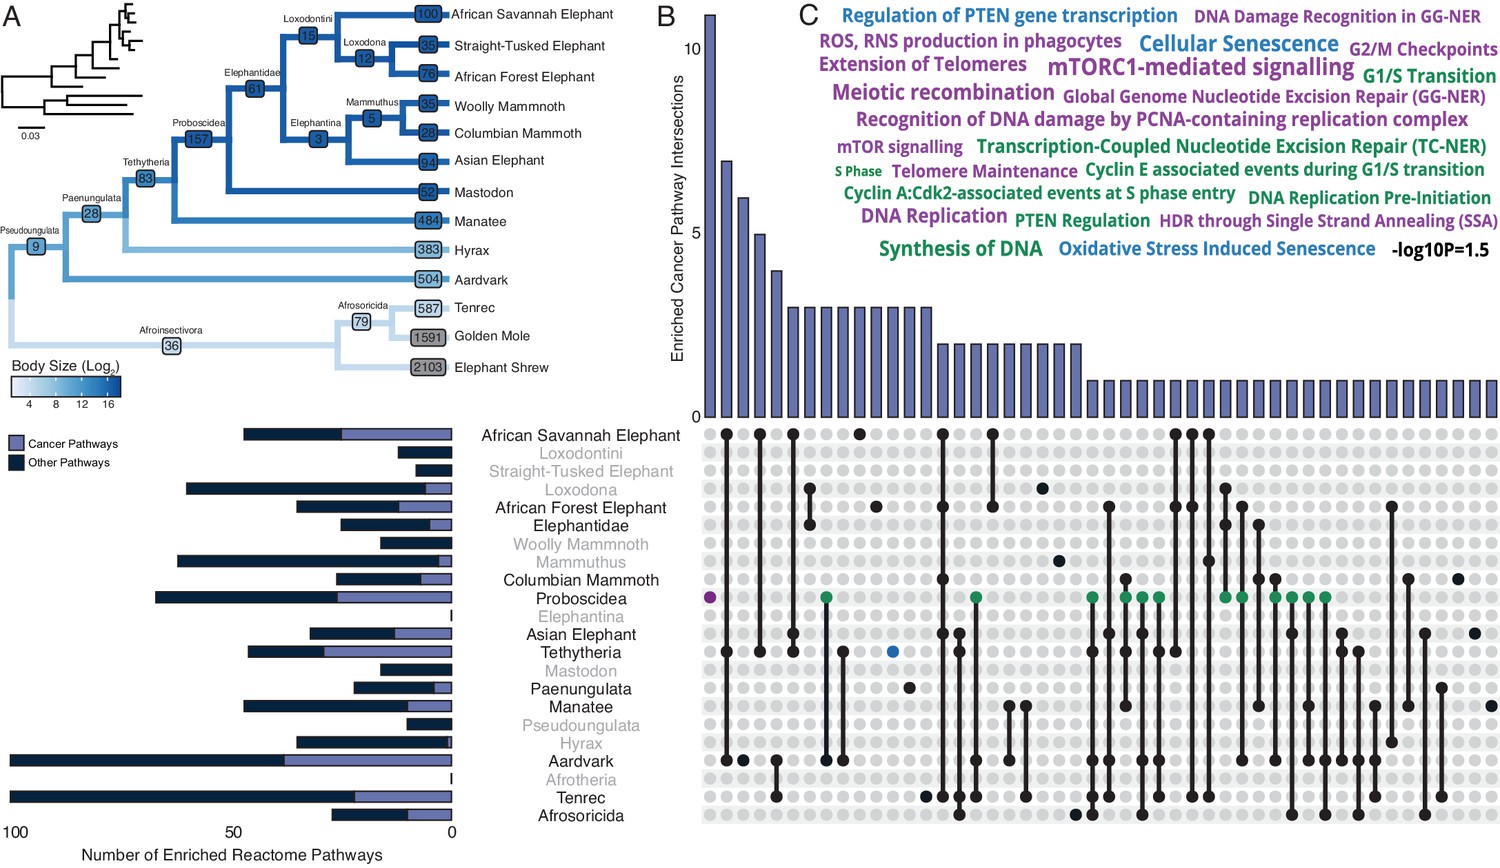
Pervasive duplication of tumor suppressors in Atlantogenata.
(A) Afrotherian phylogeny indicating the number of genes duplicated in each lineage, inferred by maximum likelihood with Bayesian posterior probability (BPP) ≥0.80. Branches are colored according to log2 change in body size. Inset, phylogeny with branch lengths proportional to gene expression changes per gene. (B) Upset plot of cancer related Reactome pathways enriched in each Afrotherian lineage; lineages in which the cancer pathway enrichment percentage is less than background are shown in gray. Note that Upset plots are Euler diagrams showing intersections between sets; lines indicate intersections in pathway terms between lineages connected by that line (for example, the line connecting the points for Aardvark and Tenrec indicate pathway indications for those two lineages), and empty sets are not shown. (C) Wordcloud of pathways enriched exclusively in the Proboscidean stem-lineage (purple), shared between Proboscidea and Tethytheria (blue), or shared between Proboscidea and any other lineage (green).
Figure 3—figure supplement 1
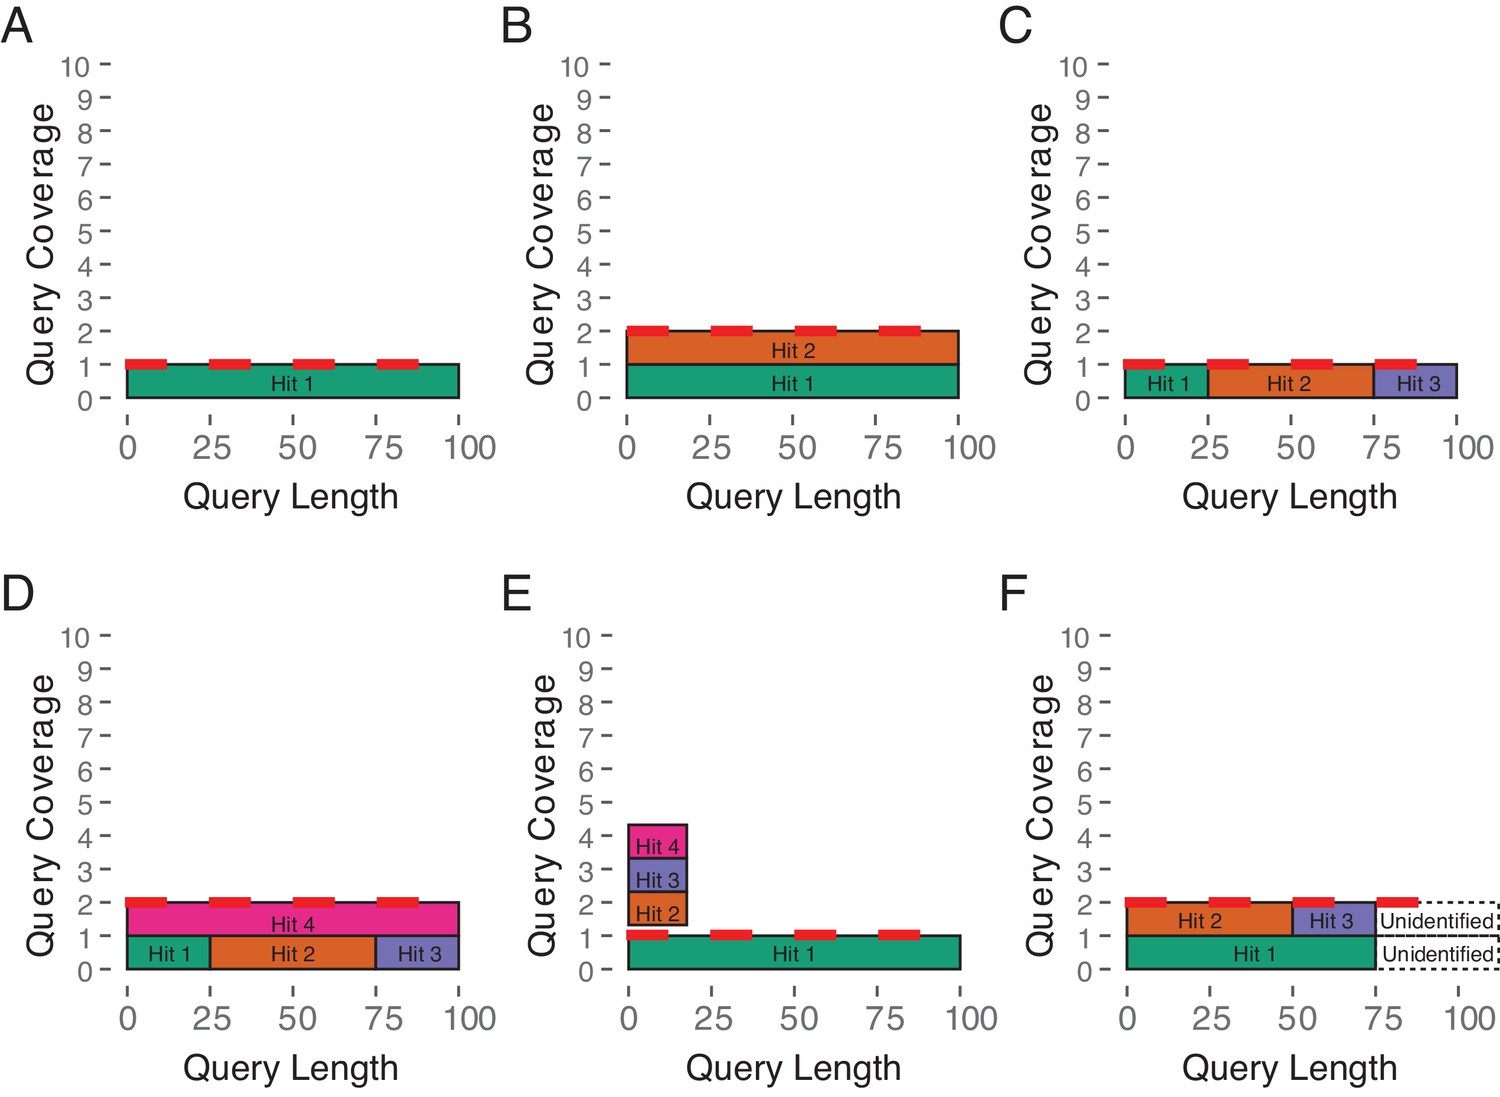
Estimated Copy Number by Coverage (ECNC) consolidates fragmented genes while accounting for missing domains in homologs.
(A) A single, contiguous gene homolog in a target genome with 100% query length coverage has an ECNC of 1.0. (B) Two contiguous gene homologs each with 100% query length coverage have an ECNC of 2.0. (C) A single gene homolog, split across multiple scaffolds and contigs in a fragmented target genome; BLAT identifies each fragment as a single hit. Per nucleotide of query sequence, there is only one corresponding nucleotide over all the hits, thus the ECNC is 1.0. (D) Two gene homologs, one fragmented and one contiguous. 100% of nucleotides in the query sequence are represented between all hits; however, every nucleotide in the query has two matching nucleotides in the target genome, thus the ECNC is 2.0. (E) One true gene homolog in the target genome, plus multiple hits of a conserved domain that span 20% of the query sequence. While 100% of the query sequence is represented in total, 20% of the nucleotides have four hits. Thus, the ECNC for this gene is 1.45. (F) Two real gene homologs; one hit is contiguous, one hit is fragmented in two, and the tail end of both sequences was not identified by BLAT due to sequence divergence. Only 75% of the query sequence was covered in total between the hits, but for that 75%, each nucleotide has two hits. As such, ECNC is equal to 2.0 for this gene.
Figure 3—figure supplement 2
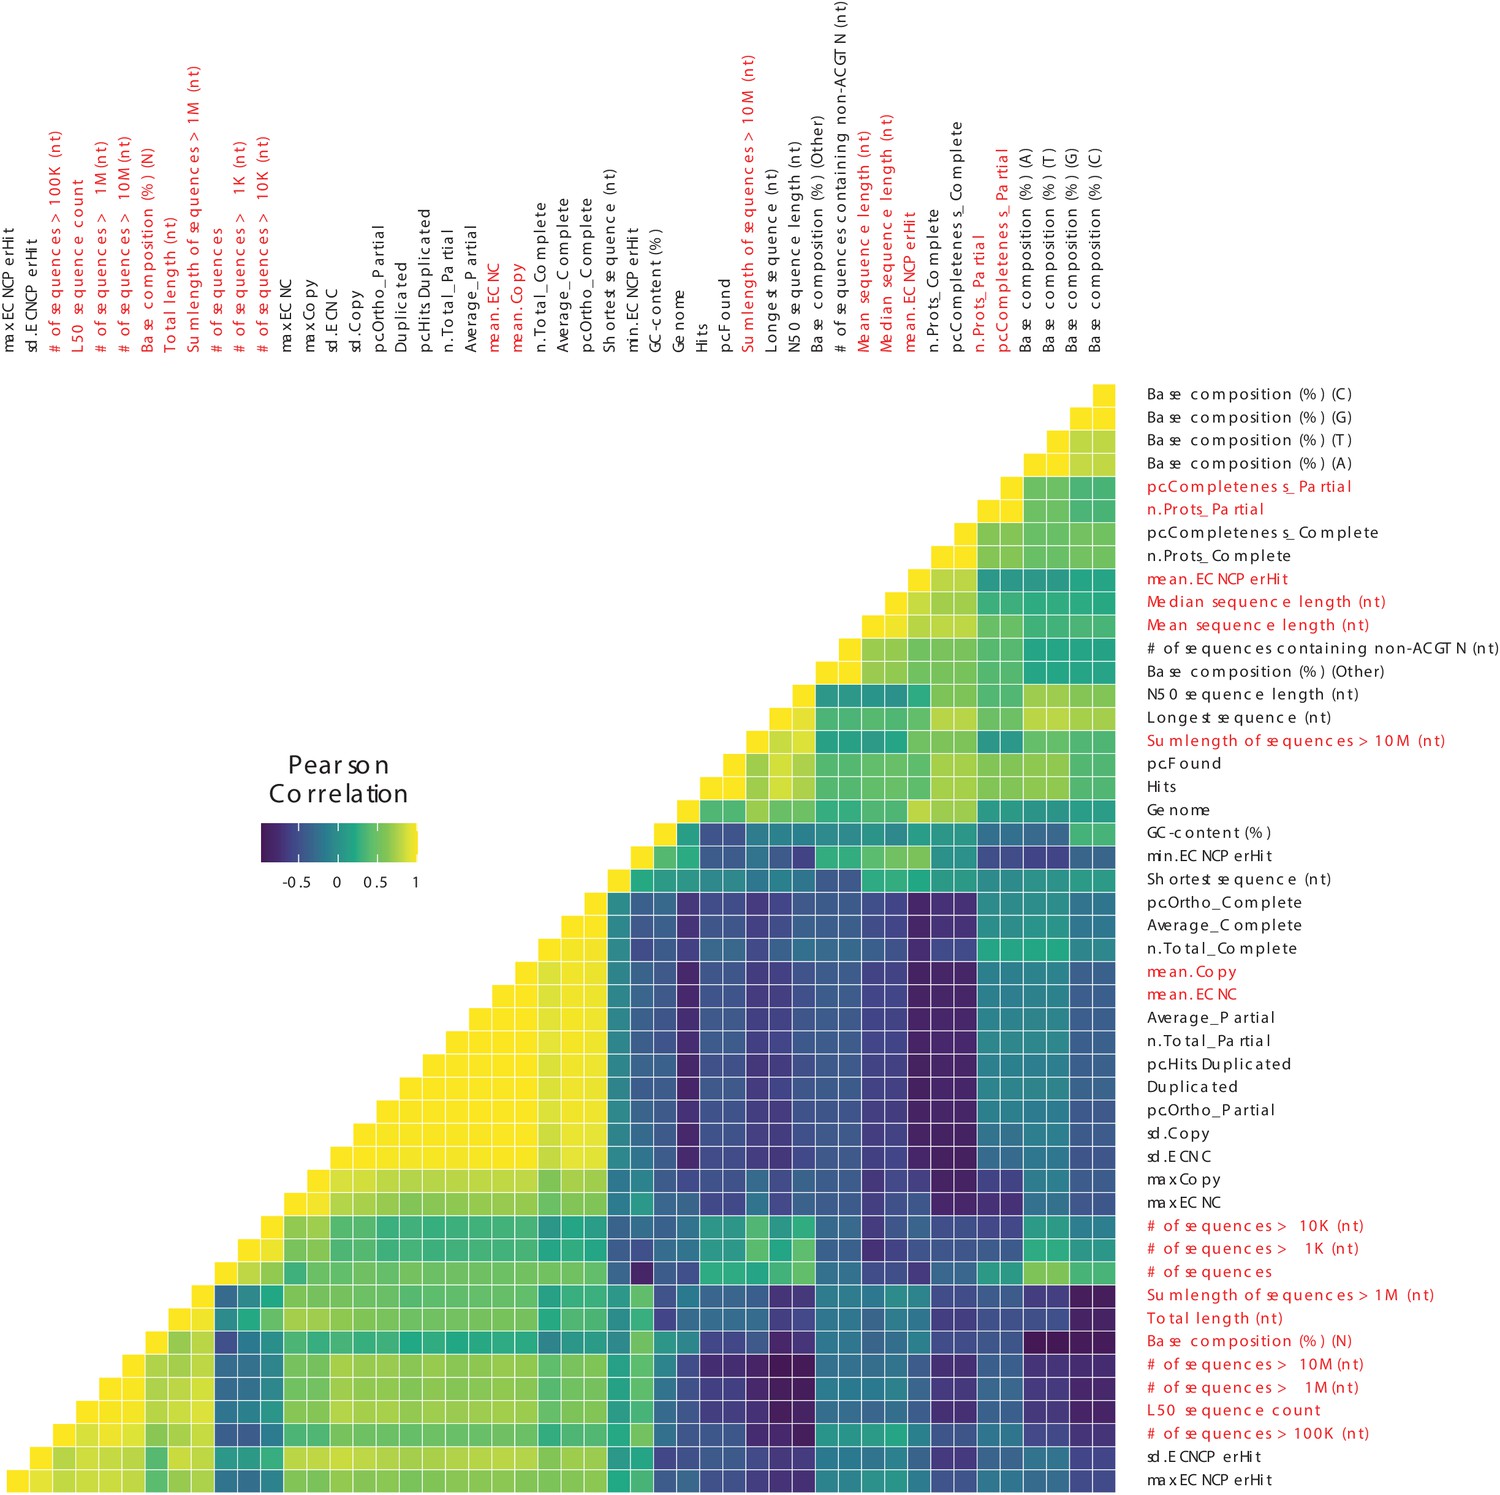
Correlations between genome quality metrics and ECNC metrics.
Gene copy number metrics, and the genome quality metrics most strongly associated with them, are highlighted in red.
Figure 4
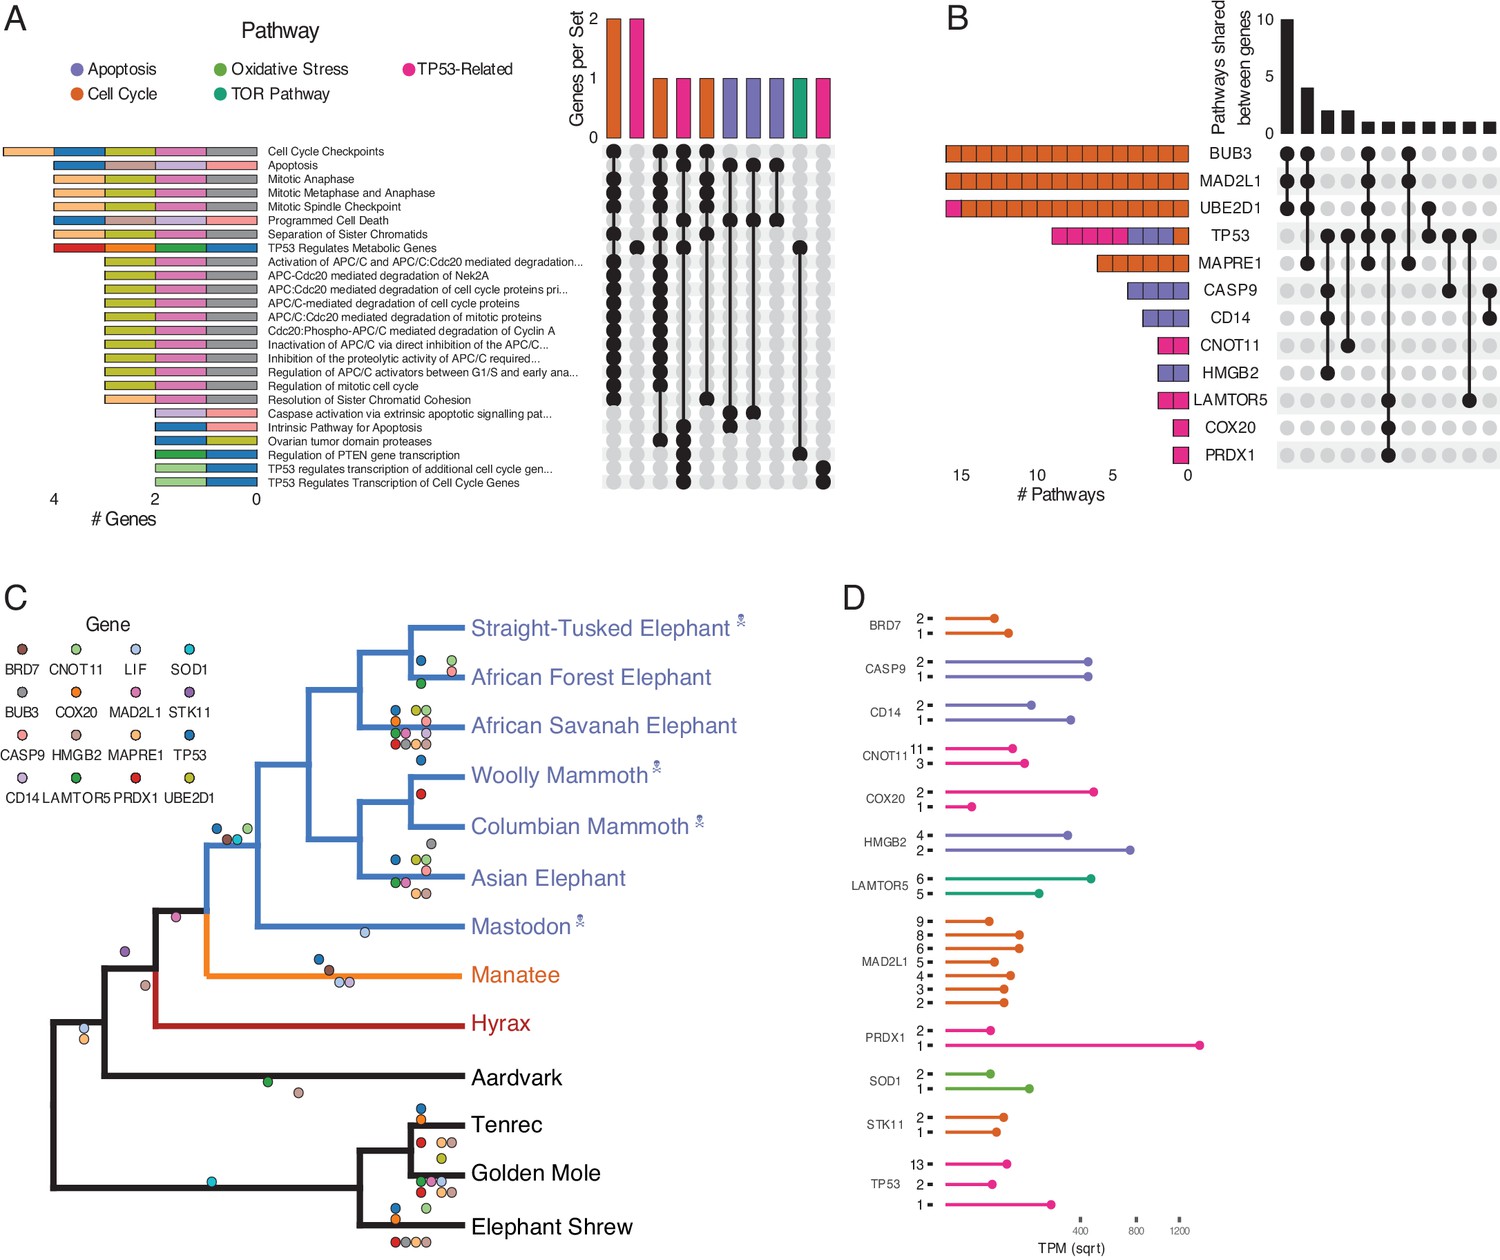
Duplications in the African savannah elephant (Loxodonta africana) are enriched for TP53-related and other tumor suppressor processes.
(A) Upset plot of cancer-related Reactome pathways in African savannah elephant, highlighting shared genes in each set, and the pathway class represented by the combinations (see Figure 3 for a description of Upset plots). (B) Inverted Upset plot from A showing the pathways shared by genes highlighted by WEBGESTALT in each pathway. (C) Cladogram of Afrotheria with sequenced genomes. Exemplar tumor suppressor duplicates are mapped onto lineages in which those genes are duplicated. Dots represent a duplication event of the color-coded genes. Note that we are unable to determine duplication status for some genes in Proboscideans because of assembly gaps in ancient genomes (indicated with skull and crossbones); these genes appear to be independently duplicated in extant species (African Forest, African Savanah, and Asian elephants) because they are missing from ancient genomes, biasing ancestral reconstructions of duplication status. (D) Gene expression levels of genes from panel C that have two or more expressed duplicates.
-
Figure 4—source data 1
Data set used for manual coding gene potential associated with Figure 4C,D.
- https://cdn.elifesciences.org/articles/65041/elife-65041-fig4-data1-v2.zip
Tables
Table 1
Genomes used in this study.
| Species | Common Name | Genomes | Highest Quality Genome | Reference(s) |
|---|---|---|---|---|
| Choloepus hoffmanni | Hoffmans two-toed sloth | choHof1, | choHof-C_hoffmanni-2.0.1_HiC | Dudchenko et al., 2017 |
| choHof2, | ||||
| choHof-C_hoffmanni-2.0.1_HiC | ||||
| Chrysochloris asiatica | Cape golden mole | chrAsi1m | chrAsi1m | GCA_000296735.1 |
| Dasypus novemcinctus | Nine-banded armadillo | dasNov3 | dasNov3 | GCA_000208655.2 |
| Echinops telfairi | Lesser Hedgehog Tenrec | echTel2 | echTel2 | GCA_000313985.1 |
| Elephantulus edwardii | Cape elephant shrew | eleEdw1m | eleEdw1m | GCA_000299155.1 |
| Elephas maximus | Asian elephant | eleMaxD | eleMaxD | Palkopoulou et al., 2018 |
| Loxodonta africana | African savanna elephant | loxAfr3, | loxAfr4 | ftp://ftp.broadinstitute.org/pub/assemblies/mammals/elephant/loxAfr4 |
| loxAfrC, | ||||
| loxAfr4 | ||||
| Loxodonta cyclotis | African forest elephant | loxCycF | loxCycF | Palkopoulou et al., 2018 |
| Mammut americanum | American mastodon | mamAmeI | mamAmeI | Palkopoulou et al., 2018 |
| Mammuthus columbi | Columbian mammoth | mamColU | mamColU | Palkopoulou et al., 2018 |
| Mammuthus primigenius | Woolly mammoth | mamPriV | mamPriV | Palkopoulou et al., 2015 |
| Orycteropus afer | Aardvark | oryAfe1, oryAfe2 | oryAfe2 | Dudchenko et al., 2017 |
| Palaeoloxodon antiquus | Straight tusked elephant | palAntN | palAntN | Palkopoulou et al., 2018 |
| Procavia capensis | Rock hyrax | proCap1, proCap2, proCap-Pcap_2.0_HiC | proCap-Pcap_2.0_HiC | Dudchenko et al., 2017; Lindblad-Toh et al., 2011 |
| Trichechus manatus latirostris | Manatee | triMan1, triManLat2 | triManLat2 | Dudchenko et al., 2017; Foote et al., 2015 |
Table 2
Summary of reactome pathways in Atlantogenata.
| Number of | Percentage | Cancer pathways greater than simulated? | |||
|---|---|---|---|---|---|
| Genes | Pathways | Cancer pathways | Simulated cancer pathways | ||
| Afroinsectivora | 36 | 65 | 13.85% | 15.42% | No |
| Afrosoricida | 79 | 27 | 37.04% | 15.42% | Yes |
| Chrysochloris asiatica | 1591 | 100 | 27.00% | 15.42% | Yes |
| Echinops telfairi | 587 | 100 | 22.00% | 15.42% | Yes |
| Elephantidae | 61 | 25 | 20.00% | 13.03% | Yes |
| Elephantulus edwardii | 2103 | 100 | 22.00% | 15.42% | Yes |
| Elephas maximus | 94 | 32 | 40.63% | 17.73% | Yes |
| Loxodona | 12 | 60 | 10.00% | 14.53% | No |
| Loxodonta africana | 100 | 47 | 53.19% | 15.42% | Yes |
| Loxodonta cyclotis | 76 | 35 | 34.29% | 16.11% | Yes |
| Loxodontini | 15 | 12 | 0.00% | 13.82% | No |
| Mammut americanum | 52 | 16 | 0.00% | 12.91% | No |
| Mammuthus | 5 | 62 | 4.84% | 15.29% | No |
| Mammuthus columbi | 28 | 26 | 26.92% | 12.88% | Yes |
| Mammuthus primigenius | 35 | 16 | 0.00% | 12.28% | No |
| Orycteropus afer | 504 | 100 | 38.00% | 15.42% | Yes |
| Paenungulata | 28 | 22 | 18.18% | 12.88% | Yes |
| Palaeoloxodon antiquus | 35 | 8 | 0.00% | 12.28% | No |
| Proboscidea | 157 | 67 | 38.81% | 9.52% | Yes |
| Procavia capensis | 383 | 35 | 2.86% | 15.42% | No |
| Pseudoungulata | 9 | 10 | 0.00% | 14.90% | No |
| Tethytheria | 83 | 46 | 63.04% | 18.52% | Yes |
| Trichechus manatus | 484 | 47 | 21.28% | 15.42% | Yes |
Additional files
-
Source data 1
All necessary data sets and scripts to reproduce results presented in this manuscript.
- https://cdn.elifesciences.org/articles/65041/elife-65041-data1-v2.zip
-
Supplementary file 1
Summary of duplications in Atlantogenata.
- https://cdn.elifesciences.org/articles/65041/elife-65041-supp1-v2.docx
-
Supplementary file 2
RNA-Seq data sets used in this study, along with key biological and genome information.
- https://cdn.elifesciences.org/articles/65041/elife-65041-supp2-v2.docx
-
Supplementary file 3
Summary of PGLS model used to estimate lifespan.
- https://cdn.elifesciences.org/articles/65041/elife-65041-supp3-v2.docx
-
Transparent reporting form
- https://cdn.elifesciences.org/articles/65041/elife-65041-transrepform-v2.docx
Download links
A two-part list of links to download the article, or parts of the article, in various formats.
Downloads (link to download the article as PDF)
Open citations (links to open the citations from this article in various online reference manager services)
Cite this article (links to download the citations from this article in formats compatible with various reference manager tools)
Pervasive duplication of tumor suppressors in Afrotherians during the evolution of large bodies and reduced cancer risk
eLife 10:e65041.
https://doi.org/10.7554/eLife.65041


