Imaging cytoplasmic lipid droplets in vivo with fluorescent perilipin 2 and perilipin 3 knock-in zebrafish
- Carnegie Institution for Science Department of Embryology, United States
- Department of Biochemistry and Molecular Biology, Mayo Clinic, United States
- Johns Hopkins University Department of Biology, United States
Figures
Figure 1 with 2 supplements

Generation of in-frame fluorescent reporters in the endogenous plin2 and plin3 loci.
(A,B) Representative images of whole-mount in situ hybridization (ISH) with probes against zebrafish plin2 (ENSDARG00000042332) and zgc: 77,486 (plin3/4/5) (ENSDARG00000013711) at 6 days post fertilization (dpf) either unfed or following feeding with a high-fat meal for 90 min. ISH was performed three times for each gene with n = 10 larvae per probe per experiment; scale = 500 µm (A), scale = 100 µm (B). Plin2 is expressed in the intestine only following a high-fat meal whereas plin3 is expressed in the intestine in unfed fish and has stronger expression following a high-fat meal. (C) Overview of the location and strategy used for TALEN-mediated genome editing. EGFP was fused in-frame at the N-terminus of plin2. TALEN targets in plin2 are located in exon 1 of the plin2-203 ENSDART00000175378.2 transcript and flank a FokI restriction site, loss of which was used to confirm cutting activity. A donor plasmid with the coding sequence for EGFP and plin2 homology arms was co-injected with TALEN mRNA into one-cell stage embryos to be used as a template for homology directed repair. mTag-RFP-t was fused in-frame at the C-terminus of plin3. TALEN targets were located in exon 8 of the plin3 ENSDART00000100473.5 transcript and flank the termination codon and an HphI restriction site, loss of which was used to confirm cutting activity. A donor plasmid with the coding sequence for mTagRFP-t and plin3 homology arms was co-injected with TALEN mRNA into one-cell stage embryos to be used as a template for homology directed repair. (D) Following identification of fluorescent embryos in the F1 generation, RT-PCR and sequencing of genomic DNA using the primers noted on the knock-in loci depicted in (C) were used to confirm successful in-frame integration of the fluorescent tags. The size of the amplicons expected for correct integration were as follows: F1–R1 1033 bp, F2–R2 1340 bp, F3–R3 440 bp for wild-type (WT) and 1224 bp for Fus(EGFP-plin2) fusion, F4–R4 1218 bp, F5–R5 1274 bp, F6–R6 401 bp for WT and 1187 for Fus(plin3-RFP). Arrows indicate the larger amplicon in heterozygous fish carrying the fusion alleles. (E) Imaging in live larvae (6 dpf) reveals expression of EGFP-Plin2 only in the intestine of larvae fed a high-fat meal (7 hr post-start of 2 hr meal) and Plin3-RFP is expressed in the intestine of both unfed and fed larvae (4.5 hr post-start of 2 hr meal, larvae are heterozygous for the fusion proteins; the lumen of the intestine has strong autofluorescence in WT and transgenic fish; see Figure 1—figure supplement 2 for images of whole fish). Scale = 500 µm. (F) Examples of larvae expressing both EGFP-Plin2 and Plin3-RFP (7 hr post start of meal). Scale = 500 µm. For (E and F), images are representative of at least 15 fish from three independent clutches. (G) EGFP-Plin2 (green) and Plin3-RFP (magenta) label the lipid droplet surface in the intestine of 6 dpf larvae fed with a high-fat meal containing either BODIPY 558/568-C12 (magenta) or BODIPY FL-C12 (green) to label the stored lipids. Note the 558/568-C12 is not fully incorporated into stored lipid and is also found diffuse in the cytoplasm. Scale = 10 µm. (H) EGFP-Plin2 and Plin3-RFP can decorate the same lipid droplets in the intestine. Arrows denote examples of dual-labeled droplets, scale = 10 µm.
Figure 1—figure supplement 1
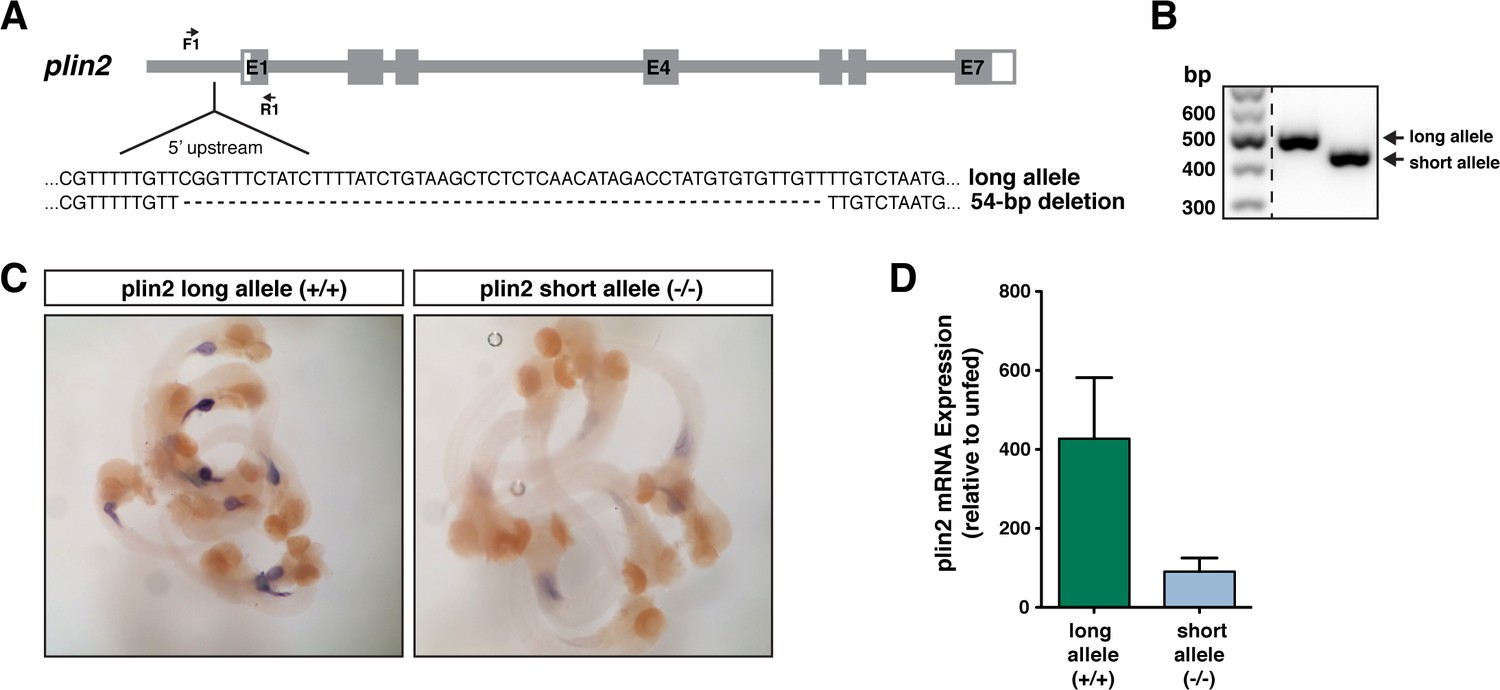
A deletion upstream of exon 1 in plin2 impacts gene expression following a high-fat meal.
(A) A 54 bp deletion was noted in the 5’ untranslated region upstream of exon 1 in the plin2 ENSDART00000175378.2 transcript in AB wild-type stocks. (B) RT-PCR using the primers noted in panel A reveal the long vs. short (deletion) alleles. (C) In situ hybridization indicates that larvae homozygous for the long allele have stronger expression of plin2 in the intestine following a high-fat meal than fish homozygous for the short allele (~10 larvae shown at 6 days post fertilization (dpf), fed 90 min prior to fixation). (D) Quantitative RT-PCR confirmed the difference in plin2 expression induction between larvae with the long vs. short allele following a high-fat meal relative to unfed controls (n = 5 samples of isolated guts from 10 larvae per sample following a 90 min feed, samples are from two independent experiments; mean ± SD).
-
Figure 1—figure supplement 1—source data 1
Source data associated with Figure 1—figure supplement 1 panel D.
- https://cdn.elifesciences.org/articles/66393/elife-66393-fig1-figsupp1-data1-v2.xlsx
Figure 1—figure supplement 2
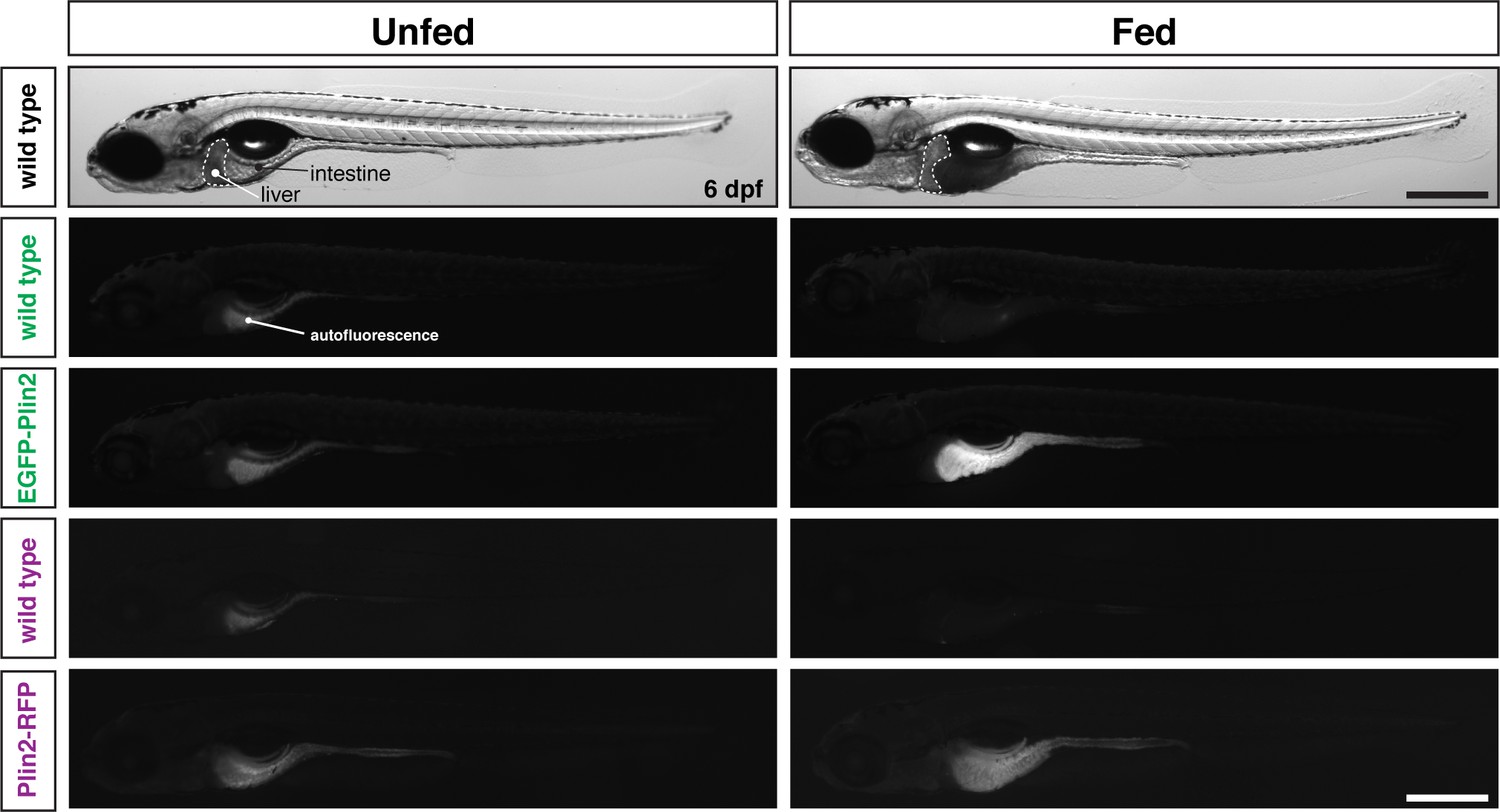
Whole fish images corresponding to Figure 1E.
Whole-mount images of the same fish shown in Figure 1E. Scale = 500 µm.
Figure 2
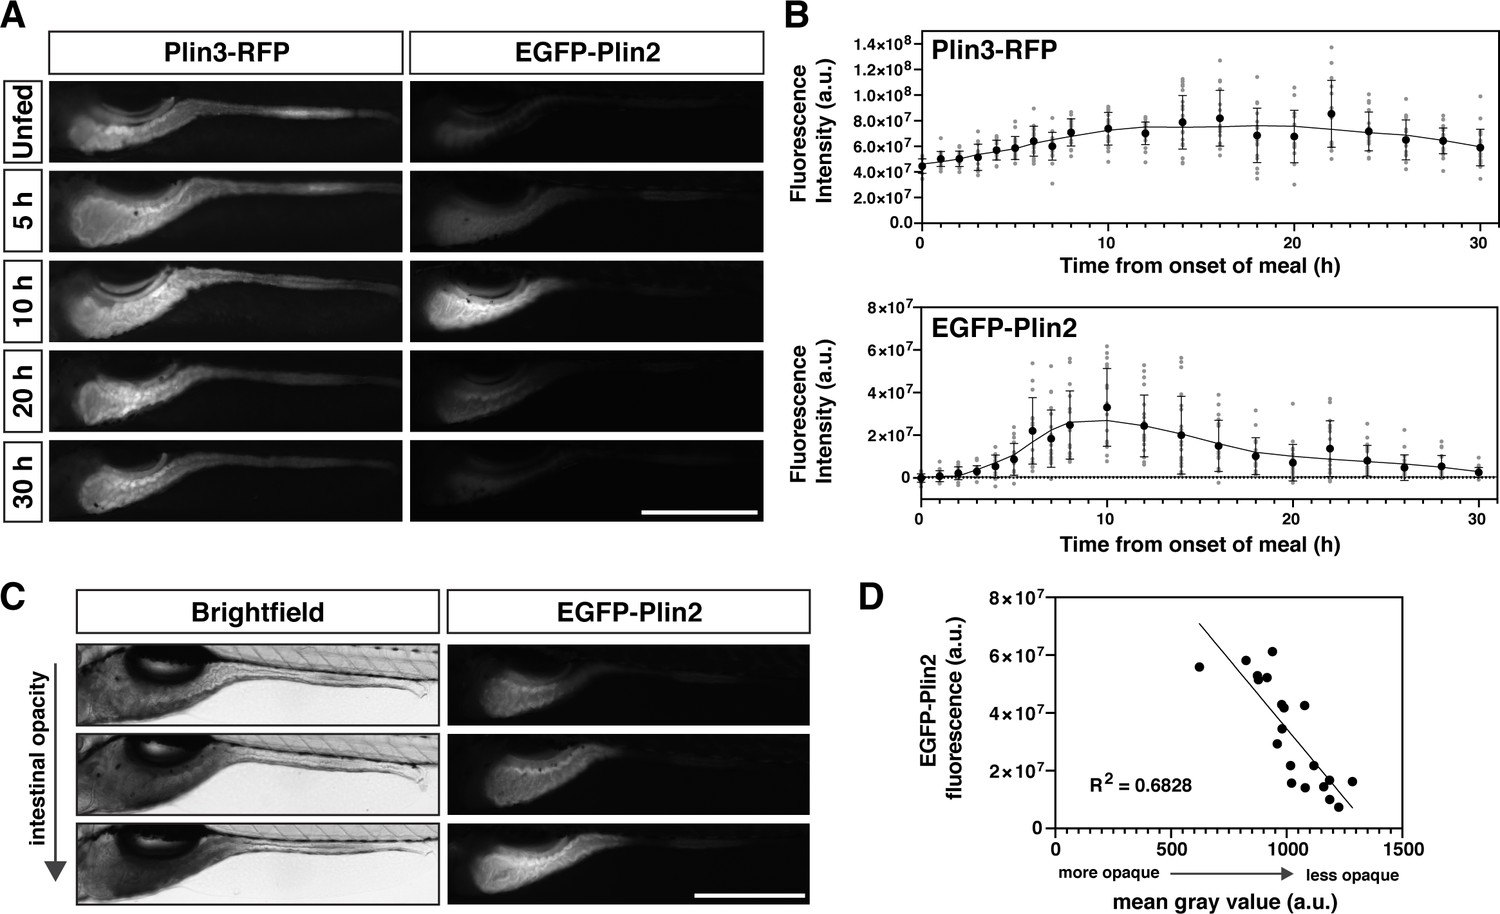
Whole-mount Plin protein expression in the intestine following a high-fat meal.
(A) Representative images of Plin3-RFP and EGFP-Plin2 fluorescence in the intestine of 6 days post fertilization (dpf) larvae at noted time-points following the onset of a 90 min high-fat meal. Scale = 500 µm. (B) Fluorescence intensity was quantitated every hour for the first 8 hr following onset of the meal and subsequently every 2 hr for a total of 30 hr. Mean fluorescence intensity of wild-type siblings at each time-point was used to correct for gut autofluorescence. Black circles and errors bars indicate mean ± SD, individual data points are shown in gray, n = 14–23 total larvae per time-point from three independent clutches. Significant changes in fluorescence between unfed (0 hr) and subsequent time-points were calculated with Kruskal-Wallis with Dunn’s multiple comparisons tests. For Plin3-RFP, fluorescence is significantly different from 0 hr at 6 and 8–28 hr, p < 0.05. For EGFP-Plin2, fluorescence is significantly different from 0 hr at 5–18, 22, and 24 hr, p < 0.05. Refer to Figure 2—source data 1 file for p-values at each time-point. (C) Example brightfield images and corresponding EGFP-Plin2 fluorescence images from larvae imaged 10 hr after the onset of the meal. The degree of intestinal opacity reflects the amount of lipid consumed. Scale = 500 µm. (D) EGFP-Plin2 fluorescence intensity of individual larvae 10 hr after the onset of the meal was plotted as a function of the mean gray value of the intestine in the corresponding brightfield image. The amount of lipid consumed (intestine opacity) predicts much of the EGFP-Plin2 fluorescence (simple linear regression, y = –96314x + 130885876, R2 = 0.6828, p < 0.0001).
-
Figure 2—source data 1
Source data associated with Figure 2B and D.
- https://cdn.elifesciences.org/articles/66393/elife-66393-fig2-data1-v2.xlsx
Figure 3
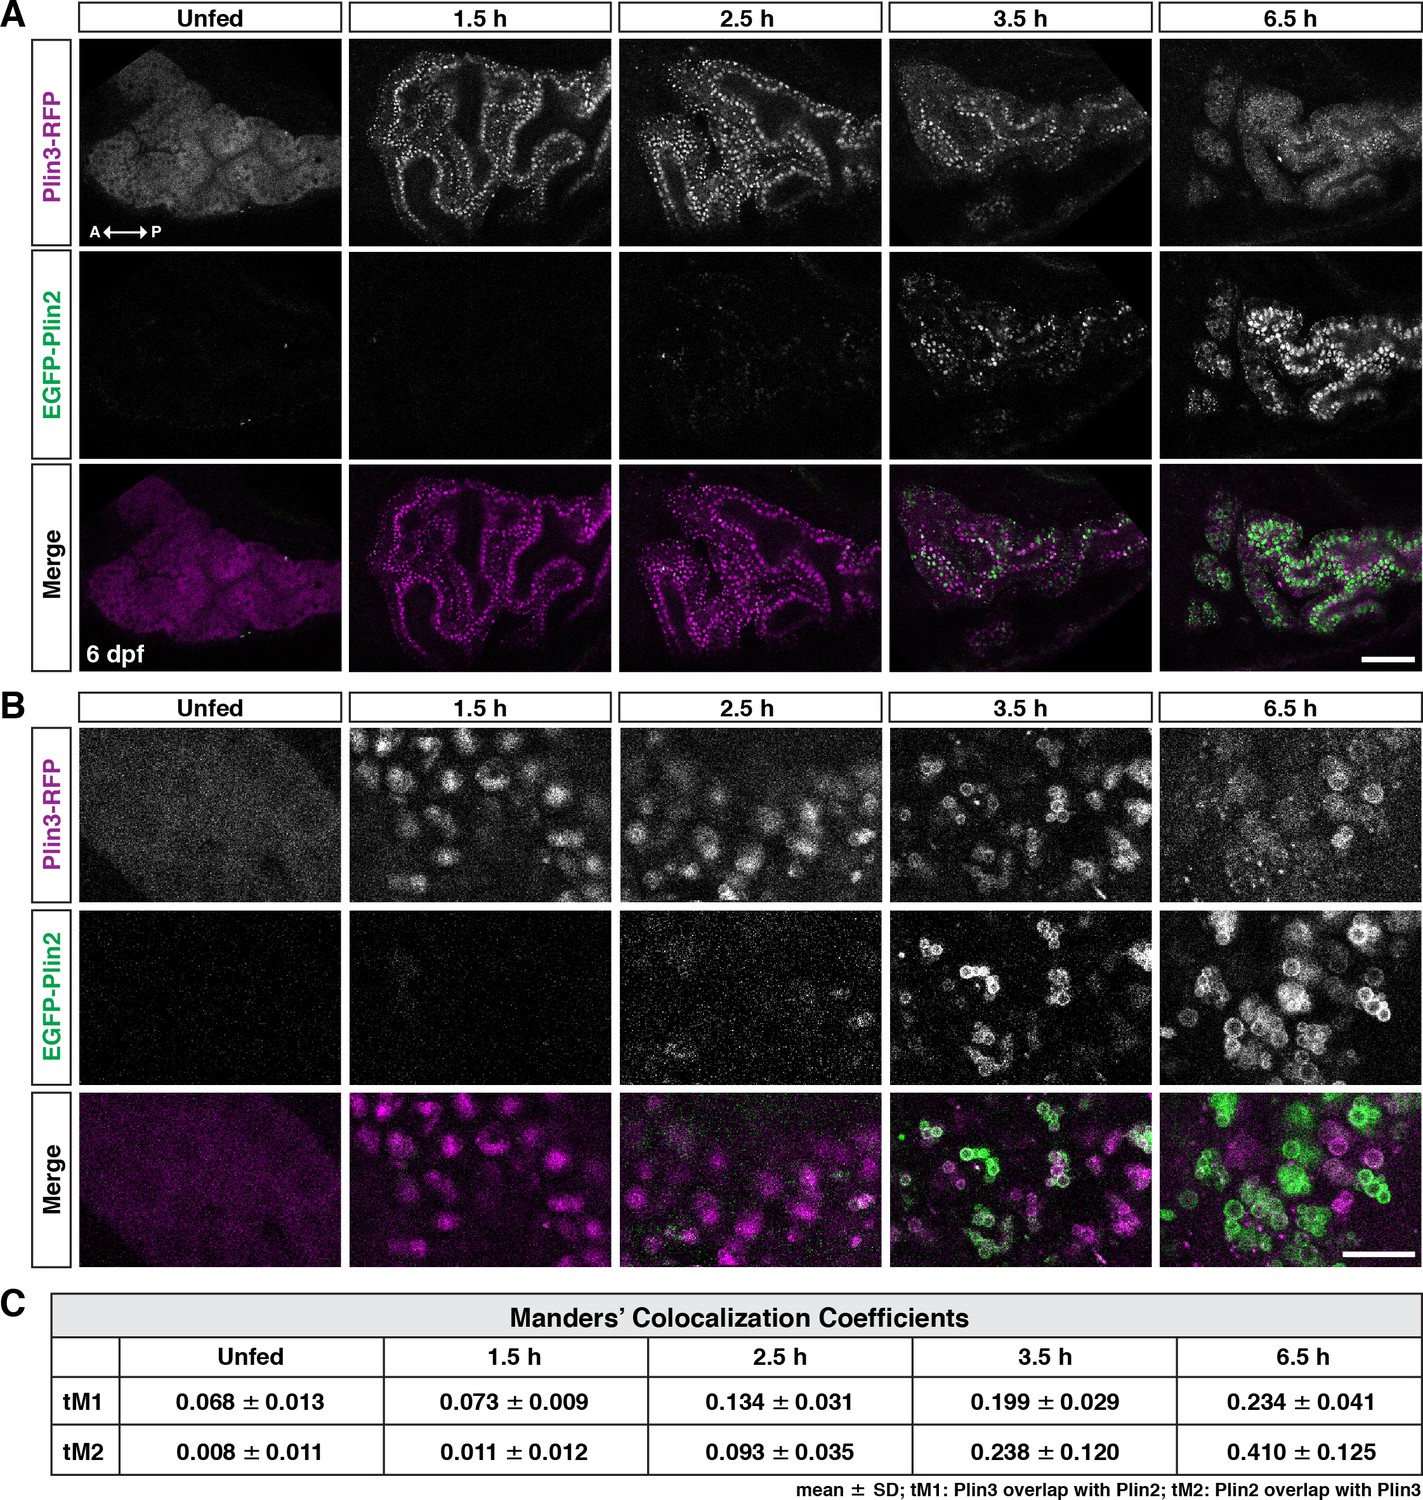
Following a high-fat meal, Plin3-RFP and EGFP-Plin2 show an ordered recruitment to lipid droplets.
(A) Lateral views of the anterior intestine in unfed larvae and in larvae at different time-points following the start of feeding with a high-fat meal for 1 hr. Fish were heterozygous for both Fus(plin3-RFP) and Fus(EGFP-plin2). Images are representative of three independent experiments (15–25 fish per experiment); data presented are from one experiment. Scale = 50 µm. (B) Higher magnification micrographs of lipid droplets highlight the transition from Plin3-RFP to EGFP-Plin2 on the surface of lipid droplets over time after a high-fat meal. Scale = 10 µm. (C) Manders’ colocalization coefficients for a subset of images was quantified following Costes method for automatic thresholding. Mean ± SD, n = 4 fish per time-point.
-
Figure 3—source data 1
Source data associated with Figure 3C.
- https://cdn.elifesciences.org/articles/66393/elife-66393-fig3-data1-v2.xlsx
Figure 4 with 5 supplements
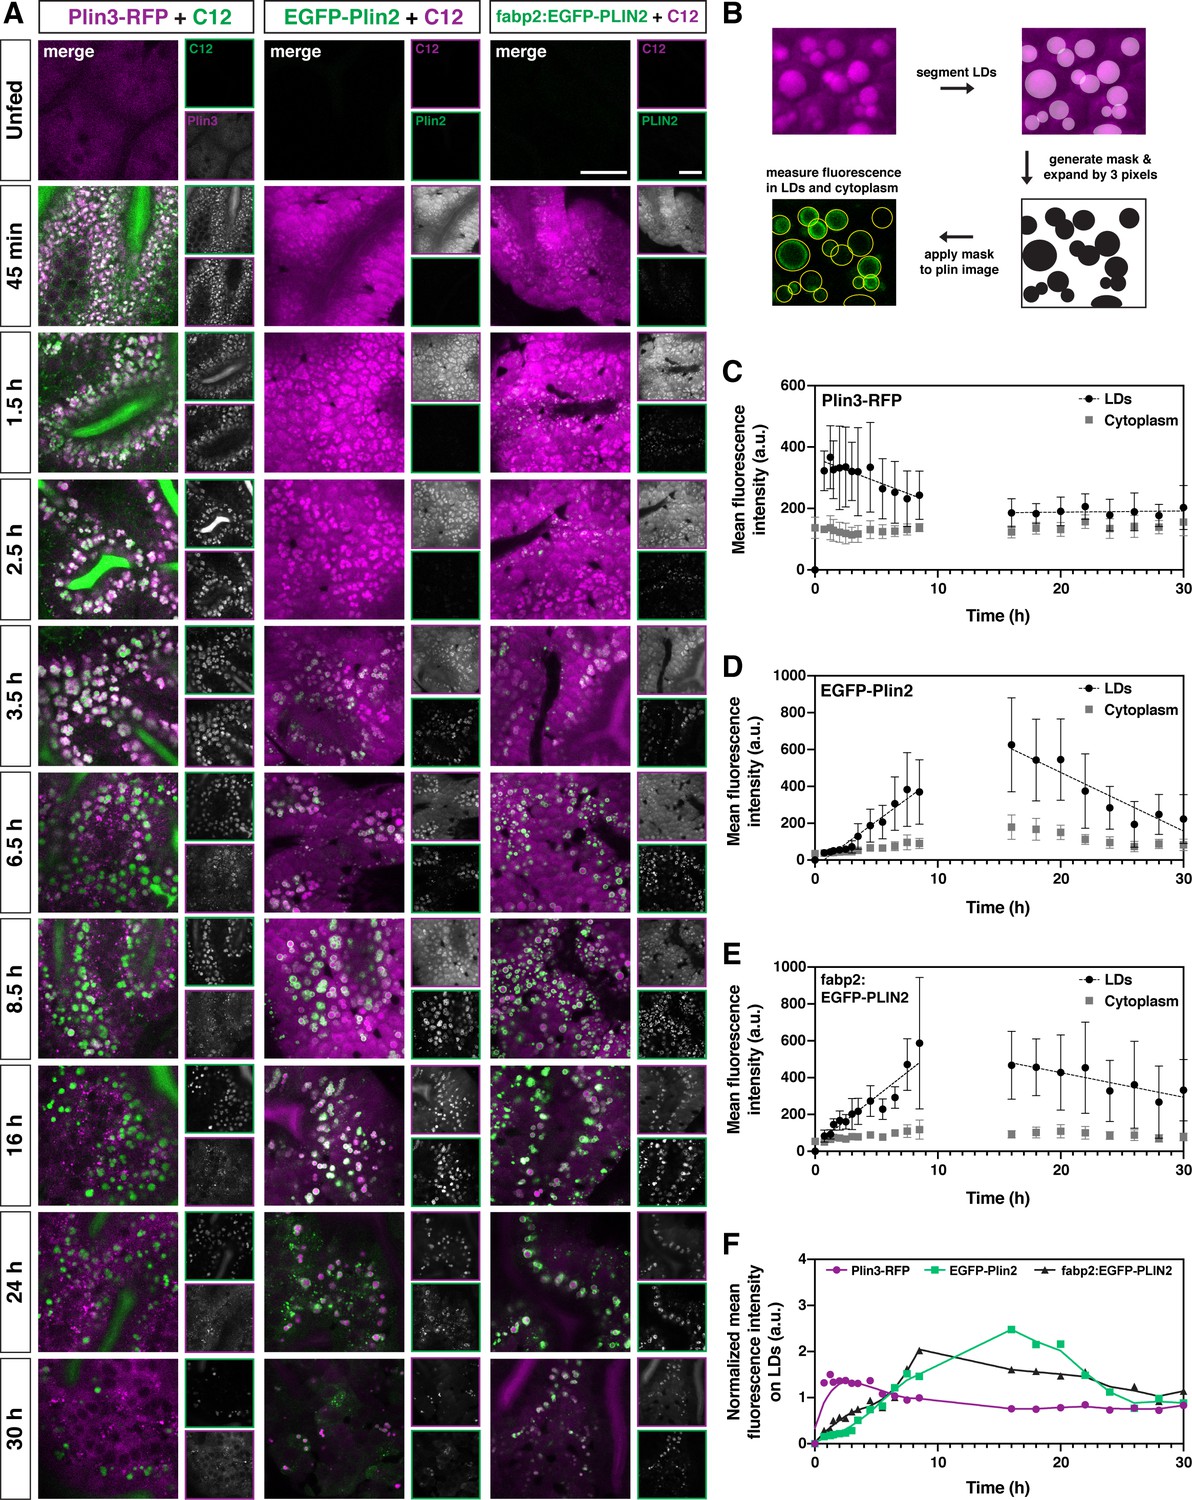
Plin3 labels nascent lipid droplets and is replaced by a coat of Plin2, which remains with the droplets for the remainder of their lifetime.
(A) Representative confocal micrographs of Fus(plin3-RFP)/+, Fus(EGFP-plin2)/+, or Tg(fabp2:EGFP-PLIN2)/+ fish fed a high-fat meal containing either green or red BODIPY C12 fatty acid analog. Fish were fed for a total of 90 min and chased at room temperature for 30 hr after the onset of the meal. Scale = 20 µm. See also Figure 4—video 1, Figure 4—video 2, Figure 4—video 3. (B) Perilipin fluorescence associated with the lipid droplets and in the cytoplasm was assessed by first segmenting the lipid droplets based on the BODIPY C12 signal, the segmented regions were expanded by three pixels in all dimensions (360 nm) to create a mask which was then applied to corresponding Plin fluorescent image. Mean fluorescence intensity was assessed both in the masked regions (LDs) and outside (cytoplasm). (C–E) Mean fluorescence intensity of Plin3-RFP (C), EGFP-Plin2 (D), and over-expressed human EGFP-PLIN2 (E) in the cytoplasm and associated with lipid droplets over time following a high-fat meal (mean ± SD). Data represent two experiments per genotype, each experiment contained larvae from two clutches (n = 9–12 (C), 4–18 (D), and 3–15 (E) fish per time-point). Due to the complexity and length of the time-course, the 0–8.5 and 16–30 hr time-points represent data from different clutches. The linear correlation coefficients (R) for the 0.75–8.5 hr time-points are –0.3266 (y = –15.20x + 364), 0.7732 (y = 48.91x + (–34.40)), and 0.7277 (y = 52.33x + 36.64) for Plin3, Plin2, and PLIN2, respectively. For the 16–30 hr time-points, the R coefficients are 0.0349 (y = 0.3730x + 180.6), –0.6321 (y = –31.84x + 1113), and –0.2865 (y = –13.33x + 693.8) for Plin3, Plin2, and PLIN2, respectively. (F) Data from C, D, and E were normalized based on the overall mean fluorescence from all individual data points for each genotype and plots were overlaid to better show the relationship between genotypes. A LOWESS local regression line was applied to the normalized data-sets for visualization purposes only.
-
Figure 4—source data 1
Source data associated with Figure 4C–F.
- https://cdn.elifesciences.org/articles/66393/elife-66393-fig4-data1-v2.xlsx
Figure 4—figure supplement 1
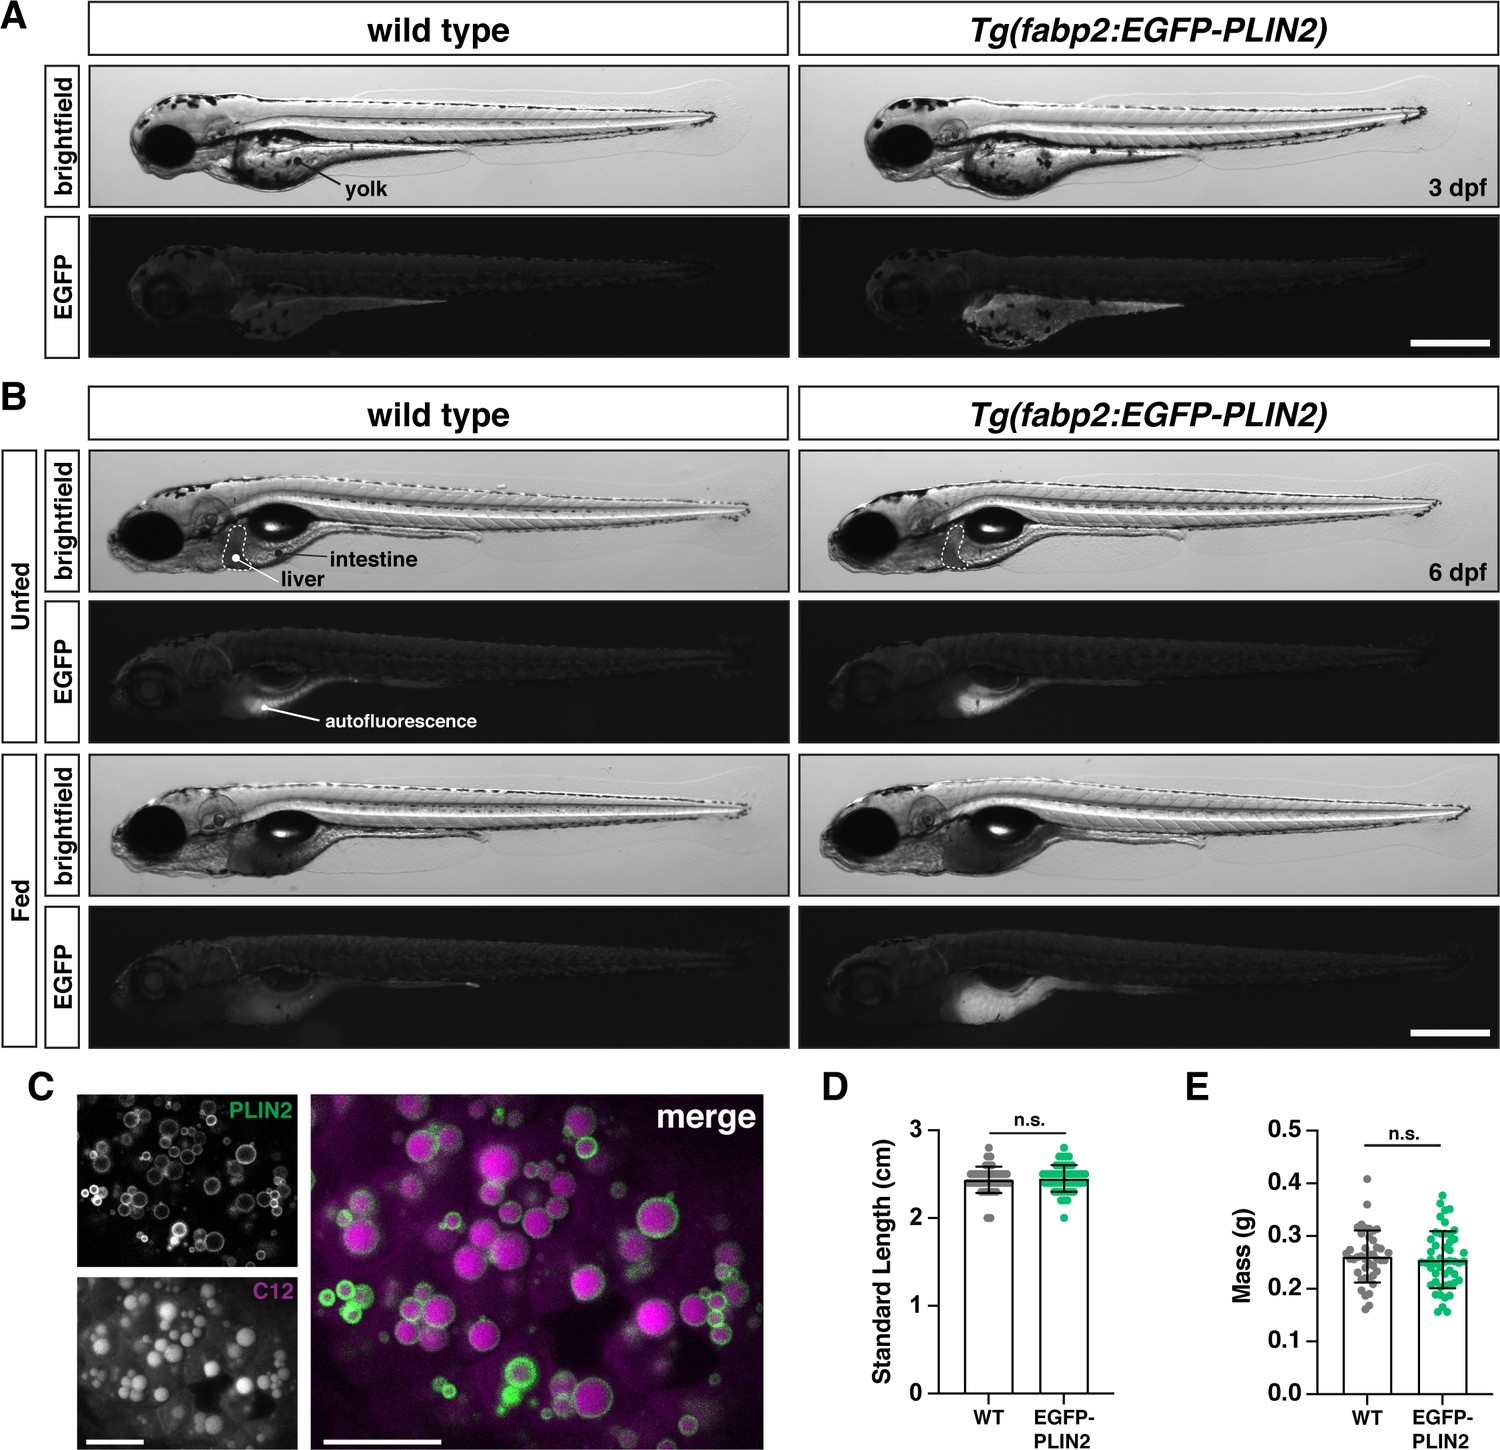
Tg(fabp2:EGFP-PLIN2) fish over-express human PLIN2 in the yolk syncytial layer and intestine.
(A) Representative images of wild-type and transgenic Tg(fabp2:EGFP-PLIN2)/+ fish at 3 days post fertilization (dpf) highlight EGFP-PLIN2 expression in the yolk syncytial layer. Scale = 500 µm. (B) At 6 dpf, EGFP-PLIN2 is only present in transgenic fish fed a high-fat meal. Fish were imaged ~6.5 hr after the onset of feeding. Scale = 500 µm. (C) Confocal micrographs showing EGFP-PLIN2 decorates lipid droplets containing BODIPY C12 558/568 in the intestine following a high-fat meal. Scale = 10 µm. (D and E) Measurements of standard length (D) and mass (E) at 6 months of age reveal no differences between Tg(fabp2:EGFP-PLIN2)/+ fish and wild-type (WT) siblings. Unpaired t tests, n.s. = not significant, p = 0.6318 (length), p = 0.5604 (mass); n = 42 WT fish and 49 Tg(fabp2:EGFP-PLIN2)/+ fish. No significant differences between genotypes were noted when males and females were compared separately.
-
Figure 4—figure supplement 1—source data 1
Source data associated with Figure 4—figure supplement 1D and E.
- https://cdn.elifesciences.org/articles/66393/elife-66393-fig4-figsupp1-data1-v2.xlsx
Figure 4—figure supplement 2

Remaining LD area at 30 hr.
The remaining area occupied by BODIPY-positive lipid droplets at 30 hr after the onset of the meal. Mean ± SD, n = 23 WT, 12 Plin3, 17 Plin2, 9 PLIN2, Kruskal-Wallis test, p = 0.2922.
-
Figure 4—figure supplement 2—source data 1
Source data associated with Figure 4—figure supplement 2.
- https://cdn.elifesciences.org/articles/66393/elife-66393-fig4-figsupp2-data1-v2.xlsx
Figure 4—video 1
Plin3-RFP and BODIPY C12 time series.
Representative confocal micrographs of Fus(plin3-RFP)/+ fish fed a high-fat meal containing green BODIPY FL-C12 fatty acid analog. Fish were fed for a total of 90 min and chased at room temperature for 30 hr after the onset of the meal. Images correspond to those in Figure 4A. Scale = 20 µm.
Figure 4—video 2
EGFP-Plin2 and BODIPY C12 time series.
Representative confocal micrographs of Fus(EGFP-plin2)/+ fish fed a high-fat meal containing red BODIPY 558/568-C12 fatty acid analog. Fish were fed for a total of 90 min and chased at room temperature for 30 hr after the onset of the meal. Images correspond to those in Figure 4A. Scale = 20 µm.
Figure 4—video 3
EGFP-PLIN2 and BODIPY C12 time series.
Representative confocal micrographs of Tg(fabp2:EGFP-PLIN2)/+ fish fed a high-fat meal containing red BODIPY 558/568-C12 fatty acid analog. Fish were fed for a total of 90 min and chased at room temperature for 30 hr after the onset of the meal. Images correspond to those in Figure 4A. Scale = 20 µm.
Figure 5
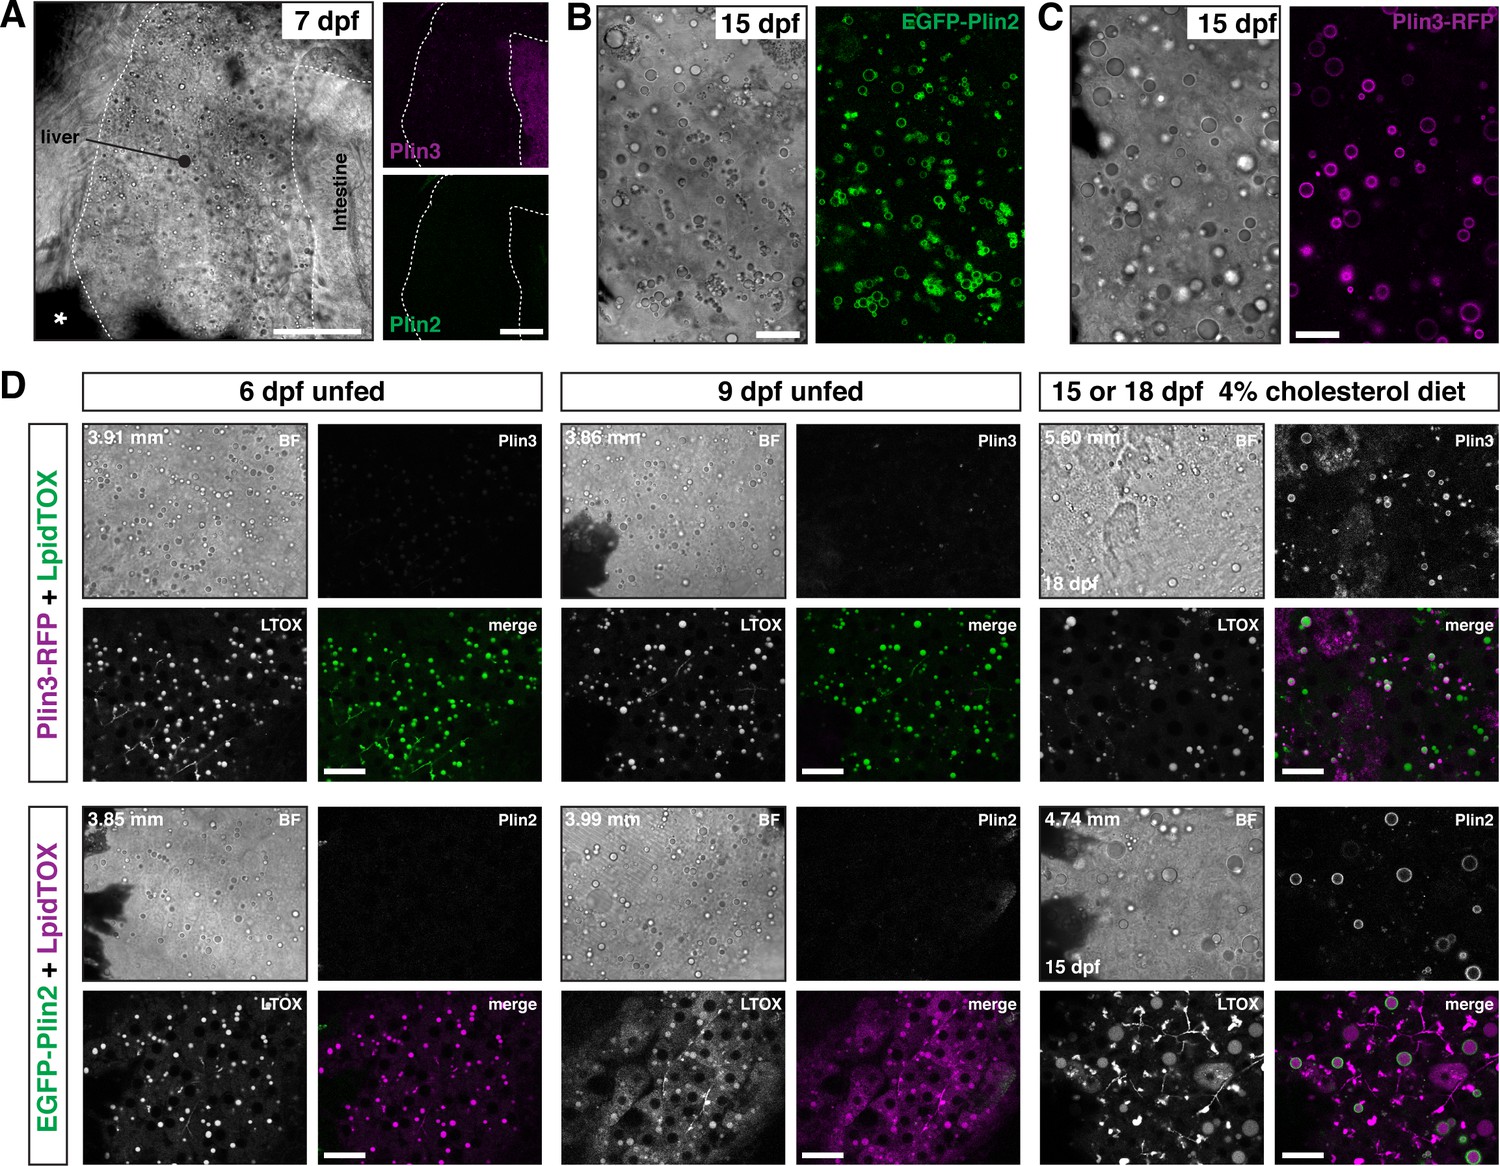
EGFP-Plin2 and Plin3-RFP are only expressed in the liver of older larvae.
(A) Lateral view of the liver in a 7 days post fertilization (dpf) zebrafish larvae heterozygous for both Fus(plin3-RFP) and Fus(EGFP-plin2). Scale = 50 µm. (B, C) Brightfield and fluorescence liver micrographs from 15 dpf larval zebrafish fed a diet of Gemma +4% cholesterol for 10 days. Lipid droplets in hepatocytes can be labeled with EGFP-Plin2 (B) and with Plin3-RFP (C). Scale = 20 µm. (D) Liver micrographs from 6, 9, 15 (Fus(EGFP-plin2)) or 18 dpf (Fus(plin3-RFP)) zebrafish. LipidTox Green or Red (LTOX) labels the hepatic ducts and the lipid droplets, which are also visible in the brightfield image (BF). Where noted, fish were fed a Gemma +4% cholesterol diet starting at 5 dpf. Standard length of the imaged fish is noted on the upper left corner of each set of image, see source data for additional standard length data. Scale = 20 µm. Images are representative of at least 15 fish from three or more clutches.
-
Figure 5—source data 1
Standard length data associated with Figure 5D.
- https://cdn.elifesciences.org/articles/66393/elife-66393-fig5-data1-v2.xlsx
Figure 6 with 1 supplement
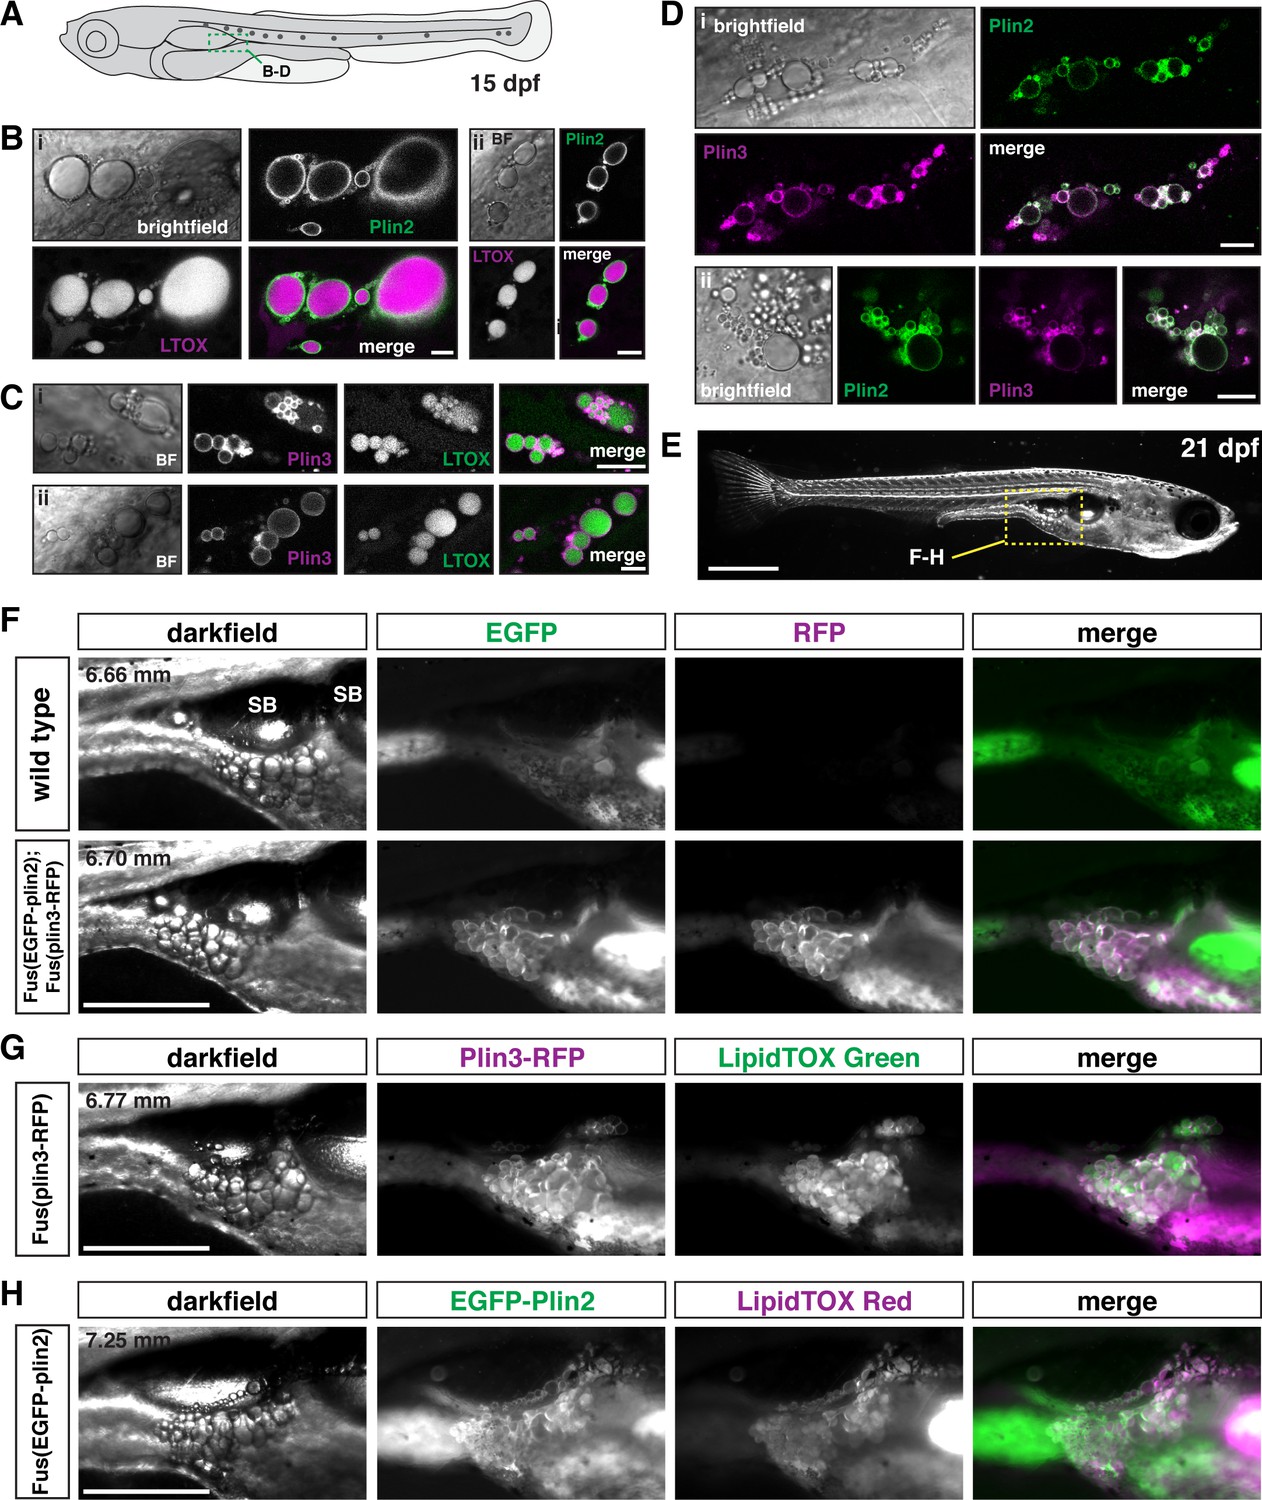
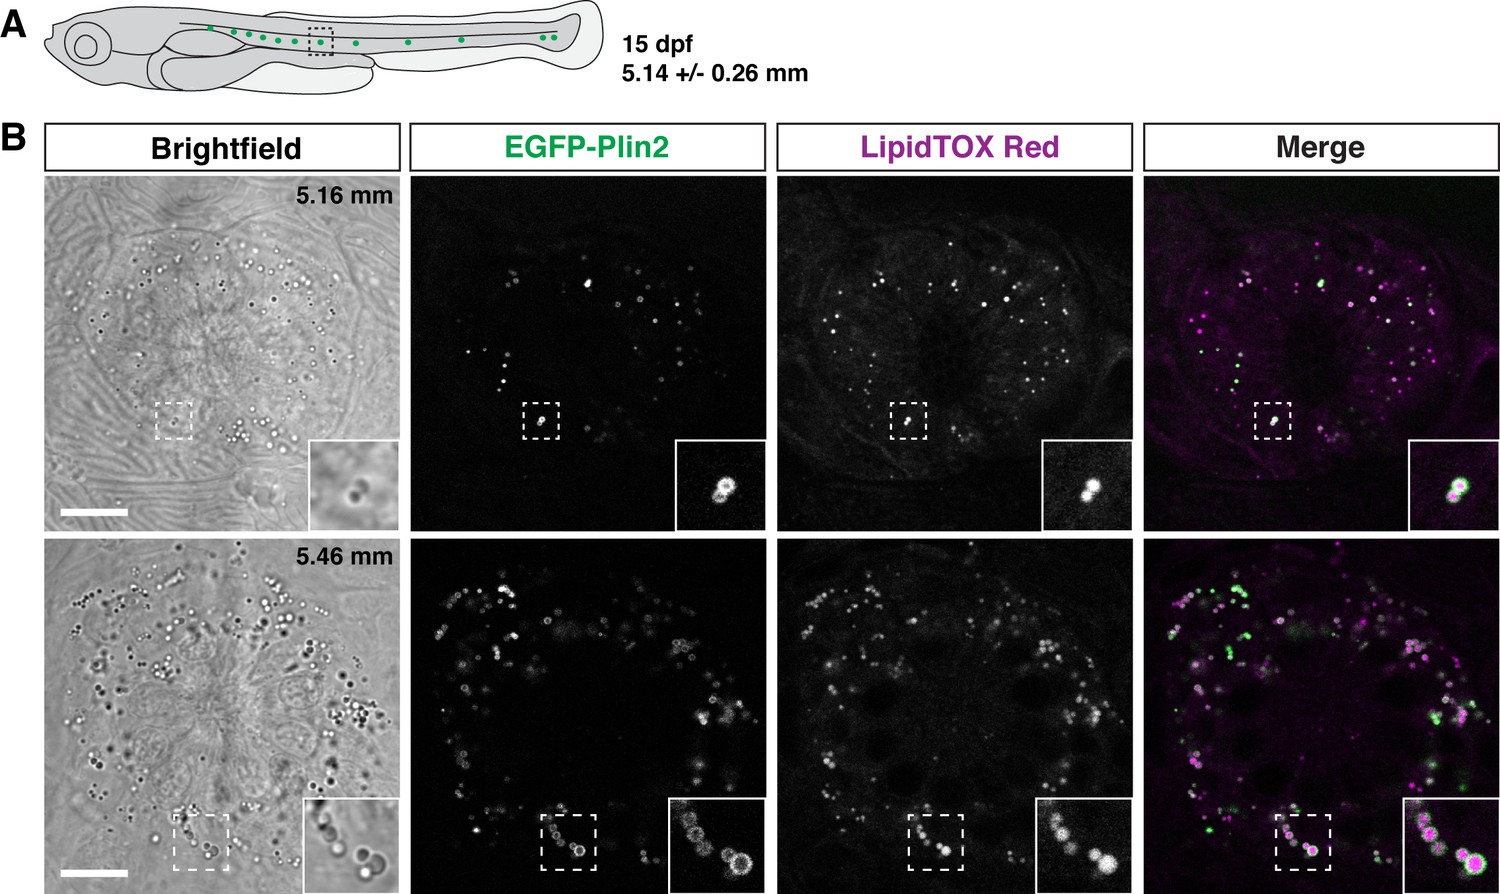
EGFP-Plin2 and Plin3-RFP decorate lipid droplets in visceral adipose tissue.
(A) Cartoon of 15 days of post fertilization (dpf) larval zebrafish showing the general location (green box) of images in panels B–D. (B, C) Examples of Plin-positive adipocyte lipid droplets. Fish heterozygous for the noted transgene were fed Gemma for 10 days and then stained with either LipidTOX Red (B) or Green (C) dyes for a minimum of 2 hr prior to imaging. Scale = 10 µm; standard length of all fish imaged was 5.14 ± 0.26 mm (mean ± SD, n = 47 fish). (D) EGFP-Plin2 and Plin3-RFP co-label the surface of adipocyte lipid droplets. Fish are heterozygous for each transgene and were fed Gemma + 4% cholesterol for 10 days prior to imaging. Scale = 10 µm; standard length of similarly fed double-heterozygous fish at 15 dpf, 5.19 ± 0.42 mm (mean ± SD, n = 14 fish). For B–D, images are representative of at least 10 fish per genotype from three independent clutches. (E) Darkfield whole-mount image of a 21 dpf zebrafish, yellow box indicates region of images in panels F–H; scale = 1 mm. (F) Images of pancreatic visceral adipose tissue/abdominal visceral adipose tissue (PVAT/AVAT) adipose depots in wild type and Fus(EGFP-plin2)/+; Fus(plin3-RFP)/+ fish at 21 dpf. Adipocyte lipid droplets are co-labeled with Plin2 and Plin3. Note the substantial autofluorescence in the EGFP channel in wild-type fish. (G, H) Examples of PVAT/AVAT in either Fus(plin3-RFP)/+ fish stained with LipidTOX Green (G) or Fus(EGFP-plin2)/+ stained with LipidTOX Red (H) to more clearly show the relationship of the Plin fluorescence relative to the lipid content of the droplets. For (F–H), fish were fed standard Gemma diet for 15 days and fasted for 24 hr prior to imaging to decrease the fluorescence in the intestine resulting from both EGFP-Plin2 expression and/or LipidTOX-labeled lipid droplets in enterocytes. Scale = 500 µm; standard length of the fish shown is noted in upper left corner of the darkfield images. Images are representative of 18–27 fish from two independent clutches.
-
Figure 6—source data 1
Standard length data associated with Figure 6B–D.
- https://cdn.elifesciences.org/articles/66393/elife-66393-fig6-data1-v2.xlsx
Figure 6—figure supplement 1
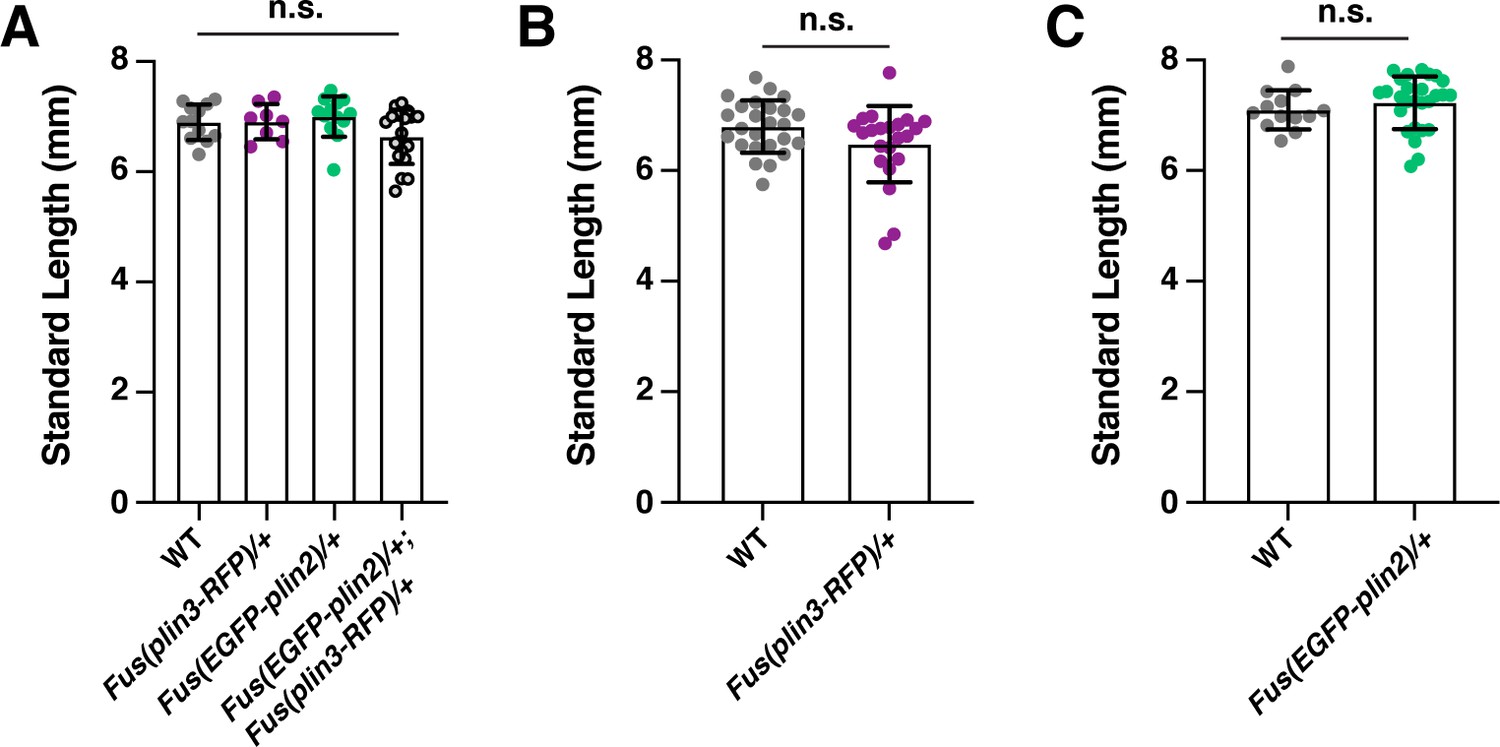
Standard length measurements associated with Figure 6.
(A) Standard length measurements of siblings from two clutches of Fus(EGFP-plin2)/+ × Fus(plin3-RFP)/+ fish, associated with Figure 6F. Mean ± SD, n = 12 wild type (WT), 8 Plin3, 13 Plin2, and 18 Plin2; Plin3 fish, one-way ANOVA, p = 0.0792. (B) Standard length measurements of siblings from two clutches of Fus(plin3-RFP)/+ × WT fish, associated with Figure 6G. Mean ± SD, n = 25 WT, 22 Plin3, unpaired t test, p = 0.0726. (C) Standard length measurements of siblings from two clutches of Fus(EGFP-plin2)/+ × WT fish, associated with Figure 6H. Mean ± SD, n = 13 WT, 27 Plin2, unpaired t test, p = 0.3898.
-
Figure 6—figure supplement 1—source data 1
Source data associated with Figure 6—figure supplement 1.
- https://cdn.elifesciences.org/articles/66393/elife-66393-fig6-figsupp1-data1-v2.xlsx
Figure 7
EGFP-Plin2 decorates lipid droplets in cells surrounding neuromasts.
(A) Cartoon of 15 days of post fertilization (dpf) larval zebrafish showing the general location of lateral line neuromast images shown in panel B. The standard length of larvae imaged at this stage was 5.14 ± 0.26 mm (mean ± SD, n = 47 fish, see Figure 6—source data 1). (B) Examples of lipid droplets around neuromasts in fish heterozygous for Fus(EGFP-plin2) at 15 dpf. Fish were fed Gemma for 10 days and then stained with LipidTOX Red for a minimum of 2 hr prior to imaging. Insets show enlarged images of the lipid droplets in the boxed regions. Scale = 10 µm, standard length of the fish shown is noted in the brightfield image panel. Images are representative of at least 10 fish from three independent clutches.
Figure 8
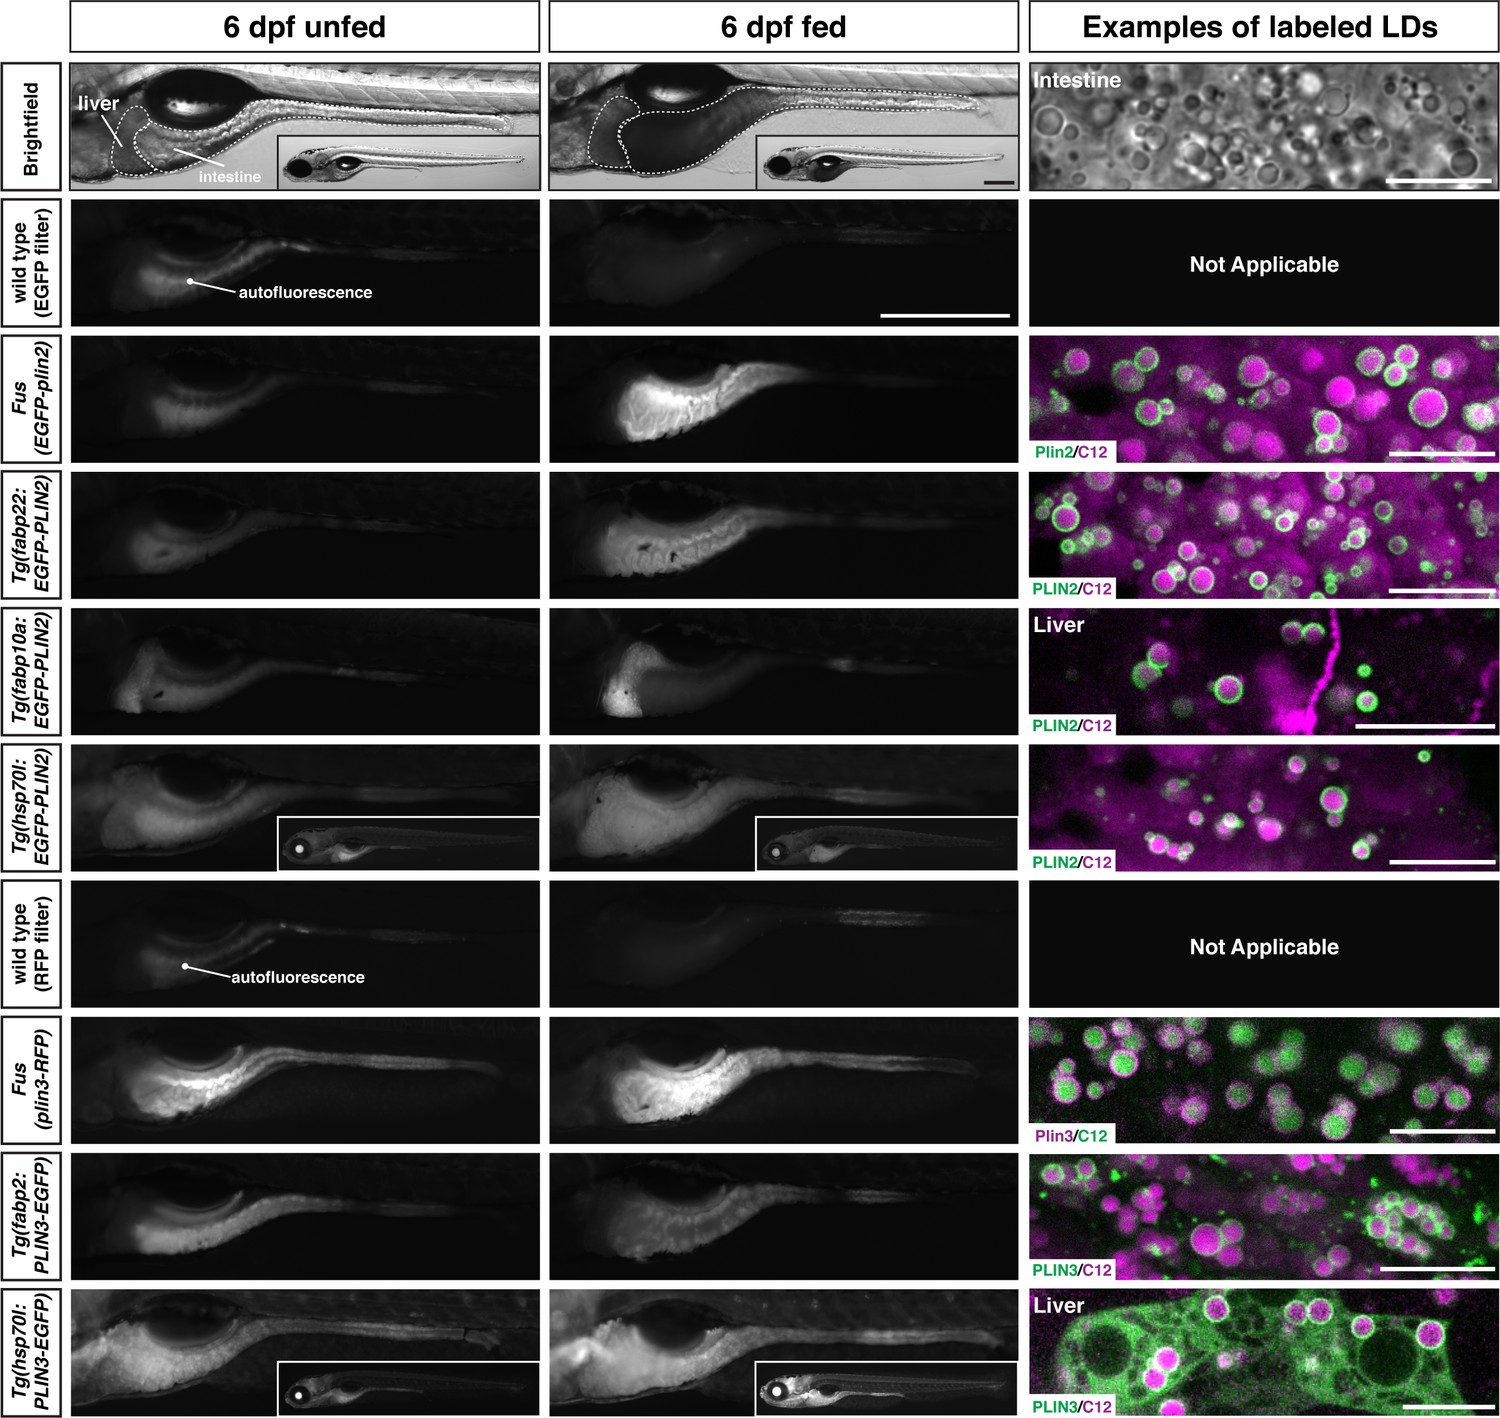
Whole-mount images and examples of perilipin-labeled lipid droplets corresponding to the transgenic zebrafish lines noted in Table 1.
All fish are heterozygous for the noted transgene. Heat shock transgenic lines were incubated at 37°C for 45 min prior to feeding. For whole-mount images, larvae were fed for 2 hr with a high-fat meal and imaged 3–4.5 hr (PLIN3 lines) or 5–8 hr (PLIN2 lines) following the start of the feed. Where appropriate, images of whole fish are included as insets. Scale = 500 µm for main images and insets. In the right column, confocal micrographs are included to show the fluorescent perilipin proteins labeling BODIPY-C12-positive lipid droplets in the various transgenic lines following a high-fat meal. Unless noted, images are from the intestine. Scale = 10 µm for each image. Images are representative of at least 10 fish from three independent clutches.
Tables
Table 1
Comparison of available transgenic perilipin lines.
| Transgenic line | Promoter | Coding sequence | Tissue expression |
|---|---|---|---|
| Fus(EGFP-plin2) | Integration into the endogenous plin2 locus | Zebrafish perilipin 2 ENSDART00000175378.2 | Intestine, liver, adipose, neuromasts, rare LDs in yolk syncytial layer |
| Tg(fabp2:EGFP-PLIN2) | Zebrafish intestinal fatty acid binding protein (fabp2) | Human perilipin 2 ENST00000276914.7 | Yolk syncytial layer, intestine |
| Tg(fabp10a:EGFP-PLIN2) | Zebrafish liver fatty acid binding protein (fabp10a) | Human perilipin 2 ENST00000276914.7 | Liver |
| Tg(hsp70I:EGFP-PLIN2) | Zebrafish heat shock cognate 70-kd protein, like (hsp70l) | Human perilipin 2 ENST00000276914.7 | Widespread tissue expression following heat shock; Labeled LDs observed in intestine and liver |
| Fus(plin3-RFP) | Integration into the endogenous plin3 locus | Zebrafish perilipin 3 ENSDART00000100473.5 | Intestine, liver, adipose; Cytoplasmic in addition to LDs |
| Tg(fabp2:PLIN3-EGFP) | zebrafish intestinal fatty acid binding protein (fabp2) | Human perilipin 3 ENST00000221957.9 | Yolk syncytial layer, intestine; Cytoplasmic in addition to labeled LDs in intestine |
| Tg(hsp70I:PLIN3-EGFP) | Zebrafish heat shock cognate 70-kd protein, like (hsp70l) | Human perilipin 3 ENST00000221957.9 | Widespread tissue expression following heat shock; often mosaic; Cytoplasmic in addition to labeled LDs in intestine and liver |
Appendix 1—key resources table
| Reagent type (species) or resource | Designation | Source or reference | Identifiers | Additional information |
|---|---|---|---|---|
| gene (Danio rerio) | plin2 | Ensembl GRCz11 | ENSDARG00000042332; plin2-203 ENSDART00000175378.2 | |
| gene (Danio rerio) | zgc:77,486(plin3) | Ensembl GRCz11 | ENSDARG00000013711; zgc:77,486 ENSDART00000100473.5 | |
| Gene (Homo sapiens) | PLIN2 | Ensembl GRCh38.p13 | ENSG00000147872; PLIN2-201 ENST00000276914.7 | |
| Gene (Homo sapiens) | PLIN3 | Ensembl GRCh38.p13 | ENSG00000105355; PLIN3-201 PLIN3-201 ENST00000221957.9 | |
| Strain, strain background (Danio rerio) | AB | Zfin | ZDB-GENO-960809–7 | |
| Strain, strain background (Danio rerio) | Fus(EGFP-plin2) | This paper | Available on request from Steven Farber | |
| Strain, strain background (Danio rerio) | Fus(plin3-RFP) | This paper | Available on request from Steven Farber | |
| Strain, strain background (Danio rerio) | Tg(fabp2:EGFP-PLIN2) | This paper | Zebrafish fabp2 promoter, human PLIN2 coding sequence; Available on request from Steven Farber | |
| Strain, strain background (Danio rerio) | Tg(fabp10a: EGFP-PLIN2) | This paper | Zebrafish fabp10a promoter, human PLIN2 coding sequence; Available on request from Steven Farber | |
| Strain, strain background (Danio rerio) | Tg(hsp70l: EGFP-PLIN2) | This paper | Zebrafish hsp70l promoter, human PLIN2 coding sequence; Available on request from Steven Farber | |
| Strain, strain background (Danio rerio) | Tg(fabp2:PLIN3-EGFP) | This paper | Zebrafish fabp2 promoter, human PLIN3 coding sequence; Available on request from Steven Farber | |
| Strain, strain background (Danio rerio) | Tg(hsp70: PLIN3-EGFP) | This paper | Zebrafish hsp70l promoter, human PLIN3 coding sequence; Available on request from Steven Farber | |
| Recombinant DNA reagent | pCRII(plin3_900)(plasmid) | This paper | Zebrafish plin3 (zgc:77486) cDNA clone for in situ probe; Available on request from Steven Farber | |
| Recombinant DNA reagent | pCRII(plin2)(plasmid) | This paper | Zebrafish plin2 cDNA clone for in situ probe; Available on request from Steven Farber | |
| Recombinant DNA reagent | Pk-GoldyTal(plin2 Pair 1 LeftTAL 1)(plasmid) | This paper | TALEN targets: TTTCTGCTAACATGG; Available on request from Steven Farber | |
| Recombinant DNA reagent | Pk-GoldyTal(plin2 Pair 1 RightTAL 2)(plasmid) | This paper | TALEN target: AAATAACCAGGTTTGCC; Available on request from Steven Farber | |
| Recombinant DNA reagent | Pk-GoldyTal(plin2 Pair 2 LeftTAL 1)(plasmid) | This paper | TALEN target: TTTCTGCTAACATGGGT; Available on request from Steven Farber | |
| Recombinant DNA reagent | Pk-GoldyTal(plin2 Pair 2 RightTAL 2)(plasmid) | This paper | TALEN target: AATAACCAGGTTTGCC; Available on request from Steven Farber | |
| Recombinant DNA reagent | Pk-GoldyTal(plin3 Pair 1 LeftTAL 1) (plasmid) | This paper | TALEN target: TTGCGCCTCAGATAAC; Available on request from Steven Farber | |
| Recombinant DNA reagent | Pk-GoldyTal(plin3 Pair 1 RightTAL 2) (plasmid) | This paper | TALEN target: AATTGCCACACAACCT; Available on request from Steven Farber | |
| Recombinant DNA reagent | Pk-GoldyTal(plin3 Pair 2 LeftTAL 1) (plasmid) | This paper | TALEN target:CAGATAACAGAGAAA; Available on request from Steven Farber | |
| Recombinant DNA reagent | Pk-GoldyTal(plin3 Pair 2 RightTAL 2) (plasmid) | This paper | TALEN target:CACACAACCTAAATA; Available on request from Steven Farber | |
| Recombinant DNA reagent | pKT3Ts-goldyTALEN vector | Welker et al., 2016 | Addgene plasmid #80330; RRID:Addgene_80330 | |
| Recombinant DNA reagent | FusX TALEN assembly system | Ma et al., 2013; Ma et al., 2016 | Addgene kit #1000000063 | |
| Recombinant DNA reagent | pDestTol2Pa2(plasmid) | Kwan et al., 2007 | Plasmid #394 | http://tol2kit.genetics.utah.edu |
| Recombinant DNA reagent | P4-P1R_zPLIN2_5’UTR(plasmid) | This paper | 5’ entry plasmid for left homology arm of pDestTol2Pa2(EGFP-plin2) donor plasmid V2; Available on request from Steven Farber | |
| Recombinant DNA reagent | pME-EGFP no stop 12aa linker(plasmid) | This paper | EGFP middle entry plasmid for pDestTol2Pa2(EGFP-plin2) donor plasmid V2Includes strong zebrafish kozak sequence; Available on request from Steven Farber | |
| Recombinant DNA reagent | P3R-P3-zPLIN2_1–900 | This paper | 3’ entry plasmid for right homology arm of pDestTol2Pa2(EGFP-plin2) donor plasmid V2; Available on request from Steven Farber | |
| Recombinant DNA reagent | pDestTol2Pa2(EGFP-plin2) donor plasmid V2 | This paper | Donor plasmid for creation of Fus(EGFP-plin2) fish | |
| Recombinant DNA reagent | P4-P1R_zPLIN3_last679 | This paper | 5’ entry plasmid for left homology arm of pDestTol2Pa2(PLIN3-RFP); Available on request from Steven Farber | |
| Recombinant DNA reagent | tagRFP-t coding sequence | Horstick et al., 2015 | Modified for zebrafish from Addgene #61390 | |
| Recombinant DNA reagent | pME-tagRFP-t (plasmid) | This paper | Middle entry plasmid for pDestTol2Pa2(PLIN3-RFP); Available on request from Steven Farber | |
| Recombinant DNA reagent | P2R_P3_zPLIN3_3’UTR | This paper | 3’ entry plasmid for right homology arm of pDestTol2Pa2(PLIN3-RFP); Available on request from Steven Farber | |
| Recombinant DNA reagent | pDestTol2Pa2(plin3-RFP) donor plasmid | This paper | Donor plasmid for creation of Fus(plin3-RFP) fish; Available on request from Steven Farber | |
| Recombinant DNA reagent | pDestTol2Pa2(fabp2: EGFP-PLIN2)(plasmid) | This paper | Zebrafish fabp2 promoter, human PLIN2 coding sequence; Available on request from Steven Farber | |
| Recombinant DNA reagent | pDestTol2Pa2(fabp10a: EGFP-PLIN2)(plasmid) | This paper | Zebrafish fabp10a promoter, human PLIN2 coding sequence; Available on request from Steven Farber | |
| Recombinant DNA reagent | pDestTol2Pa2(hsp70l: EGFP-PLIN2)(plasmid) | This paper | Zebrafish hsp70l promoter, human PLIN2 coding sequence; Available on request from Steven Farber | |
| Recombinant DNA reagent | pDestTol2Pa2(fabp2: PLIN3-EGFP)(plasmid) | This paper | Zebrafish fabp2 promoter, human PLIN3 coding sequence; Available on request from Steven Farber | |
| Recombinant DNA reagent | pDestTol2Pa2(hsp70l: PLIN3-EGFP)(plasmid) | This paper | Zebrafish hsp70l promoter, human PLIN3 coding sequence; Available on request from Steven Farber | |
| Recombinant DNA reagent | pGFP-hADRP(plasmid)(plasmid) | Targett-Adams et al., 2003 | Human PLIN2 coding sequence (Alternative name ADRP) in pEGFP-C1 vector | |
| Recombinant DNA reagent | pCR8(pGFP-hADRP)(plasmid) | This paper | Human PLIN2 coding sequence (Alternative name ADRP); Available on request from Steven Farber | |
| Recombinant DNA reagent | pDNR-Dual(h Perilipin 3) (plasmid)(TIP47) | FLEXgene Repository (Harvard Medical School) | Clone ID:HsCD00004695 | Human PLIN3 coding sequence Alternative name: TIP47 |
| Recombinant DNA reagent | pCR8(Perilipin3)(TIP47)(plasmid) | This paper | Middle entry plasmid, Human PLIN3 coding sequence Alternative name: TIP47; Available on request from Steven Farber | |
| Recombinant DNA reagent | Zebrafish fabp2 promoterp5E fabp2 (–2.3 kb) fabp2 (plasmid) | Park et al., 2019 | 5’ entry plasmid, zebrafish fabp2 (ifabp) promoter sequence | |
| Recombinant DNA reagent | p5E fabp10a, (–2.8 kb) | Her et al., 2003 | zebrafish fabp10a (lfabp) promoter sequence | |
| Recombinant DNA reagent | p5E-hsp70lheat shock cognate 70 kDa protein, like | Kwan et al., 2007 | Plasmid #222 | http://tol2kit.genetics.utah.edu |
| Recombinant DNA reagent | p3E-EGFPpA | Kwan et al., 2007 | Plasmid #366 | http://tol2kit.genetics.utah.edu |
| Recombinant DNA reagent | pME-EGFP no stop | Kwan et al., 2007 | Plasmid #455 | http://tol2kit.genetics.utah.edu |
| Recombinant DNA reagent | p3E-polyA | Kwan et al., 2007 | Plasmid #302 | http://tol2kit.genetics.utah.edu |
| Sequence-based reagent | PCR primers | This paper | Please refer to Supplementary file 1 | |
| Commercial assay or kit | T3 Message Machine kit | Thermo Fisher Scientific | Catalog #AM1348 | |
| Commercial assay or kit | DIG RNA labelling kit | Roche | Catalog#11277073910 | |
| Other | T7 polymerase | Roche | Catalog #10881767001 | |
| Other | SP6 polymerase | Roche | Catalog #10810274001 | |
| Commercial assay or kit | TA Cloning Kit, Dual Promoter, with pCRII-TOPO vector | Thermo Fisher Scientific | Catalog # K207020 | |
| Commercial assay or kit | REDExtract-N-Amp Tissue PCR kit | Sigma-Aldrich | Catalog #XNAT | |
| Commercial assay or kit | RNA Clean and Concentrator Kit | Zymo Research | Catalog #R1013 | |
| Commercial assay or kit | iScript cDNA Synthesis Kit | Bio-Rad Laboratories, Inc. | Catalog #1708891 | |
| Commercial assay or kit | SsoAdvanced Universal SYBR Green Supermix | Bio-Rad Laboratories, Inc. | Catalog #1725271 | |
| Commercial assay or kit | MultiSite gateway assembly system | Invitrogen | Catalog #12537–023 | |
| Commercial assay or kit | pCR8/GW/TOPO TA cloning kit | Thermo FisherScientific | Catalog # K250020 | |
| Other | BODIPY (558/568)-C12 | Thermo Fisher Scientific | Catalog #D3835 | 4 µg/ml |
| Other | BODIPY FL-C12 | Thermo Fisher Scientific | Catalog #D3822 | 4 µg/ml |
| Other | Cholesterol | Sigma-Aldrich | Catalog#C8667 | 4% w/w |
| Other | HSC LipidTOX Green | Thermo Fisher Scientific | Catalog #H34475 | 1:5,000 |
| Other | HSC LipidTOX Red | Thermo Fisher Scientific | Catalog #H34476 | 1:5,000 |
| Other | RNAlater | Thermo Fisher Scientific | Catalog # AM7020 | |
| Other | FokI restriction enzyme | New England Biolabs | Catalog # R0109 | |
| Other | HphI restriction enzyme | New England Biolabs | Catalog # R0158 | |
| Other | Gemma Micro 75, 150 & 500 | Skretting | Zebrafish diet | |
| Software, algorithm | Mojo Hand design tool | Neff et al., 2013 | ||
| Software, algorithm | Fiji | Schindelin et al., 2012 | (Fiji, RRID:SCR_002285) | |
| Software, algorithm | ilastik | Berg et al., 2019 | Ilastik, RRID:SCR_015246 | |
| Software, algorithm | GraphPad Prism 9 | GraphPad | GraphPad Prism, RRID:SCR_002798 |
Additional files
-
Supplementary file 1
Primers used in this study.
- https://cdn.elifesciences.org/articles/66393/elife-66393-supp1-v2.docx
-
Transparent reporting form
- https://cdn.elifesciences.org/articles/66393/elife-66393-transrepform1-v2.docx
Download links
A two-part list of links to download the article, or parts of the article, in various formats.
Downloads (link to download the article as PDF)
Open citations (links to open the citations from this article in various online reference manager services)
Cite this article (links to download the citations from this article in formats compatible with various reference manager tools)
Imaging cytoplasmic lipid droplets in vivo with fluorescent perilipin 2 and perilipin 3 knock-in zebrafish
eLife 10:e66393.
https://doi.org/10.7554/eLife.66393


