Regulation of Nodal signaling propagation by receptor interactions and positive feedback
- Friedrich Miescher Laboratory of the Max Planck Society, Germany
- University of Konstanz, Germany
Figures
Figure 1 with 1 supplement
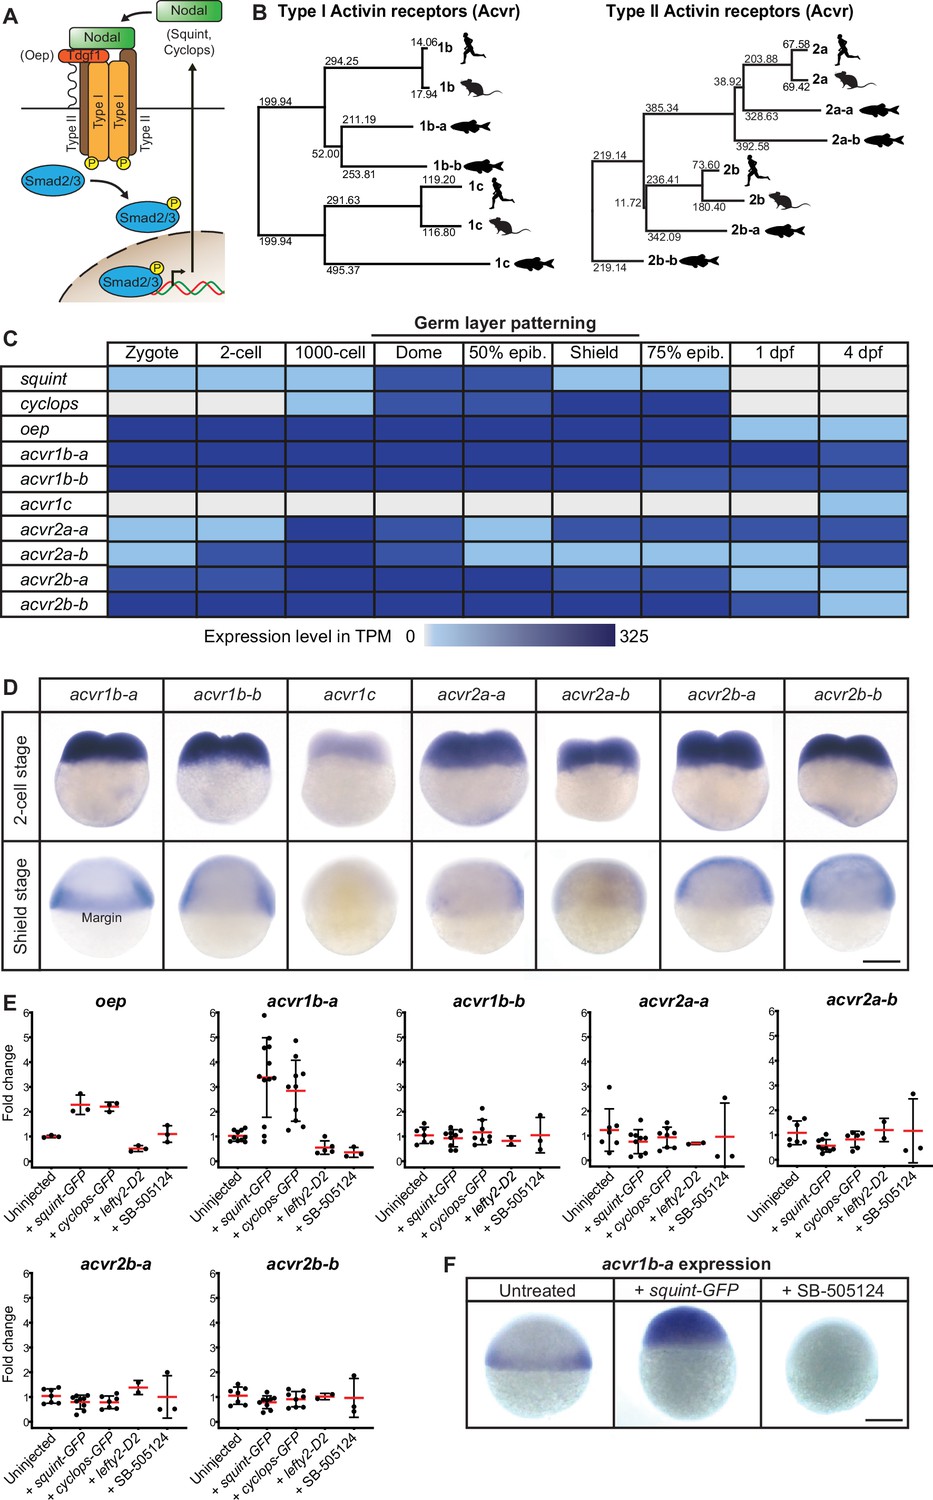
Multiple Nodal receptor candidates are expressed during early zebrafish development.
(A) In the classical model, Nodal signaling requires the recruitment of a receptor complex comprising the co-receptor Oep (Tdgf1 homolog) as well as Type I and Type II Activin receptors (Acvr) to induce phosphorylation and nuclear translocation of the signal transducer pSmad2/3 for the induction of Nodal target genes. (B) Phylogenetic neighbor-joining alignment tree of Type I and Type II receptor protein sequences from human, mouse, and zebrafish. Bootstrap values are listed at the nodes and indicate evolutionary distances. (C) Temporal expression analysis of putative Nodal receptors at different developmental stages. TPM: Transcripts per million. dpf: day(s) post-fertilization. Data adapted from White et al., 2017. (D) Spatial expression analysis of Type I and Type II receptors at 2 cell and shield stages revealed by in situ hybridization. Except for acvr1c, all receptor-encoding transcripts are maternally deposited. At shield stage, acvr1b-a is the only receptor that is not uniformly expressed but restricted to the embryonic margin. (E) Nodal signaling controls the expression of acvr1b-a and oep. Fold change of Nodal receptor expression calculated from qRT-PCR experiments comparing the overexpression of 30 pg squint-GFP mRNA, 30 pg cyclops-GFP mRNA, 30 pg lefty2-Dendra2 mRNA and exposure to 50 μM SB-505124 Nodal inhibitor to untreated embryos at 6 hours post-fertilization (hpf). Each point is the mean fold change of an individual embryo compared to an untreated embryo. Error bars represent standard deviation. (F) In situ hybridization analysis of acvr1b-a with increased (+squint GFP) or decreased (+SB-505124) Nodal signaling. Scale bar represents 250 µm. See the Figure 1—source data 1 file for source data and sample size.
-
Figure 1—source data 1
Source data for Figure 1.
- https://cdn.elifesciences.org/articles/66397/elife-66397-fig1-data1-v3.xlsx
Figure 1—figure supplement 1
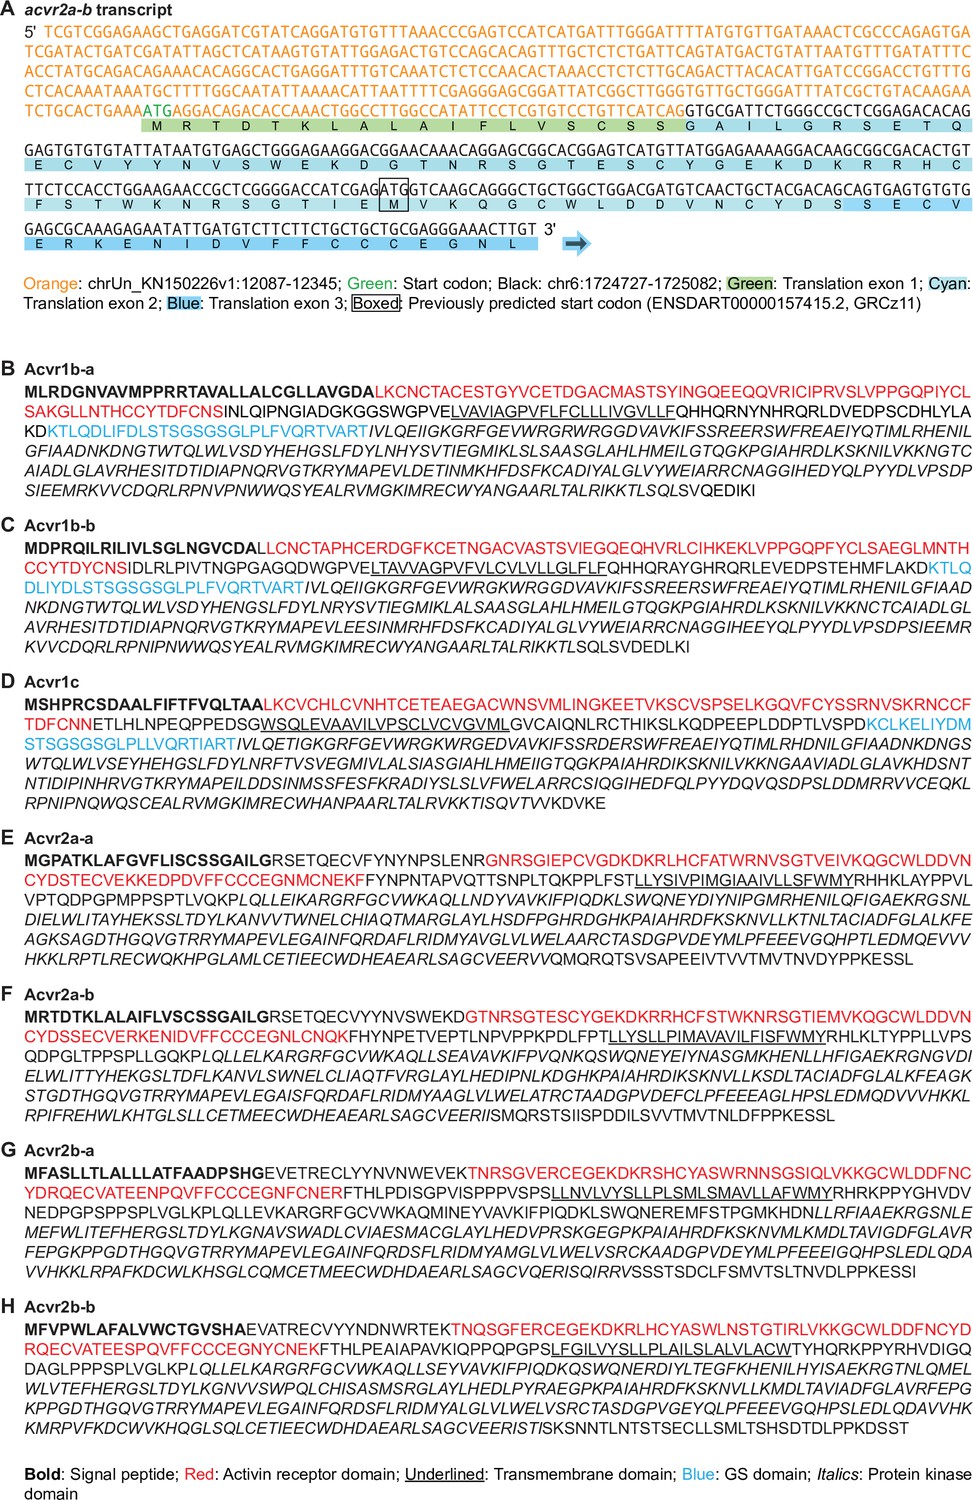
Sequences and protein domains of putative Nodal receptors.
(A) DNA sequence of the start of the acvr2a-b transcript as identified experimentally using 5’RACE. The DNA sequence of the 5’ UTR and exon 1 mapping to chrUn_KN150226v1 are colored in orange, with the start codon colored in green. The remaining DNA sequence is colored black, with the previously predicted start codon boxed. The translation of exon 1, exon 2, and exon 3 are highlighted in green, cyan, and blue, respectively. (B–H) Amino acid sequences of the putative Nodal receptors Acvr1b-a, Acvr1b-b, Acvr1c, Acvr2a-a, Acvr2a-b, Acvr2b-a, and Acvr2b-b. The signal peptide is marked in bold, the activin receptor domain in red, the transmembrane domain is underlined, the GS domain is marked in blue, and the protein kinase domain is shown in italics.
Figure 2 with 3 supplements
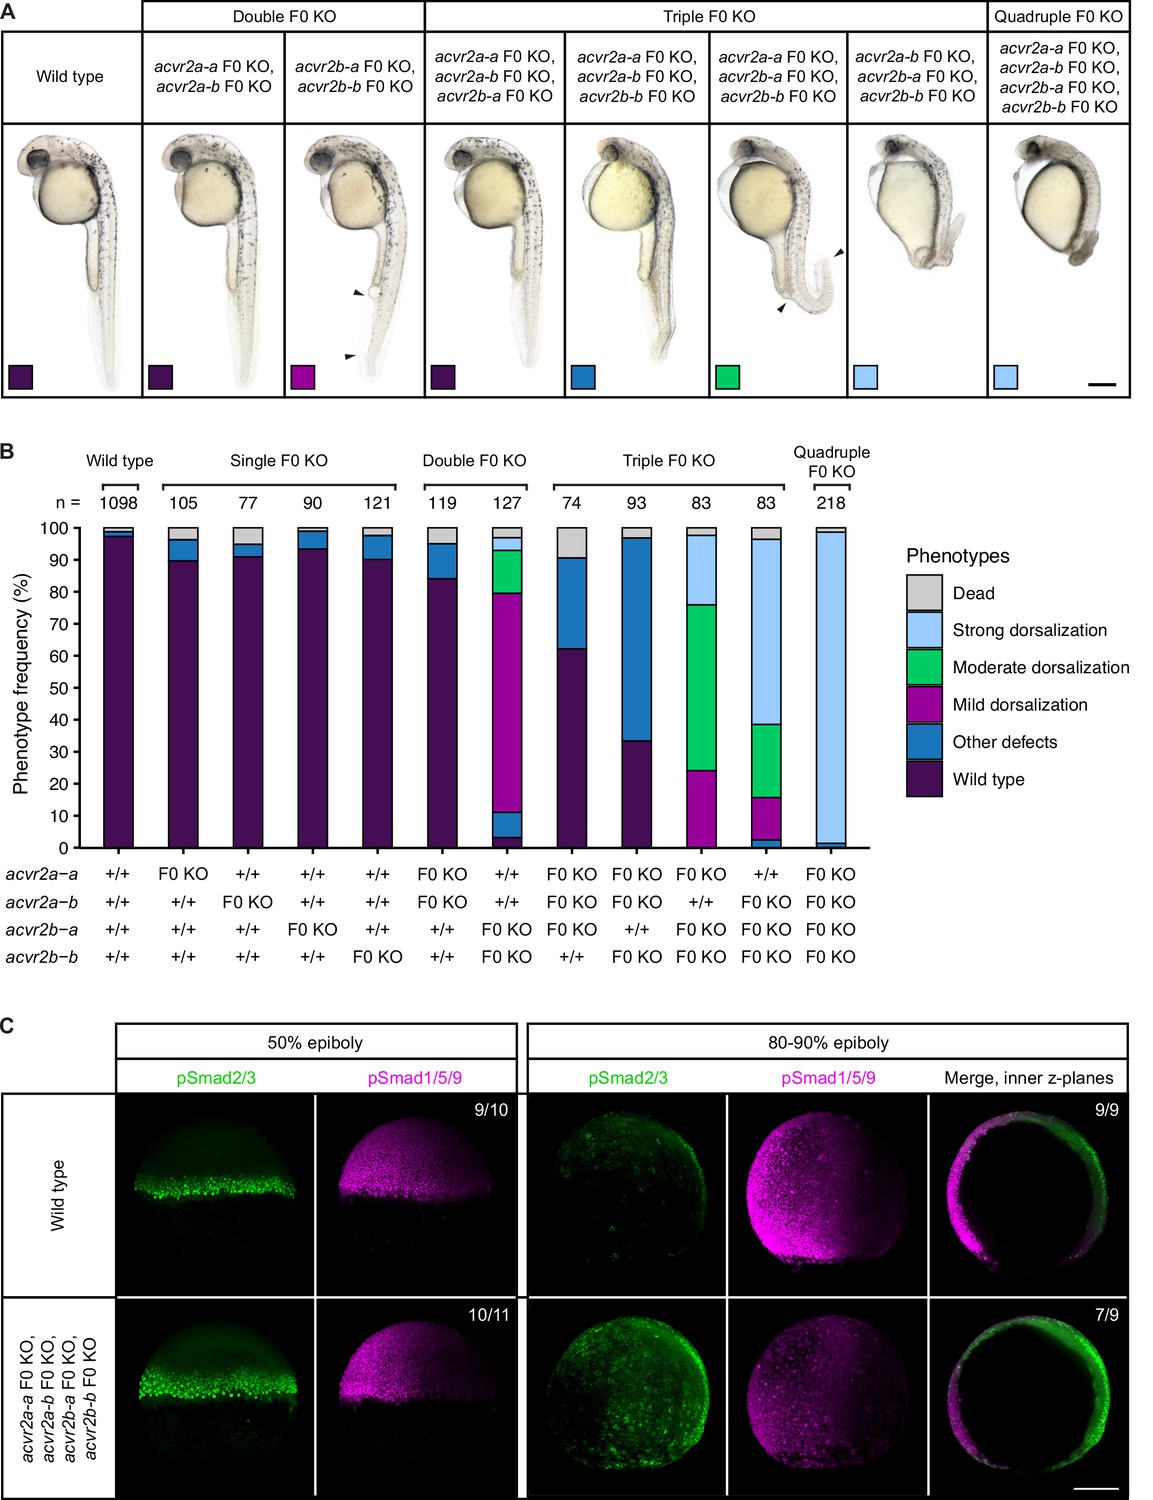
Combinatorial removal of putative Type II Nodal receptors causes dorsal-ventral patterning defects.
(A–B) Phenotypes of embryos upon single, double, triple, and quadruple CRISPR F0 KO of acvr2 receptors. (A) Lateral view of embryos of the indicated condition approximately 28–31 hpf. Arrowheads indicate the extent of ventral fin loss. Boxes indicate the phenotype class according to the scheme presented in (B). Scale bar represents 250 µm. (B) Frequency of phenotypes observed in embryos of the indicated condition at 1 dpf. n indicates the number of analyzed embryos. (C) Nodal and BMP signaling visualized by pSmad2/3 and pSmad1/5/9 immunostaining, respectively, in wild-type and quadruple acvr2 F0 KO embryos at 50% and 80–90% epiboly. Maximum intensity projections show lateral views with dorsal to the right. The number of embryos with the presented phenotype is indicated. Scale bar represents 200 µm. See the Figure 2—source data 1 file for source data.
-
Figure 2—source data 1
Source data for Figure 2.
- https://cdn.elifesciences.org/articles/66397/elife-66397-fig2-data1-v3.xlsx
Figure 2—figure supplement 1
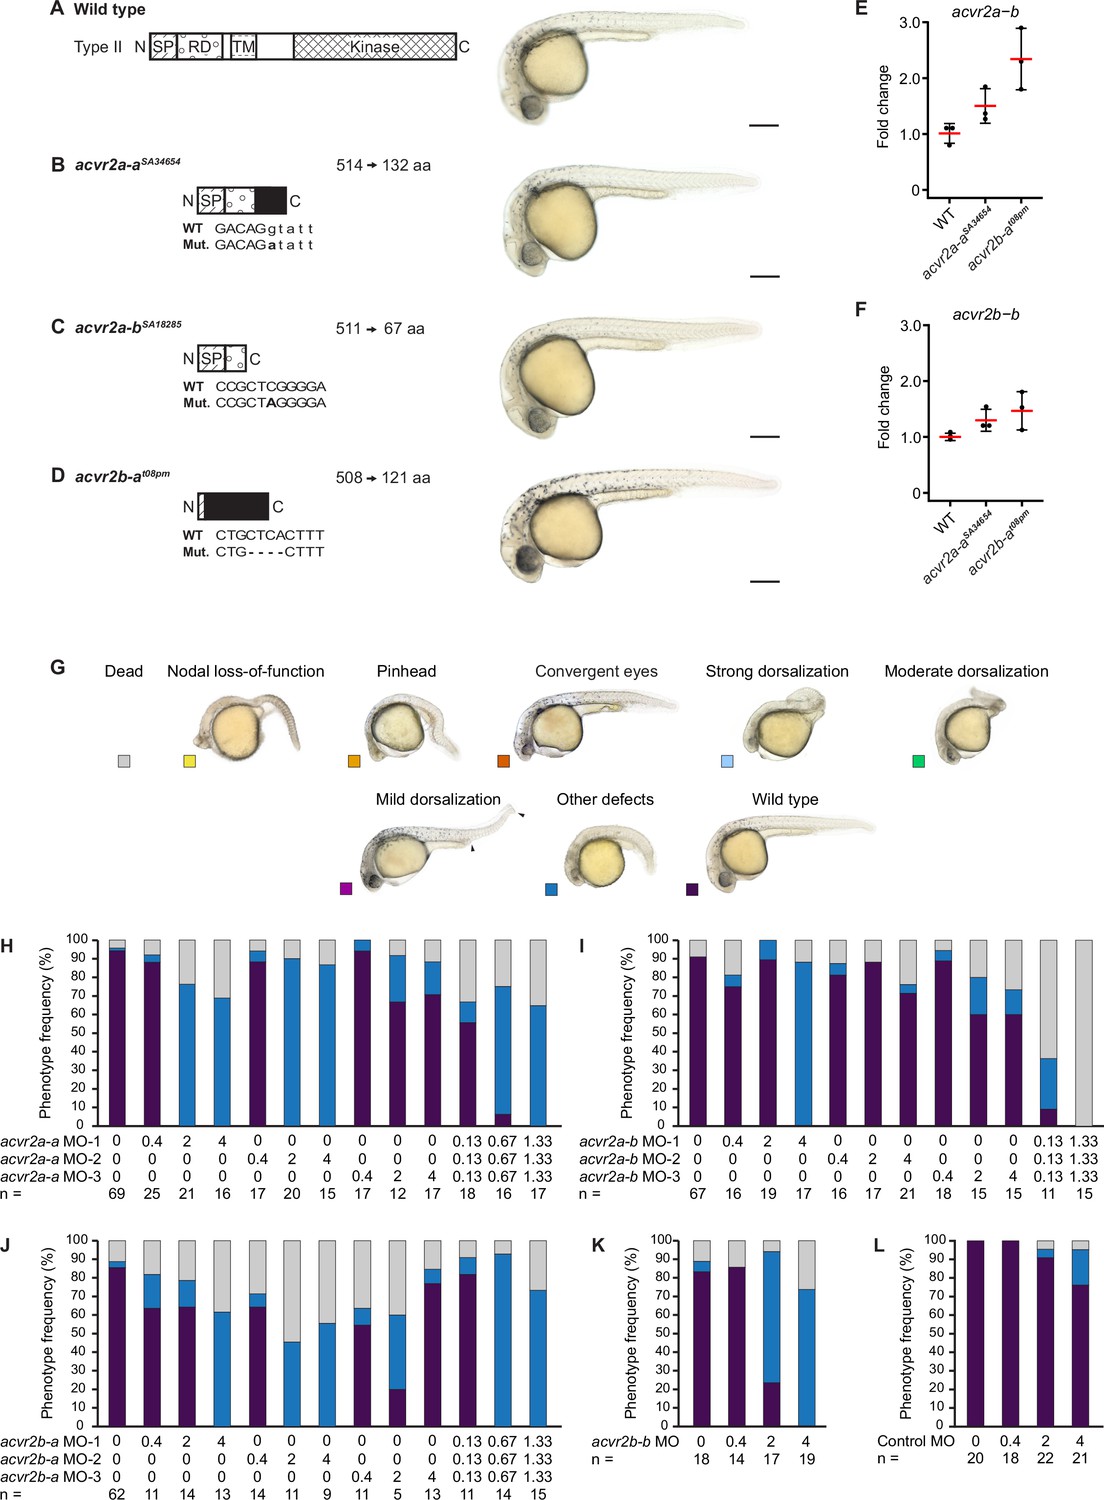
Single acvr2 receptor mutant or knockdown embryos have no obvious patterning defects.
(A–D) Phenotypes of single putative Type II Nodal receptor mutants. Left panels: Schematic diagram showing a typical full-length Type II protein (A) and predicted receptor protein truncations resulting from the acvr2a-aSA34654 (B), acvr2a-bSA18285 (C) and acvr2b-at08pm (D) mutant alleles. Mutated nucleic acid sequences and resulting protein lengths in amino acids (aa) are indicated. Also see Materials and methods. Right panels: Lateral views of embryos at approximately 27–31 hpf for wild-type and maternal-zygotic single receptor homozygous mutants. Scale bars represent 250 µm. aa: amino acids; SP: Signal peptide; RD: Receptor domain; TM: Transmembrane domain; Kinase: Kinase domain; Black: Predicted novel aa sequence between frameshift mutation and new stop site. (E,F) Change of acvr2a-b (E) and acvr2b-b (F) expression in acvr2a-aSA34654 and acvr2b-at08pm mutant compared to WT embryos. Fold change was calculated from qRT-PCR experiments. Error bars represent standard deviation. n = 3 in each case. (G–L) Phenotypes of embryos 1 day after morpholino-mediated knockdown of putative Type II Nodal receptors. (G) Phenotype classification categories with example images of lateral view embryos at 1 dpf (same as in Figure 2—figure supplement 2). (H–L) Frequency of phenotypes observed upon injection of acvr2a-a (H), acvr2a-b (I), acvr2b-a (J), acvr2b-b (K) and control (L) morpholinos into wild-type embryos at the indicated amounts in ng. n indicates the number of analyzed embryos. See the Figure 2—figure supplement 1—source data 1 file for source data.
-
Figure 2—figure supplement 1—source data 1
Source data for Figure 2—figure supplement 1.
- https://cdn.elifesciences.org/articles/66397/elife-66397-fig2-figsupp1-data1-v3.xlsx
Figure 2—figure supplement 2
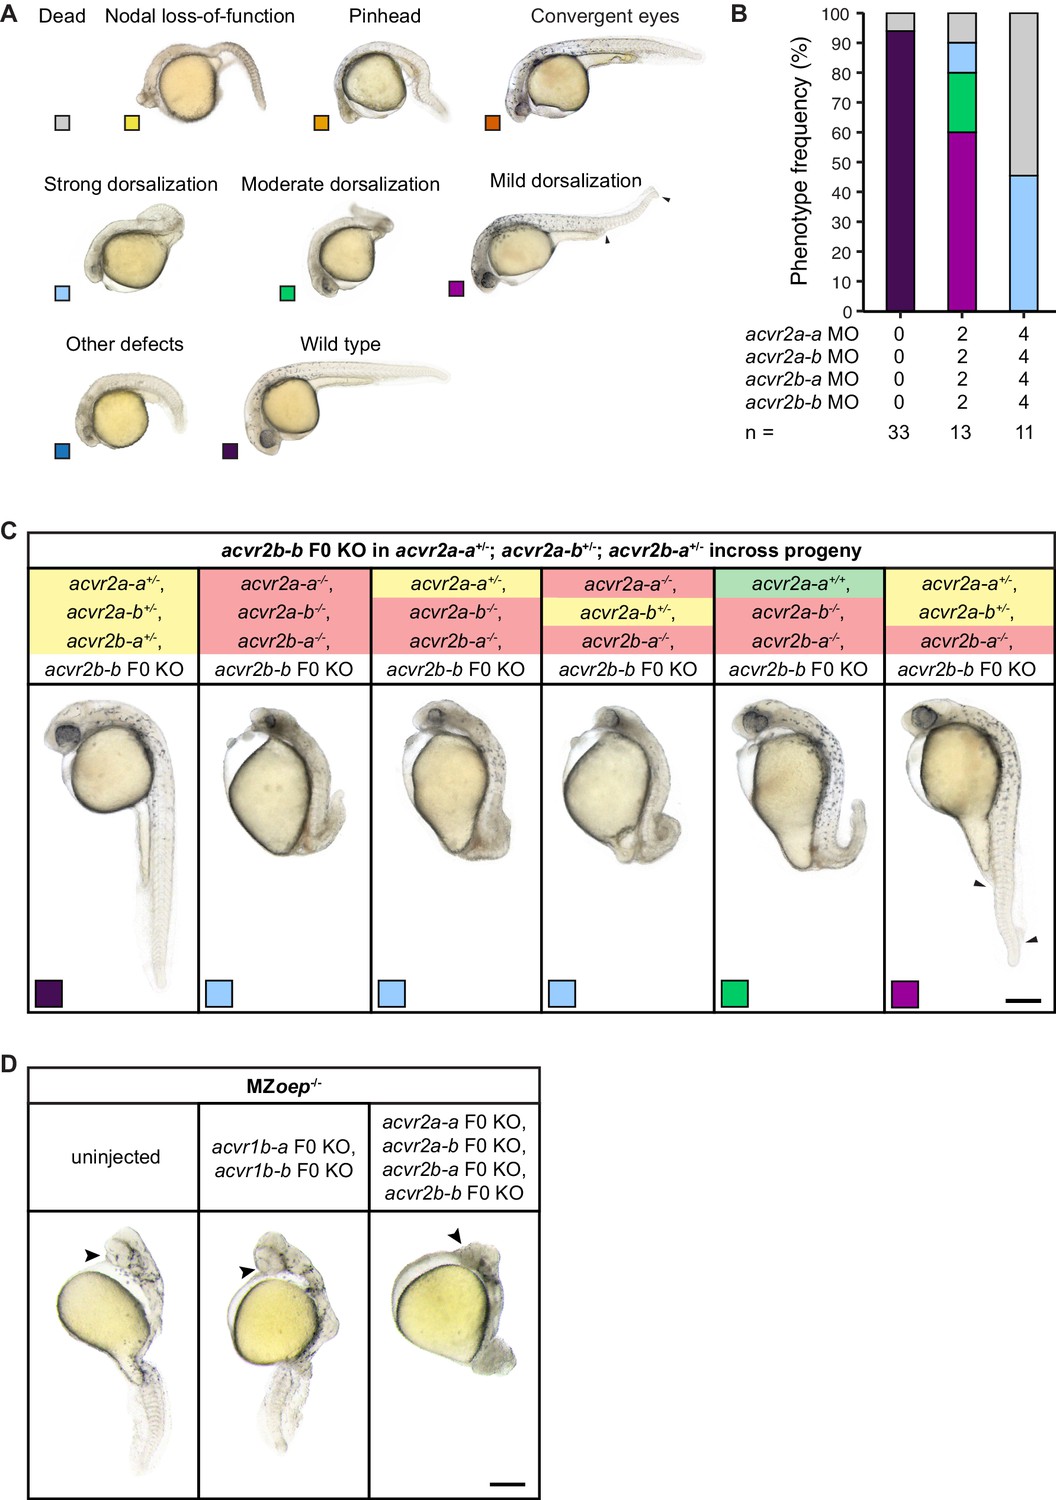
Combinatorial removal of acvr2 receptors using morpholinos, CRISPR F0 KO and mutants causes axis-patterning defects.
(A) Phenotype classification categories (same as in Figure 2—figure supplement 1). (B) Phenotype distributions after injection of a mix of all available acvr2a-a, acvr2a-b, acvr2b-a and acvr2b-b morpholinos (see Materials and methods) at the indicated total morpholino concentration into wild-type embryos. n indicates the number of embryos analyzed at 1 dpf. (C) Phenotypes observed upon acvr2b-b CRISPR F0 KO in progeny of an acvr2a-a+/-;acvr2a-b+/-;acvr2b-a+/- incross at 1 dpf. Embryos with different phenotypes were selected, imaged and subsequently sacrificed for genotyping. The genotype of the presented embryos is indicated at the top with green, yellow and red marking homozygous wild-type, heterozygous and homozygous mutant alleles, respectively. Arrowheads indicate the extent of fin tissue loss. Boxes indicate the phenotype class according to the scheme presented in (A). (D) Phenotypes observed upon double acvr1b-a,acvr1b-b or quadruple acvr2a-a,acvr2a-b,acvr2b-a,acvr2b-b CRISPR F0 KO in MZoep embryos at 1 dpf. Arrowheads point to a single cyclopic eye. Lateral views are presented in (C) and (D). Scale bars represent 250 µm. See the Figure 2—figure supplement 2—source data 1 file for source data.
-
Figure 2—figure supplement 2—source data 1
Source data for Figure 2—figure supplement 2.
- https://cdn.elifesciences.org/articles/66397/elife-66397-fig2-figsupp2-data1-v3.xlsx
Figure 2—figure supplement 3
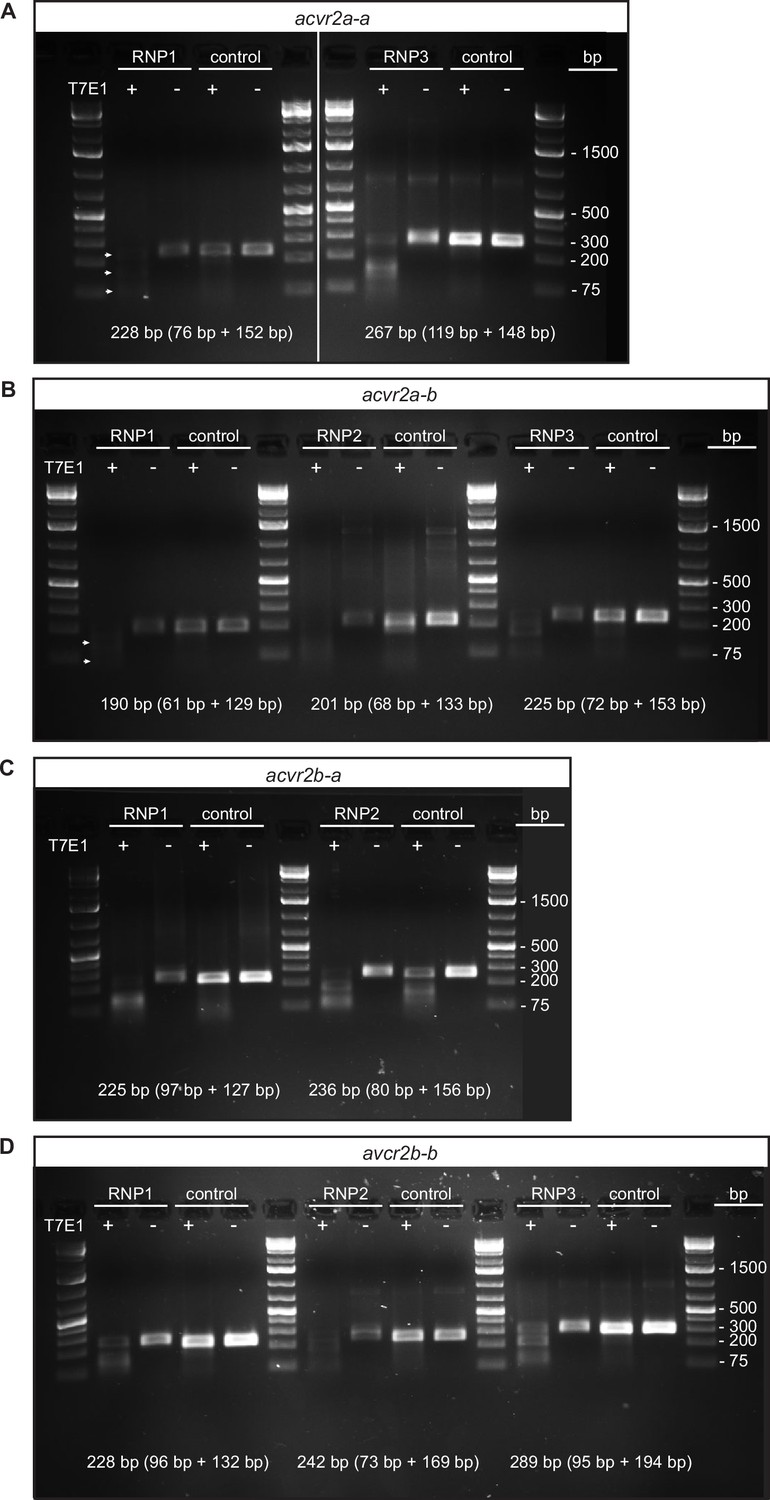
Validation of gRNAs targeting putative Type II Nodal receptors for F0 KO.
(A–D) T7 Endonuclease I (T7E1) assay results for gRNAs targeting acvr2a-a (A), acvr2a-b (B), acvr2b-a (C) and acvr2b-b (D). Genomic DNA was isolated from ten control embryos (uninjected) and ten embryos injected with a gene-specific gRNA/Cas9 ribonucleoprotein (RNP) and used in a T7E1 assay to estimate the cutting efficiency of individual RNPs. The size of the PCR product and its digestion products expected upon RNP injection and in the presence of the enzyme (T7E1) are indicated. See Figure 2—figure supplement 3—source data 1 and Figure 2—figure supplement 3—source data 2 for uncropped, labeled and Figure 2—figure supplement 3—source data 3, Figure 2—figure supplement 3—source data 4, Figure 2—figure supplement 3—source data 5 and Figure 2—figure supplement 3—source data 6 for raw, unedited pictures of agarose gels.
-
Figure 2—figure supplement 3—source data 1
Uncropped pictures of agarose gels showing the T7 Endonuclease I (T7E1) assay results for gRNAs targeting acvr2a-a (A) and acvr2a-b (B) presented in Figure 2—figure supplement 3A, B.
See Figure 2—figure supplement 3—source data 3, Figure 2—figure supplement 3—source data 4 for raw and unedited pictures.
- https://cdn.elifesciences.org/articles/66397/elife-66397-fig2-figsupp3-data1-v3.zip
-
Figure 2—figure supplement 3—source data 2
Uncropped pictures of agarose gels showing the T7 Endonuclease I (T7E1) assay results for gRNAs targeting acvr2b-a (A) and acvr2b-b (B) presented in Figure 2—figure supplement 3C, D.
See Figure 2—figure supplement 3—source data 5, Figure 2—figure supplement 3—source data 6 for raw and unedited pictures.
- https://cdn.elifesciences.org/articles/66397/elife-66397-fig2-figsupp3-data2-v3.zip
-
Figure 2—figure supplement 3—source data 3
Raw, unedited picture of the agarose gel showing the T7 Endonuclease I (T7E1) assay results for gRNAs targeting acvr2a-a presented in Figure 2—figure supplement 3A.
- https://cdn.elifesciences.org/articles/66397/elife-66397-fig2-figsupp3-data3-v3.zip
-
Figure 2—figure supplement 3—source data 4
Raw, unedited picture of the agarose gel showing the T7 Endonuclease I (T7E1) assay results for gRNAs targeting acvr2a-b presented in Figure 2—figure supplement 3B.
- https://cdn.elifesciences.org/articles/66397/elife-66397-fig2-figsupp3-data4-v3.zip
-
Figure 2—figure supplement 3—source data 5
Raw, unedited picture of the agarose gel showing the T7 Endonuclease I (T7E1) assay results for gRNAs targeting acvr2b-a presented in Figure 2—figure supplement 3C.
- https://cdn.elifesciences.org/articles/66397/elife-66397-fig2-figsupp3-data5-v3.zip
-
Figure 2—figure supplement 3—source data 6
Raw, unedited picture of the agarose gel showing the T7 Endonuclease I (T7E1) assay results for gRNAs targeting acvr2b-b presented in Figure 2—figure supplement 3D.
- https://cdn.elifesciences.org/articles/66397/elife-66397-fig2-figsupp3-data6-v3.zip
Figure 3 with 3 supplements

Combinatorial removal of putative Type I Nodal receptors causes Nodal-specific patterning defects.
Phenotypes of wild-type, MZoep and oep CRISPR F0 KO embryos compared to embryos depleted of either or both acvr1b-a and acvr1b-b using morpholino KDs, CRISPR F0 KOs and mutants. (A) Lateral view of embryos of the indicated condition approximately 28–31 hpf. Large arrowheads point to a single cyclopic eye, small arrowheads to fused or convergent eyes. Boxes indicate the phenotype class according to the scheme presented in (C). Scale bar represents 250 µm. (B) Nodal signaling visualized by pSmad2/3 immunostaining in embryos of the indicated condition (A) at 50% epiboly. Maximum intensity projections show lateral views. The number of embryos with the presented phenotype is indicated. Scale bar represents 200 µm. (C) Frequency of phenotypes observed in embryos of the indicated condition 1 dpf. n indicates the number of analyzed embryos. Note that one of the gRNAs used for acvr1b-b F0 KO has acvr1b-a as a predicted off-target, likely explaining the rare occurrences of the convergent eyes phenotype (see Materials and methods). See the Figure 3—source data 1 file for source data.
-
Figure 3—source data 1
Source data for Figure 3.
- https://cdn.elifesciences.org/articles/66397/elife-66397-fig3-data1-v3.xlsx
Figure 3—figure supplement 1
Single Type I Nodal receptor mutants or knockdown embryos have no obvious patterning defects.
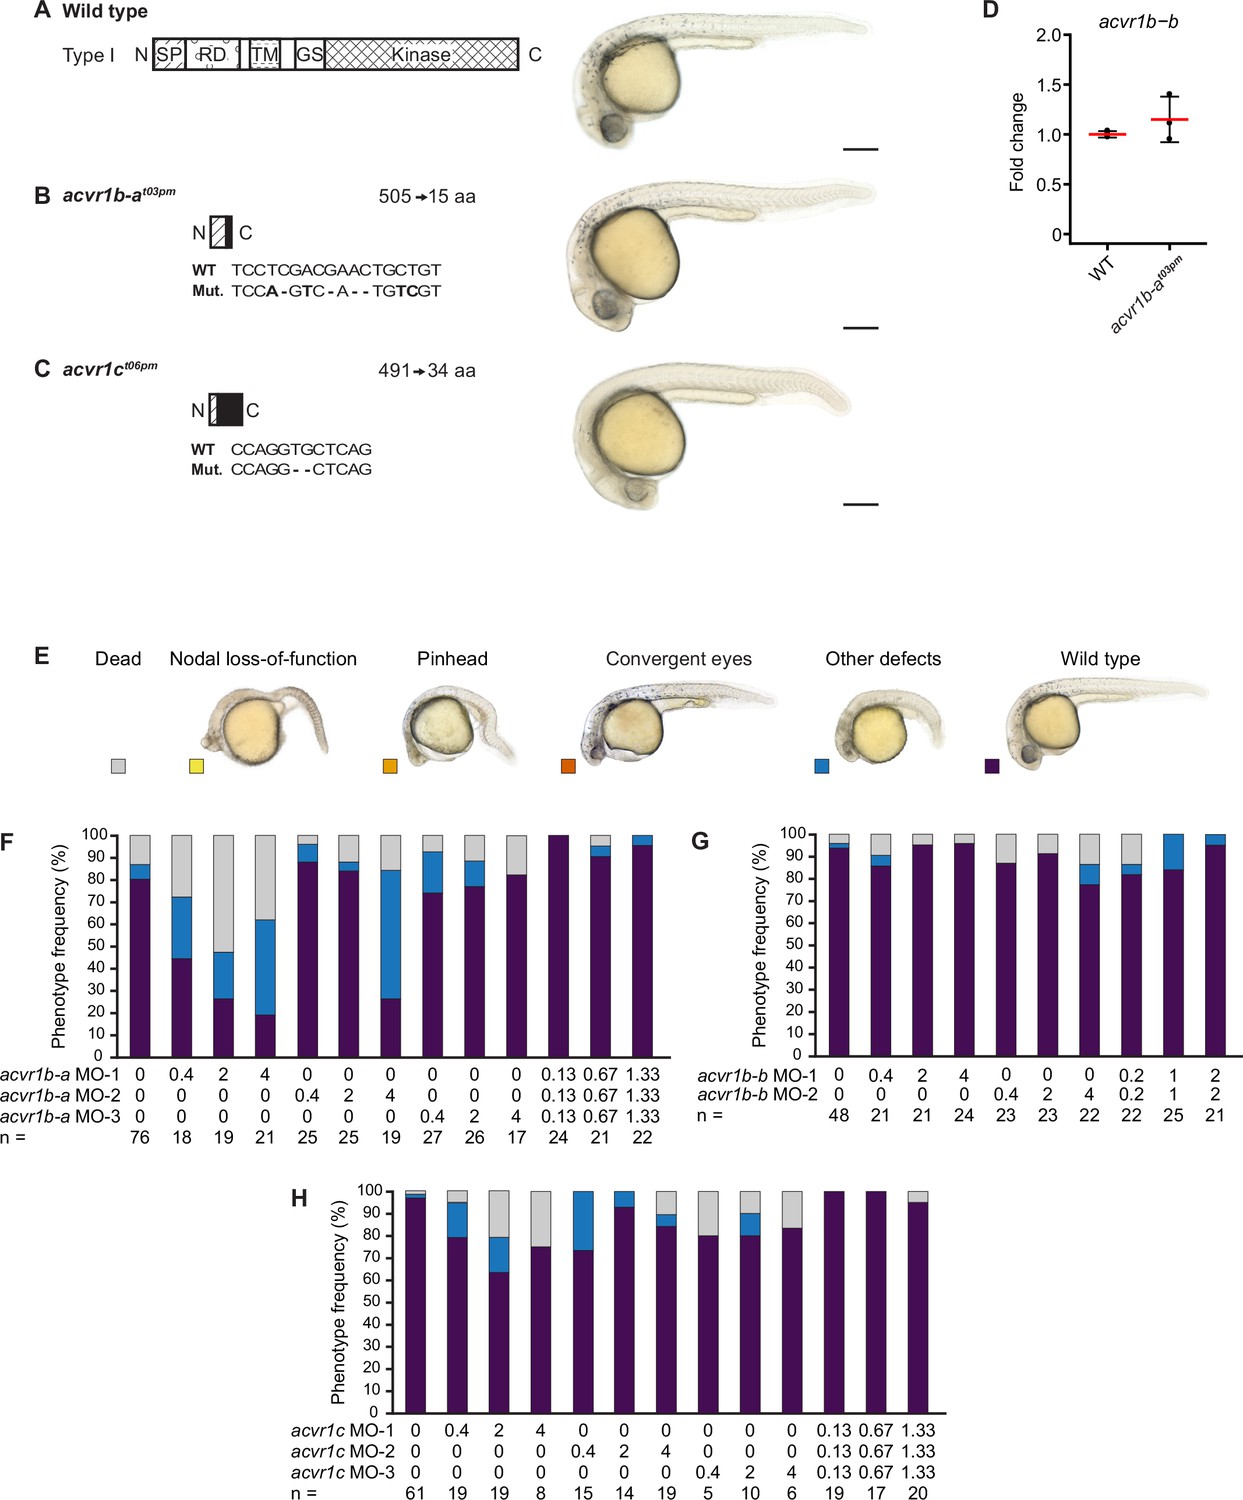
(A–C) Phenotypes of single Type I Nodal receptor mutants. Left panels: Schematic diagram showing a typical full-length Type I protein (A) and predicted receptor protein truncations resulting from the acvr1b-at03pm (B) and acvr1ct06pm (C) mutant alleles. Mutated nucleic acid sequences and resulting protein lengths in amino acids (aa) are indicated. Right panels: Lateral views of embryos at approximately 27–31 hpf for wild-type and maternal-zygotic single receptor homozygous mutants. Scale bars represent 250 µm. aa: amino acids; SP: Signal peptide; RD: Receptor domain; TM: Transmembrane domain; GS: GS domain; Kinase: Kinase domain; Black: Predicted novel aa sequence between frameshift mutation and new stop site. (D) Change of acvr1b-b expression in acvr1b-at03pm mutant compared to wild-type embryos as calculated from qRT-PCR experiments. Error bars represent standard deviation. n = 3 in each case. (E–H) Phenotypes of embryos 1 day after morpholino-mediated knockdown of putative Type I Nodal receptors. (E) Phenotype classification categories with example images of lateral view embryos at 1 dpf (same as in Figure 3—figure supplement 2). (F–H) Frequency of phenotypes observed upon injection of acvr1b-a (F), acvr1b-b (G), and acvr1c (H) morpholinos into wild-type embryos at the indicated amounts in ng. Results for control morpholino injections are shown in Figure 2—figure supplement 1L. n indicates the number of analyzed embryos. See the Figure 3—figure supplement 1—source data 1 file for source data.
-
Figure 3—figure supplement 1—source data 1
Source data for Figure 3—figure supplement 1.
- https://cdn.elifesciences.org/articles/66397/elife-66397-fig3-figsupp1-data1-v3.xlsx
Figure 3—figure supplement 2
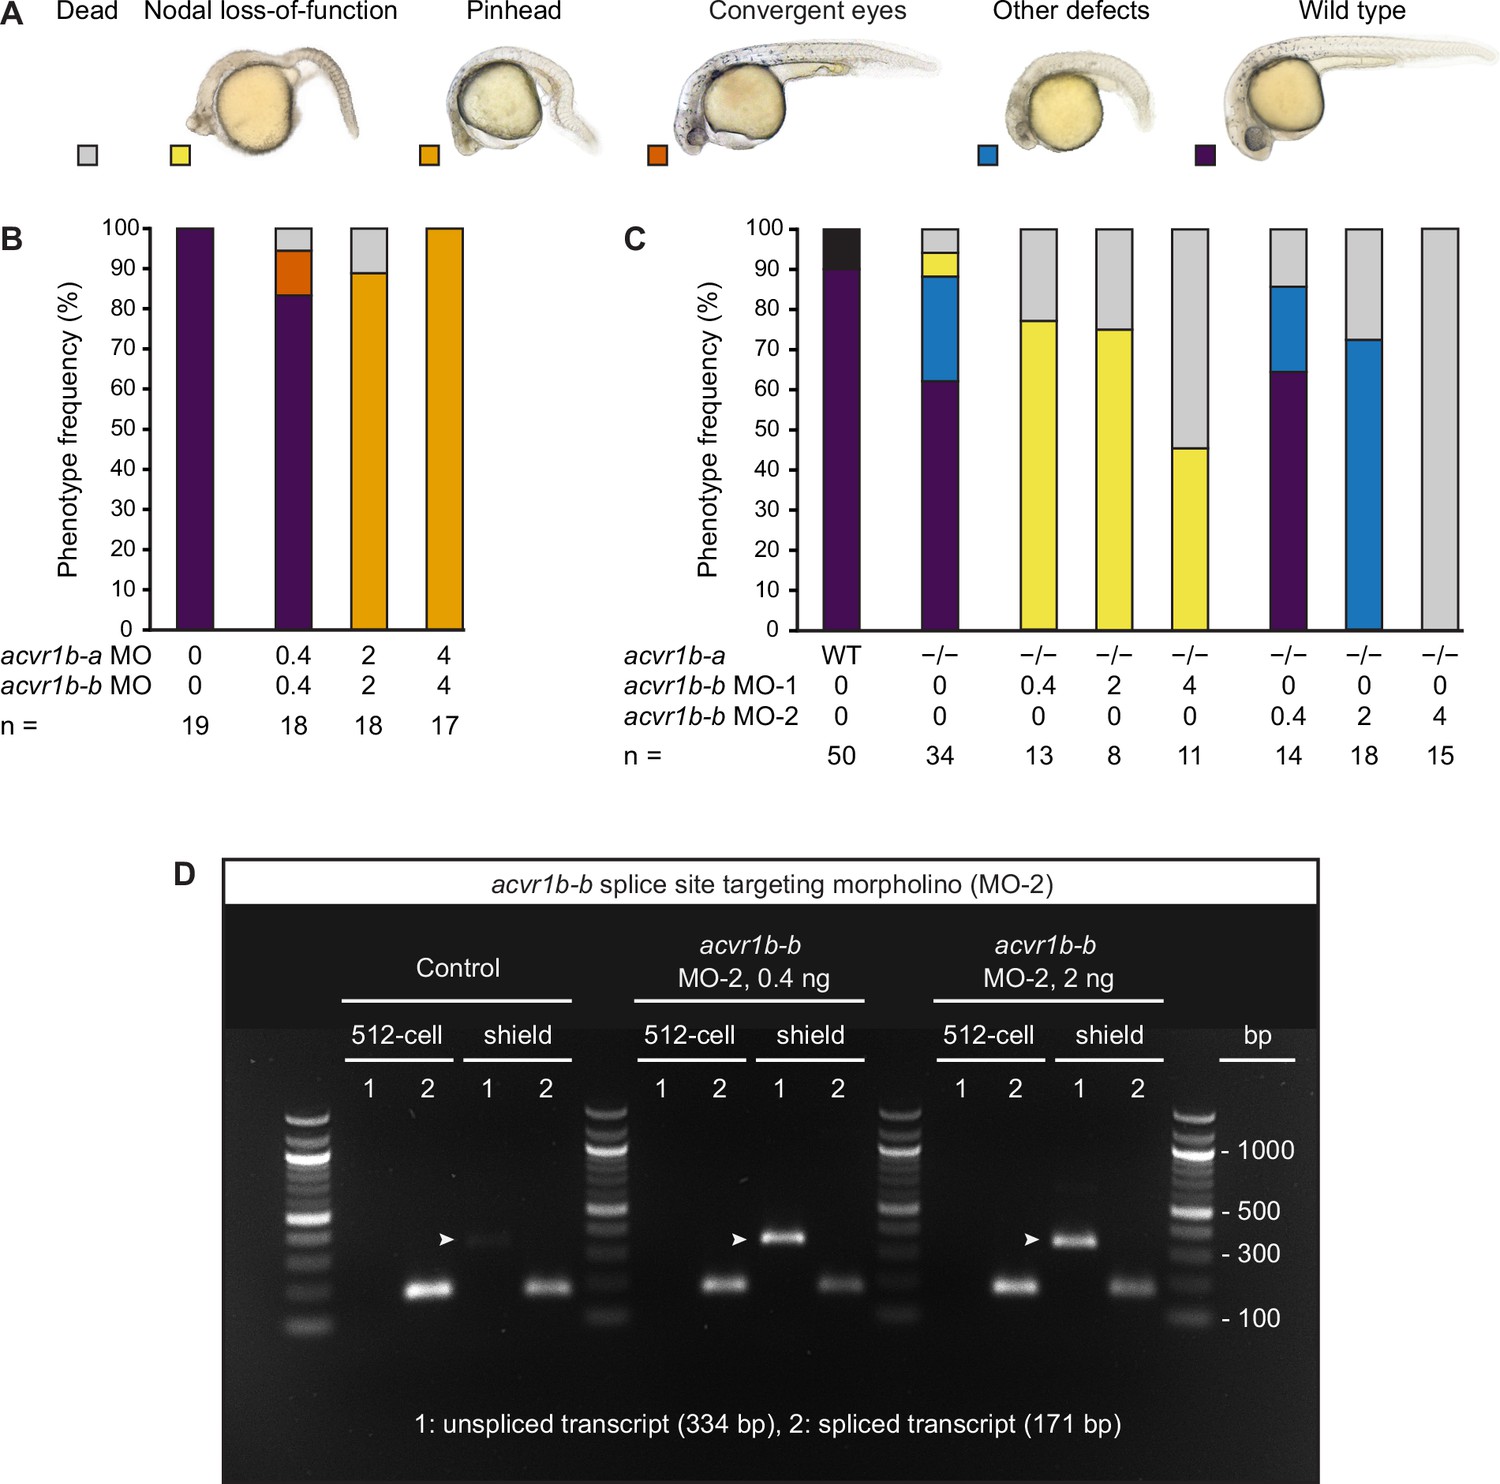
Combinatorial removal of acvr1b-a and acvr1b-b using morpholinos and mutants mimic Nodal loss-of-function phenotypes.
(A) Phenotype classification categories (same as in Figure 3—figure supplement 1). (B) Phenotype distributions after injection of a mix of all available acvr1b-a and acvr1b-b morpholinos at the indicated total morpholino concentration into wild-type embryos. (C) Phenotype distributions after injection of acvr1b-b transcriptional start site (MO-1) and acvr1b-b splice site-targeting (MO-2) morpholinos into maternal-zygotic acvr1b-at03pm/t03pm embryos. n indicates the number of analyzed embryos in (B) and (C). (D) The effect of acvr1b-b splice site-targeting morpholino (MO-2) on the maternal and zygotic transcript. cDNA of 512 cell or shield stage control embryos and embryos injected with 0.4 ng or 2 ng acvr1b-b MO-2 was used to amplify the unspliced (1) and spliced (2) acvr1b-b transcript. Arrowheads indicate the unspliced transcript’s PCR product, which is not detected before the zygotic genome activation (i.e. at the 512 cell stage). For (B,C), see the Figure 3—figure supplement 2—source data 1 table for source data. For (D), see Figure 3—figure supplement 2—source data 2 for the uncropped, labeled and Figure 3—figure supplement 2—source data 3 for the raw, unedited picture of the agarose gel.
-
Figure 3—figure supplement 2—source data 1
Source data table for Figure 3—figure supplement 2B, C.
- https://cdn.elifesciences.org/articles/66397/elife-66397-fig3-figsupp2-data1-v3.zip
-
Figure 3—figure supplement 2—source data 2
Uncropped picture of the agarose gel showing the effect of acvr1b-b splice site-targeting morpholino (MO-2) on the maternal and zygotic transcript presented in Figure 3—figure supplement 2D.
See Figure 3—figure supplement 2—source data 3 for the raw and unedited picture.
- https://cdn.elifesciences.org/articles/66397/elife-66397-fig3-figsupp2-data2-v3.zip
-
Figure 3—figure supplement 2—source data 3
Raw, unedited picture of the agarose gel showing the effect of acvr1b-b splice site-targeting morpholino (MO-2) on the maternal and zygotic transcript presented in Figure 3—figure supplement 2D.
- https://cdn.elifesciences.org/articles/66397/elife-66397-fig3-figsupp2-data3-v3.zip
Figure 3—figure supplement 3
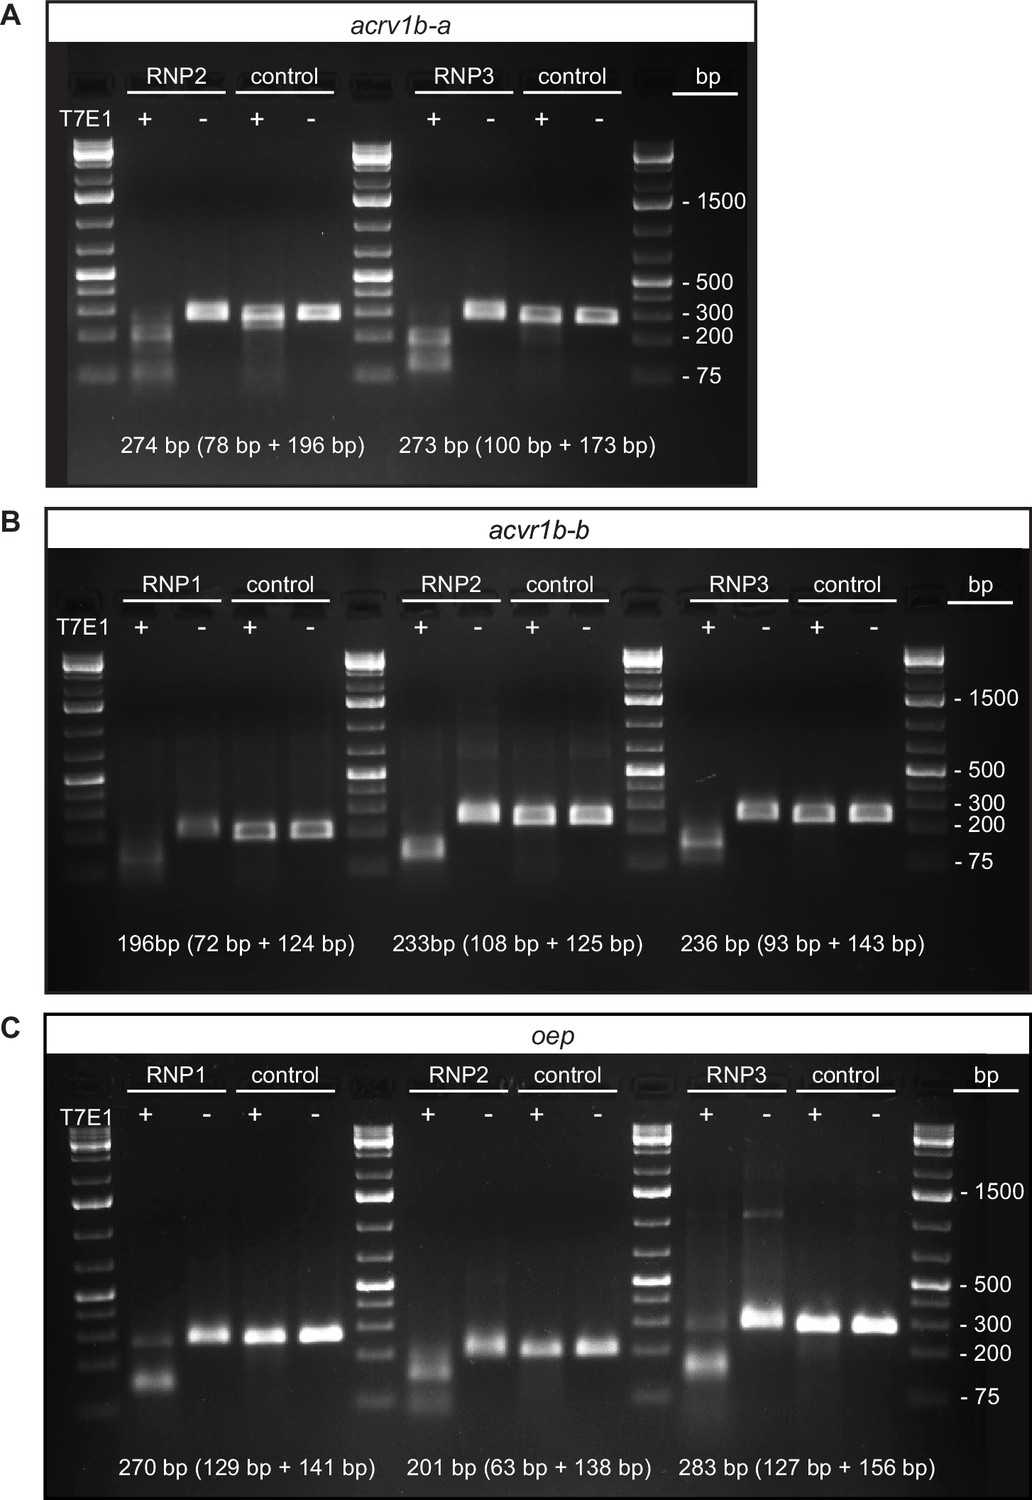
Confirmation of gRNAs targeting putative Type I Nodal receptors and oep for F0 KO.
(A–C) T7 Endonuclease I (T7E1) assay results for gRNAs targeting acvr1b-a (A), acvr1b-b (B) and oep (C). Genomic DNA was isolated from ten control embryos (uninjected) and ten embryos injected with a gene-specific gRNA/Cas9 ribonucleoprotein (RNP) and used in a T7E1 assay to estimate the cutting efficiency of individual RNPs. The size of the PCR product and its digestion products expected upon RNP injection and in the presence of the enzyme (T7E1) are indicated. See Figure 3—figure supplement 3—source data 1, Figure 3—figure supplement 3—source data 2 for uncropped, labeled and Figure 3—figure supplement 3—source data 3, Figure 3—figure supplement 3—source data 4, Figure 3—figure supplement 3—source data 5 for raw, unedited pictures of agarose gels.
-
Figure 3—figure supplement 3—source data 1
Uncropped pictures of agarose gels showing the T7 Endonuclease I (T7E1) assay results for gRNAs targeting acvr1b-a (A) and acvr1b-b (B) presented in Figure 3—figure supplement 3A, B.
See Figure 3—figure supplement 3—source data 3, Figure 3—figure supplement 3—source data 4 for raw and unedited pictures.
- https://cdn.elifesciences.org/articles/66397/elife-66397-fig3-figsupp3-data1-v3.zip
-
Figure 3—figure supplement 3—source data 2
Uncropped picture of the agarose gel showing the T7 Endonuclease I (T7E1) assay results for gRNAs targeting oep presented in Figure 3—figure supplement 3C.
- https://cdn.elifesciences.org/articles/66397/elife-66397-fig3-figsupp3-data2-v3.zip
-
Figure 3—figure supplement 3—source data 3
Raw, unedited picture of the agarose gel showing the T7 Endonuclease I (T7E1) assay results for gRNAs targeting acvr1b-a presented in Figure 3—figure supplement 3A.
- https://cdn.elifesciences.org/articles/66397/elife-66397-fig3-figsupp3-data3-v3.zip
-
Figure 3—figure supplement 3—source data 4
Raw, unedited picture of the agarose gel showing the T7 Endonuclease I (T7E1) assay results for gRNAs targeting acvr1b-b presented in Figure 3—figure supplement 3B.
- https://cdn.elifesciences.org/articles/66397/elife-66397-fig3-figsupp3-data4-v3.zip
-
Figure 3—figure supplement 3—source data 5
Raw, unedited picture of the agarose gel showing the T7 Endonuclease I (T7E1) assay results for gRNAs targeting oep presented in Figure 3—figure supplement 3C.
- https://cdn.elifesciences.org/articles/66397/elife-66397-fig3-figsupp3-data5-v3.zip
Figure 4 with 1 supplement
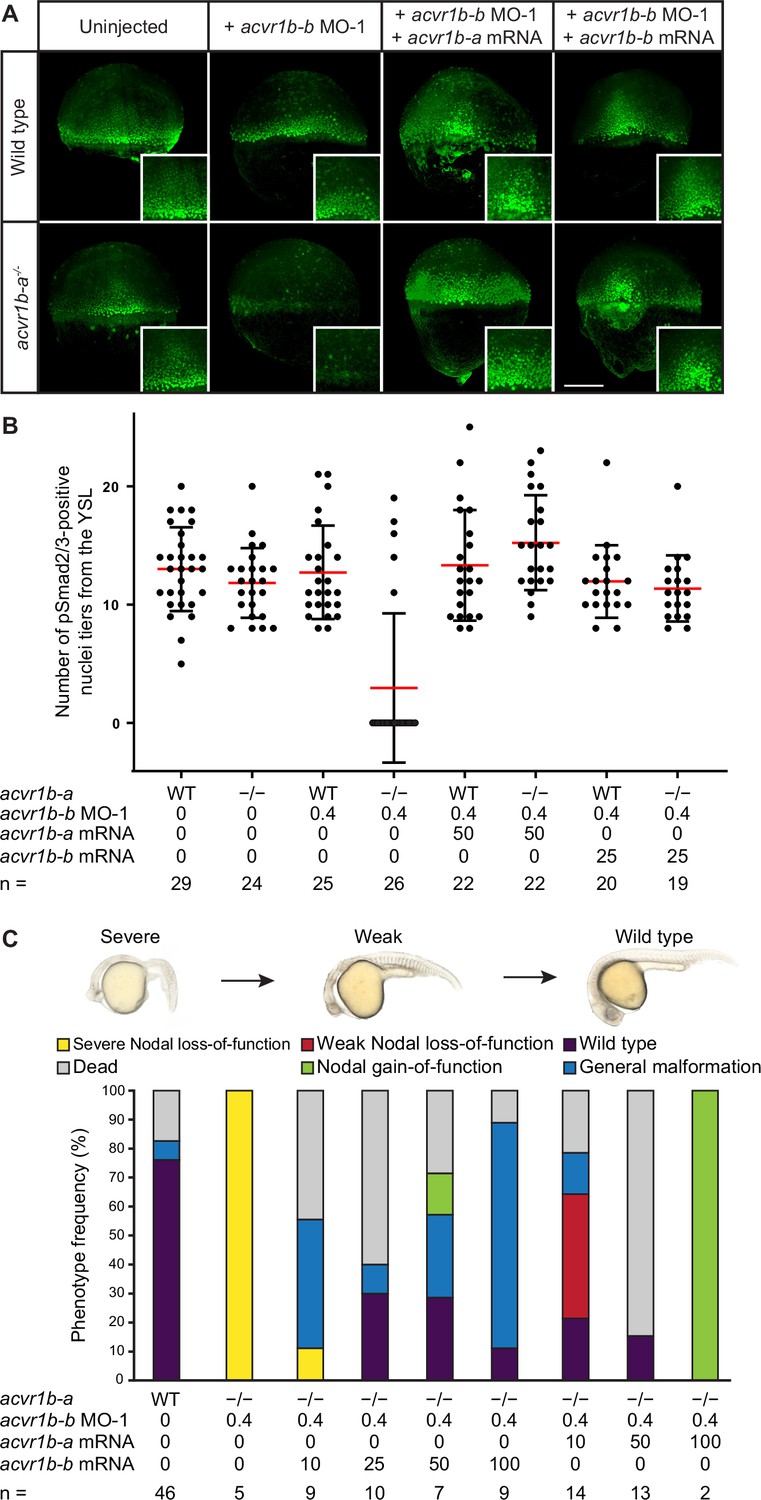
The Type I receptors Acvr1b-a and Acvr1b-b redundantly mediate Nodal signaling.
(A,B) Influence of acvr1b-a and acvr1b-b on the Nodal signaling range at shield stage. The range of Nodal signaling in shield-stage wild-type, knockdown and rescued embryos was determined by counting the maximum number of nuclei tiers positive for pSmad2/3 immunostaining from the embryonic margin towards the animal pole (i.e. the number of pSmad2/3 positive nuclei tiers at the dorsal side). acvr1b-at03pm/t03pm mutants and 0.4 ng acvr1b-b transcriptional start site-targeting morpholino (MO-1) were used for receptor loss-of-function conditions. Receptor loss-of-function was rescued with 50 pg of acvr1b-a or 25 pg of acvr1b-b mRNA. Data was obtained from three independent replicate experiments. (A) Maximum intensity projections show dorsal views. Scale bar represents 200 µm. (B) n indicates the number of analyzed embryos. Averages are displayed in red, and error bars show standard deviation. (C) Rescue of Type I receptor function after combinatorial mutation/knockdown using acvr1b-a and acvr1b-b mRNA. To deplete the Type I receptors, the acvr1b-at03pm/t03pm mutant was used in combination with 0.4 ng acvr1b-b transcriptional start site-targeting morpholino (MO-1). mRNA amounts are given in pg. n indicates the number of analyzed embryos. Note that strong overexpression of Acvr1b-a receptor-encoding mRNA leads to high lethality or tissue aggregates that eventually disintegrate (termed ‘Nodal gain-of-function’). See the Figure 4—source data 1 file for source data.
-
Figure 4—source data 1
Source data for Figure 4.
- https://cdn.elifesciences.org/articles/66397/elife-66397-fig4-data1-v3.xlsx
Figure 4—figure supplement 1
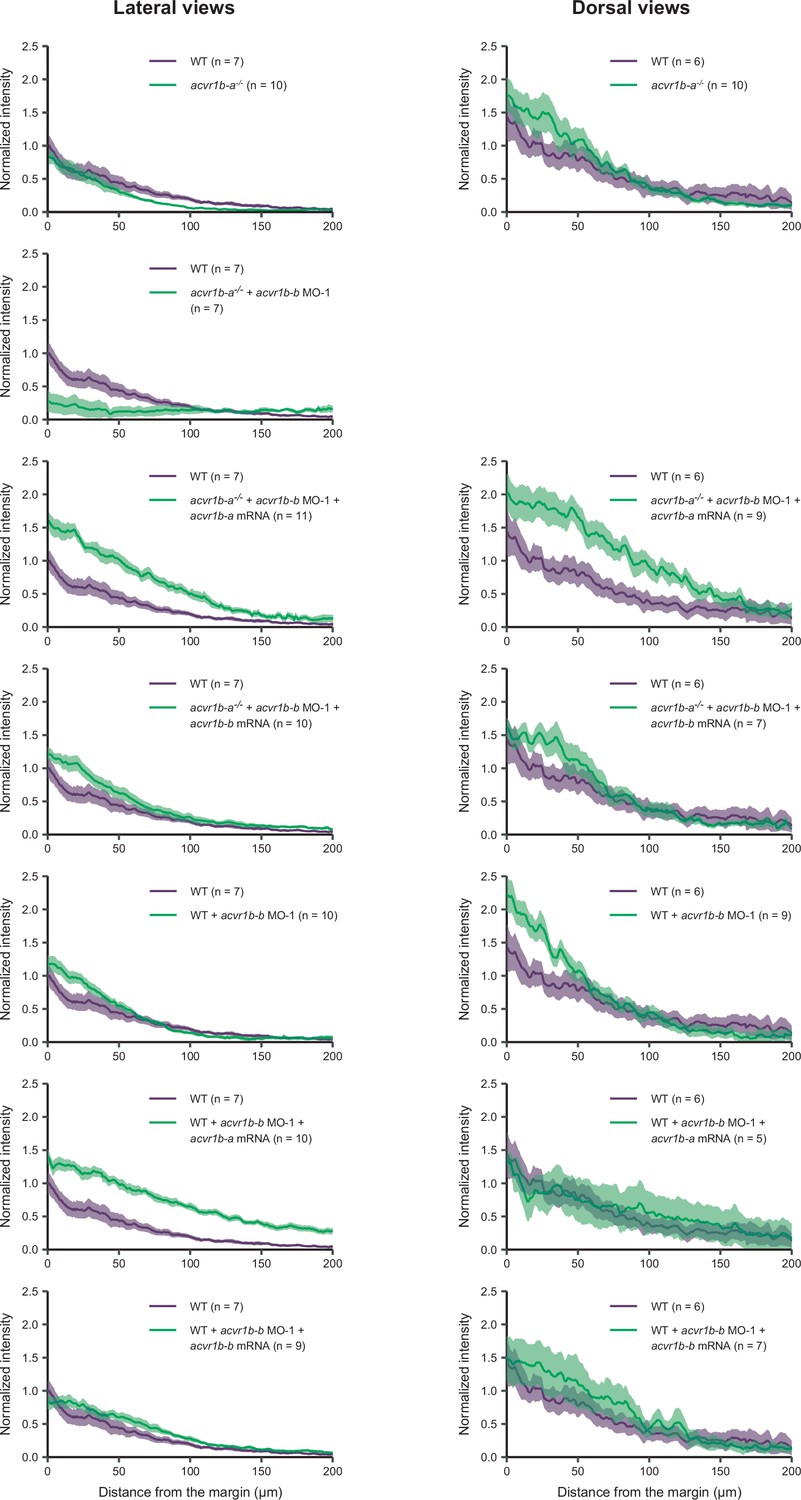
The Type I receptors Acvr1b-a and Acvr1b-b redundantly mediate Nodal signaling.
Quantification of the margin to animal pSmad2/3 immunofluorescence signal at shield stage from data presented in Figure 4. Only samples recorded on the same day were used to ensure comparability. The average background-subtracted intensity of nuclei relative to their distance from the margin (in µm) normalized to the intensity of the average wild-type signal at position x=0 µm is shown. Mutant (acvr1b-a-/-) and wild-type embryos were used and either injected with 0.4 ng acvr1b-b morpholino 1 (MO-1), 50 pg acvr1b-a or 25 ng acvr1b–b-mRNA or a combination. Dorsal measurements were only performed if the dorsal side could be distinguished from the lateral side based on the microscopy data (therefore no plot for acvr1b-a mutants injected with acvr1b-b morpholino is shown). Sample sizes are indicated in parentheses. The error bars (shaded regions) show the standard error of the mean. See the Figure 4—figure supplement 1—source data 1 file for source data.
-
Figure 4—figure supplement 1—source data 1
Source data for Figure 4—figure supplement 1.
- https://cdn.elifesciences.org/articles/66397/elife-66397-fig4-figsupp1-data1-v3.xlsx
Figure 5 with 1 supplement
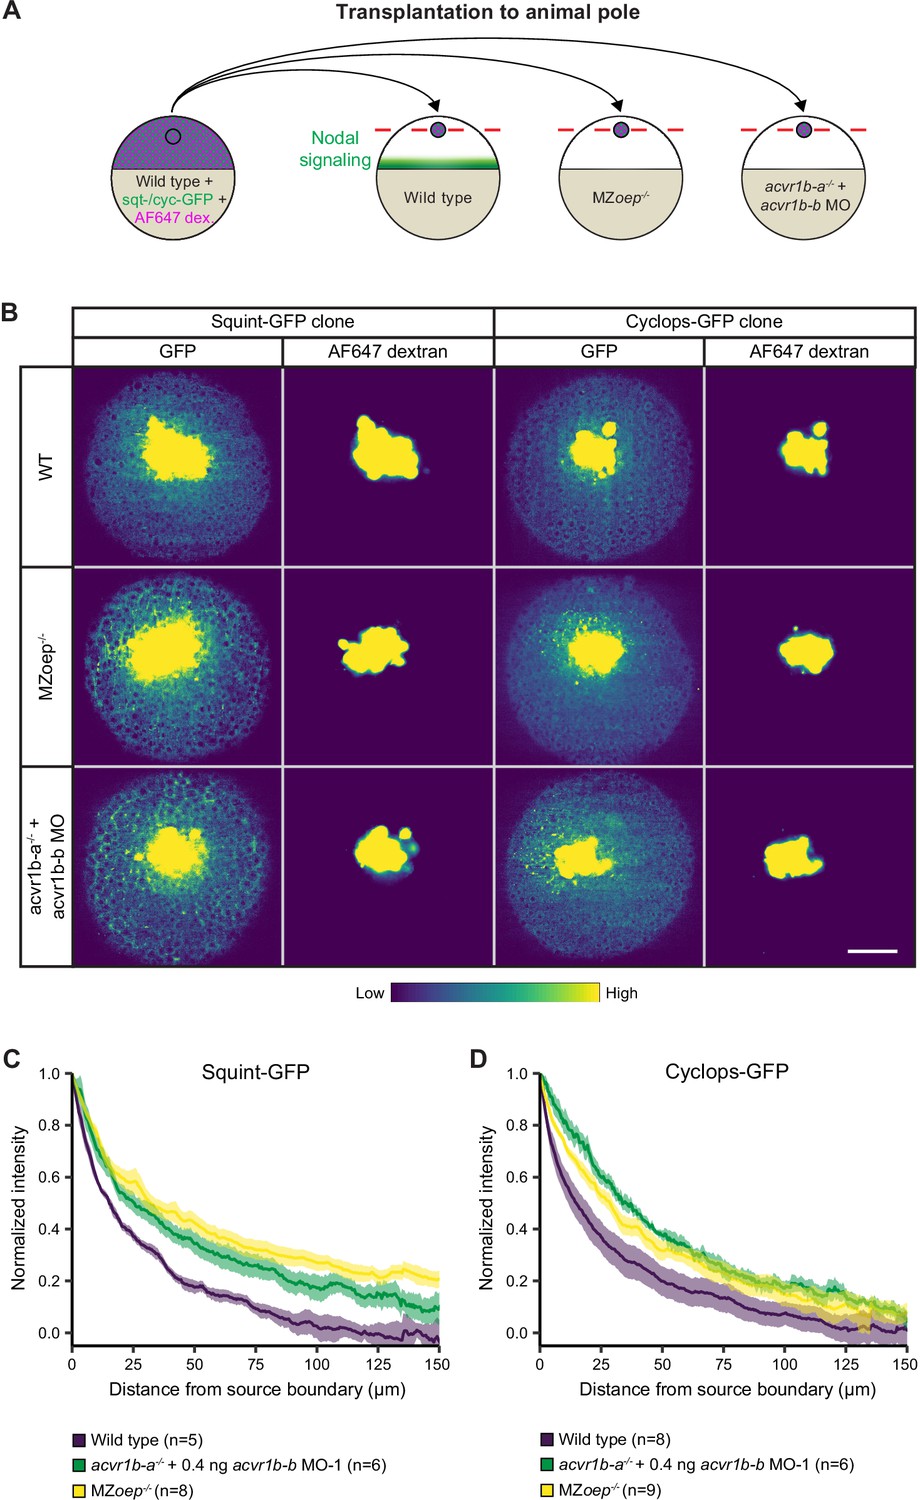
Nodal receptors and co-receptors can shape the distribution of Nodal ligands in zebrafish embryos.
(A) Schematic of the transplantation assay to create ectopic Nodal signaling sources. Cells from the animal pole of sphere-stage wild-type embryos injected with squint-GFP or cyclops-GFP mRNA and Alexa Fluor 647 dextran (AF647 dex.) were transplanted to the animal pole of wild-type, MZoep-/-, or acvr1b-a-/- + acvr1b-b MO-1 embryos (hosts). Host embryos were imaged 60 min post-transplantation to determine the dispersal of Nodal ligands secreted by the clone. (B) Animal-pole view of transplanted Squint-GFP or Cyclops-GFP clones in the indicated host embryo 60 min post-transplantation. Single z-slices show the ligand distribution (GFP signal) and the transplanted cells (AF647 dextran signal). Scale bar represents 100 µm. (C,D) Quantification of Squint-GFP (C) and Cyclops-GFP (D) signal distributions in wild-type, MZoep-/- and acvr1b-a-/- + acvr1b-b MO-1 embryos. The mean normalized background-subtracted intensities are shown as a function of their distance from the transplantation site. The error bars (shaded regions) indicate SEM. The number of measured embryos is indicated in parentheses. See the Figure 5—source data 1 file for source data.
-
Figure 5—source data 1
Source data for Figure 5.
- https://cdn.elifesciences.org/articles/66397/elife-66397-fig5-data1-v3.xlsx
Figure 5—figure supplement 1

Loss of Acvr1b-a/Acvr1b-b or Oep broadens the range of Squint-GFP and Cyclops-GFP secreted from the YSL.
(A) Schematic of the YSL-injection assay to create local Nodal sources in a native context. 100 pg of Squint-GFP- or Cyclops-GFP-encoding mRNA were injected into the YSL of sphere-stage embryos, which were subsequently imaged at 2 or 4 hours post-injection (hpi), respectively, to measure Nodal distributions. The amount of injected mRNA was chosen according to its tested physiological relevance (see (E)). (B) Lateral views of Squint-GFP (2 hpi) and Cyclops-GFP (4 hpi) signals from YSL-injection assays in wild-type compared to MZoeptz57/tz57 embryos, and acvr1b-a-/- mutant embryos injected with 0.4 ng acvr1b-b MO-1. Scale bar represents 250 µm. (C,D) Quantification of Squint-GFP (C) and Cyclops-GFP (D) distributions with modulated receptor (Acvr1) and co-receptor (Oep) levels at 2 or 4 hpi, respectively (see B). Graphs show the mean normalized background-subtracted Squint-GFP intensity (C) or the number of Cyclops-GFP puncta (D) as a function of distance from the YSL (see Materials and methods). The error bars (shaded regions) indicate SEM. The number of measured embryos is indicated in parentheses. (E) Effect of YSL-injections on Nodal mutant phenotypes. To determine the physiological relevance of the YSL-injection experiments, a titration of Nodal-encoding mRNA amounts was performed. Different amounts of mRNA encoding Squint-GFP were injected into Nodal ligand double mutant embryos (MZsqt-/-;cyc-/-) and the resulting phenotype at 24 hpf was assessed. The analyzed embryos either displayed the full Nodal mutant phenotype (no somites, severe CNS mis-patterning, cyclopia), a partial rescue (somites were present and/or split eyes), partial gain-of-function (curled tails, shortened body axis) or full gain-of-function phenotypes. Lateral views of whole embryos or close-ups of embryo faces are shown. Arrowheads point to a single eye or split eyes. The investigated injection amounts were 0 pg (n=29), 50 pg (n=23), 100 pg (the amount used in the main figure) (n=15), 150 pg (n=25) and 200 pg (n=25). At lower concentrations the full mutant phenotype was dominant, at medium dosage partial rescue occurred, and at high levels gain-of-function phenotypes were dominant. Scale bar represents 250 µm. See the Figure 5—figure supplement 1—source data 1 file for source data.
-
Figure 5—figure supplement 1—source data 1
Source data for Figure 5—figure supplement 1.
- https://cdn.elifesciences.org/articles/66397/elife-66397-fig5-figsupp1-data1-v3.xlsx
Figure 6 with 2 supplements
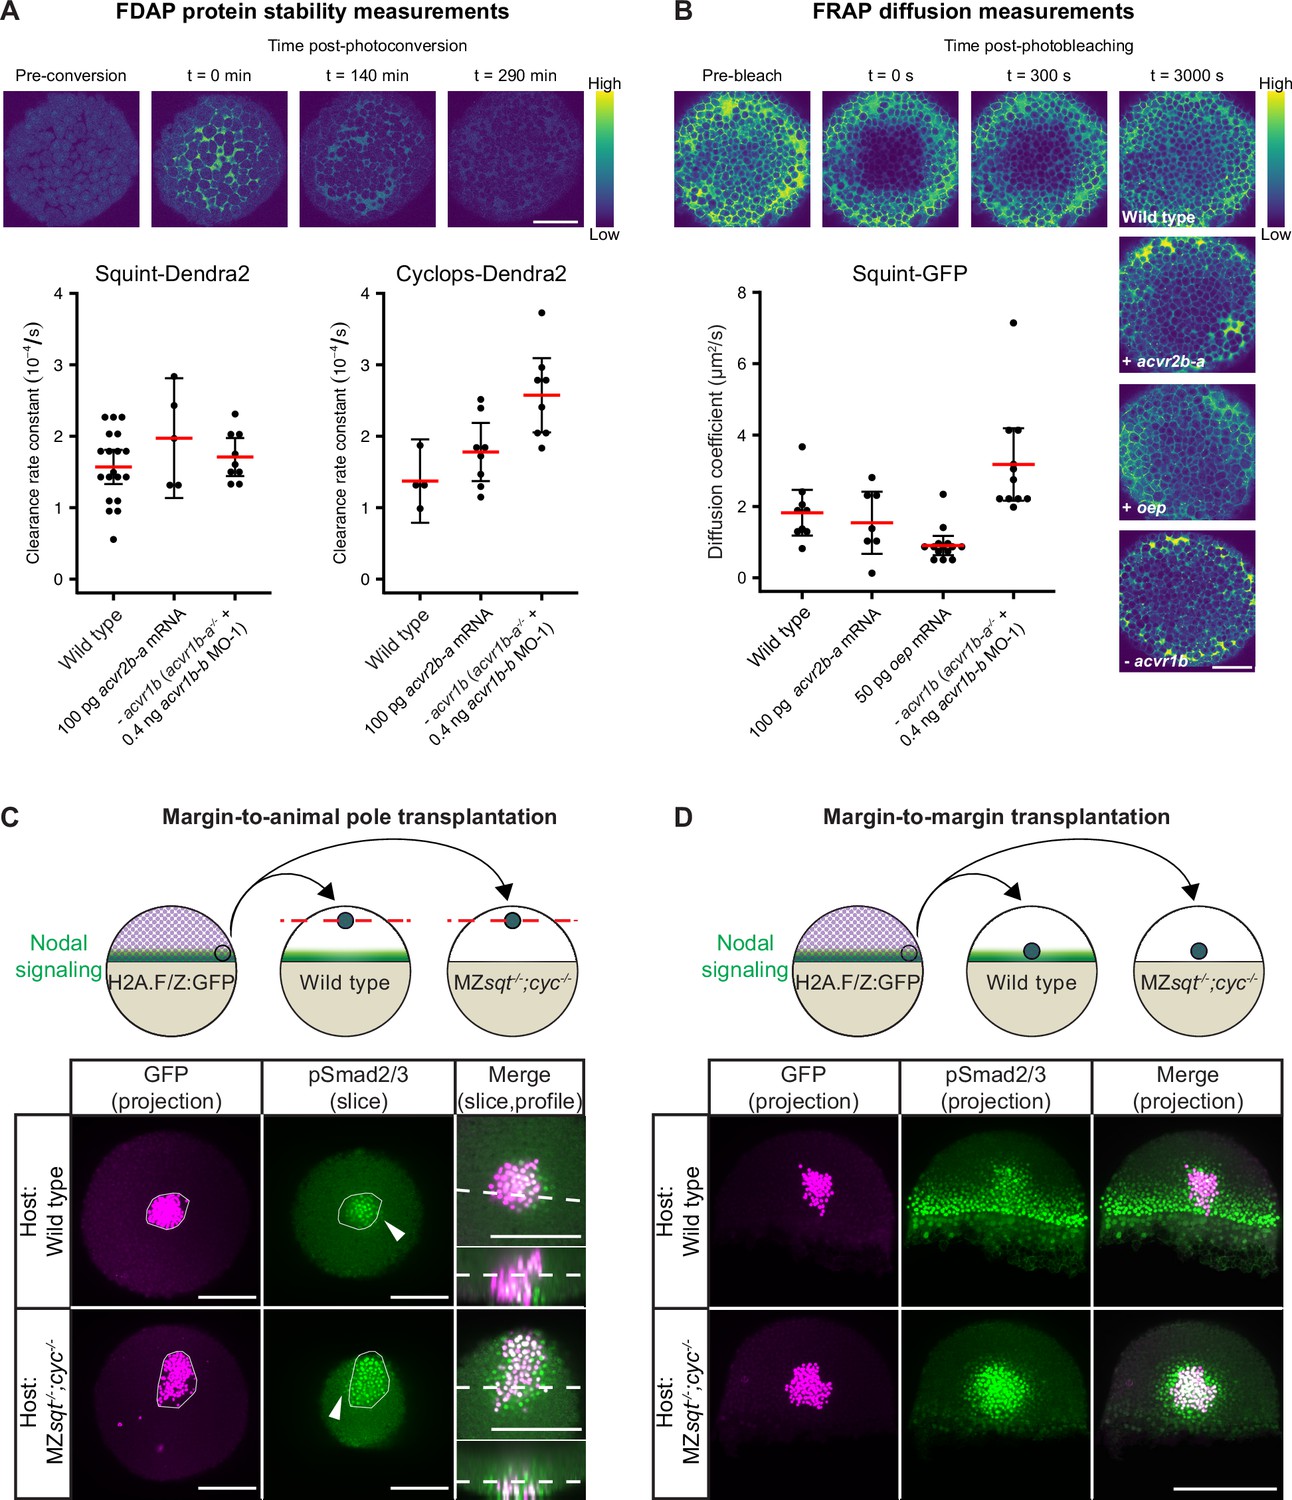
Influence of Nodal receptors on Nodal stability, diffusivity and autoregulatory signal propagation.
(A) Impact of acvr1 loss-of-function and acvr2b-a overexpression on Squint- and Cyclops-Dendra2 clearance rate constants determined using FDAP measurements. For acvr1 loss-of-function, 0.4 ng acvr1b-b MO-1 were injected into acvr1b-a-/- mutant embryos. For overexpression, 100 pg acvr2b-a mRNA were injected into wild-type embryos. Mean extracellular clearance rate constants are displayed in red, and individual measurements are shown as black dots. Error bars represent 95% confidence intervals. See Figure 6—figure supplement 1A for representative fits. (B) Influence of receptor levels on Squint- and Cyclops-GFP diffusivities determined using FRAP measurements. For overexpression, either 50 pg oep mRNA or 100 pg acvr2b-a mRNA were injected into wild-type embryos at the one-cell stage. acvr1b-a mutants and 0.4 ng acvr1b-b transcriptional start site-targeting morpholino (MO-1) were used for receptor loss-of-function conditions. The mean diffusion coefficients are displayed in red, and individual measurements are shown as black dots. Error bars represent 95% confidence intervals. See Figure 6—figure supplement 1B for representative fits. Scale bars represents 100 µm. (C) Margin-to-animal pole transplantations show that Nodals at endogenous expression levels can signal to distant cells. Top panel: Experimental setup of the margin-to-animal pole transplantations, in which wild-type embryos or MZsqt-/-;cyc-/- embryos that lack Nodal relay were used as hosts. Bottom panel: Immunofluorescent stainings show that pSmad2/3-positive nuclei (green) are detected outside of the transplanted clones (magenta) in both wild-type (top row) and MZsqt-/-;cyc-/- (bottom row) hosts. (D) Margin-to-margin transplants show that Nodals at endogenous expression levels can signal to distant cells at the embryonic margin. Top panel: Experimental setup. Bottom panel: Representative maximum intensity projections of immunofluorescent stainings. Transplantations into wild-type embryos (top row) and MZsqt-/-;cyc-/- embryos (bottom row) are shown. Scale bars represent 200 µm. Animal pole views are shown in (A–D). See the Figure 6—source data 1 file for source data and sample size.
-
Figure 6—source data 1
Source data for Figure 6.
- https://cdn.elifesciences.org/articles/66397/elife-66397-fig6-data1-v3.xlsx
Figure 6—figure supplement 1

Quantification of Nodal stability and diffusivity in receptor mutant or receptor overexpression embryos.
(A) Representative FDAP measurements and fits. The decrease of photoconverted Squint-Dendra2 and Cyclops-Dendra2 signal over time (black dots) was monitored and fitted with an exponentially decreasing function (red dashed line). The graphs show representative measurements performed in wild-type, acvr1 loss-of-function, oep overexpression or acvr2b-a overexpression embryos (see also Figure 6A). (B) Representative FRAP measurements and fits. Graphs show the normalized Squint-GFP signal (black dots) as a function of time after photobleaching in embryos of the indicated condition (see also Figure 6B). The fitted recovery curve is shown in red, and dashed lines indicate the time at which signal recovery is 50%. See the Figure 6—figure supplement 1—source data 1 file for source data.
-
Figure 6—figure supplement 1—source data 1
Source data for Figure 6—figure supplement 1.
- https://cdn.elifesciences.org/articles/66397/elife-66397-fig6-figsupp1-data1-v3.xlsx
Figure 6—figure supplement 2
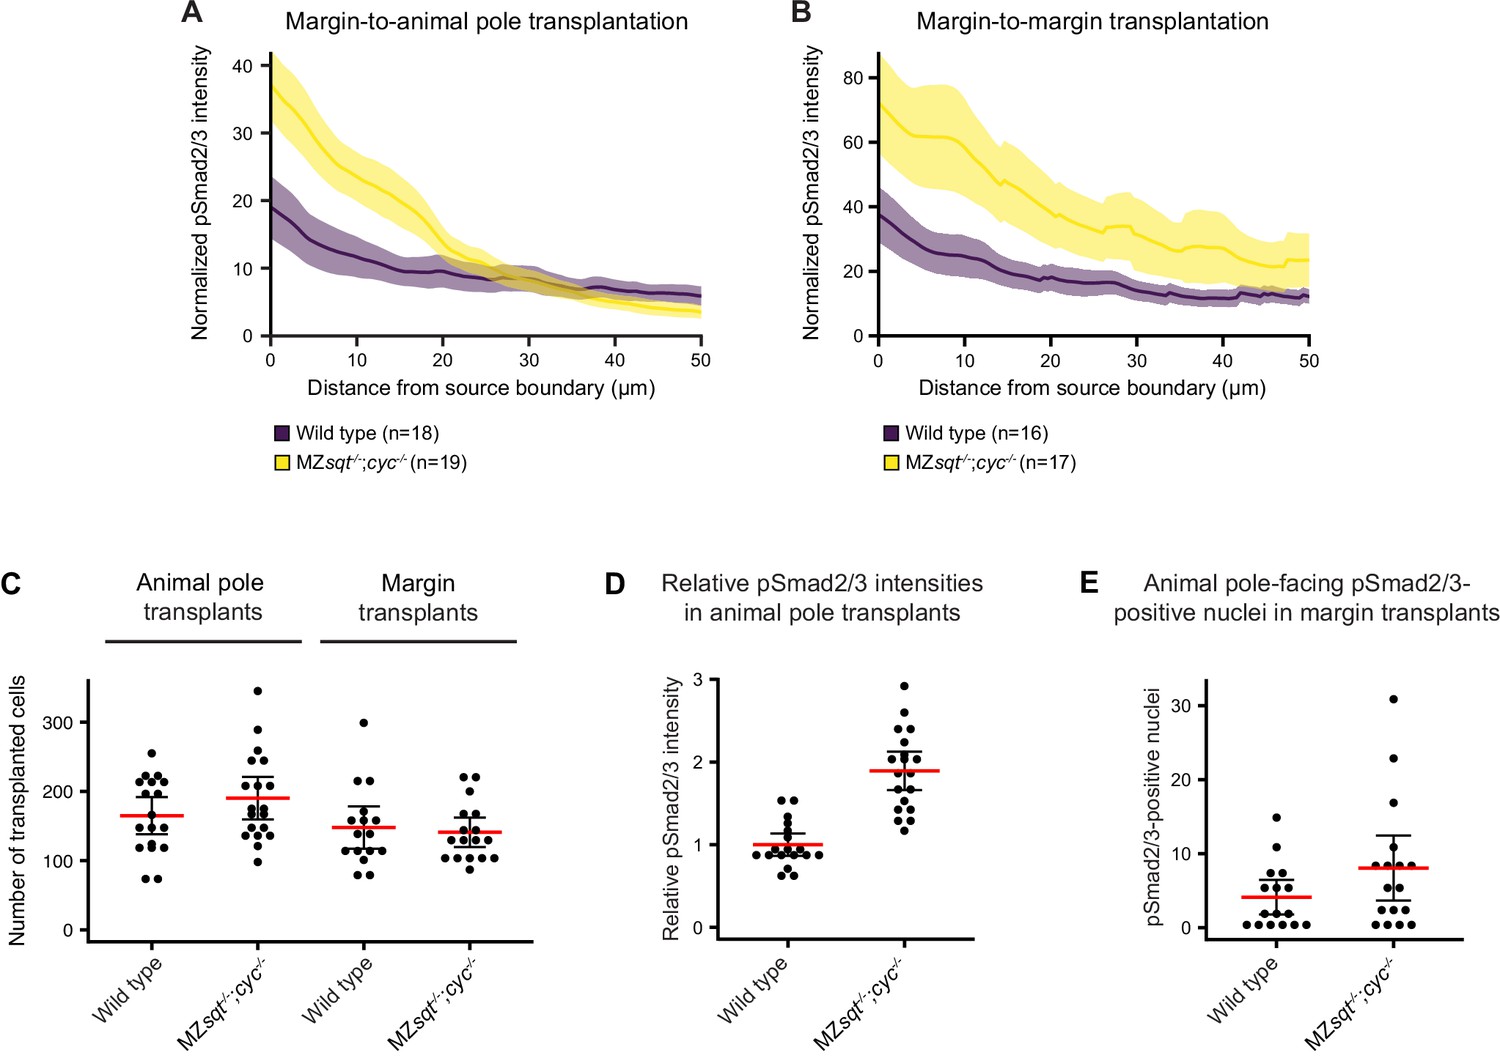
Increased pSmad2/3 signal intensities and ranges from transplants in Nodal-mutant hosts compared to wild-type hosts.
(A,B) Quantification of pSmad2/3 signal distributions from margin-to-animal pole (A) or margin-to-margin (B) transplants in wild-type and MZsqt-/-;cyc-/- hosts. Graphs show the mean background-subtracted pSmad2/3 intensities normalized to the number of transplanted cells (see (C)) as a function of distance from the transplantation site. The error bars (shaded regions) indicate SEM. The number of measured embryos is indicated in parentheses. (C) Number of GFP-positive cells transplanted to the animal pole or the margin of the indicated hosts. (D) pSmad2/3 intensities within margin-to-animal pole transplants normalized to the mean signal in wild-type embryos. (E) Number of pSmad2/3-positive nuclei extending from the distal-most end of margin-to-margin transplants in wild-type and MZsqt-/-;cyc-/- hosts. Mean intensities are displayed in red, individual measurements are shown as black dots, and error bars represent 95% confidence intervals in (C–E). See the Figure 6—figure supplement 2—source data 1 file for source data and sample size.
-
Figure 6—figure supplement 2—source data 1
Source data for Figure 6—figure supplement 2.
- https://cdn.elifesciences.org/articles/66397/elife-66397-fig6-figsupp2-data1-v3.xlsx
Tables
Appendix 1—key resources table
| Reagent type (species) or resource | Designation | Source or reference | Identifiers | Additional information |
|---|---|---|---|---|
| Antibody | Anti-chicken IgY Alexa Fluor 568-conjungated (Goat polyclonal) | Abcam | 175477 | 1:500 |
| Antibody | Anti-Digoxigenin-AP, Fab-Fragmente (Sheep polyclonal) | Sigma-Aldrich | Roche-11093274910, RRID:AB_2734716 | 1:5000 |
| Antibody | Anti-GFP antibody (Chicken polyclonal) | Aves Lab | #GFP-1020, RRID:AB_10000240 | 1:1000 |
| Antibody | Anti-phospho-Smad2/Smad3 (Rabbit monoclonal) | Cell Signaling Technology | 8828, RRID:AB_2631089 | 1:5000 |
| Antibody | Anti-phospho-Smad1/Smad5/Smad9 (Rabbit monoclonal) | Cell Signaling Technologies | 13820 S, RRID:AB_2493181 | 1:100 |
| Antibody | Anti-rabbit Alexa647 IgG (Goat polyclonal) | Invitrogen | A21245, RRID:AB_141775 | 1:100 |
| Antibody | Anti-rabbit horseradish peroxidase (Goat polyclonal) | Jackson ImmunoResearch | 111-035-003, RRID:AB_2313567 | 1:500 |
| Chemical compound, drug | DAPI | Life Technologies | D1306 | 1:5000 |
| Chemical compound, drug | FBS | Biochrom | S0415 | |
| Chemical compound, drug | Nodal inhibitor SB-505124 | Sigma | S4696-5MG | 10 µM |
| Chemical compound, drug | NucleoZol | Macherey-Nagel | 740404.200 | |
| Chemical compound, drug | Pronase | Roche | 11459643001 | |
| Commercial assay, kit | 5′/3′ RACE Kit, 2nd Generation | Roche | 03353621001 | |
| Commercial assay, kit | pCR-bluntII TOPO kit | Thermo Fisher Scientific | 450245 | |
| Commercial assay, kit | Platinum SYBR Green qPCR SuperMix-UDG | Invitrogen | 1173304 | |
| Commercial assay, kit | RNeasy MinElute Cleanup kit | Qiagen | 74204 | |
| Commercial assay, kit | RNeasy Mini kit | Qiagen | 74104 | |
| Commercial assay, kit | SP6 mMessage | Thermo Fisher Scientific | AM1340 | |
| Commercial assay, kit | SuperScript III Reverse Transcriptase | Invitrogen | 18080044 | |
| Commercial assay, kit | TSA Plus Fluorescein Kit | Perkin Elmer | NEL741001KT | TSA plus cyanine 3 |
| Commercial assay, kit | Wizard SV Gel and PCR Clean-Up System | Promega | A9282 | |
| Gene (Danio rerio) | acvr1b-a | zfin.org | ZDB-GENE-980526–527 | |
| Gene (Danio rerio) | acvr1b-b | zfin.org | ZDB-GENE-131120–9 | |
| Gene (Danio rerio) | acvr1c | zfin.org | ZDB-GENE-181207–1 | |
| Gene (Danio rerio) | acvr2a-a | zfin.org | ZDB-GENE-980526–227 | |
| Gene (Danio rerio) | acvr2a-b | zfin.org | ZDB-GENE-120215–23 | |
| Gene (Danio rerio) | acvr2b-a | zfin.org | ZDB-GENE-980526–549 | |
| Gene (Danio rerio) | acvr2b-b | zfin.org | ZDB-GENE-170621–5 | |
| Other | Alexa Fluor 647 dextran | Invitrogen | D22914 | See Materials and methods, Microinjections and embryo dechorionation |
| Other | Low-melting point agarose | Lonza | 50080 | Mounting of samples for lightsheet microscopy |
| Other | Human ACVR1B | Uniprot | P36896 | Protein sequence |
| Other | Human ACVR1C | Uniprot | Q8NER5 | Protein sequence |
| Other | Human ACVR2A | Uniprot | P27037 | Protein sequence |
| Other | Human ACVR2B | Uniprot | Q13705 | Protein sequence |
| Other | Mouse ACVR1B | Uniprot | Q61271 | Protein sequence |
| Other | Mouse ACVR1C | Uniprot | Q8K348 | Protein sequence |
| Other | Mouse ACVR2A | Uniprot | P27038 | Protein sequence |
| Other | Mouse ACVR2B | Uniprot | P27040 | Protein sequence |
| Other | Zebrafish Acvr1b-a | Uniprot | P79689 | Protein sequence |
| Other | Zebrafish Acvr1b-b | Uniprot | F1QZF0 | Protein sequence |
| Other | Zebrafish Acvr1c | Uniprot | E7F0I3 | Protein sequence |
| Other | Zebrafish Acvr2a-a | Uniprot | F1QG01 | Protein sequence |
| Other | Zebrafish Acvr2a-b | Uniprot | A0A0R4ISZ9 | Protein sequence |
| Other | Zebrafish Acvr2b-a | Uniprot | Q9YGU4 | Protein sequence |
| Other | Zebrafish Acvr2b-b | Uniprot | A0A0G2KN81 | Protein sequence |
| Peptide, recombinant protein | BamHI | NEB | R3136 | |
| Peptide, recombinant protein | Alt-R S.p. Cas9 Nuclease V3 | IDT | 1081058 | |
| Peptide, recombinant protein | ClaI-HF | NEB | R0197 | |
| Peptide, recombinant protein | EcoRI-HF | NEB | R3101 | |
| Peptide, recombinant protein | Exonuclease I (ExoI) | NEB | M0568 | |
| Peptide, recombinant protein | NotI-HF | NEB | R3189 | |
| Peptide, recombinant protein | Recombinant Shrimp Alkaline Phospatase (rSAP) | NEB | M0371L | |
| Peptide, recombinant protein | StuI (Eco147I) | Thermo Fisher | FD0424 | |
| Peptide, recombinant protein | T7 endonuclease I (T7E1) | NEB | M0302 | |
| Peptide, recombinant protein | XbaI | NEB | R0145 | |
| Peptide, recombinant protein | XhoI | NEB | R0146 | |
| Recombinant DNA reagent | Cas9 nuclease (Streptococcus pyogenes) from CMV and T7 promoters | Hwang et al., 2013 | MLM3613 RRID:Addgene_42251 | |
| Recombinant DNA reagent | pCS2+-acvr1b-a (plasmid) | Generated in this study | See Materials and methods, mRNA synthesis | |
| Recombinant DNA reagent | pCS2+-acvr1b-b (plasmid) | Generated in this study | See Materials and methods, mRNA synthesis | |
| Recombinant DNA reagent | pCS2+-acvr1c (plasmid) | Generated in this study | See Materials and methods, mRNA synthesis | |
| Recombinant DNA reagent | pCS2+-acvr2a-a (plasmid) | Generated in this study | See Materials and methods, mRNA synthesis | |
| Recombinant DNA reagent | pCS2+-acvr2a-b (plasmid) | Generated in this study | See Materials and methods, mRNA synthesis | |
| Recombinant DNA reagent | pCS2+-acvr2b-a (plasmid) | Generated in this study | See Materials and methods, mRNA synthesis | |
| Recombinant DNA reagent | pCS2+-acvr2b-b (plasmid) | Generated in this study | See Materials and methods, mRNA synthesis | |
| Recombinant DNA reagent | TOPO-acvr1b-a (plasmid) | Generated in this study | See Materials and methods, Whole-mount in situ hybridization | |
| Recombinant DNA reagent | TOPO-acvr1b-b (plasmid) | Generated in this study | See Materials and methods, Whole-mount in situ hybridization | |
| Recombinant DNA reagent | TOPO-acvr1c (plasmid) | Generated in this study | See Materials and methods, Whole-mount in situ hybridization | |
| Recombinant DNA reagent | TOPO-acvr2a-a (plasmid) | Generated in this study | See Materials and methods, Whole-mount in situ hybridization | |
| Recombinant DNA reagent | TOPO-acvr2a-b (plasmid) | Generated in this study | See Materials and methods, Whole-mount in situ hybridization | |
| Recombinant DNA reagent | TOPO-acvr2b-a (plasmid) | Generated in this study | See Materials and methods, Whole-mount in situ hybridization | |
| Recombinant DNA reagent | TOPO-acvr2b-b (plasmid) | Generated in this study | See Materials and methods, Whole-mount in situ hybridization | |
| Sequence-based reagent | Morpholino antisense oligo control | Gene Tools, LLC | ||
| Sequence-based reagent | Gene-specific crRNA | IDT | ||
| Sequence-based reagent | Alt-R CRISPR-Cas9 tracrRNA | IDT | 1072532 | |
| Software, algorithm | Blast | Uniprot | RRID:SCR_002380 | |
| Software, algorithm | CFX Manager Software | Bio-Rad | 1845000, RRID:SCR_017251 | |
| Software, algorithm | CHOPCHOP | Montague et al., 2014 | RRID:SCR_015723 | |
| Software, algorithm | Clustal Omega | Madeira et al., 2019 | RRID:SCR_001591 | |
| Software, algorithm | Excel | Microsoft | RRID:SCR_016137 | |
| Software, algorithm | Fiji | Schindelin et al., 2012 | RRID:SCR_002285 | |
| Software, algorithm | Hetindel, Version 1 | https://github.com/najasplus/hetindel_shinyapp | RRID:SCR_018922 | |
| Software, algorithm | Jalview version 2.10.3b1 | Waterhouse et al., 2009 | RRID:SCR_006459 | |
| Software, algorithm | Lasergene Seqman Pro 14 | DNASTAR | ||
| Software, algorithm | Matlab | Mathworks | http://mathworks.com RRID: SCR_001622 | |
| Software, algorithm | PolyPeakParser | Hill et al., 2014 | ||
| Software, algorithm | PyFDAP | Bläßle and Müller, 2015 | RRID:SCR_022664 | |
| Software, algorithm | PyFRAP | Bläßle et al., 2018 | RRID:SCR_022665 | |
| Software, algorithm | R | R-Core-Team | RRID:SCR_001905 | |
| Strain, stain background (E. coli) | DH5α | In-house | Chemically competent | |
| Strain, strain background (Danio rerio) | acvr1b-at03pm zebrafish mutant | Generated in this study | See Materials and methods, Fish lines and husbandry | |
| Strain, strain background (Danio rerio) | acvr1ct06pm zebrafish mutant | Generated in this study | See Materials and methods, Fish lines and husbandry | |
| Strain, strain background (Danio rerio) | acvr2a-asa34654 zebrafish mutant | EZRC | sa34654 | |
| Strain, strain background (Danio rerio) | acvr2a-bsa18285 zebrafish mutant | EZRC | sa18285 | |
| Strain, strain background (Danio rerio) | acvr2b-at08pm zebrafish mutant | Generated in this study | See Materials and methods, Fish lines and husbandry | |
| Strain, strain background (Danio rerio) | H2A.F/Z:GFP | Pauls et al., 2001 | ||
| Strain, strain background (Danio rerio) | MZsqt-/-;cyc-/- | Feldman et al., 1998; Schier et al., 1996; Ciruna et al., 2002 | Mutants were obtained by germ line transplantation | |
| Strain, strain background (Danio rerio) | oeptz57 zebrafish mutant | Gritsman et al., 1999; Zhang et al., 1998 | tz57 | |
| Strain, strain background (Danio rerio) | TE zebrafish | In-house | Wild type |
Additional files
Download links
A two-part list of links to download the article, or parts of the article, in various formats.
Downloads (link to download the article as PDF)
Open citations (links to open the citations from this article in various online reference manager services)
Cite this article (links to download the citations from this article in formats compatible with various reference manager tools)
Regulation of Nodal signaling propagation by receptor interactions and positive feedback
eLife 11:e66397.
https://doi.org/10.7554/eLife.66397


