Insights from a Pan India Sero-Epidemiological survey (Phenome-India Cohort) for SARS-CoV2
- CSIR-Institute of Genomics and Integrative Biology, India
- Academy of Scientific and Innovative Research (AcSIR), India
- CSIR-Advanced Materials and Processes Research Institute, India
- CSIR-Central Building Research Institute, India
- CSIR-Centre for Cellular Molecular Biology, India
- CSIR-Central Drug Research Institute, India
- CSIR-Central Electrochemical Research Institute, India
- CSIR-Central Electronics Engineering Research Institute, India
- CSIR-Central Food Technological Research Institute, India
- CSIR-Central Institute of Medicinal Aromatic Plants, India
- CSIR-Central Institute of Mining and Fuel Research, India
- CSIR-Central Leather Research Institute, India
- CSIR-Central Scientific Instruments Organization, India
- CSIR-Central Salt Marine Chemicals Research Institute, India
- CSIR Fourth Paradigm Institute, India
- CSIR- Headquarters, Rafi Marg, India
- CSIR-Institute of Himalayan Bioresource Technology, India
- CSIR-Indian Institute of Chemical Biology, India
- CSIR-Indian Institute of Chemical Technology, India
- CSIR-Indian Institute of Integrative Medicine, India
- CSIR-Indian Institute of Petroleum, India
- CSIR-Institute of Minerals and Materials Technology, India
- CSIR-Institute of Microbial Technology, India
- CSIR- National Aerospace Laboratories, India
- CSIR-National Chemical Laboratory, India
- CSIR-National Environmental Engineering Research Institute, India
- CSIR-North - East Institute of Science and Technology, India
- CSIR-National Geophysical Research Institute, India
- CSIR-National Institute for Interdisciplinary Science and Technology, India
- CSIR-National Institute of Oceanography, India
- CSIR-National Institute of Science, Technology and Development Studies, India
- CSIR-National Physical Laboratory, India
Figures
Figure 1
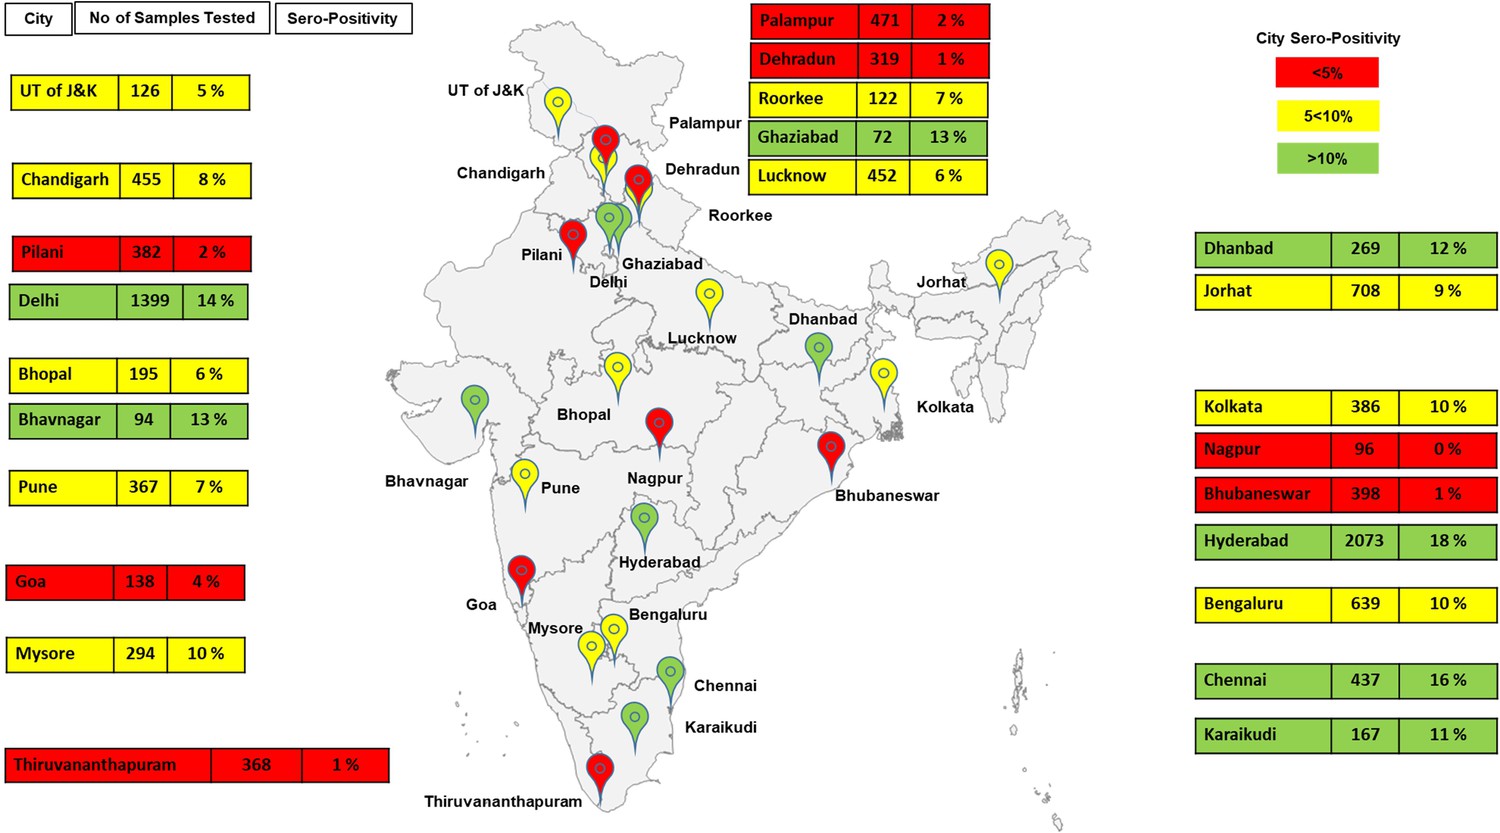
Demographics of serosurvey (India map may not be to scale and is for representation purposes only and seropositivity is rounded off).
-
Figure 1—source data 1
Data for all labs/centers utilized for Figure 2A,B.
Lab, district, and date of collection (DOC) (columns A–C), total samples collected, number of seropositive samples, seropositivity in percentage (rounded off), and number of samples tested and found positive for neutralizing antibody (NAB). Columns (E–I) Number of confirmed cases and tests done for respective states 15 days and prior and after the DOC. Columns (L–N) Data obtained from http://www.covid19India.org. State data has been utilized as a surrogate to city/district data for city/district data was not available for number of cases/tests done for many.
- https://cdn.elifesciences.org/articles/66537/elife-66537-fig1-data1-v2.docx
Figure 2
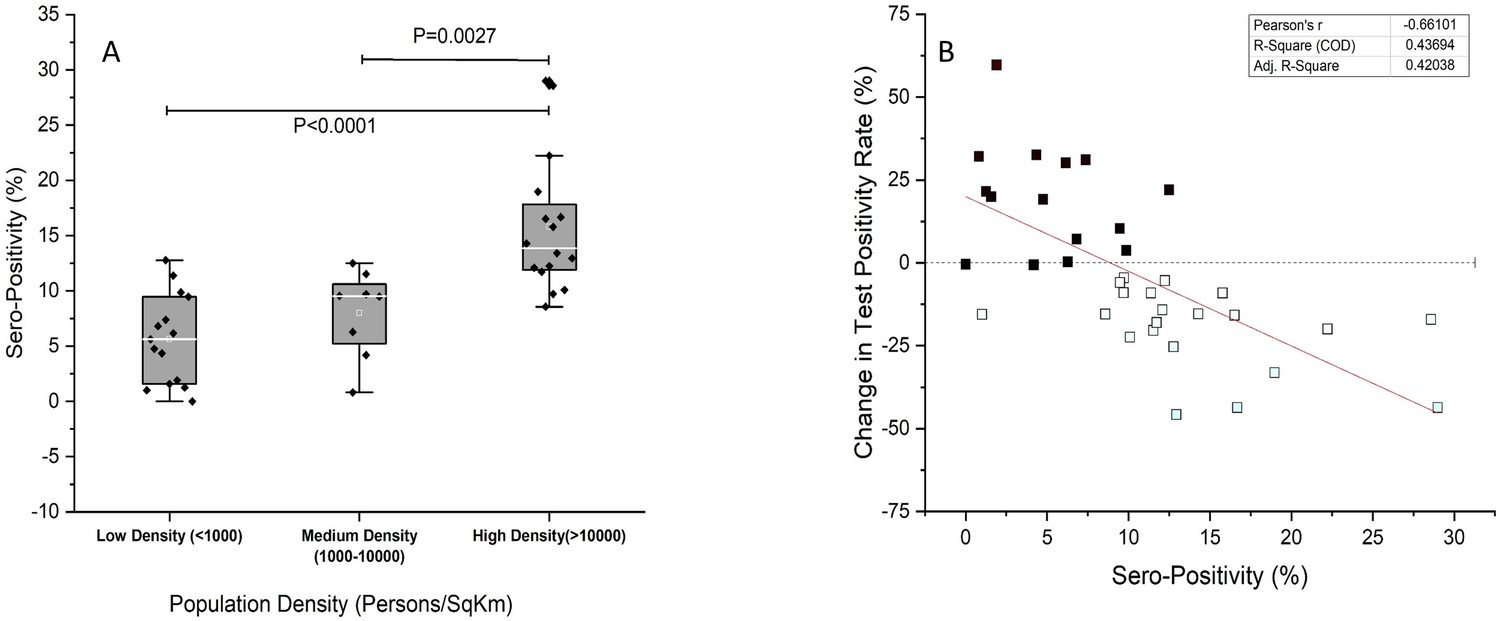
Seropositivity and test positivity rate.
(A) Population density-based seropositivity, an overall p value of <0.0001 was obtained on one-way ANOVA. (B) Change in COVID19 test positivity rate (%) for states (y-axis) against observed seropositivity of labs/centers in the state (x-axis). A negative slope reflects declining test positivity rate with increase in seropositivity.
-
Figure 2—source data 1
Data for all labs/centers utilized for Figure 2A, B.
Lab, district, and date of collection (DOC) (columns A–C), total samples collected, number of seropositive samples, seropositivity in percentage (rounded off), number of samples tested and found positive for neutralizing antibody (NAB). Columns (E–I) Number of confirmed cases and tests done for respective states 15 days and prior and after the DOC. Columns (L–N) Data obtained from http://www.covid19India.org. State data has been utilized as a surrogate to city/district data for city/district data was not available for number of cases/tests done for many.
- https://cdn.elifesciences.org/articles/66537/elife-66537-fig2-data1-v2.docx
Figure 3 with 1 supplement
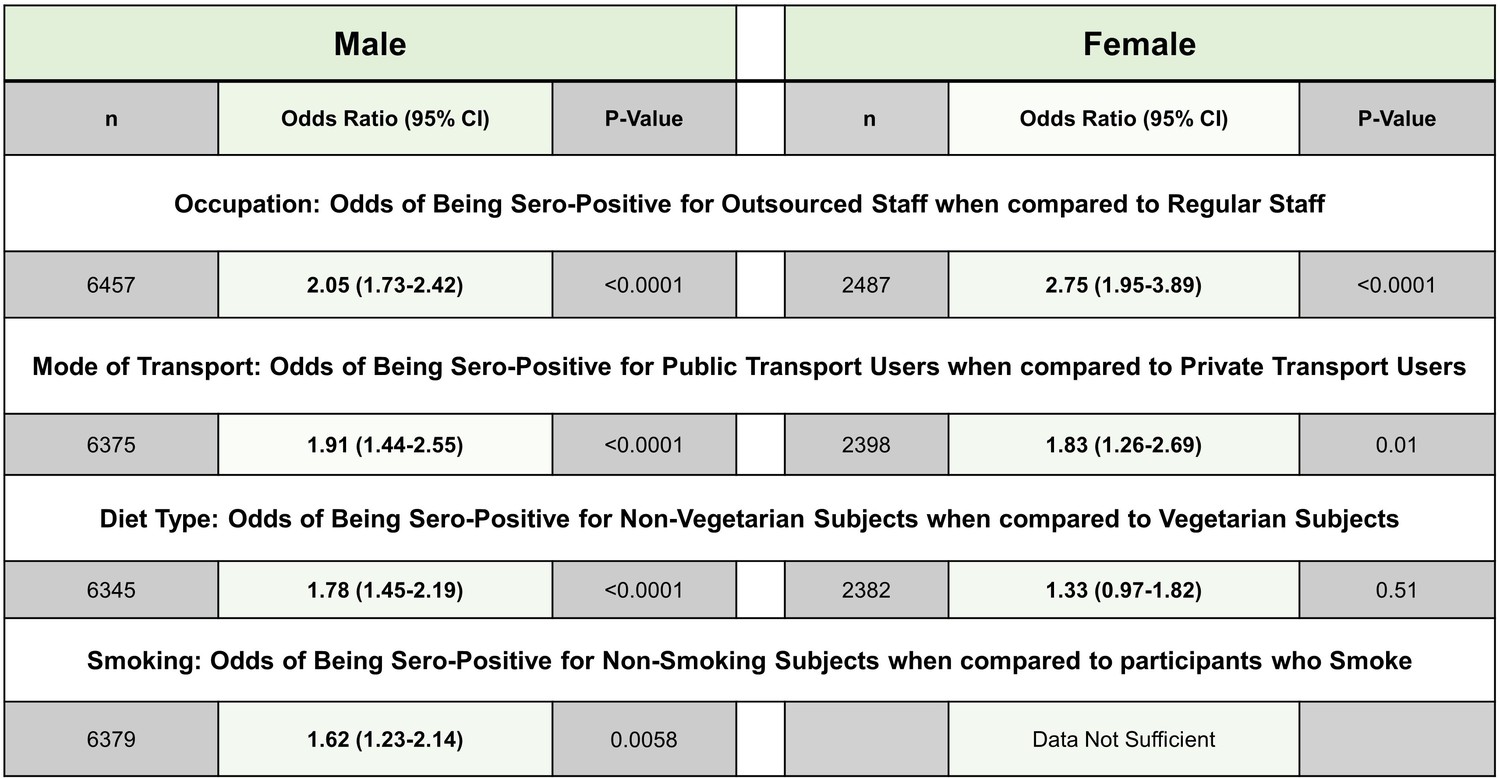
Demographics of data available for different variables.
-
Figure 3—source data 1
Raw data for Figure 3.
- https://cdn.elifesciences.org/articles/66537/elife-66537-fig3-data1-v2.xlsx
-
Figure 3—source data 2
Source file for tables show in Figure 3.
- https://cdn.elifesciences.org/articles/66537/elife-66537-fig3-data2-v2.docx
Figure 3—figure supplement 1
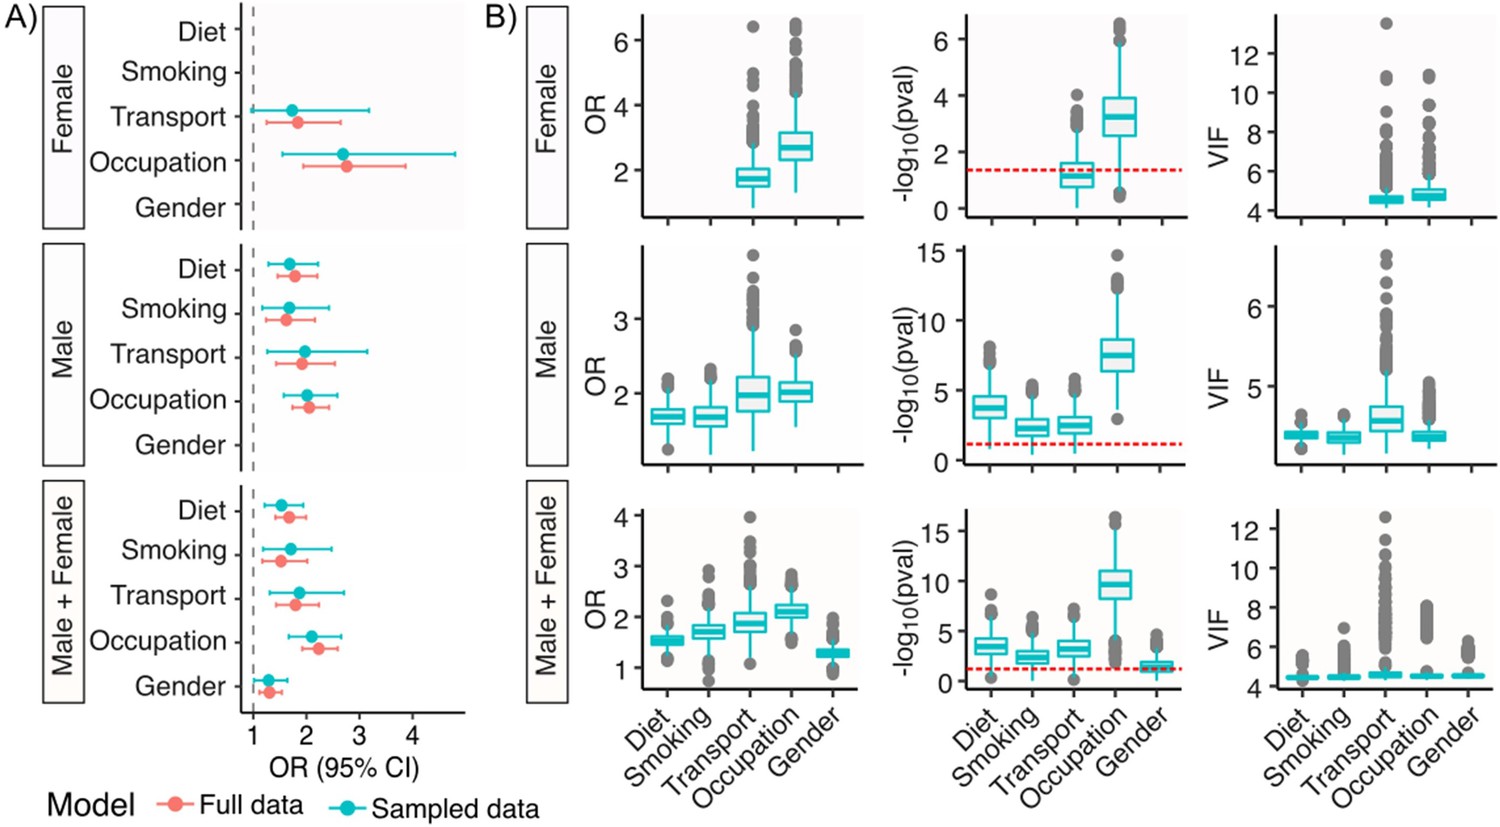
Regression model of seropositivity.
(A) Odds ratio of full dataset and sampled dataset obtained from model. (B) Odds ratio, p value, and variance inflation factor (VIF) for sampled dataset with iterations on regression model. For diet: non-vegetarian against vegetarian; for smoking: non-smoking against smoking; for transportation: public against private; for occupation: outsourced staff against staff; for gender: male against female.
Figure 4

Antibody levels (A) and neutralizing activity (B) level at baseline (x-axis) and after 3 months (y-axis).
Antibody levels (C) and neutralizing activity (D) level at baseline (x-axis) and after 5–6 months (y-axis).
-
Figure 4—source data 1
Raw data for antibody and neutralizing antibody levels at baseline, 3 months and 5-6 months.
- https://cdn.elifesciences.org/articles/66537/elife-66537-fig4-data1-v2.xlsx
Additional files
-
Supplementary file 1
Male:female distribution among asymptomatic and symptomatic seropositive individuals.
- https://cdn.elifesciences.org/articles/66537/elife-66537-supp1-v2.docx
-
Supplementary file 2
Frequency of symptoms in symptomatic seropositive individuals.
- https://cdn.elifesciences.org/articles/66537/elife-66537-supp2-v2.docx
-
Supplementary file 3
Distribution for blood group type in our cohort against national average and positivity among different blood groups.
OR: odds ratio.
- https://cdn.elifesciences.org/articles/66537/elife-66537-supp3-v2.docx
-
Transparent reporting form
- https://cdn.elifesciences.org/articles/66537/elife-66537-transrepform-v2.docx
Download links
A two-part list of links to download the article, or parts of the article, in various formats.
Downloads (link to download the article as PDF)
Open citations (links to open the citations from this article in various online reference manager services)
Cite this article (links to download the citations from this article in formats compatible with various reference manager tools)
Insights from a Pan India Sero-Epidemiological survey (Phenome-India Cohort) for SARS-CoV2
eLife 10:e66537.
https://doi.org/10.7554/eLife.66537


