GAF is essential for zygotic genome activation and chromatin accessibility in the early Drosophila embryo
- Department of Biomolecular Chemistry, University of Wisconsin School of Medicine and Public Health, United States
Figures
Figure 1 with 3 supplements
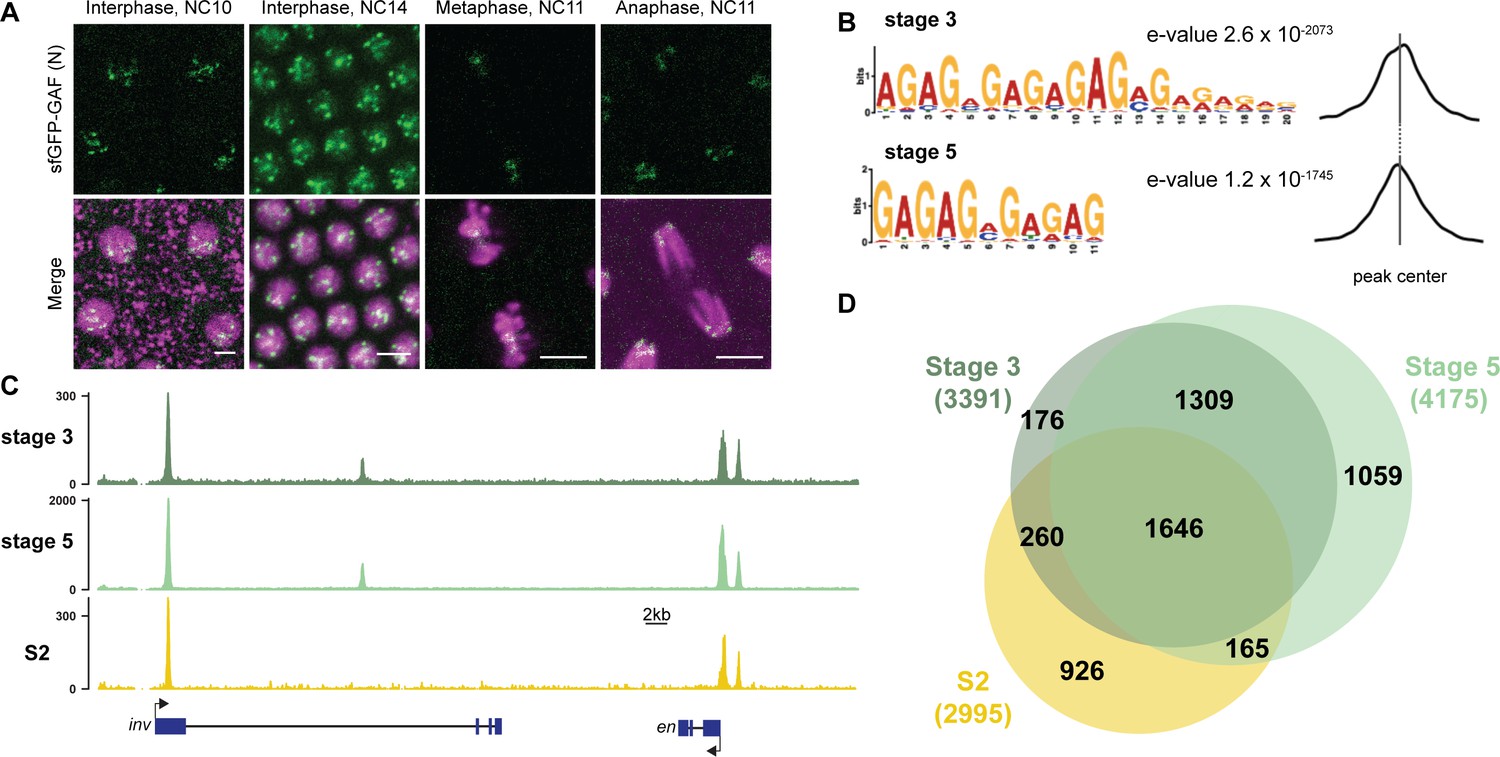
GAF binds thousands of loci throughout the MZT.
(A) Images of His2Av-RFP; sfGFP-GAF(N) embryos at the nuclear cycles (NC) indicated above. sfGFP-GAF(N) localizes to puncta during interphase and is retained on chromosome during mitosis. His2AvRFP is shown in magenta. sfGFP-GAF(N) is shown in green. Scale bars, 5 µm. (B) Binding motif enrichment of GA-dinucleotide repeats at GAF peaks identified at stage 3 and stage 5 determined by MEME-suite (left). Distribution of the GA-repeat motif within peaks (right). Gray line indicates peak center. (C) Representative genome browser tracks of ChIP-seq peaks for GAF-sfGFP(C) from stage 3 and stage 5 embryos and GAF ChIP-seq from S2 cells (Fuda et al., 2015). (D) Venn diagram of the peak overlap for GAF as determined by ChIP-seq for GAF-sfGFP(C) from sorted stage 3 embryos and stage 5 embryos and by ChIP-seq for GAF from S2 cells (Fuda et al., 2015). Total number of peaks identified at each stage is indicated in parentheses. See also Figure 1—figure supplements 1–3.
Figure 1—figure supplement 1
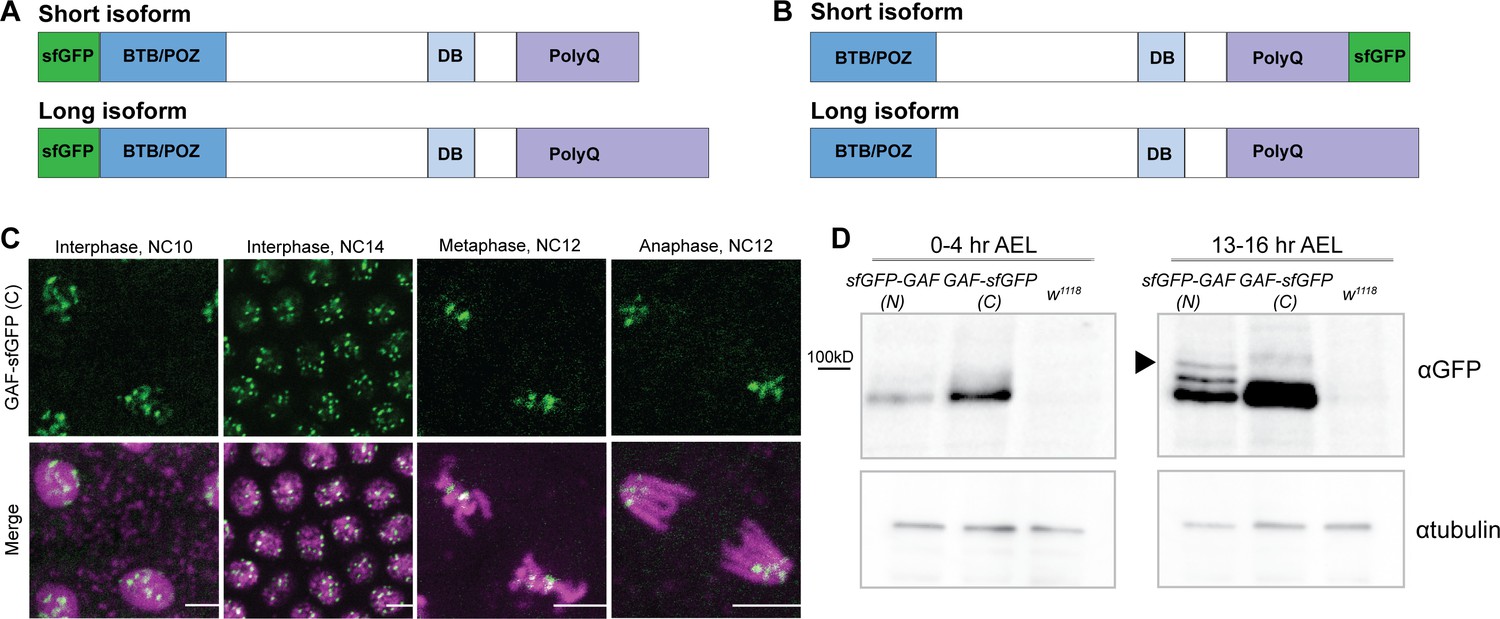
N- and C- terminal sfGFP-tags label distinct GAF isoforms.
(A) Cartoon representation of the N-terminal sfGFP tag both GAF protein isoforms. (B) Cartoon representation of C-terminal sfGFP tag on the short GAF protein isoform. (C) Confocal images of living His2Av-RFP; GAF-sfGFP(C) embryos in interphase during NC10 and NC14 and mitosis during NC12. His2Av-RFP is shown in magenta, GAF-sfGFP(C) is shown in green. Scale bars, 5 µm. (D) Immunoblot on embryo extract from sfGFP-GAF(N) homozygous, GAF-sfGFP(C) homozygous, and w1118 lines 0–4 hr after egg laying (AEL) and 13–16 hr AEL with an anti-GFP antibody. αtubulin is shown as a loading control. Arrowhead indicates the long GAF isoform.
Figure 1—figure supplement 2
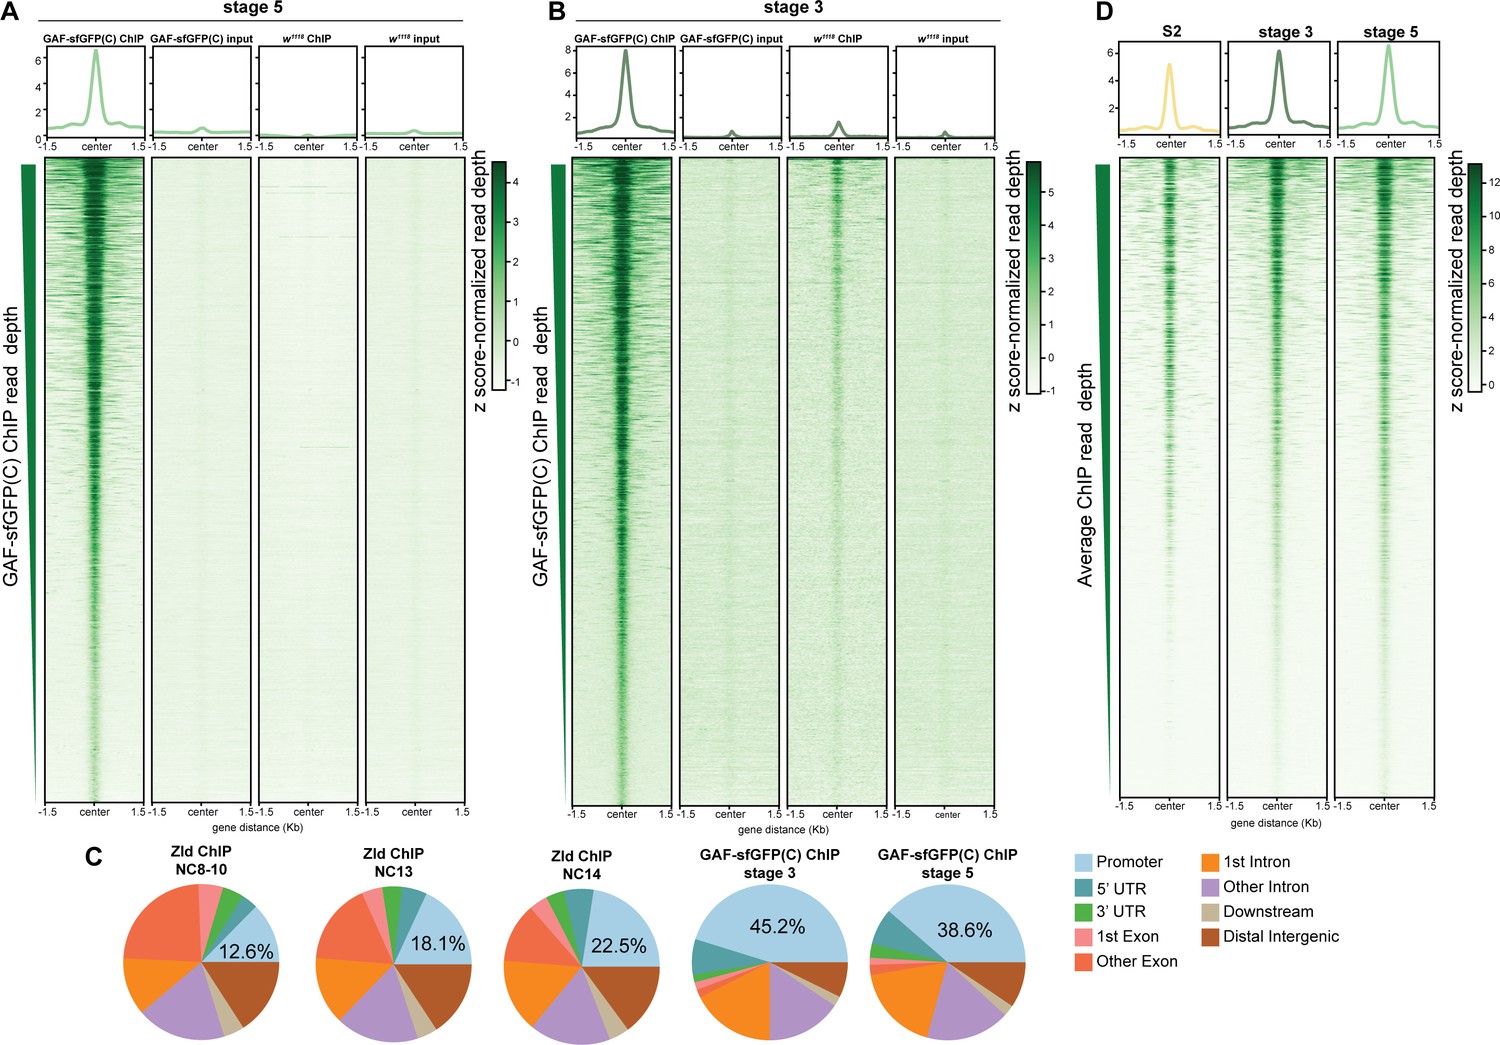
GAF binds thousands of regions in the embyo and S2 cells.
(A) Heatmap of stage 5 GAF-sfGFP(C) ChIP, GAF-sfGFP(C) input, w1118 ChIP, and w1118 input peaks (n = 4175). Immunoprecipitation was performed with an anti-GFP antibody. (B) Heatmap of stage 3 GAF-sfGFP(C) ChIP, GAF-sfGFP(C) input, w1118 ChIP, and w1118 input peaks (n = 3391). Immunoprecipitation was performed with an anti-GFP antibody. (C) Genomic distribution of Zld binding at NC8-10, NC13, and NC14 (Harrison et al., 2011) and GAF binding at stage 3 and stage 5. (D) Heatmaps of GAF binding in S2 cells (Fuda et al., 2015) and GAF-sfGFP(C) binding in stage 3 and stage 5 embryos for all 4175 regions with a stage 5 ChIP peak.
Figure 1—figure supplement 3
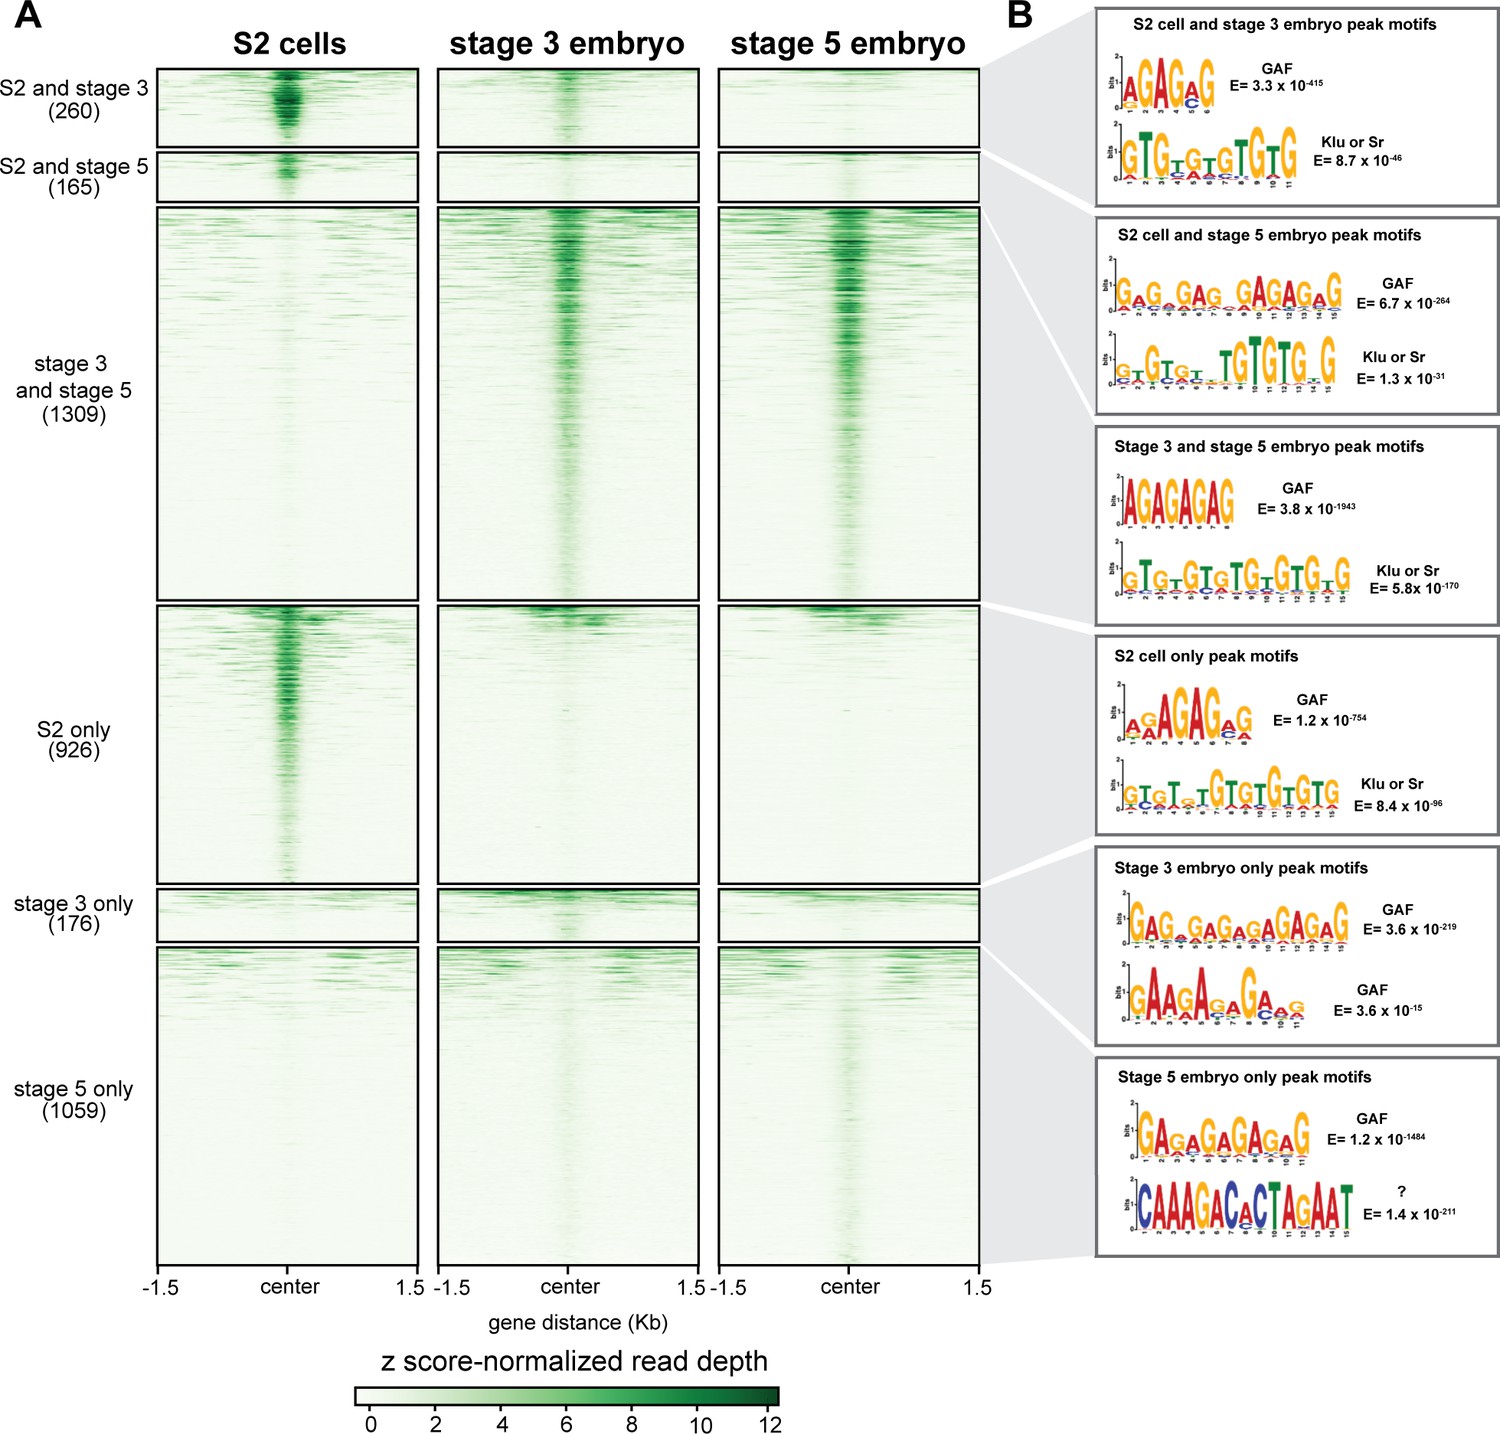
GAF has tissue-specific binding.
(A) Heatmap of GAF ChIP-seq peaks in S2 cells (Fuda et al., 2015) and GAF-sfGFP(C) ChIP-seq peaks from stage 3 and stage 5 embryos (this work), excluding peaks that are shared in all three datasets. The heatmap is divided into subclasses as labeled. (B) The top two motifs enriched in each subclass of peaks as identified by MEME suite. Note the top motif in each subclass is a GA-rich motif known to be bound by GAF.
Figure 2 with 1 supplement
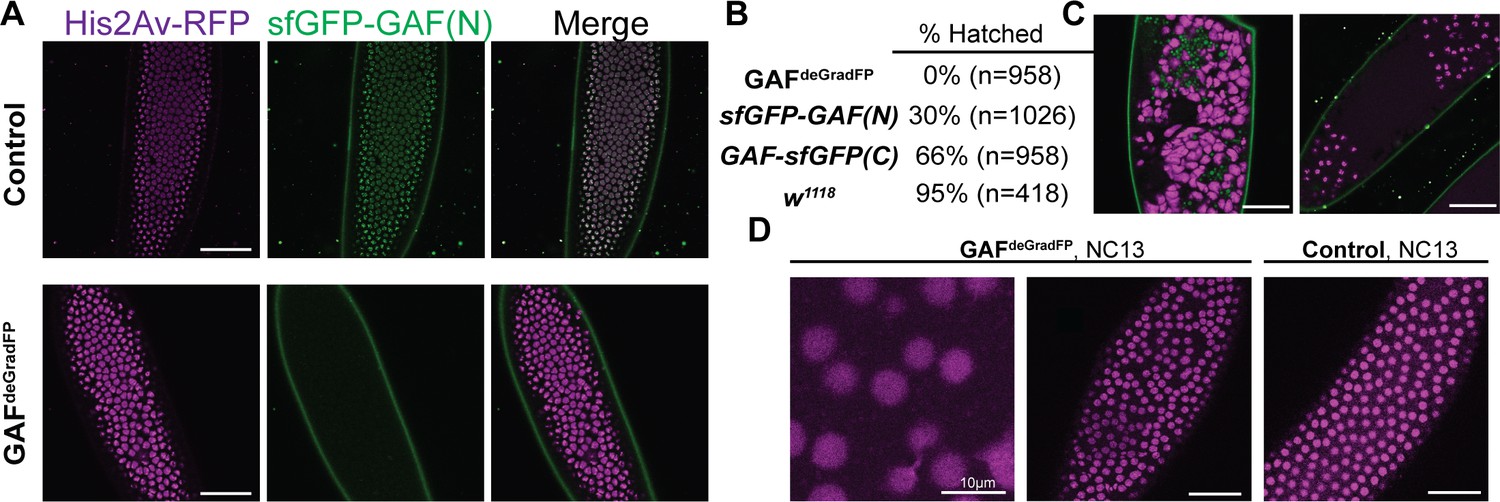
Embryos lacking maternal GAF die during early embryogenesis with nuclear and mitotic defects.
(A) Images of control (maternal genotype: His2Av-RFP; sfGFP-GAF(N)) and GAFdeGradFP (maternal genotype: His2Av-RFP/nos-deGradFP; sfGFP-GAF(N)) embryos at NC14, demonstrating loss of nuclear GFP signal specifically in GAFdeGradFP embryos. His2Av-RFP marks the nuclei. (B) Hatching rates after > 24 hr. (C) Confocal images of His2Av-RFP in arrested/dying GAFdeGradFP embryos with blocky nuclei, mitotic arrest, and nuclear fallout. (D) Confocal images of His2Av-RFP in NC13 control and GAFdeGradFP embryos, showing disordered nuclei and anaphase bridges in GAFdeGradFP embryos. Scale bars, 50 µm except where indicated. See also Figure 2—figure supplement 1.
Figure 2—figure supplement 1
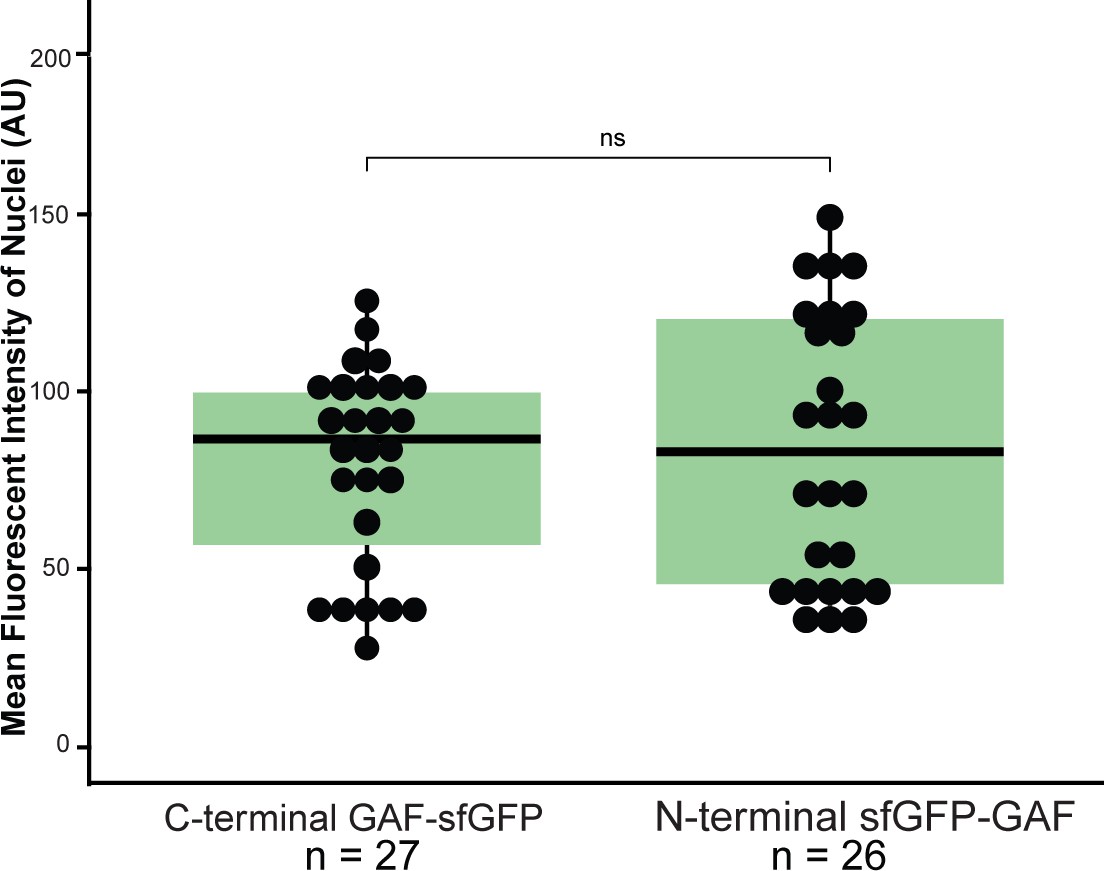
sfGFP-GAF(N) and GAF-sfGF(C) are expressed at similar levels in the early embryo.
Boxplots showing the mean fluorescent intensity (arbitrary units, AU) of 10 nuclei in GAF-sfGFP(C) homozygous embryos (n = 27) and sfGFP-GAF(N) homozygous embryos (n = 26). The box indicates the lower (25%) and upper (75%) quantiles, and the solid line indicates the median. p-value=0.52 as determined by Wilcoxon rank sum test.
Figure 3 with 3 supplements

GAF is required for zygotic genome activation.
(A) Volcano plot of transcripts mis-expressed in GAFdeGradFP embryos as compared to sfGFP-GAF(N) controls. Stage 5 GAF-sfGFP(C) ChIP-seq was used to identify GAF-bound target genes. (B) The percentage of up-regulated and down-regulated transcripts in GAFdeGradFP embryos classified as maternal, zygotic, or maternal-zygotic based on Lott et al., 2011. (C) Overlap of down-regulated embryonic transcripts in the absence of GAF or Zld activity (p<2.2×10⁻¹⁶, log2(odds ratio)=3.16, two-tailed Fisher’s exact test). Down-regulated genes for Zld are from McDaniel et al., 2019. (D) Transcripts down-regulated in both GAFdeGradFP and ZldCRY2 embryos or in either condition alone were classified based on temporal expression during ZGA (Li et al., 2014). Early = NC10-11, Mid = NC12-13, Late = early NC14, Later = late NC14. Only genes that were assigned to one of the four classes are shown. See also Figure 3—figure supplements 1–3.
Figure 3—figure supplement 1
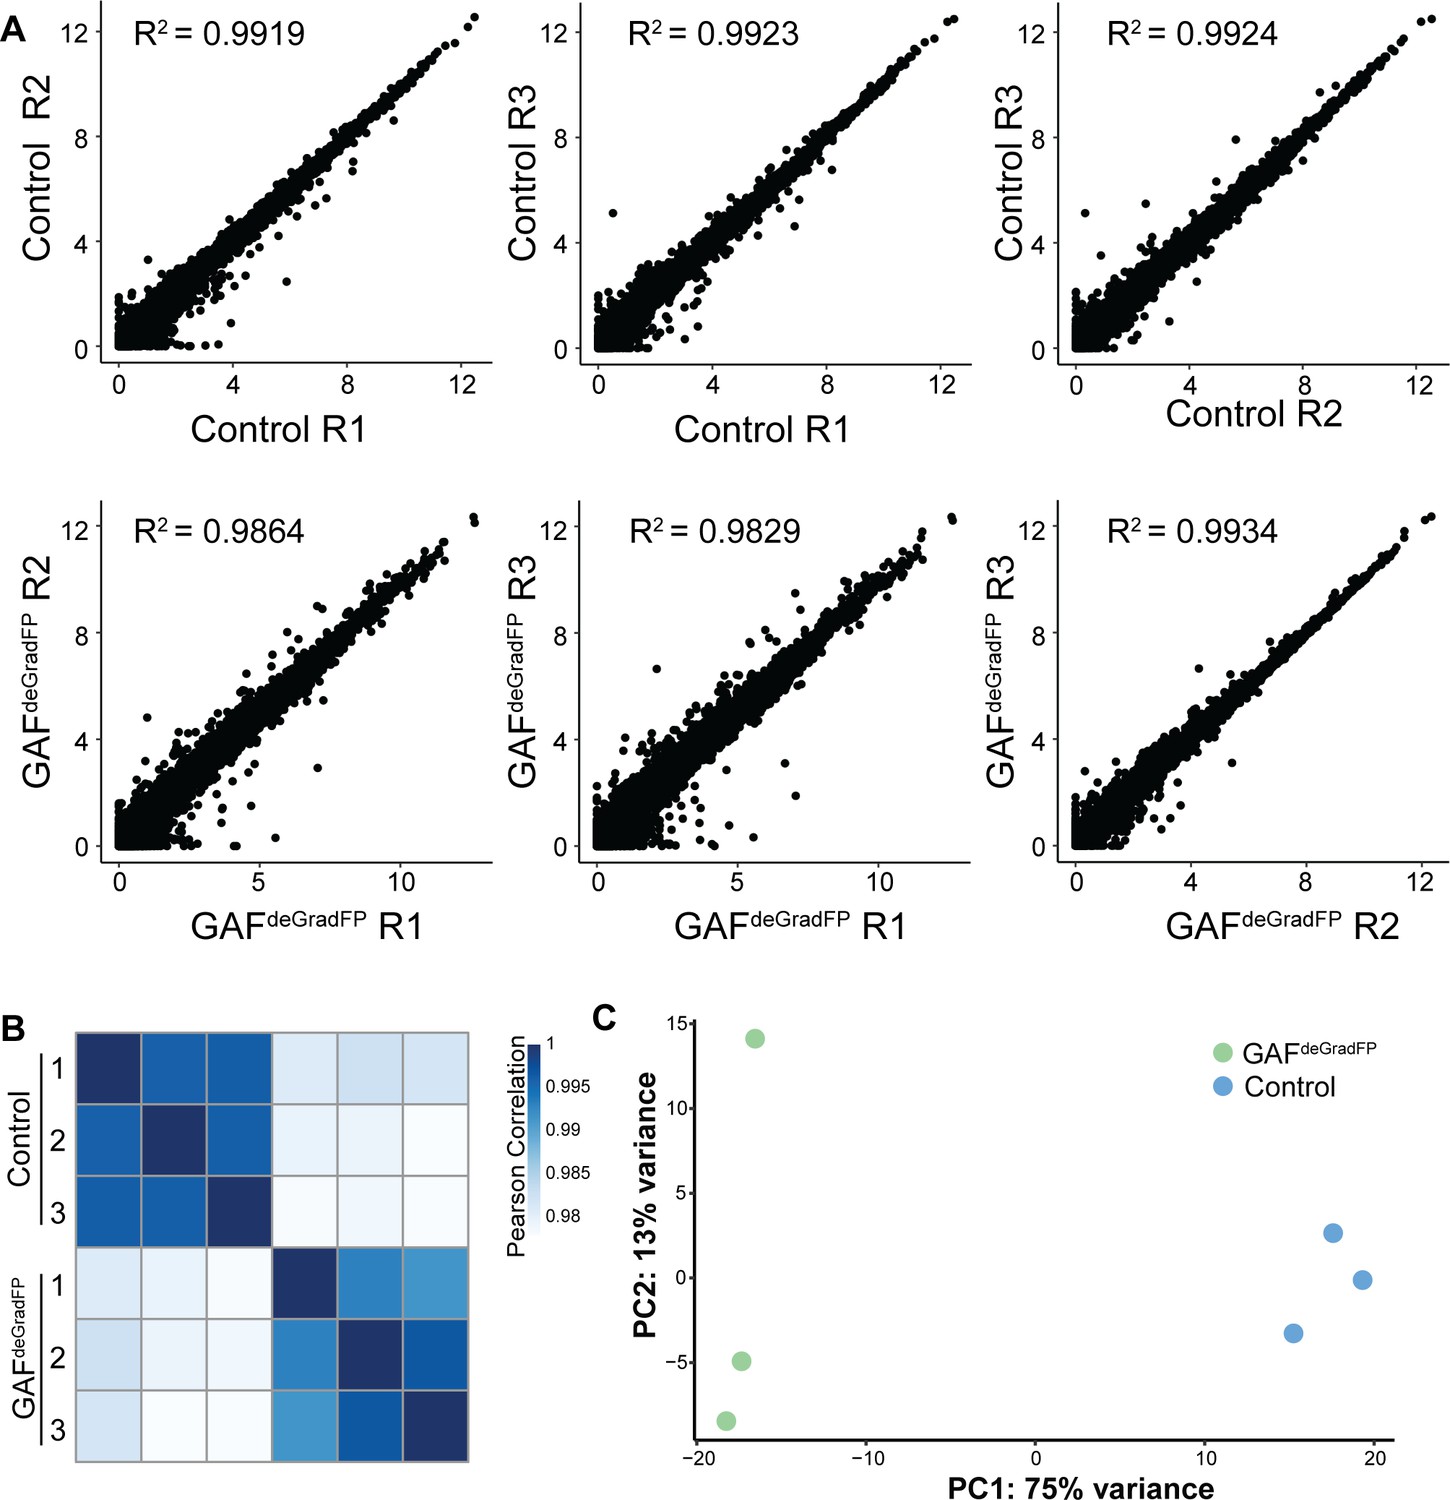
RNA-seq replicates are reproducible.
(A) Pairwise scatterplots showing correlation between the three RNA-seq replicates for GAFdeGradFP and sfGFP-GAF(N) homozygous controls. Values are log2 (RPKM +1). Pearson correlation coefficients are indicated. (B) Heatmap of Pearson correlation coefficient between RNA-seq replicates for GAFdeGradFP and sfGFP-GAF(N) homozygous controls. (C) PCA plot of RNA-seq replicates from GAFdeGradFP and sfGFP-GAF(N) homozygous controls.
Figure 3—figure supplement 2
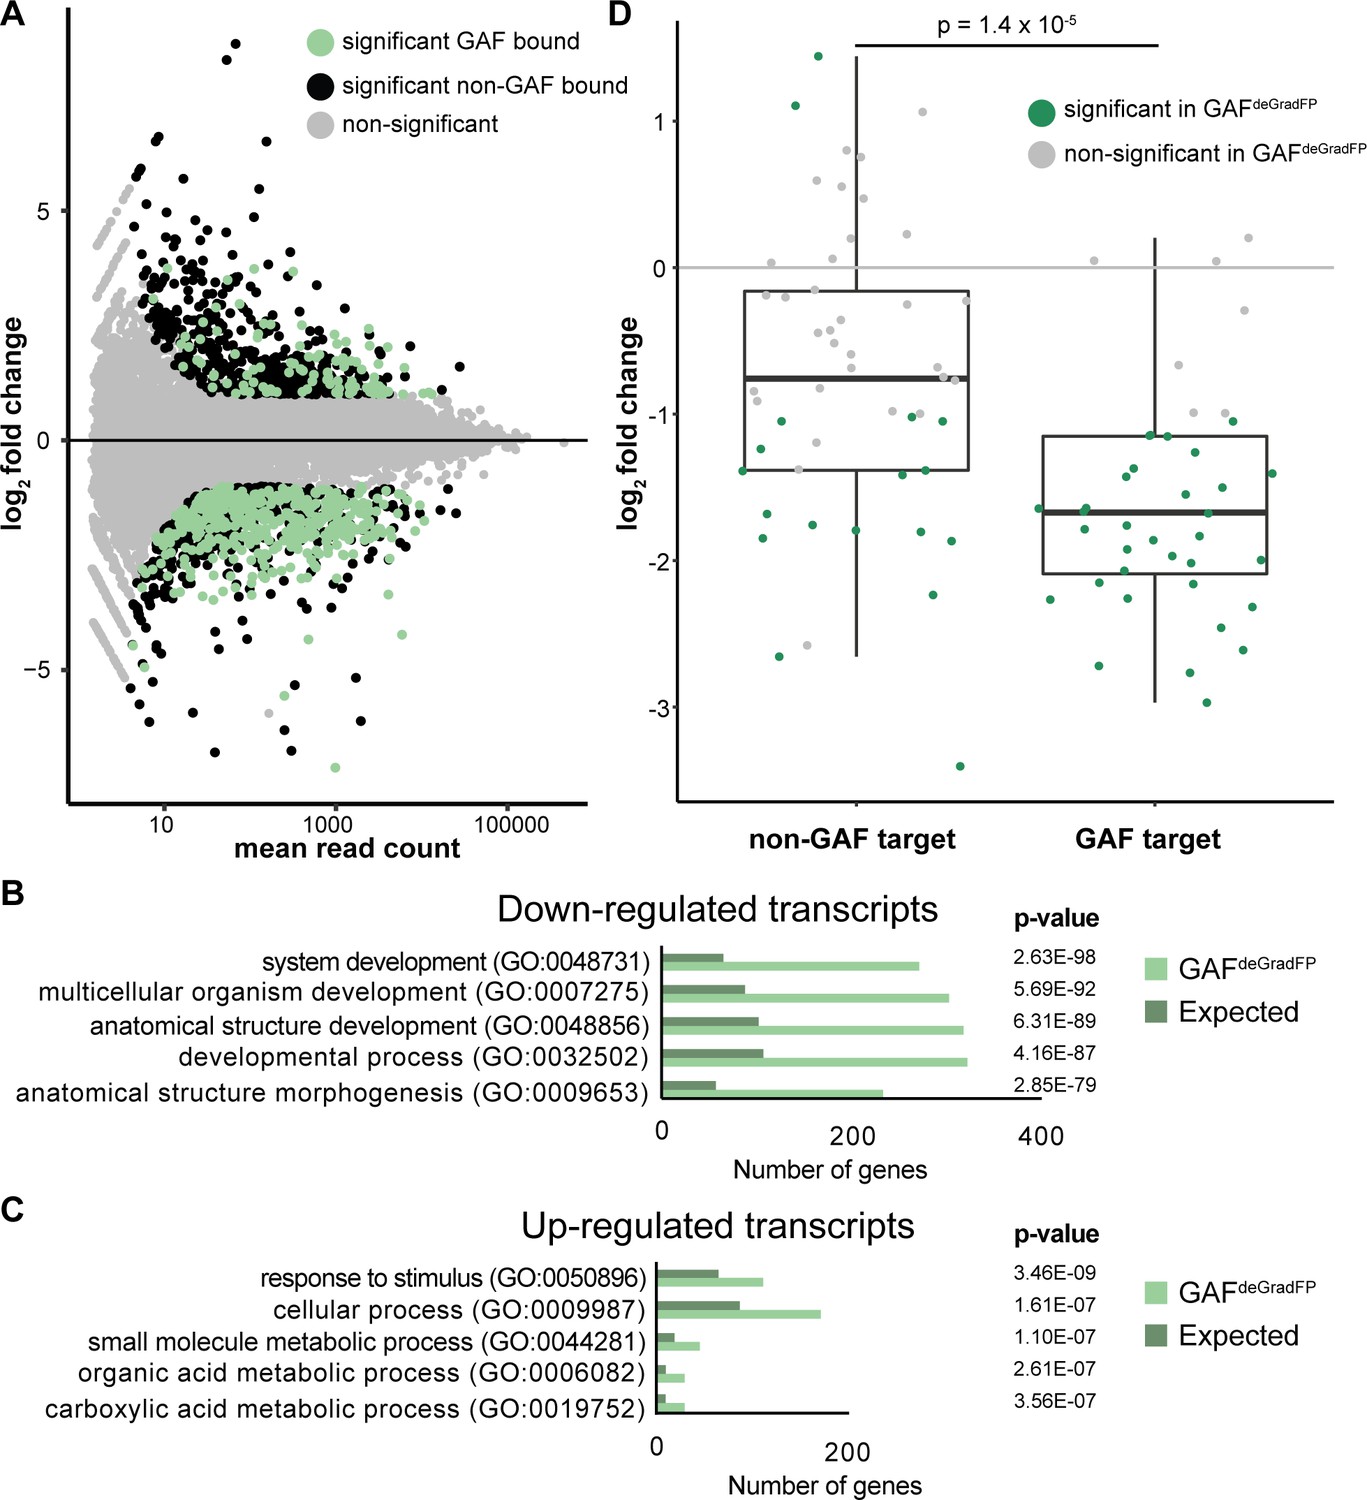
RNA-seq identifies genes mis-regulated in GAFdeGradFP embryos.
(A) MA plot of transcripts mis-expressed in GAFdeGradFP embryos as compared to sfGFP-GAF(N) homozygous controls. Stage 5 GAF-sfGFP(C) ChIP-seq was used to identify GAF-bound target genes. (B) log2 fold change of genes expressed at NC14 (Li et al., 2014, ‘later’ class) in GAFdeGradFP embryos compared to sfGFP-GAF(N) homozygous controls. Genes are divided by those that have a proximal GAF-binding site as identified by ChIP-seq (GAF target) and those that do not (non-GAF target). Color indicates those that are significantly changed in the GAFdeGradFP embryos as compared to sfGFP-GAF(N) homozygous controls. GAF-target genes are significantly more down-regulated than non-GAF target genes (p – 1.4 × 10⁻⁵, Wilcoxon rank sum test). (C) Gene Ontology (GO) term analysis was performed on transcripts down-regulated in GAFdeGradFP embryos compared to controls. (D) Gene Ontology (GO) term analysis was performed on transcripts up-regulated in GAFdeGradFP embryos compared to controls.
Figure 3—figure supplement 3
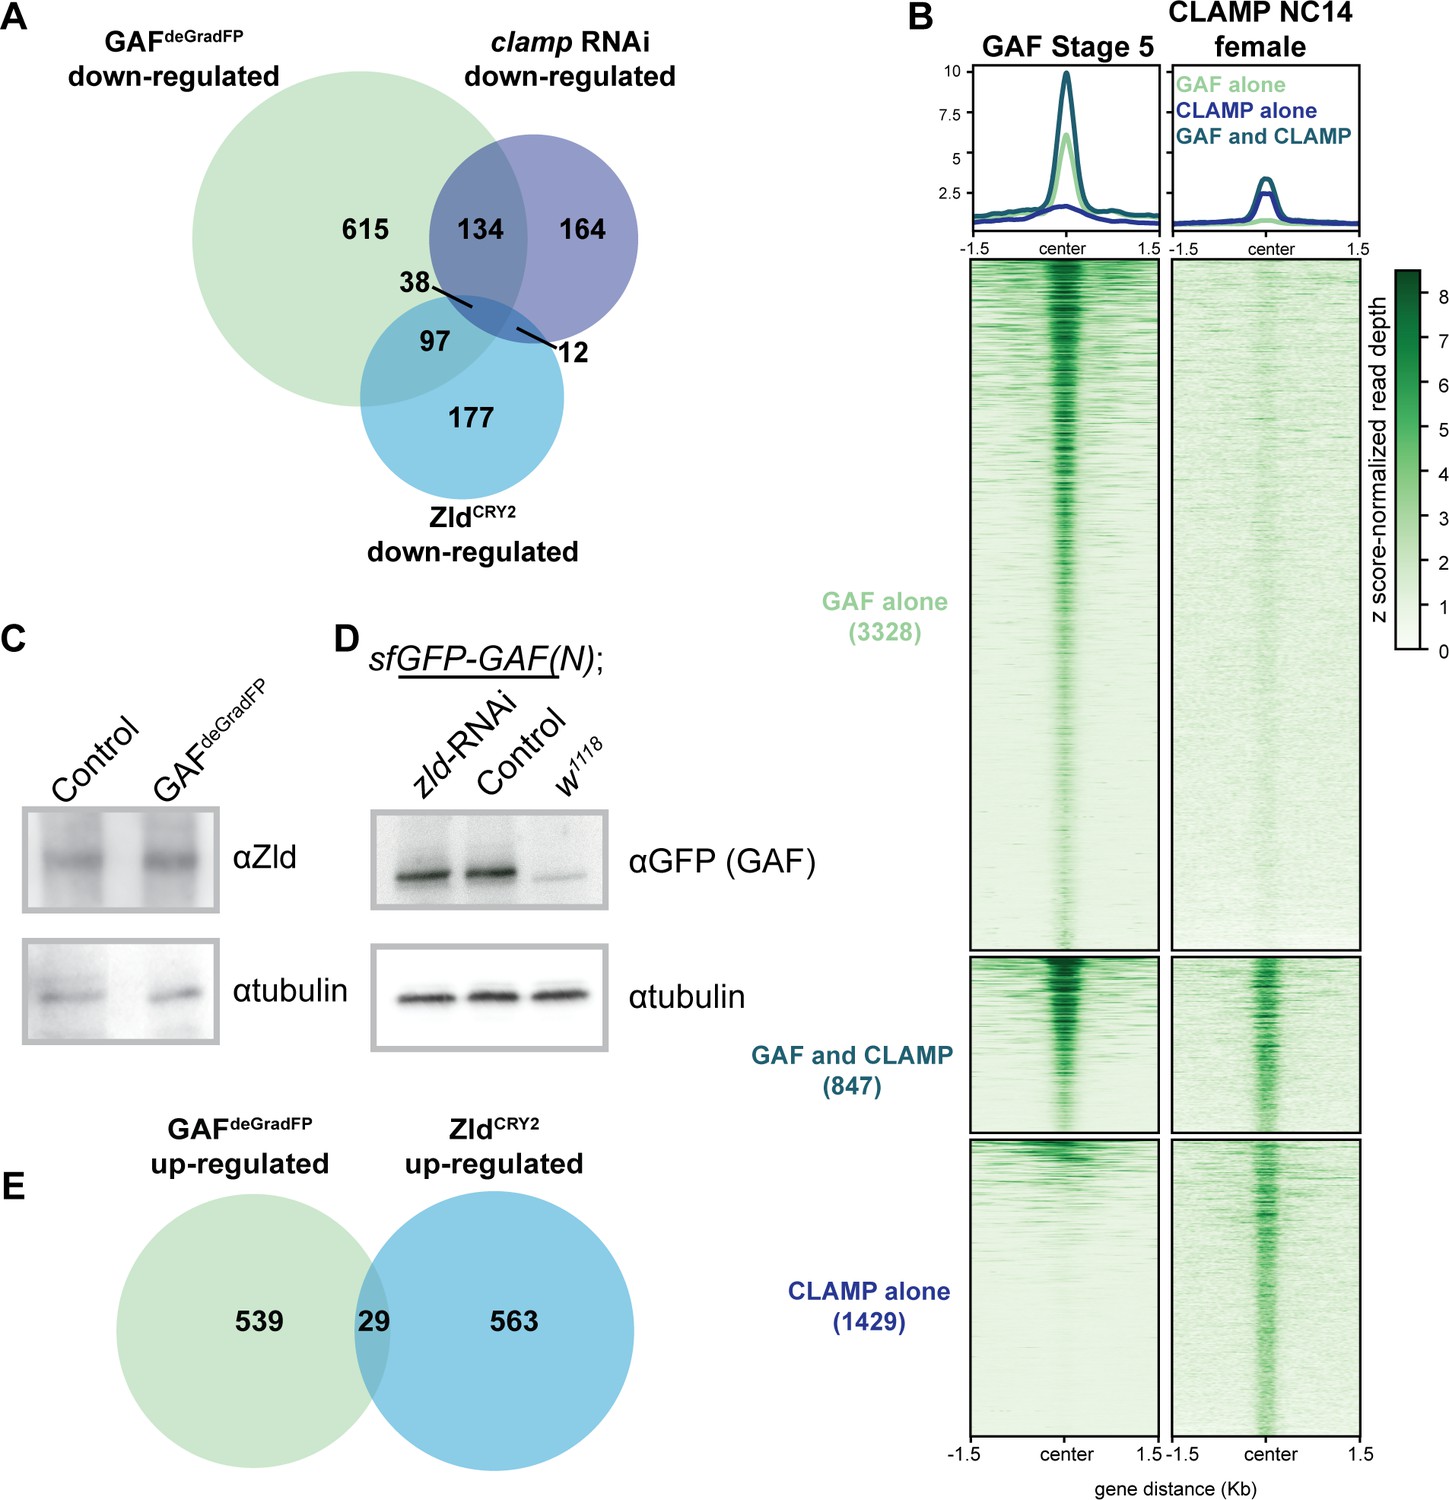
GAF regulates genes distinct from Zld and CLAMP.
(A) Overlap of transcripts down-regulated in GAFdeGradFP embryos, down-regulated in ZldCRY2 embryos at NC14 (McDaniel et al., 2019), and down-regulated in clamp-RNAi 2–4 hr embryos (Rieder et al., 2017). (B) Heatmap of GAF-sfGFP(C) ChIP peaks at stage 5 and CLAMP ChIP peaks in female embryos at NC14. CLAMP ChIP-seq from Rieder et al., 2019. (C) Immunoblot of extract from 2 to 2.5 hr AEL GAFdeGradFP and sfGFP-GAF(N) homozygous control embryos using anti-Zld antibody. Tubulin is shown as a loading control. (D) Immunoblot of extract from 2 to 2.5 hr AEL sfGFP-GAF(N) embryos in which zld was depleted (zld-RNAi) and in which zld levels were unperturbed (Control) probed with anti-GFP antibody. w1118 embryos are included as controls for anti-GFP immunoreactivity. Tubulin is shown as a loading control. (E) Overlap of transcripts up-regulated in GAFdeGradFP embryos and ZldCRY2 embryos (McDaniel et al., 2019) (p=0.64, log2(odds ratio)=−0.16, two-tailed Fisher’s exact test).
Figure 4 with 2 supplements
At the majority of loci, GAF and Zld bind chromatin independently.
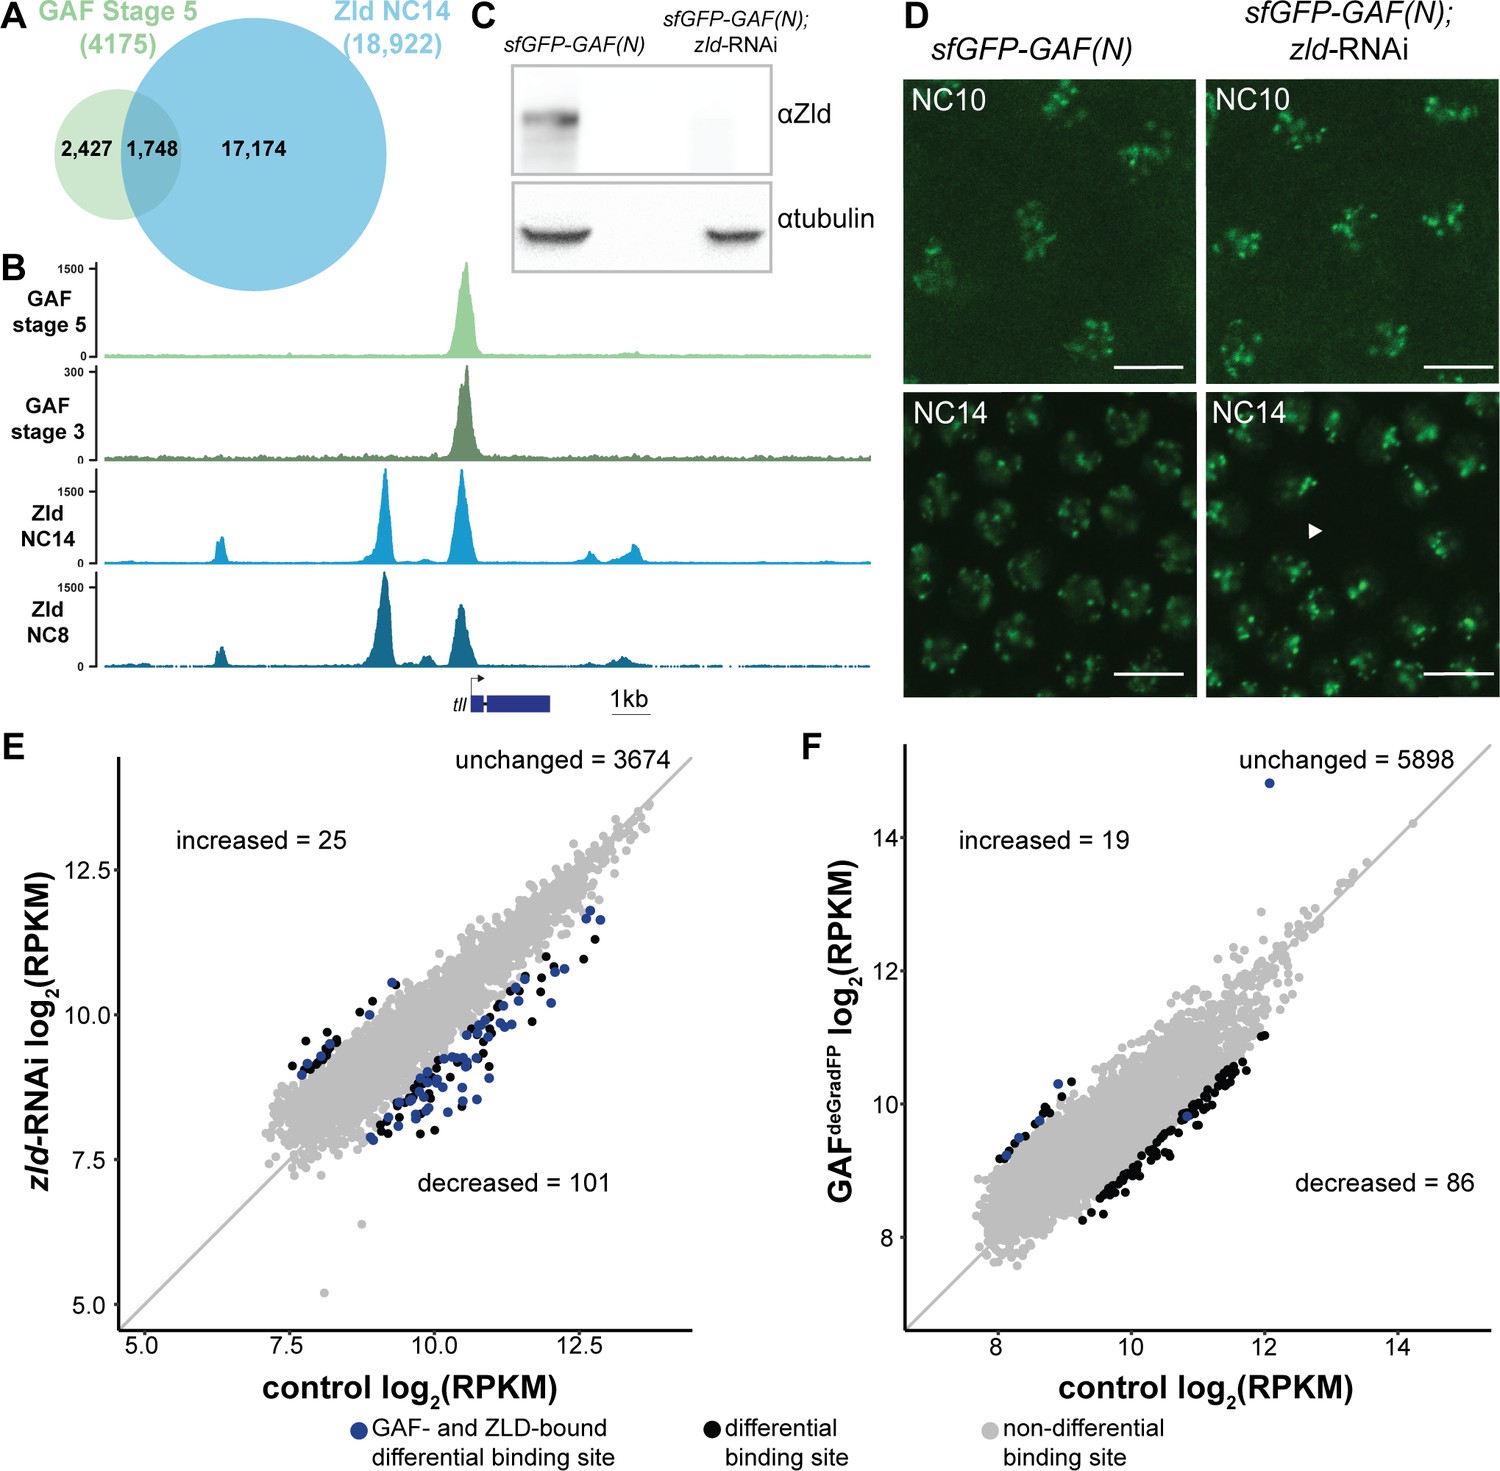
(A) Overlap of Zld- and GAF-binding sites determined by GAF-sfGFP(C) stage 5 ChIP-seq and Zld NC14 ChIP-seq (Harrison et al., 2011). (B) Representative genome browser tracks of Zld and GAF ChIP-seq peaks at the tailless locus. (C) Immunoblot for Zld on embryo extracts from zld-RNAi; sfGFP-GAF(N) and sfGFP-GAF(N) control embryos harvested 2–3 hr AEL. Tubulin was used as a loading control. (D) Images of zld-RNAi; sfGFP-GAF(N) embryos and sfGFP-GAF(N) control embryos at NC10 and NC14 as marked. Arrowhead shows nuclear dropout, a phenotype indicative of zld loss-of-function. Scale bar, 10 µm. (E) Correlation between log2(RPKM) of ChIP peaks for GAF from GAF-sfGFP(N) stage 5 embryos (control) and zld-RNAi; sfGFP-GAF(N) embryos (zld-RNAi). Color highlights significantly changed peaks (adjusted p-value<0.05, fold change > 2) and those that are bound by both GAF and Zld as indicated below. (F) Correlation between log2(RPKM) of ChIP peaks for Zld from sfGFP-GAF(N) embryos (control) and GAFdeGradFP embryos fixed 2–2.5 hr AEL. Color highlights significantly changed peaks (adjusted p-value<0.05, fold change > 2) and those that are bound by both GAF and Zld as indicated below. See also Figure 4—figure supplements 1–2.
Figure 4—figure supplement 1
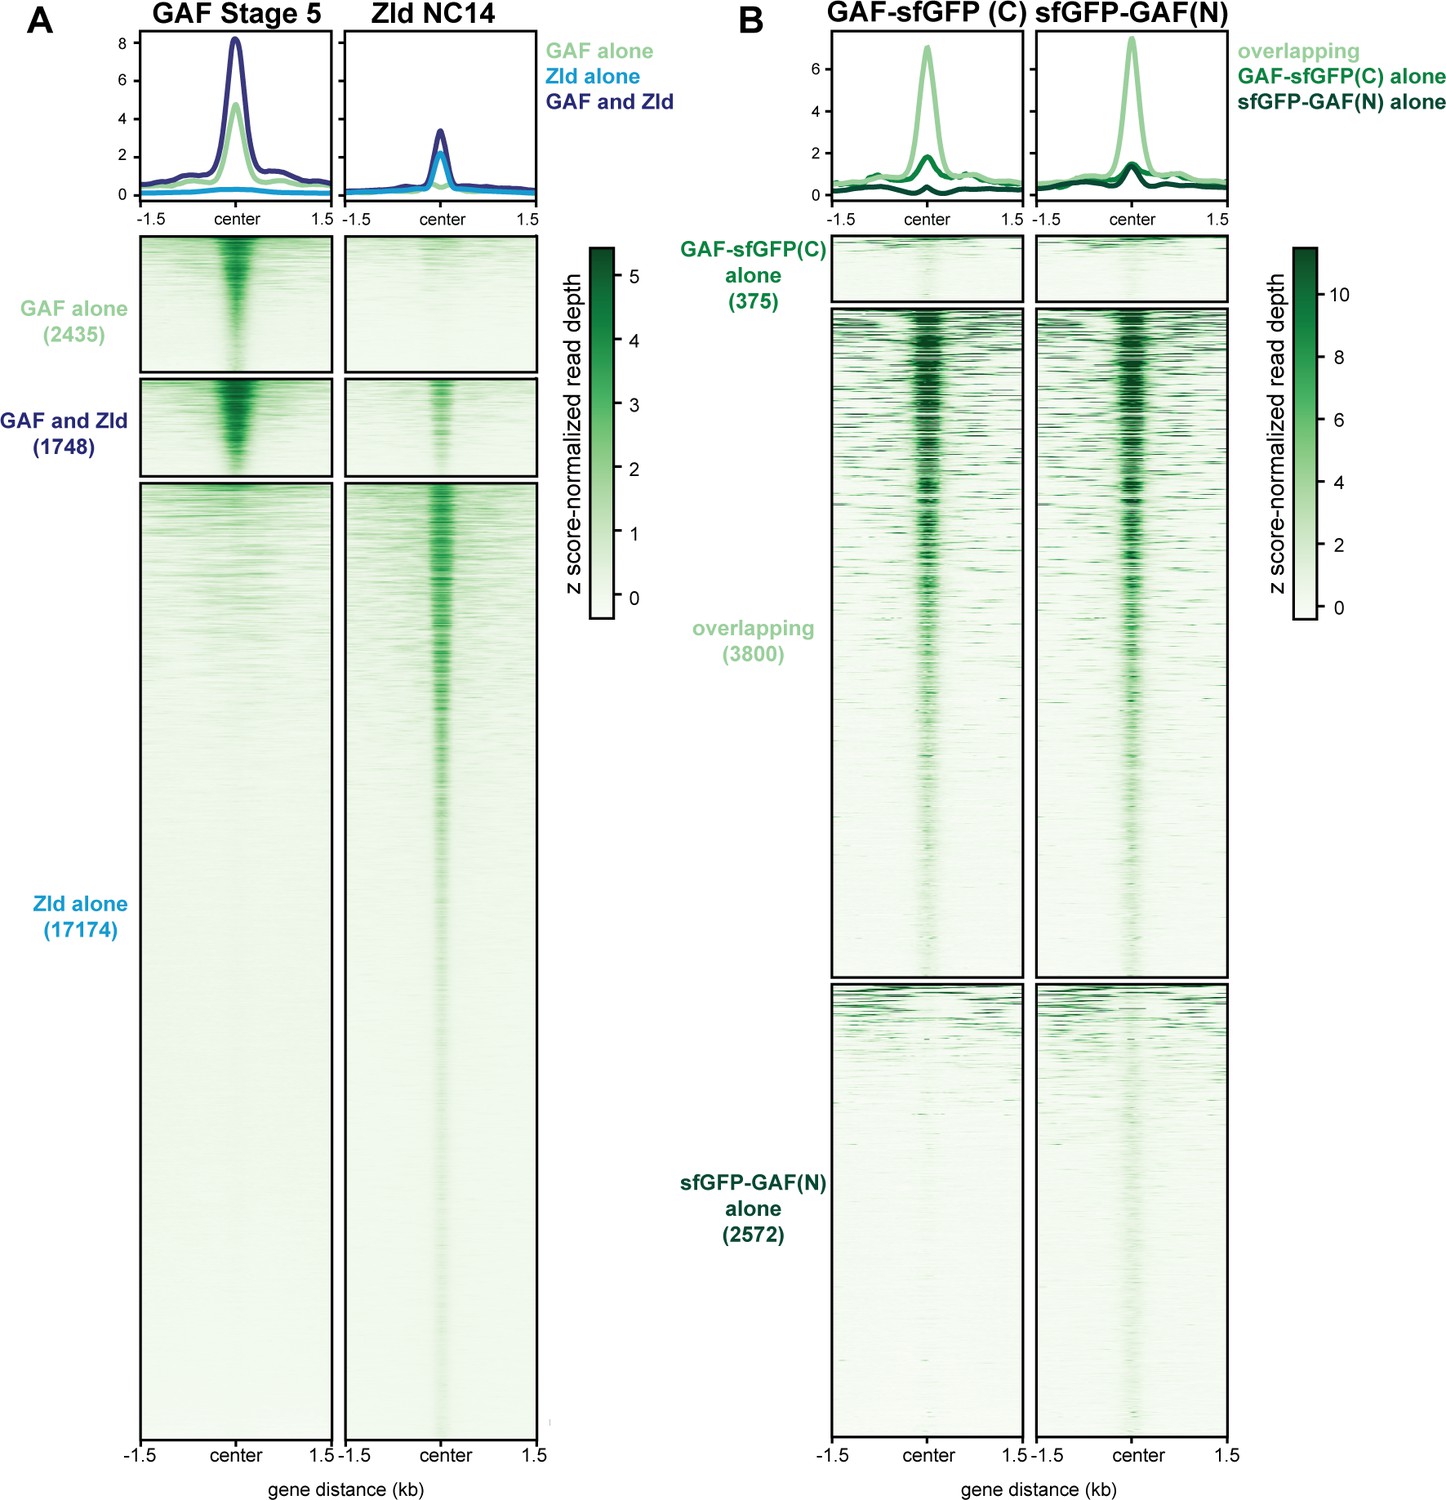
GAF and Zld bind to shared and unique regions of the genome.
(A) Heatmap of GAF-sfGFP(C) ChIP peaks at stage 5 and Zld ChIP peaks at NC14. Zld ChIP-seq from Harrison et al., 2011. (B) Heatmap of anti-GFP ChIP-seq peaks from GAF-sfGFP(C) homozygous stage 5 embryos and sfGFP-GAF(N) heterozygous 2–2.5 hr AEL embryos. ChIP peaks show reproducible identification of the highest peaks.
Figure 4—figure supplement 2
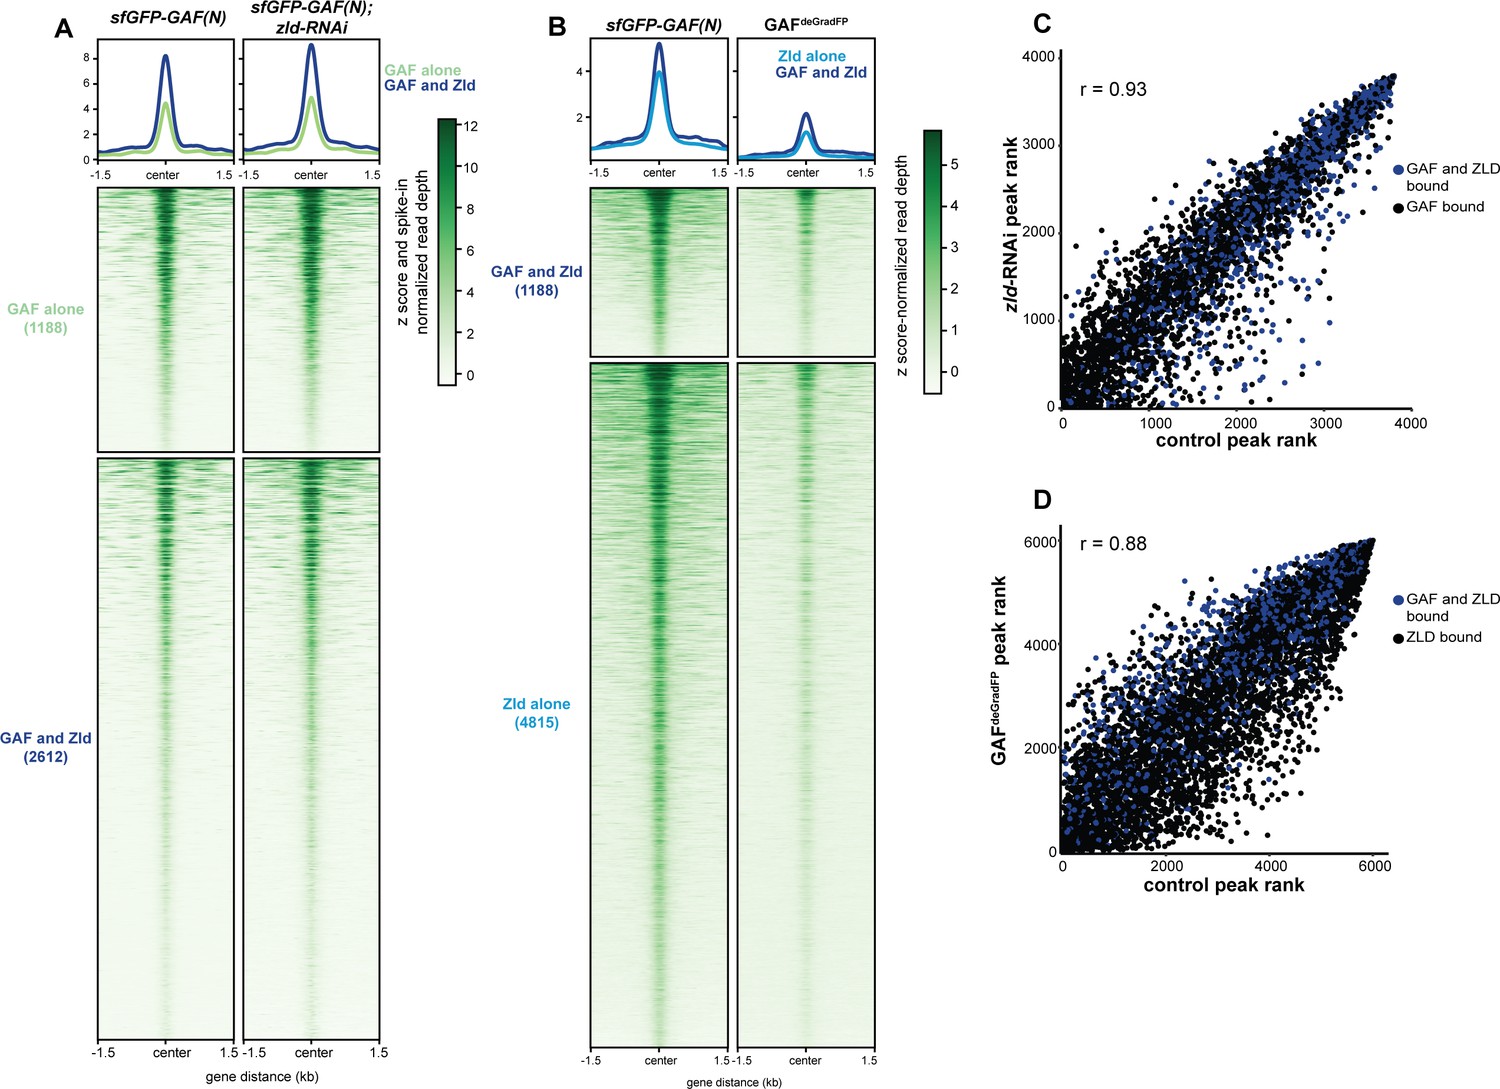
Independent chromatin binding by GAF and Zld.
(A) Heatmap of high confidence, anti-GFP ChIP-seq peaks from 2 to 2.25 hr AEL sfGFP-GAF(N) and zld-RNAi;sfGFP-GAF(N) embryos. The heatmap is divided into sites that have both GAF and Zld binding and where GAF binds independently of Zld. (B) Heatmap of high confidence, anti-Zld ChIP-seq peaks from sfGFP-GAF(N) homozygous control and GAFdeGradFP embryos at 2–2.5 hr AEL. The heatmap is divided into sites that have both GAF and Zld binding and where Zld binds independently of GAF. (C) Correlation between ranked peak height of ChIP for GFP from (A). Peaks are ranked such that the highest peaks have the highest ranking. Color indicates those regions that are bound by both GAF and Zld. (D) Correlation between ranked peak heights of ChIP for Zld from (B). Peaks are ranked such that the highest peaks have the highest ranking. Color indicates those regions that are bound by both GAF and Zld.
Figure 5 with 1 supplement
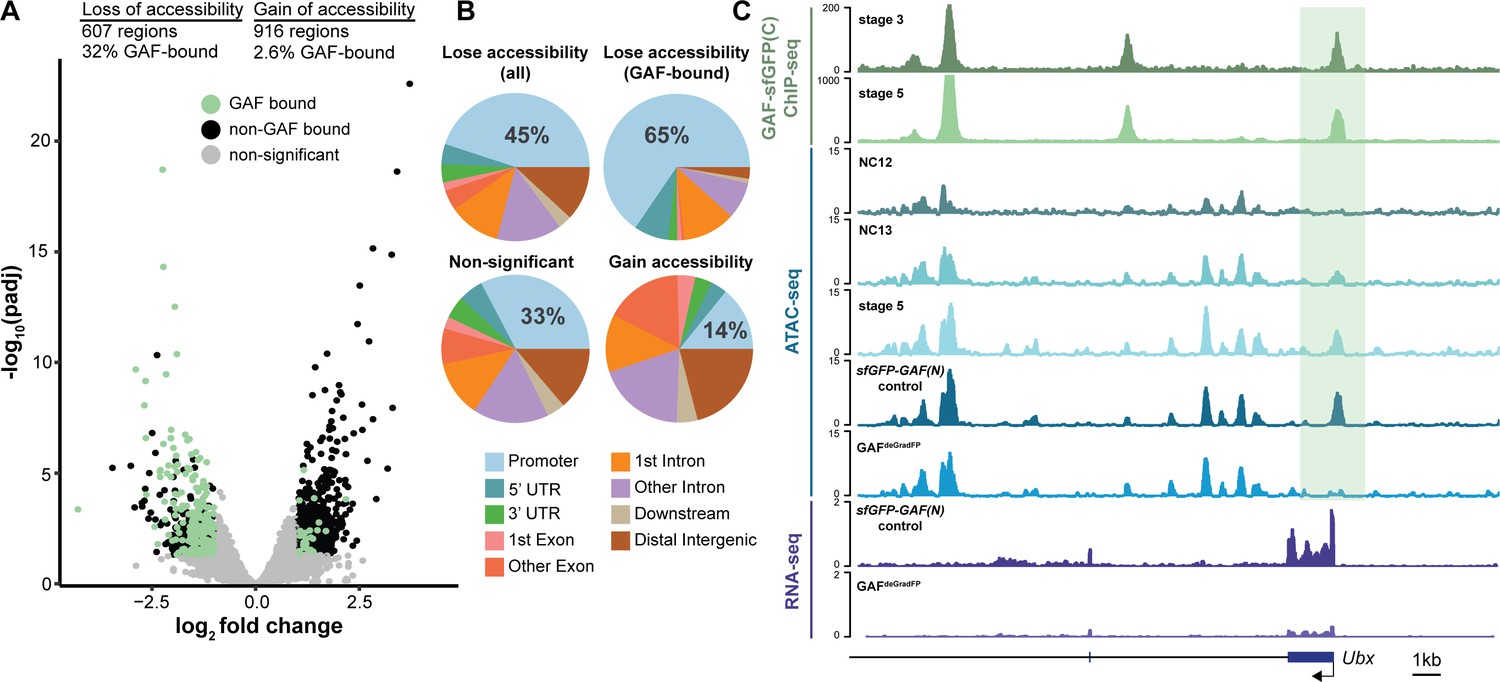
GAF is required for chromatin accessibility.
(A) Volcano plot of regions that change in accessibility in GAFdeGradFP embryos as compared to sfGFP-GAF(N) controls, stage 5 GAF-sfGFP(C) ChIP-seq was used to identify GAF-bound target regions. (B) Genomic distribution of all regions that lose accessibility (Lose accessibility (all)), regions that lose accessibility and are GAF-bound (Lose accessibility (GAF-bound), regions that did not change significantly in accessibility (Non-significant), and regions that gain accessibility (Gain accessibility)). (C) Genome browser tracks of GAF-sfGFP(C) ChIP-seq at stage 3 and stage 5, ATAC-seq on wild-type embryos at NC12, NC13, and stage 5 along with control (sfGFP-GAF(N)) and GAFdeGradFP embryos, and RNA-seq from control (sfGFP-GAF(N)) and GAFdeGradFP embryos. NC12 and NC13 ATAC-seq data is from Blythe and Wieschaus, 2016. ATAC-seq data for stage 5 embryos is from Nevil et al., 2020. Region highlighted in green indicates the GAF-dependent, GAF-bound Ubx promoter. See also Figure 5—figure supplement 1.
Figure 5—figure supplement 1
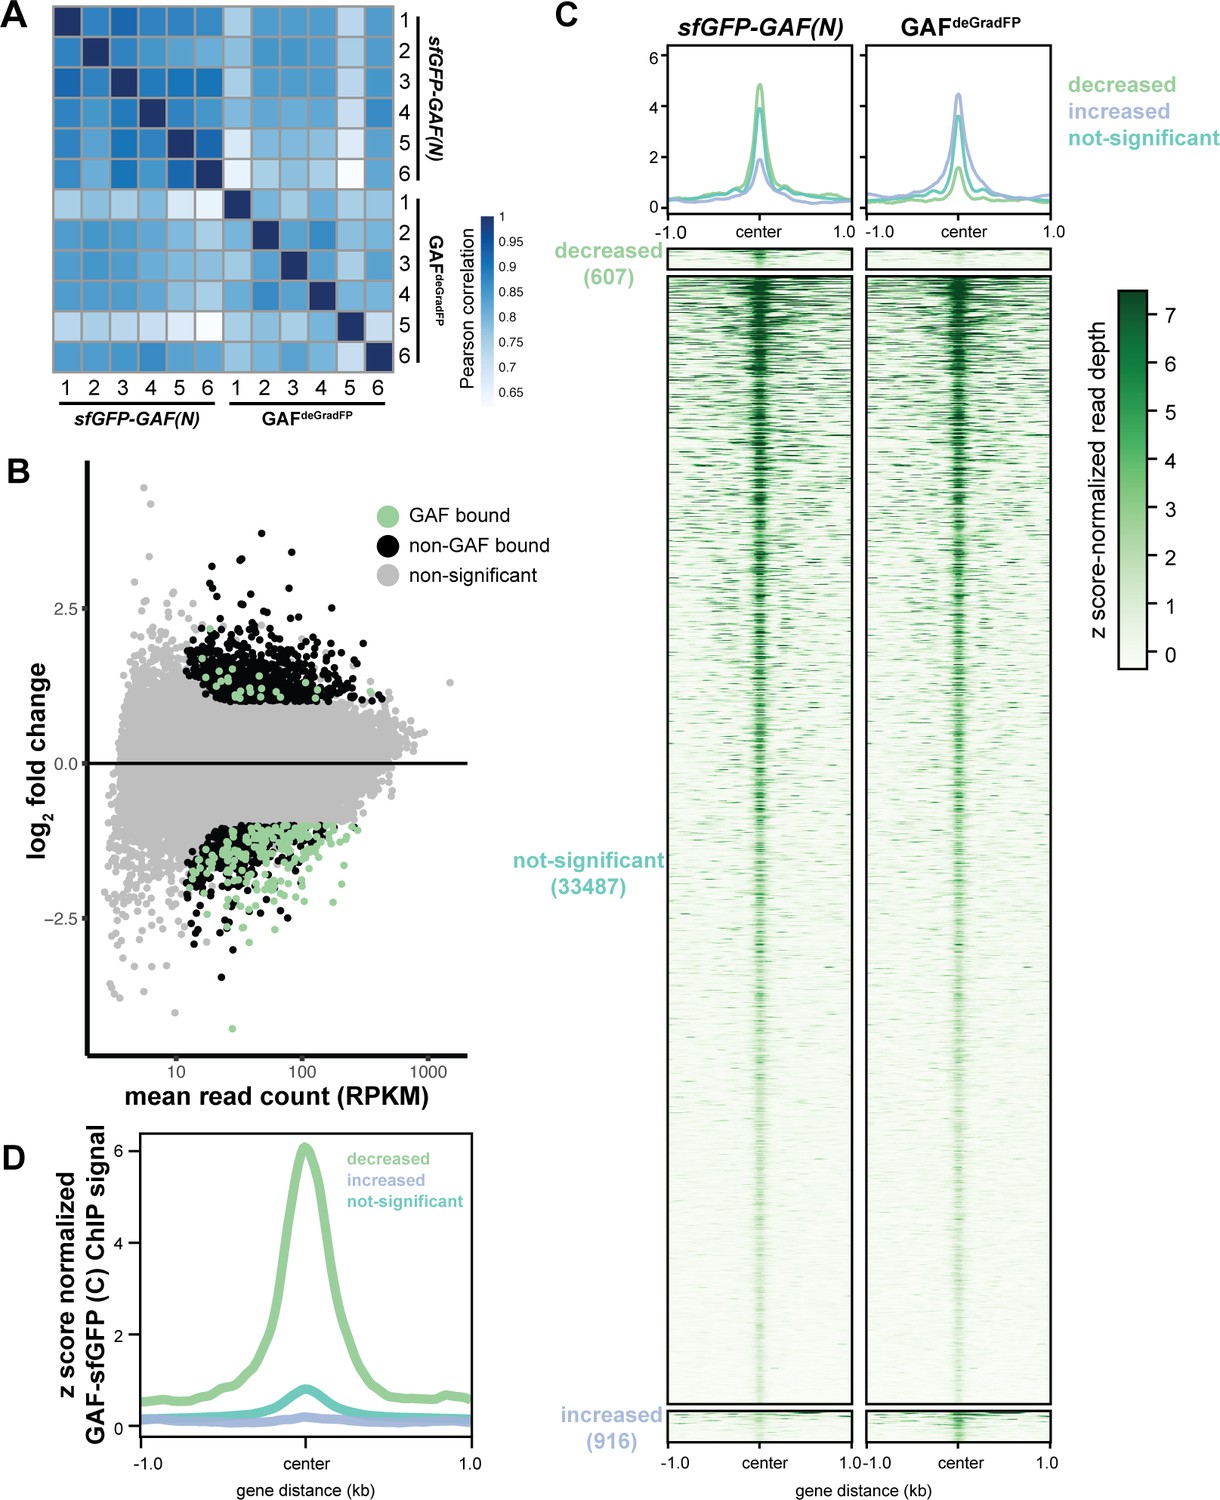
GAF is required for chromatin accessibility.
(A) Heatmap of Pearson correlation coefficients between ATAC-seq replicates for GAFdeGradFP and sfGPF-GAF(N) control embryos. (B) MA plot of regions that change in accessibility in GAFdeGradFP embryos as compared to sfGFP-GAF(N) controls. GAF binding was determined using GAF-sfGFP(C) ChIP-seq from stage 5 embryos. (C) Heatmap of the ATAC seq data for GAFdeGradFP embryos and sfGFP(N) controls subdivided by whether the region increased, decreased or remained unchanged in accessibility in the GAFdeGradFP embryos as compared to the controls. (D) Average GAF-sfGFP(C) ChIP-seq signal from stage 5 embryos for regions that increased, decreased or remained unchanged in accessibility in the GAFdeGradFP embryos as compared to the sfGFP-GAF(N) controls.
Figure 6 with 2 supplements
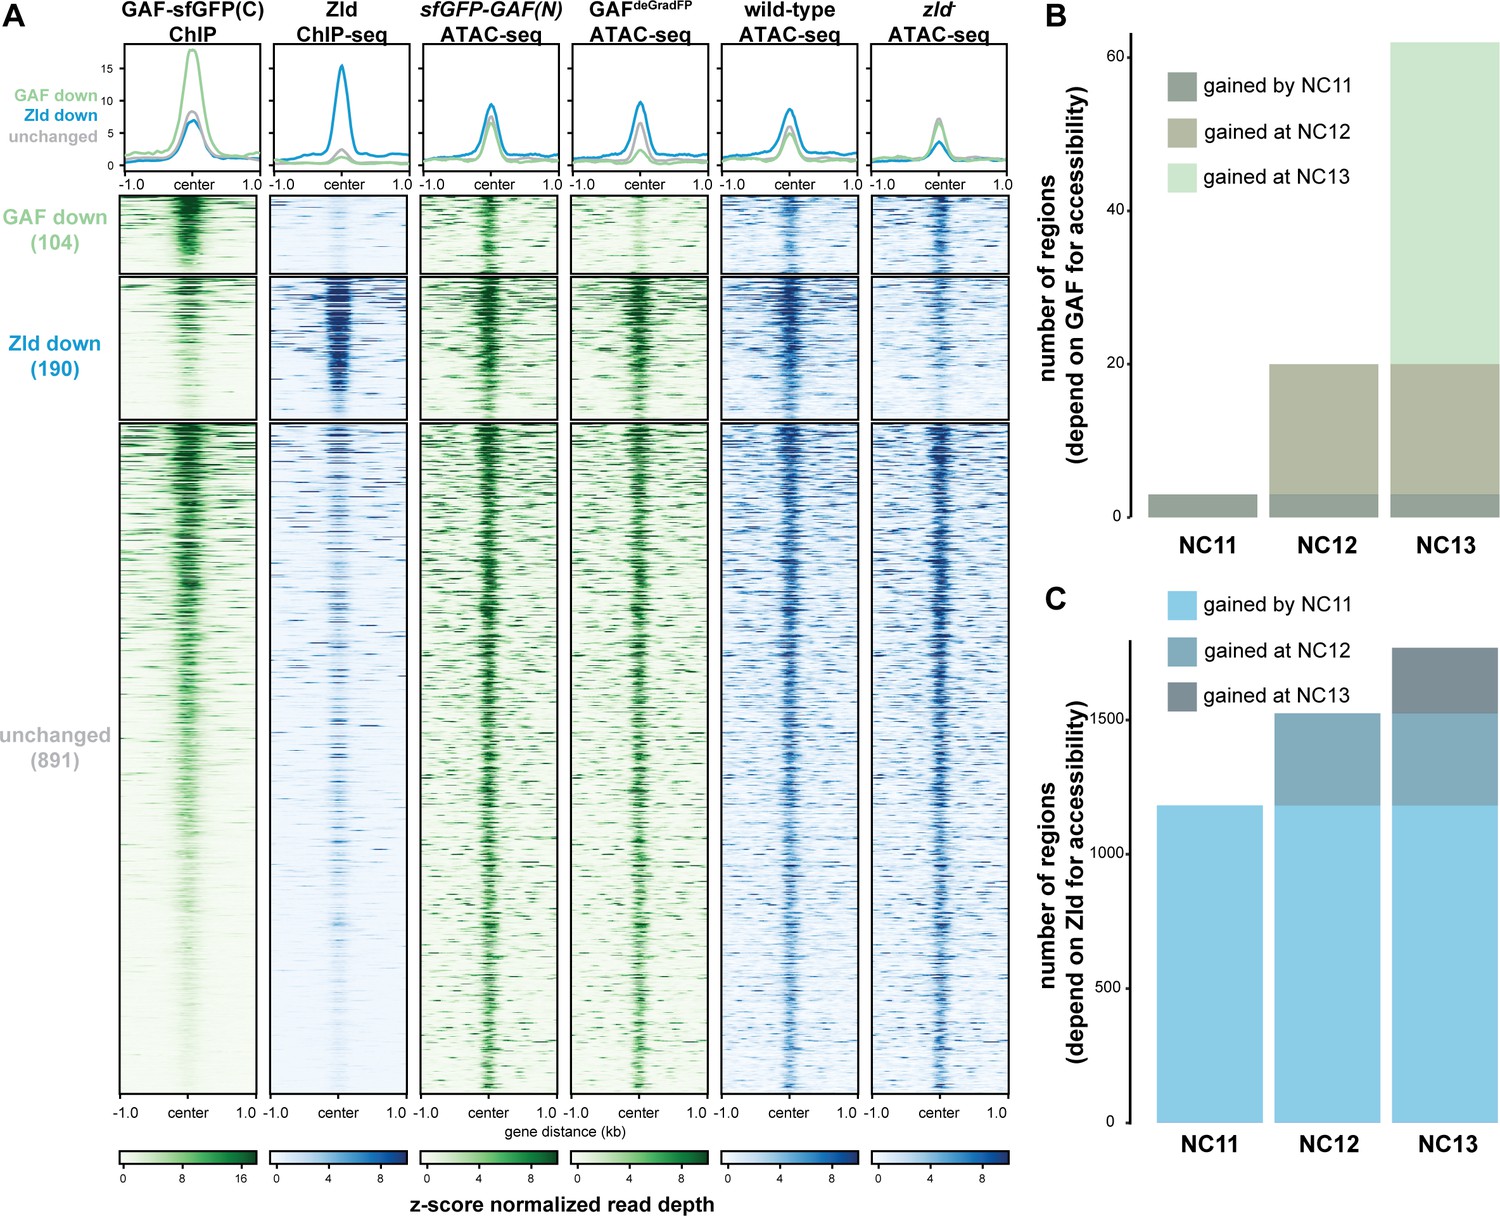
GAF and Zld independently shape chromatin accessibility over the MZT.
(A) Heatmaps of ChIP-seq and ATAC-seq data, as indicated above, for regions bound by both GAF and Zld and subdivided based on the change of accessibility in the absence of either factor. (B) Number of regions that depend on GAF for accessibility and are bound by GAF that are accessible at NC11, NC12, and NC13. (C) Number of regions that depend on Zld for accessibility and are bound by Zld that are accessible at NC11, NC12, and NC13. NC11, NC12, and NC13 data are from Blythe and Wieschaus, 2016. Zld ChIP-seq data are from Harrison et al., 2011. ATAC-seq data from zld germline clones (zld-) are from Hannon et al., 2017. Total number of regions accessible at NC11 = 3084, NC12 = 6487, and NC13 = 9824. See also Figure 6—figure supplements 1–2.
Figure 6—figure supplement 1
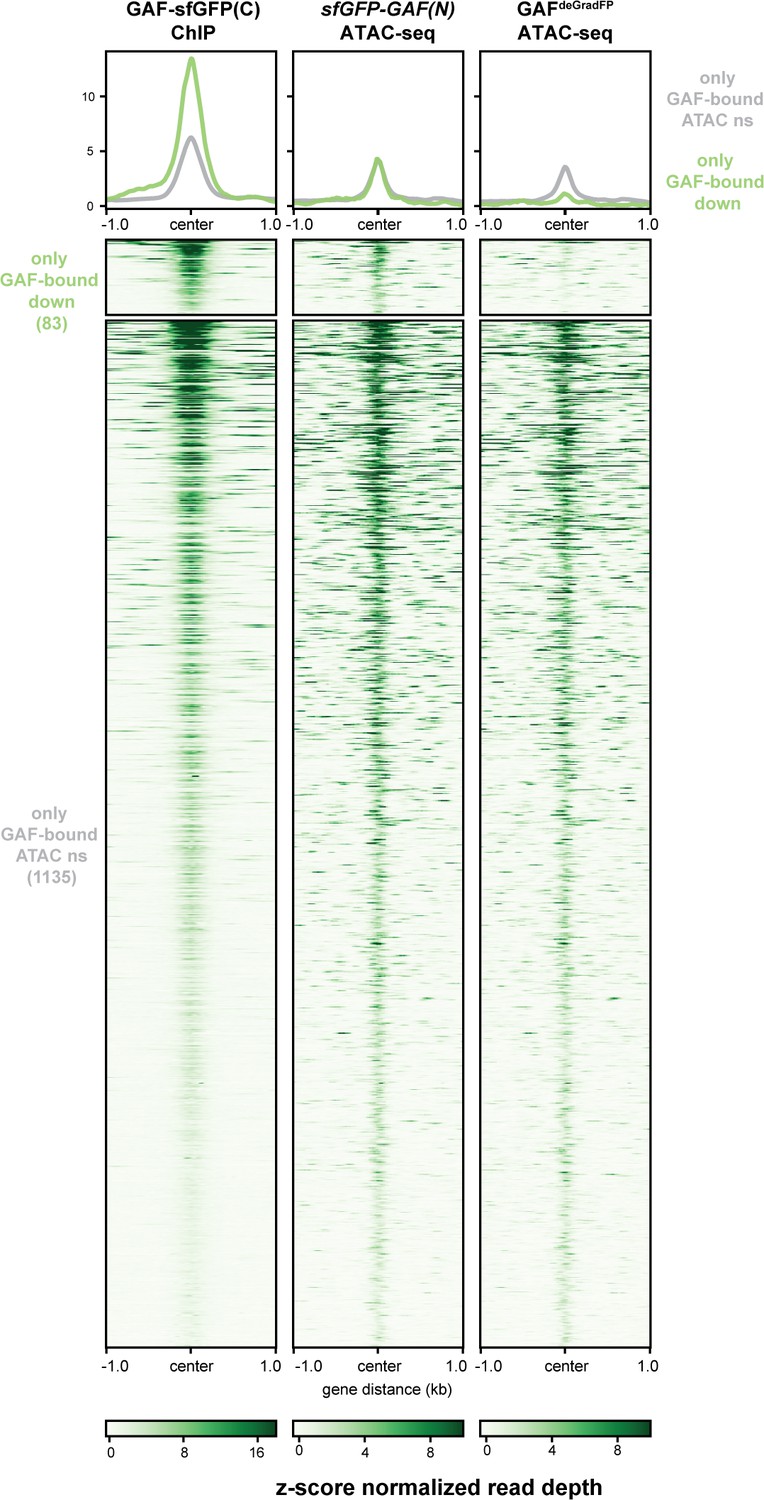
A subset of regions bound by GAF, and not Zld, depend on GAF for accessibility.
Heatmaps of regions that are bound by GAF (excluding GAF and Zld co-bound sites) as determined by GAF-sfGFP(C) stage 5 ChIP-seq subdivided by whether or not these regions change in accessibility upon GAF depletion.
Figure 6—figure supplement 2
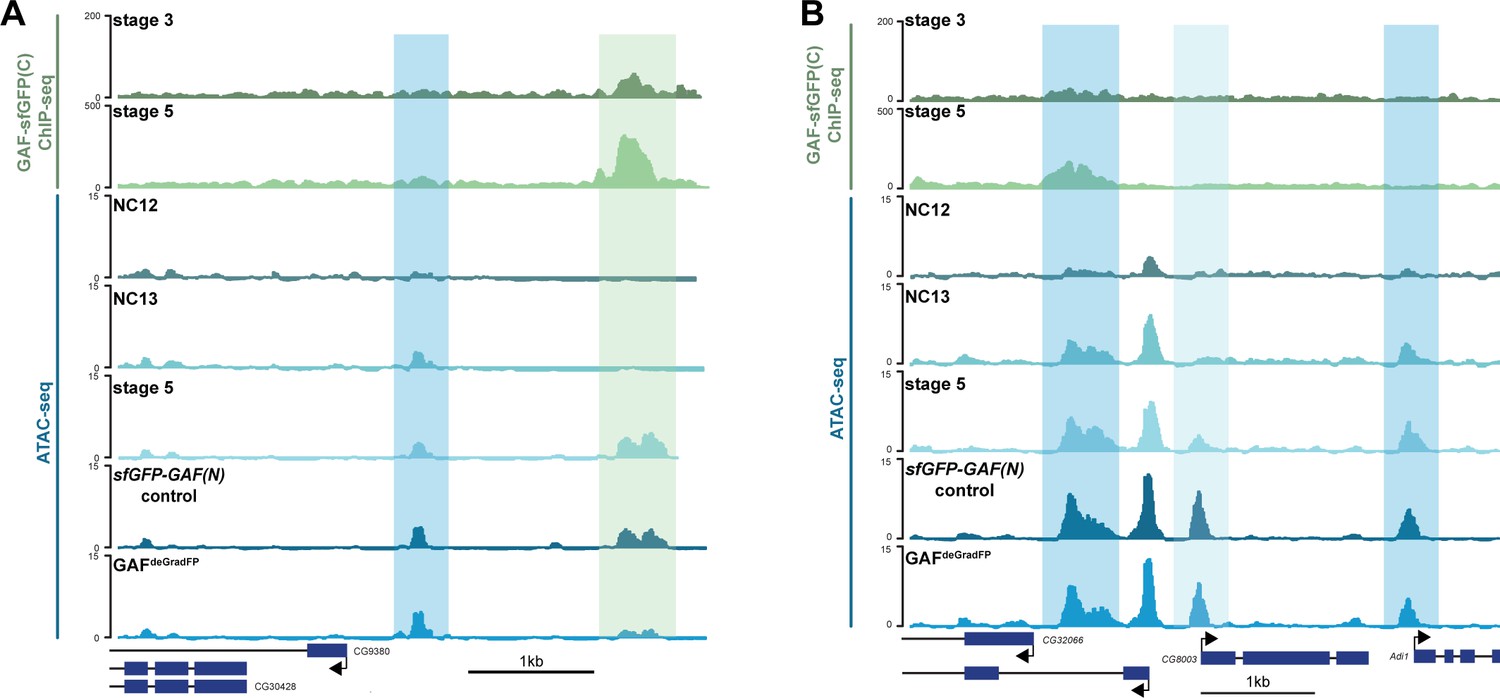
Regions that gain accessibility late during the MZT are accessible in GAFdeGradFP embryos used for ATAC-seq.
(A) Genome browser tracks showing a region that gains accessibility at NC13 that is maintained in GAFdeGradFP embryos (dark-blue shading) and a region that gains accessibility at stage 5, is bound by GAF at stage 3 and stage 5, and at which accessibility is decreased in GAFdeGradFP embryos (light-green shading). (B) Genome browser tracks showing regions that gain accessibility at NC13 and are maintained in GAFdeGradFP embryos (dark-blue shading) and a region that gains accessibility at stage 5 that is maintained in the GAFdeGradFP embryos (light-blue shading).
Figure 7
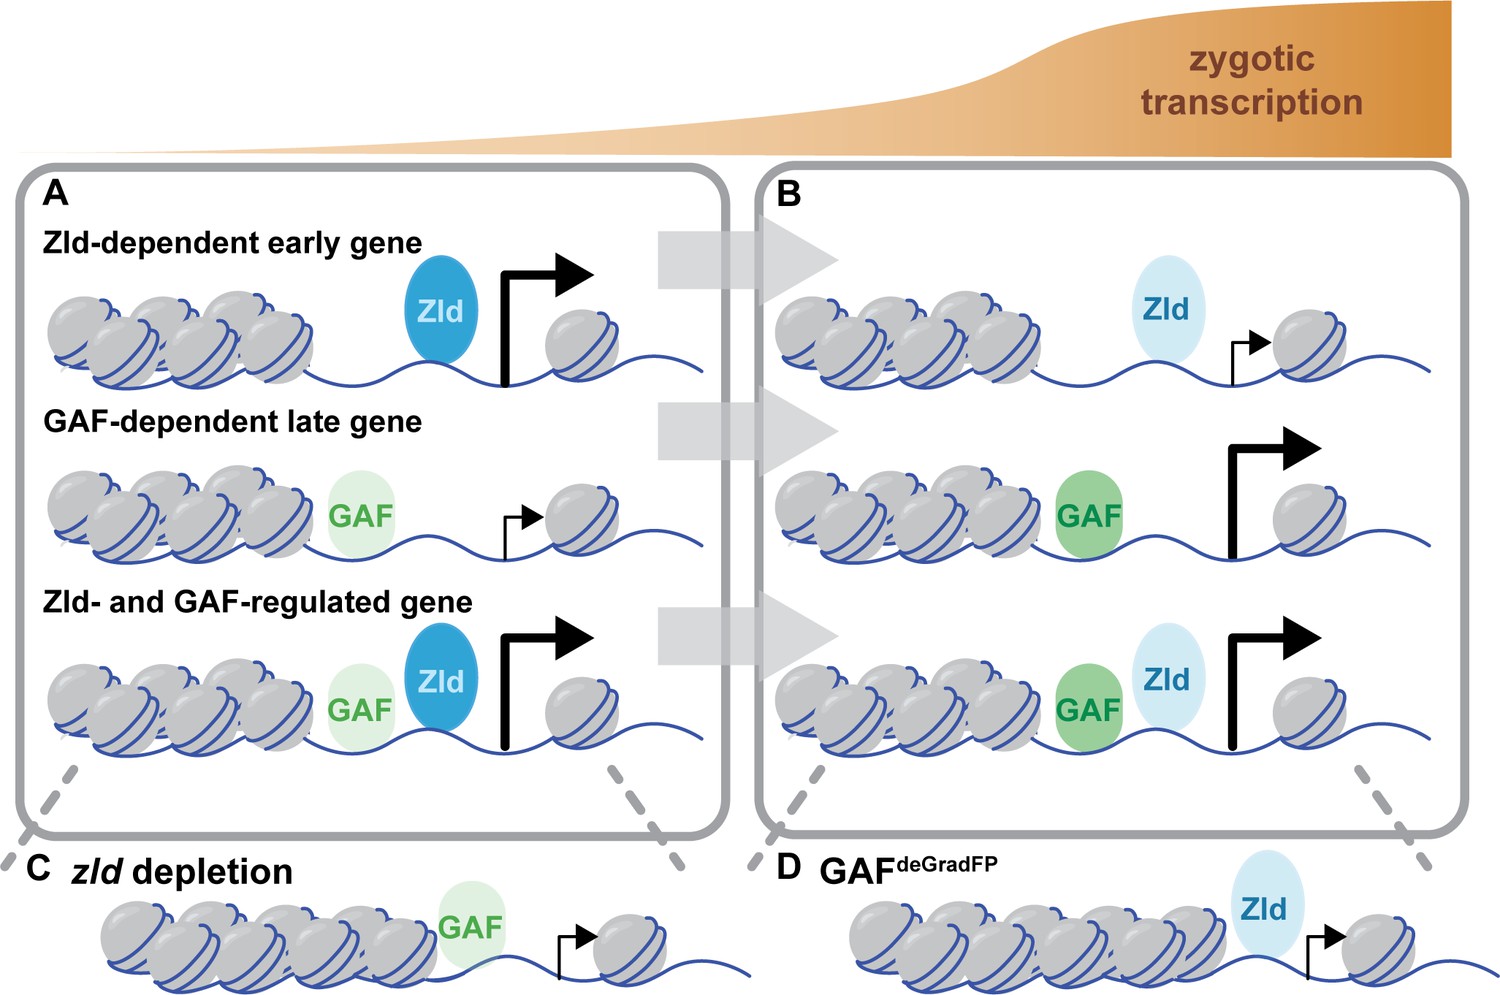
Zld and GAF independently regulate embryonic reprogramming.
(A) During the minor wave of ZGA (NC10-13), Zld is the predominant factor required for driving expression of genes bound by Zld alone and genes bound by both Zld and GAF. (B) As the genome is more broadly activated during NC14, GAF becomes the major factor in driving zygotic transcription. (C) Early in the MZT, Zld is required for chromatin accessibility at many regions co-bound by GAF and Zld. When zld is depleted, accessibility is lost at a subset of regions, but GAF remains bound at the majority of sites. (D) Late during the MZT, GAF is required for chromatin accessibility at many Zld-bound regions. In GAFdeGradFP embryos accessibility is lost at a subset of sites, but Zld remains bound.
Videos
Video 1
Video of a GAFdeGradFP embryo going through several rounds of mitosis prior to gastrulation.
Nuclei are marked by His2Av-RFP.
Video 2
Video of a severely disordered GAFdeGradFP embryo going through several rounds of mitosis prior to gastrulation.
Nuclei are marked by His2Av-RFP.
Video 3
Video of a control (His2Av-RFP; sfGFP-GAF(N)) embryo going through several rounds of mitosis prior to gastrulation.
Nuclei are marked by His2Av-RFP.
Tables
Key resources table
| Reagent type (species) or resource | Designation | Source or reference | Identifiers | Additional information |
|---|---|---|---|---|
| Genetic reagent (Drosophila melanogaster) | w1118 | Bloomington Drosophila Stock Center | BDSC:3605; FLYB:FBal0018186; RRID:BDSC_3605 | |
| Genetic reagent (D. melanogaster) | His2AV-RFP (II) | Bloomington Drosophila Stock Center | BDSC:23651; FLYB:FBti0077845; RRID:BDSC_23651 | |
| Genetic reagent (D. melanogaster) | mat-α-GAL4-VP16 | Bloomington Drosophila Stock Center | BDSC:7062; FLYB:FBti0016915; RRID:BDSC_7062 | |
| Genetic reagent (D. melanogaster) | UAS-shRNA-zld | Sun et al., 2015 DOI:10.1101/gr.192542.115 | ||
| Genetic reagent (D. melanogaster) | sfGFP-GAF(N) | This paper | Cas9 edited allele | |
| Genetic reagent (D. melanogaster) | GAF-sfGFP(C) | This paper | Cas9 edited allele | |
| Genetic reagent (D. melanogaster) | nos-deGradFP | This paper | Transgenic insertion into PBac{yellow[+]-attP-3B}VK00037 docking site (BDSC:9752) (FLYB: FBti0076455) NSlmb-vhhGFP4 amplified from BDSC:58740 | |
| Antibody | Anti-GFP (rabbit polyclonal) | Abcam | Cat# ab290 | ChIP (6 μg) WB (1:2000) |
| Antibody | Anti-Zld (rabbit polyclonal) | Harrison et al., 2010 DOI:10.1016/j.ydbio.2010.06.026 | ChIP (8 μg) WB (1:750) | |
| Antibody | Anti-alpha tubulin (mouse monoclonal) | Sigma-Aldrich | Cat# T6199 | WB (1:5000) |
| Antibody | Anti-rabbit IgG-HRP (Goat, secondary) | Bio-Rad | Cat#1706515 | WB (1:3000) |
| Antibody | Anti-mouse IgG-HRP (Goat, secondary) | Bio-Rad | Cat#1706516 | WB (1:3000) |
| cell line Mus musculus | H3.3-GFP | This paper | Cell line maintained in the lab of Peter Lewis | |
| software, algorithm | R | http://www.R-project.org | ||
| software, algorithm | bowtie 2 v2.3.5 | Langmead and Salzberg, 2012 | ||
| software, algorithm | Samtools v1.11 | http://www.htslib.org/ | ||
| software, algorithm | MACS v2 | Zhang et al., 2008 | ||
| software, algorithm | GenomicRanges R package | Lawrence et al., 2013 | ||
| software, algorithm | DeepTools | Ramírez et al., 2016 | ||
| software, algorithm | MEME-suite | Bailey et al., 2009 | ||
| software, algorithm | Gviz R package | Hahne and Ivanek, 2016 | ` | |
| software, algorithm | Subread (v1.6.4) | Liao et al., 2014 | ||
| software, algorithm | DESeq2 R package | Love et al., 2014 | ||
| software, algorithm | HISAT v2.1.0 | Kim et al., 2015 | ||
| software, algorithm | NGMerge | Gaspar, 2018 |
Additional files
-
Supplementary file 1
Peaks called in ChIP-seq for GAF-sfGFP (C) in stage 3 and stage 5 hand-sorted embryos and sfGFP-GAF(N) 2–2.5 hr AEL embryos (as indicated in tabs).
Chromosome, start and end for each peak are provided as labelled.
- https://cdn.elifesciences.org/articles/66668/elife-66668-supp1-v2.xlsx
-
Supplementary file 2
Differentially expressed genes identified by total RNA-seq in GAFdeGradFP embryos compared to controls.
Columns are defined in the first sheet and data are provided in the other sheet.
- https://cdn.elifesciences.org/articles/66668/elife-66668-supp2-v2.xlsx
-
Supplementary file 3
Differential peaks identified in ATAC-seq of GAFdeGradFP embryos compared to controls.
Columns are defined in the first sheet and data are provided in the other sheet.
- https://cdn.elifesciences.org/articles/66668/elife-66668-supp3-v2.xlsx
-
Supplementary file 4
Numbers for statistical analyses performed.
- https://cdn.elifesciences.org/articles/66668/elife-66668-supp4-v2.xlsx
-
Transparent reporting form
- https://cdn.elifesciences.org/articles/66668/elife-66668-transrepform-v2.docx
Download links
A two-part list of links to download the article, or parts of the article, in various formats.
Downloads (link to download the article as PDF)
Open citations (links to open the citations from this article in various online reference manager services)
Cite this article (links to download the citations from this article in formats compatible with various reference manager tools)
GAF is essential for zygotic genome activation and chromatin accessibility in the early Drosophila embryo
eLife 10:e66668.
https://doi.org/10.7554/eLife.66668


