Complex effects of kinase localization revealed by compartment-specific regulation of protein kinase A activity
- Department of Biomedical Engineering, Yale University, United States
- Yale Systems Biology Institute, Yale University, United States
- Department of Cell Biology, Skirball Institute of Biomolecular Medicine, NYU Langone Health, United States
Figures
Figure 1 with 2 supplements
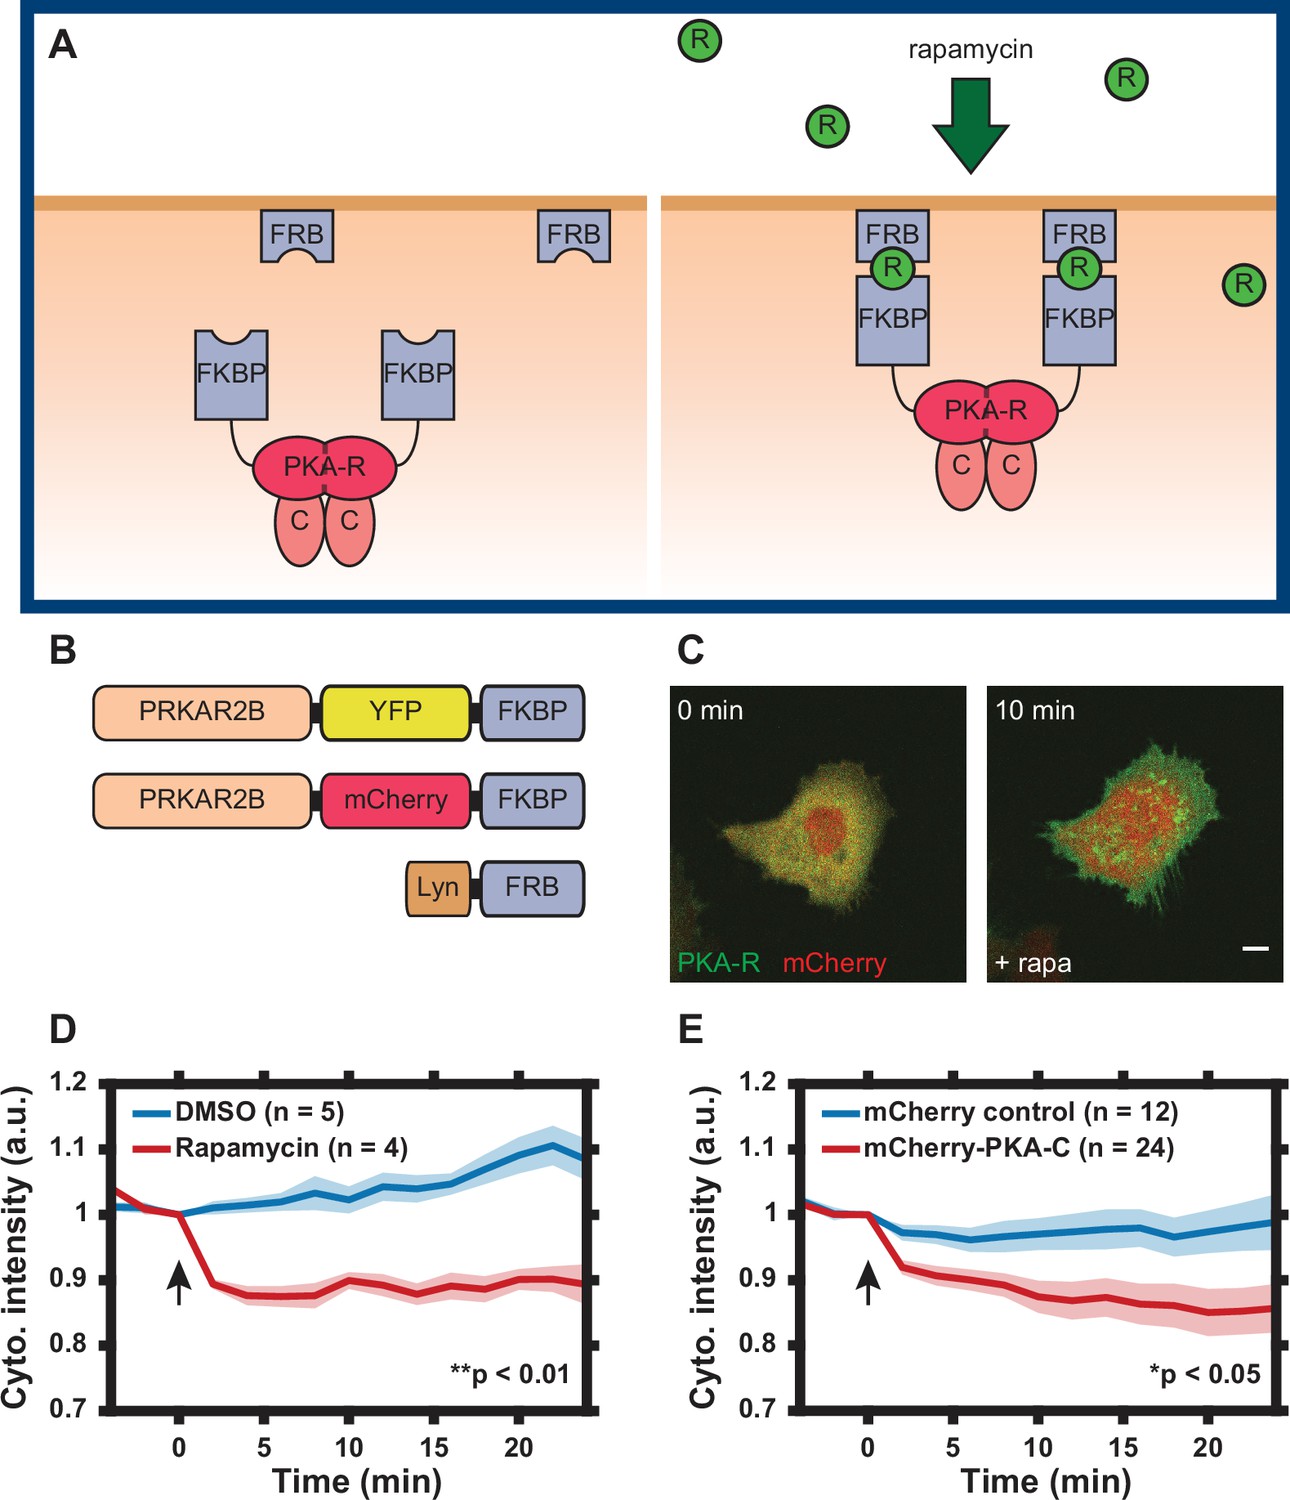
Design of regulatory subunit of the protein kinase A (PKA-R) translocation system.
(A) Schematic of PKA-R translocation system. Rapamycin induces heterodimerization of FKBP and FRB, resulting in translocation of PKA-R to the plasma membrane (FKBP = FK506-binding protein, FRB = FKBP-rapamycin-binding domain, R = rapamycin, PKA-R = PKA regulatory subunit, C = PKA catalytic subunit). (B) DNA construct design. Two versions of recombinant PKA-R were created with different fluorescent labels. (C) Subcellular localization of PKAR-FKBP-YFP (green) within a transiently transfected HeLa cell at 0 and 10 min after addition of 100 nM rapamycin. Scale bar, 10 µm. mCherry protein (red) co-expressed for visualization. (D) PKA-R translocation in HeLa PFM cells quantified as cytoplasmic intensity drop in mCherry channel following addition of DMSO or 100 nM rapamycin. p = 0.0039 at t = 24 min post-rapamycin addition; two-tailed Student’s t-test. (E) Catalytic subunit of the protein kinase A (PKA-C) translocation in HeLa cells transiently transfected with PKAR-FKBP-YFP, Lyn-FRB, and mCherry-PKA-C, quantified as a cytoplasmic intensity drop in mCherry channel following addition of 100 nM rapamycin. Cells transfected with mCherry protein instead of mCherry-PKA-C were used as a control. p = 0.037 at t = 24 min post-rapamycin addition; two-tailed Student’s t-test. Graphs display the mean of each data set with standard error of the mean (SEM) indicated by shaded region. Number of cells in each data set is as indicated in the figure. Data is the result of one (D) and three (E) independent experiments, respectively. Mean and SEM values for each condition and time point are provided in Figure 1—source data 1. Arrows indicate the timing of drug addition.
-
Figure 1—source data 1
Characterization of regulatory subunit of the protein kinase A (PKA-R) translocation system.
(a) Sheet 1, Figure 1D Time Course. Change in mCherry cytoplasmic intensity following addition of 0.1% DMSO or 100 nM rapamycin. Mean, standard error of the mean (SEM), and number of cells given for each time point and condition. (b) Sheet 2, Figure 1E Time Course. Change in mCherry cytoplasmic intensity following addition of 100 nM rapamycin. Mean, SEM, and number of cells given for each time point and condition.
- https://cdn.elifesciences.org/articles/66869/elife-66869-fig1-data1-v1.xlsx
Figure 1—figure supplement 1
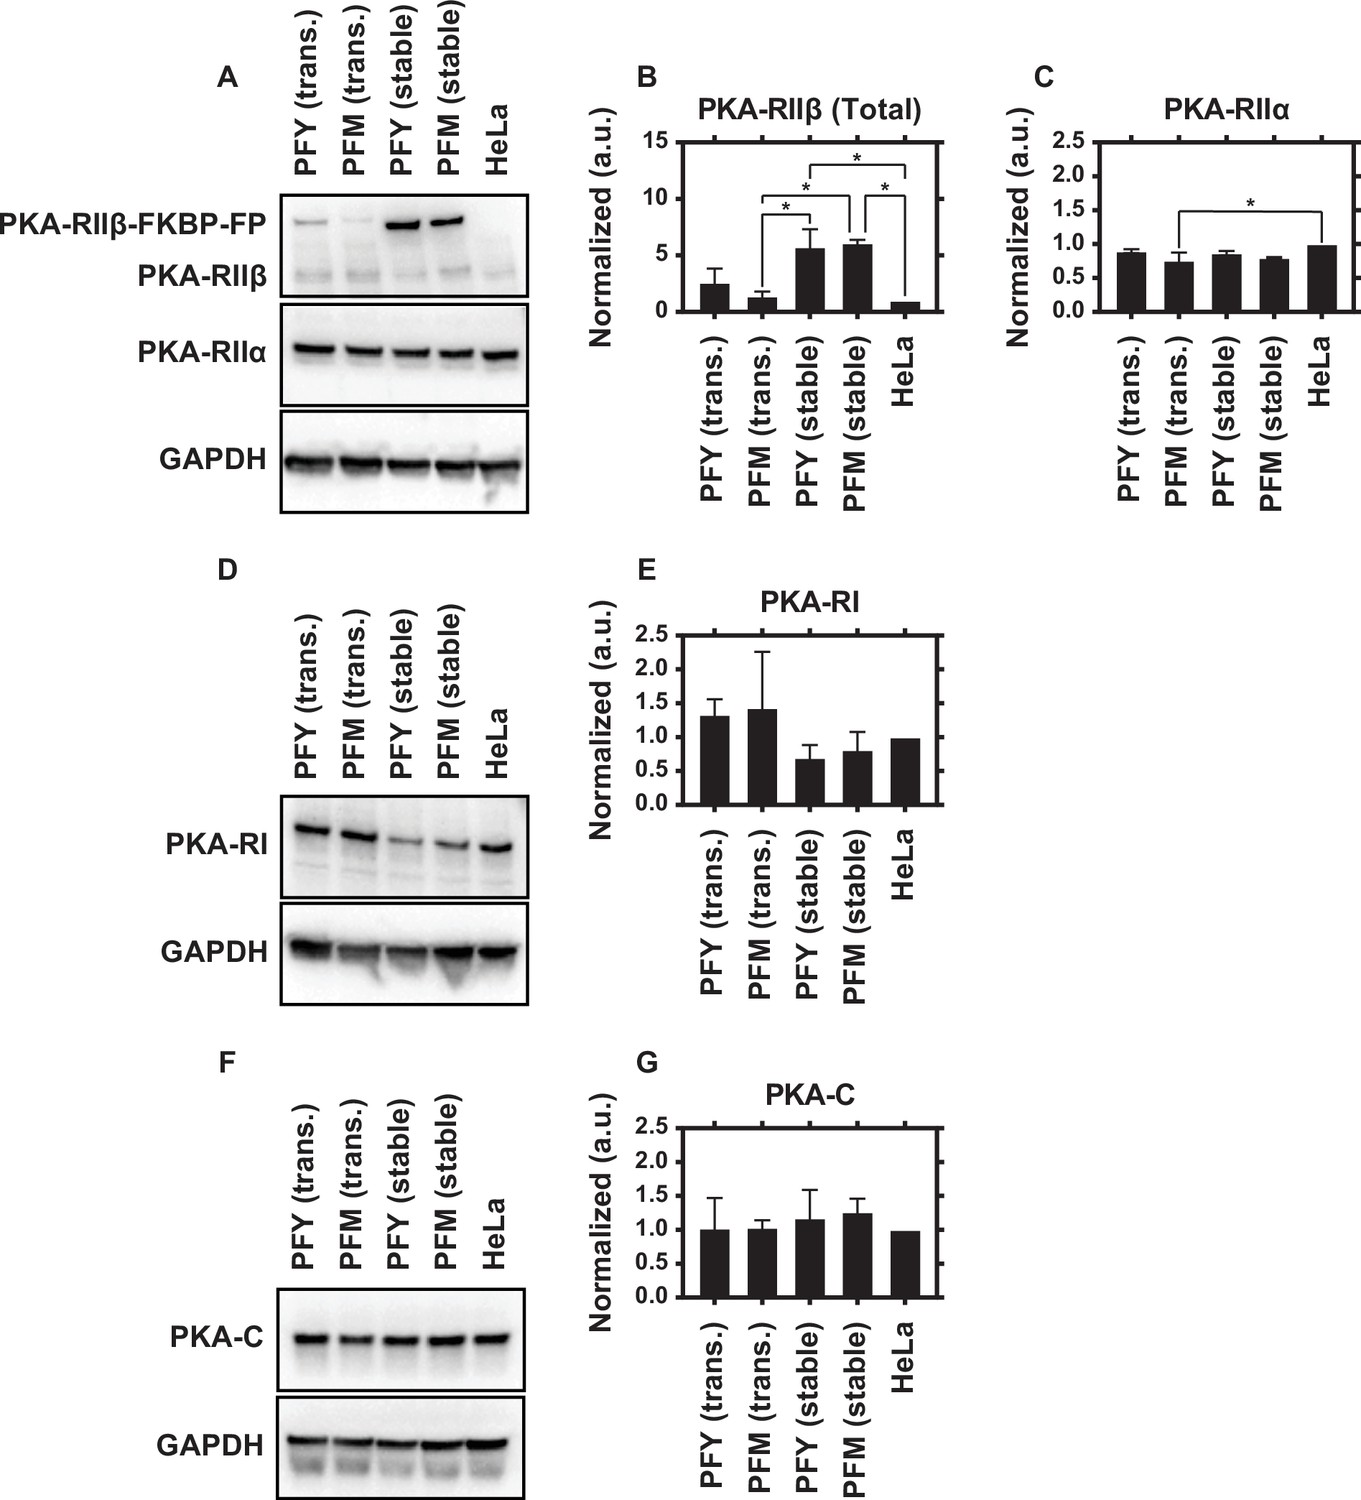
Immunoblotting for regulatory subunit of the protein kinase A (PKA-R) isoforms and catalytic subunit of the protein kinase A (PKA-C).
(A) Expression levels of PKA-RIIβ (top panel) and PKA-RIIα (middle panel). PKAR-FKBP-FP appears as a separate band above endogenous PKA-RIIβ due to its larger size. (B) Quantification of total (endogenous plus exogenous) RIIβ expression in cells transiently or stably expressing PKAR-FKBP-FP, normalized to expression in HeLa cells (endogenous only). RIIβ expression is significantly increased in HeLa PFM and PFY cell lines vs. control. (C) Quantification of PKA-RIIα expression normalized to expression in HeLa cells. (D) PKA-RI expression levels. (E) Quantification of RI expression normalized to expression in HeLa cells. (F) PKA-C expression levels. (G) Quantification of PKA-C expression normalized to expression in HeLa cells. GAPDH used as a loading control for all experiments. Lanes (from left to right) contain lysate from HeLa cells transiently expressing our YFP- or mCherry-tagged PKA-R translocation system (lanes 1 and 2), our HeLa PFM and PFY cell lines (lanes 3 and 4), and untransfected HeLa cells (lane 5). Each blot was repeated twice with representative images shown. Raw immunoblot images are provided in Figure 1—figure supplement 1—source data 1. Quantification, including exact p values, is provided in Figure 1—figure supplement 1—source data 2. (*p<0.05).
-
Figure 1—figure supplement 1—source data 1
Raw immunoblot images, labeled and unlabeled.
Images are divided into two folders – one for each technical replicate.
- https://cdn.elifesciences.org/articles/66869/elife-66869-fig1-figsupp1-data1-v1.zip
-
Figure 1—figure supplement 1—source data 2
Immunoblot statistical analysis.
One-way ANOVAs with multiple comparisons for PKAR-IIb (Sheet 1), PKAR-IIa (Sheet 2), PKA-RI (Sheet 3), and PKA-C (Sheet 4) expression data presented in Figure 1—figure supplement 1. Mean, standard deviation, and number of technical replicates also shown for each condition.
- https://cdn.elifesciences.org/articles/66869/elife-66869-fig1-figsupp1-data2-v1.xlsx
Figure 1—figure supplement 2
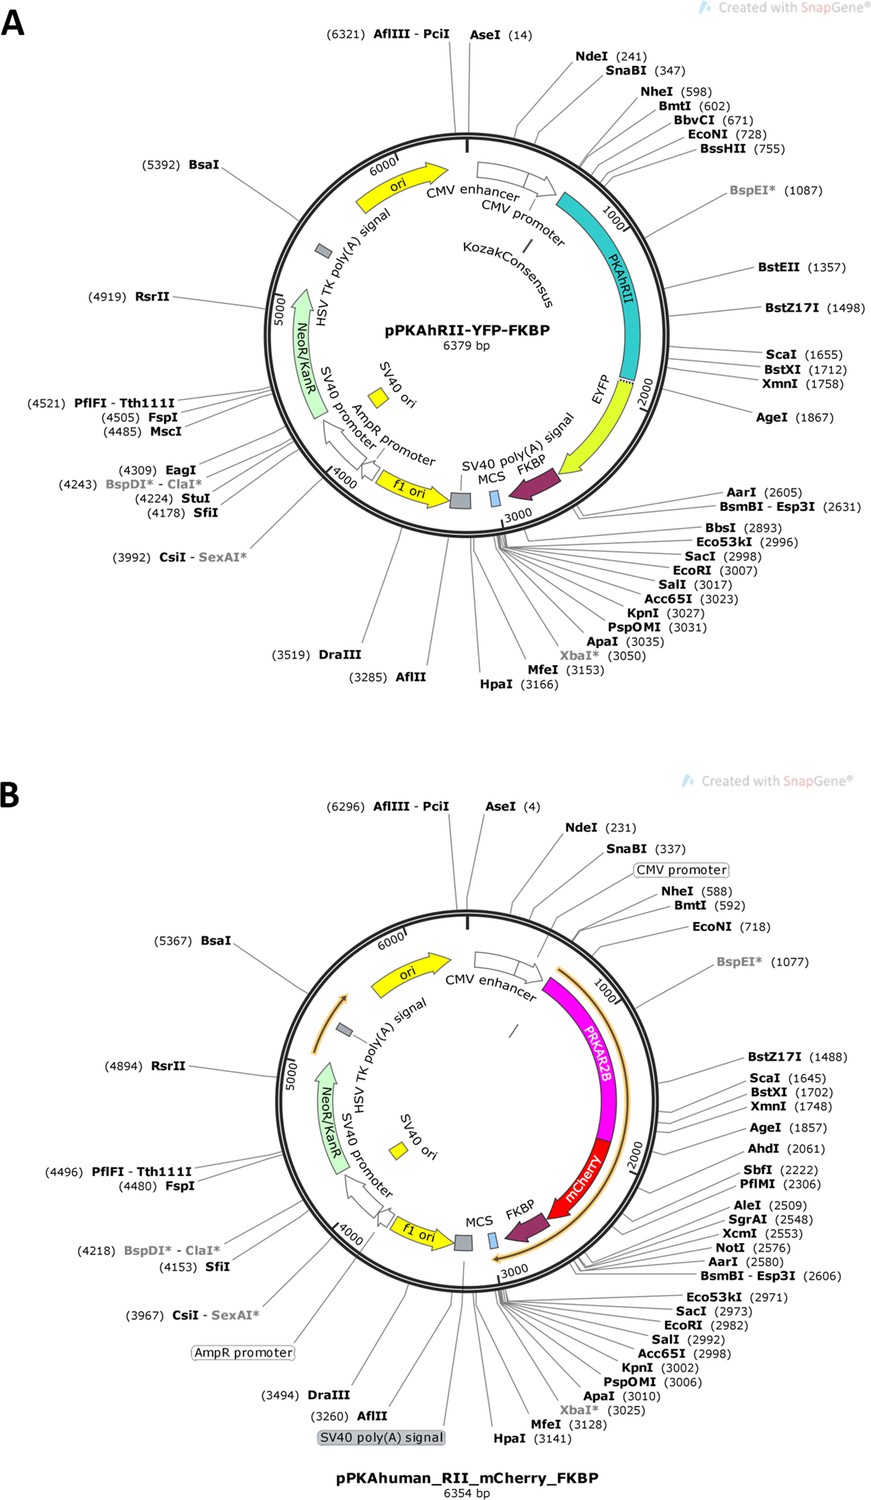
Plasmid maps for PKAR-FKBP-FP constructs.
Plasmid maps for (A) PKAR-FKBP-YFP and (B) PKAR-FKBP-mCherry.
Figure 2 with 1 supplement
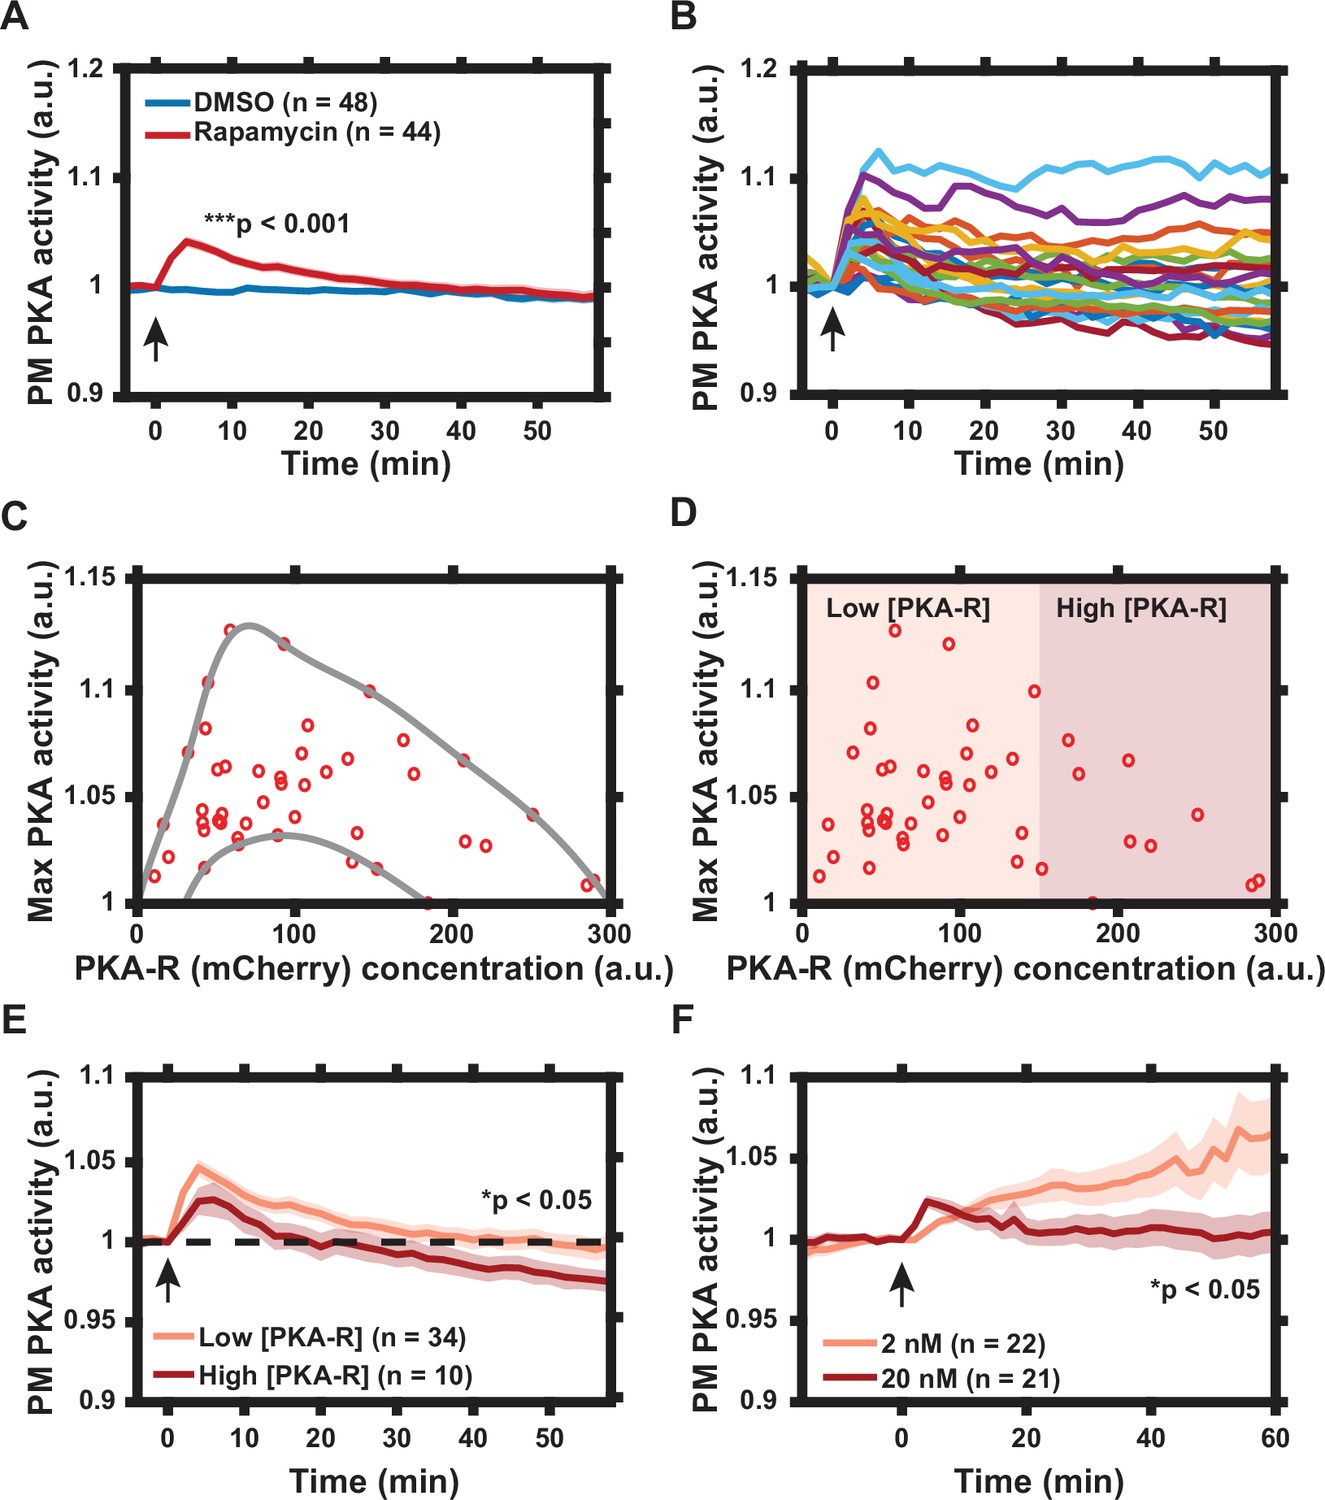
Characterization of protein kinase A (PKA) activity response to regulatory subunit of the PKA (PKA-R) translocation.
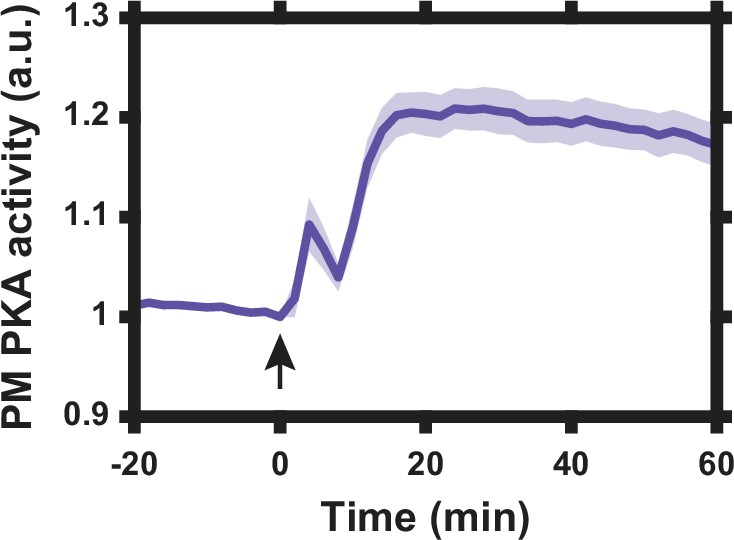
(A) Effect of rapamycin-induced PKA-R translocation on PKA activity at the plasma membrane (PM) as detected by Lyn-AKAR4. 100 nM rapamycin or 0.1% DMSO added at time = 0. p = 9.83 x 10⁻¹² at t = 4 min post-rapamycin addition; two-tailed Student’s t-test. (B) Single cell PKA activity dynamics at the PM following addition of 100 nM rapamycin (a subset of data used for (A) is shown for clarity). (C) Relationship between PKA-R concentration, as estimated by mCherry fluorescence intensity, and maximal PM PKA activity increase following PKA-R translocation (n = 44 cells). Envelope overlaid for visualization. (D) Classification of cells into ‘low’ and ‘high’ expressors of PKA-R. (E) Average PM PKA activity over time for ‘low’ vs. ‘high’ expressors of PKA-R (defined in panel D). p = 0.024 at t = 58 min post-rapamycin addition; two-tailed Student’s t-test. (F) PM PKA activity response to two different rapamycin doses. p = 0.023 at t = 60 min post-rapamycin addition; two-tailed Student’s t-test. Graphs in (A, E, F) display the mean of each data set with standard error of the mean (SEM) indicated by shaded region. Number of cells in each data set is as indicated in the figure. Data is the result of three (A–E) and two (F) independent experiments, respectively. Mean and SEM values for each condition and time point, as well as single cell measurements for data presented in (A–E), are provided in Figure 2—source data 1. Arrows indicate the timing of drug addition. All experiments completed in HeLa PFM cells transiently expressing Lyn-AKAR4.
-
Figure 2—source data 1
Lyn-AKAR4 data following regulatory subunit of the protein kinase A (PKA-R) translocation.
(a) Sheet 1, Figure 2A Time Course. Lyn-AKAR4 response following addition of 0.1% DMSO or 100 nM rapamycin. Mean, standard error of the mean (SEM), and number of cells given for each time point and condition. (b) Sheet 2, Single cell data. Single cell time courses from Figure 2A–E. Cells are labeled as having low or high PKA-R expression. (c) Sheet 3, Figure 2E Time Course. Lyn-AKAR4 response following addition of 100 nM rapamycin for cells with low vs. high PKA-R expression. Mean, SEM, and number of cells given for each time point and condition. (d) Sheet 4, Figure 2F Time Course. Lyn-AKAR4 response following addition of 2 or 20 nM rapamycin. Mean, SEM, and number of cells given for each time point and condition.
- https://cdn.elifesciences.org/articles/66869/elife-66869-fig2-data1-v1.xlsx
Figure 2—figure supplement 1
Lyn-AKAR4 dynamic range.
Lyn-AKAR4 FRET response in HeLa PFM cells following co-treatment with 50 μM forskolin and 100 μM 3-isobutyl-1-methylxanthine (IBMX) to maximally increase intracellular cyclic AMP (cAMP) levels. Data represent the mean of n = 12 cells from one independent experiment with standard error of the mean (SEM) indicated by shaded region. Arrow indicates drug addition.
Figure 3 with 1 supplement
Graded translocation of regulatory subunit of the protein kinase A (PKA-R) induces a reversal of cell polarity.
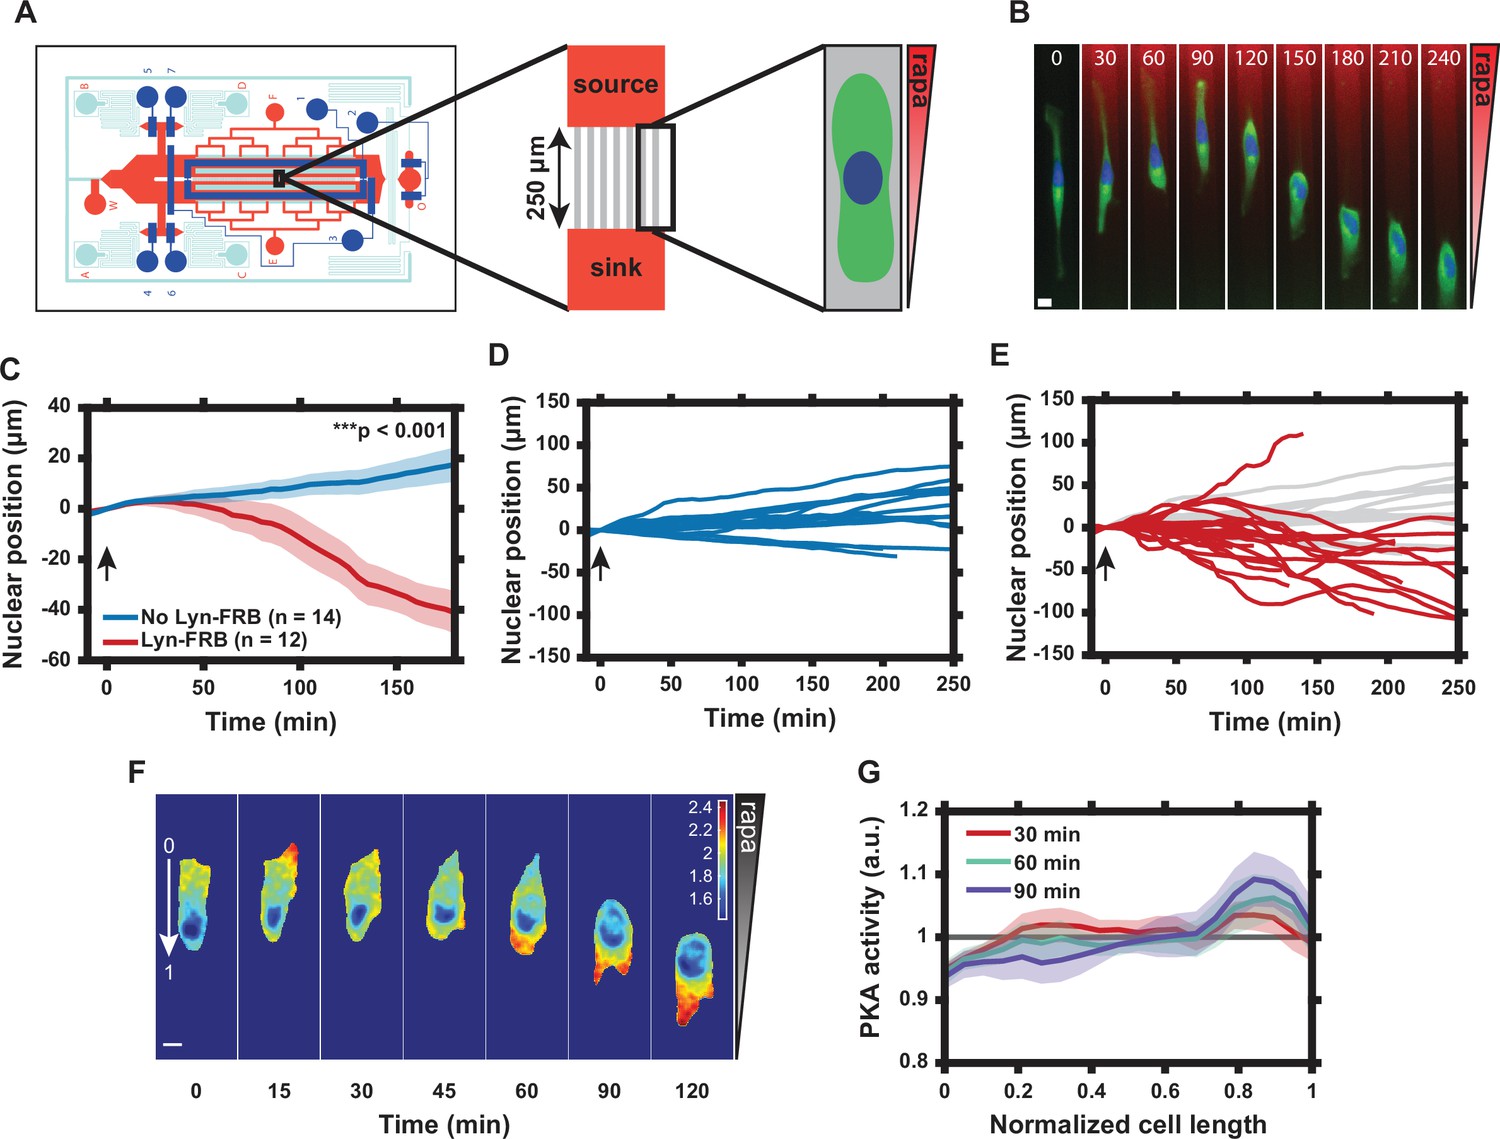
(A) Schematic of the microfluidic device used to produce gradients of rapamycin across microchannels housing HeLa PFY or PFM cells. (B) Single cell response to 20 nM rapamycin gradient. Numbers show time in minutes. (Green = PKAR-FKBP-YFP [stably expressed], Blue = H2β-mCerulean [transiently expressed nuclear marker], Red = Alexa Fluor 594 dye). (C) Average nuclear position (normalized to t = 0) for HeLa PFY cells in 20 nM rapamycin gradient (0.08 nM/µm) vs. no-translocation rapamycin control (HeLa cells stably expressing PKAR-FKBP-YFP but not Lyn-FRB). Standard error of the mean (SEM) indicated by shaded regions. p = 1.34 × 10⁻⁵ at 180 min post-rapamycin addition; two-tailed Student’s t-test. Number of cells in each data set as indicated in the figure. (D) Single cell nuclear position data for no-translocation rapamycin control cells in 20 nM rapamycin gradient. Data from one independent experiment. (E) Single cell nuclear position data for HeLa PFY cells in 20 nM rapamycin gradient. Data from three independent experiments. Data from (D) superimposed in light gray. (F) Tracking of intracellular PKA activity gradient in HeLa PFM cells using the transiently expressed FRET probe Lyn-AKAR4. Rapamycin gradient introduced at t = 0. Colorimetric FRET ratio scale as indicated by color bar. (G) Mean intracellular plasma membrane (PM) PKA activity tracking along the cell length from the high end of the rapamycin gradient (‘0’ in panel F) to the low end (‘1’ in panel F). Data represent the mean of n = 9 HeLa PFM cells from two independent experiments with SEM indicated by shaded region. Cells were divided into 20 bins with the average FRET ratio value taken for each. Arrows in (C–E) indicate addition of rapamycin. Scale bars in (B) and (F), 10 µm. Mean and SEM values for each time point and condition in (C) and each time point and position in (G) are provided in Figure 3—source data 1.
-
Figure 3—source data 1
Nuclear position and Lyn-AKAR4 data in microfluidic device.
(a) Sheet 1, Figure 3C and Figure 3—figure supplement 1 Time Course. Normalized nuclear position data for cells in 20 nM rapamycin gradient (0.08 nM/µm) with or without the membrane subunit of the regulatory subunit of the protein kinase A (PKA-R) translocation system (Lyn-FRB). Results also shown for cells in a volume equivalent DMSO gradient, as displayed in Figure 3—figure supplement 1. Mean, standard error of the mean (SEM), and number of cells given for each time point and condition. (b) Sheet 2, Figure 3G Intracellular PKA Activity Distribution. Mean intracellular PM PKA activity along the cell length from the high end of the rapamycin gradient (‘0’) to the low end (‘1’) for three time points. Mean, SEM, and number of cells given for all 20 bins and each time point.
- https://cdn.elifesciences.org/articles/66869/elife-66869-fig3-data1-v1.xlsx
Figure 3—figure supplement 1
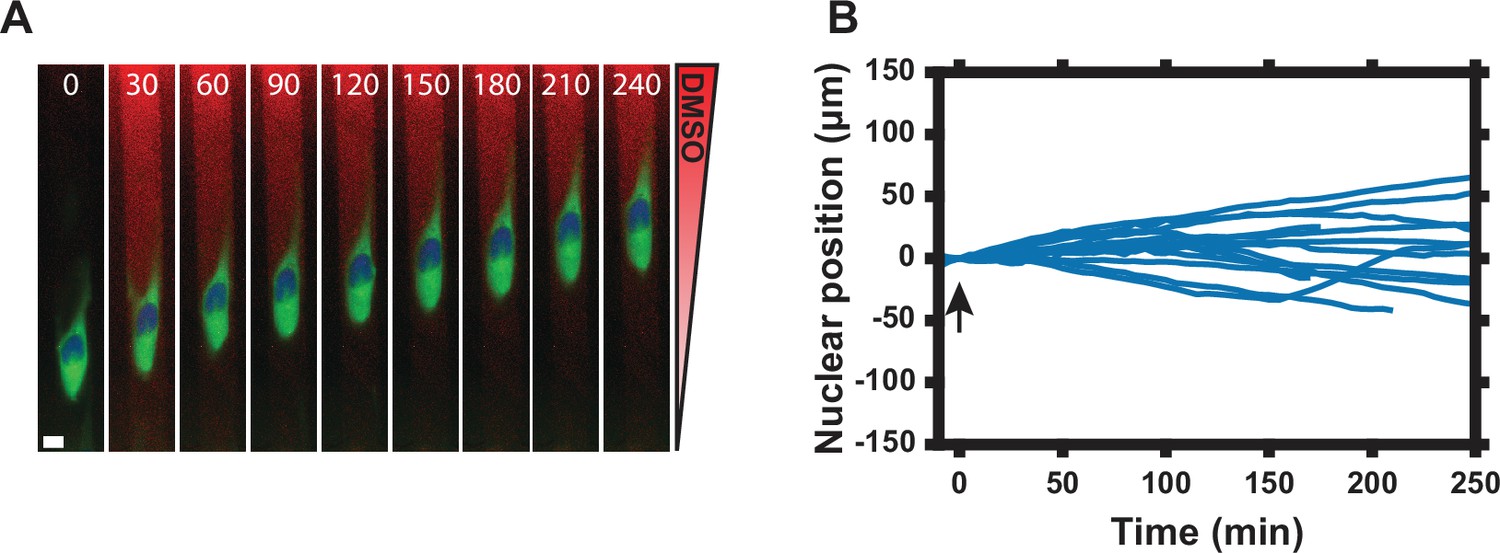
1D cell migration in DMSO gradient.
(A) Single cell response to DMSO gradient (0–0.1% from ‘sink’ to ‘source’ as labeled in Figure 3A). Numbers show time in minutes. Scale bar, 10 µm. (Green = PKAR-FKBP-YFP [stably expressed], Blue = H2β-mCerulean [transiently expressed nuclear marker], Red = Alexa Fluor 594 dye). (B) Nuclear position normalized to t = 0 min post-DMSO addition. A positive nuclear position indicates net movement of the nuclear centroid toward the DMSO source as described in Materials and methods. Arrow indicates DMSO addition. Data represent nuclear position for n = 18 cells from two independent experiments. Mean and standard error of the mean (SEM) values for each time point are provided in Figure 3—source data 1.
Figure 4
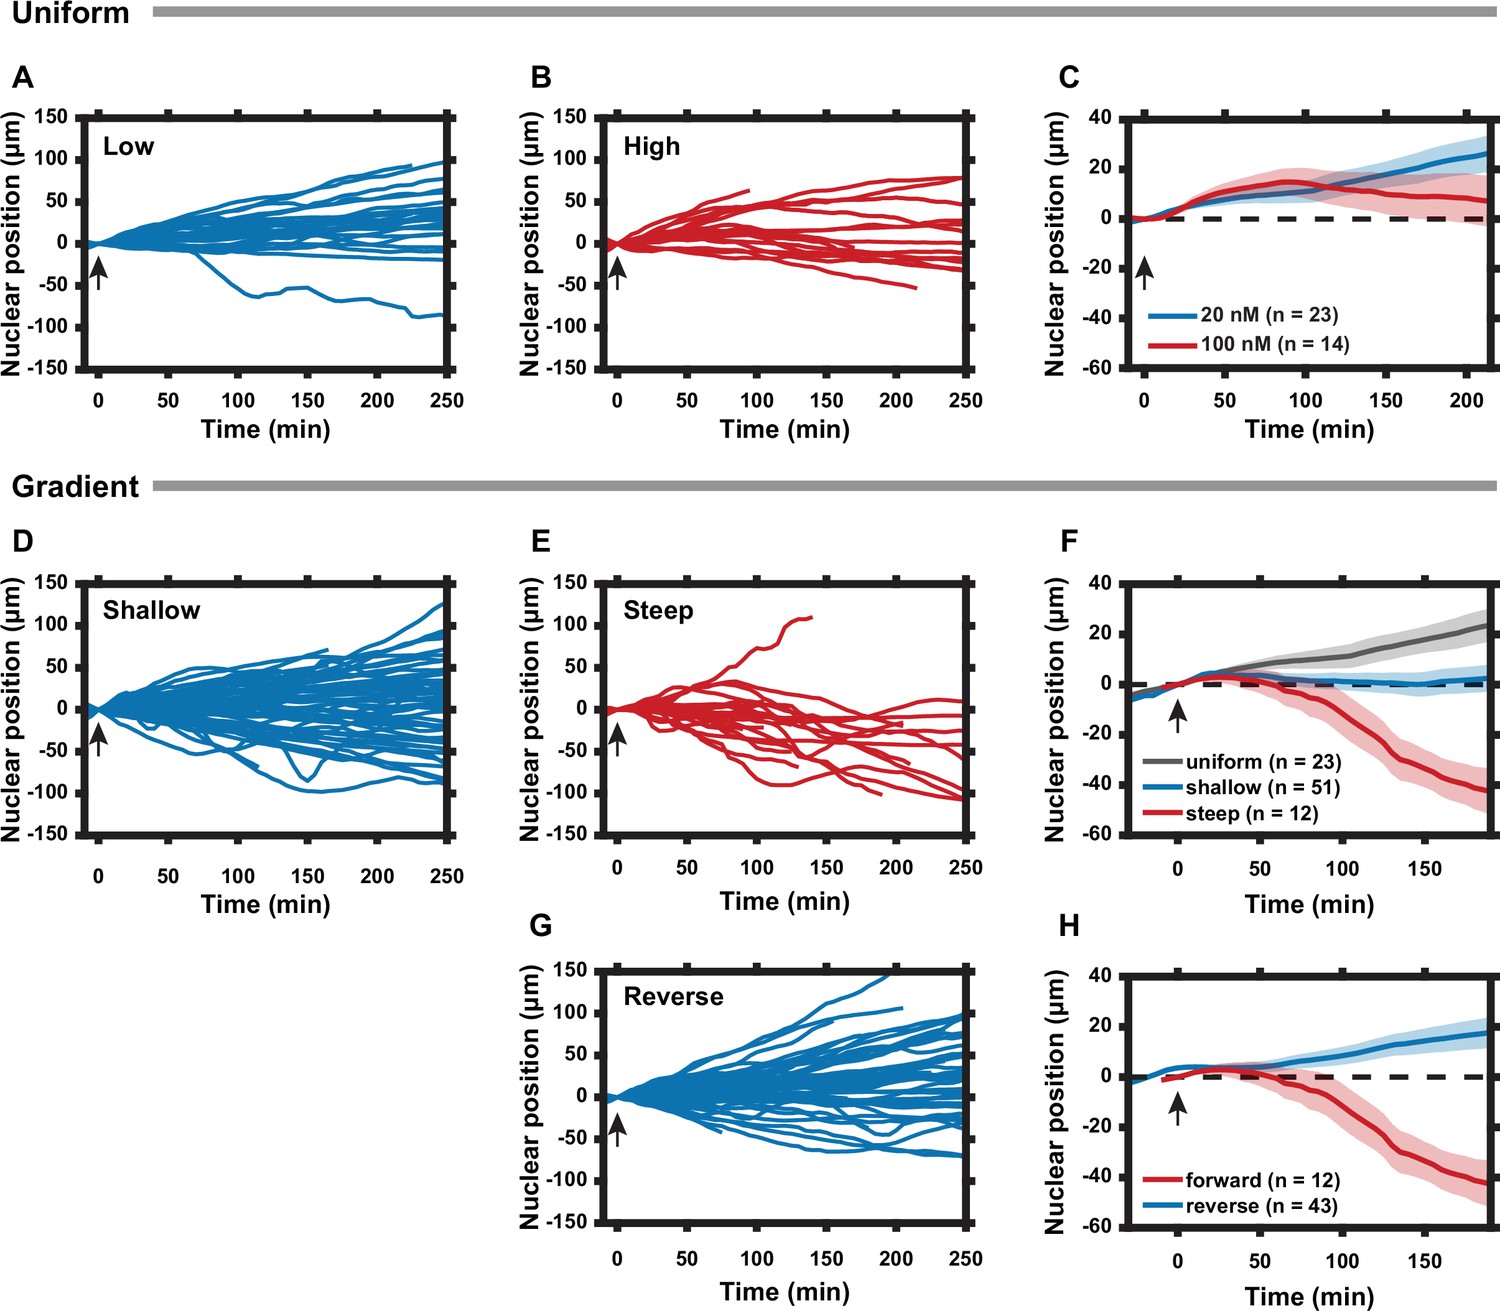
Cell polarization state can be tuned by the slope of the regulatory subunit of the protein kinase A (PKA-R) gradient.
(A) Nuclear positions of single cells responding to a uniform 20 nM rapamycin stimulus. (B) Nuclear positions of single cells responding to a uniform 100 nM rapamycin stimulus. (C) Average nuclear position of cells responding to 20 nM vs. 100 nM uniform rapamycin stimulus. Standard error of the mean (SEM) indicated by shaded regions. (D) Nuclear positions of single cells responding to a shallow rapamycin gradient (10 nM -– 20 nM, or 0.04 nM/µm). (E) Nuclear positions of single cells responding to a steep rapamycin gradient (0 nM -– 20 nM, or 0.08 nM/µm). Data taken from Figure 3E. (F) Average nuclear position of cells responding to a uniform 20 nM stimulus from (A), shallow gradient from (D), or steep gradient from (E). Standard error of the mean (SEM) indicated by shaded regions. (G) Nuclear positions of single cells responding to a steep rapamycin gradient in the reverse direction (20 nM – 0 nM, or 0.08 nM/µm) as what is shown in (3A). (H) Average nuclear position of cells responding to steep rapamycin gradient in the forward and reverse directions. SEM indicated by shaded regions. Arrows indicate addition of rapamycin. Number of cells in (C), (F), and (H) are as indicated in the figure. Data was collected from two (A, D, G) and three (B) independent experiments. Mean and SEM values for each time point and condition are provided in Figure 4—source data 1. All experiments completed using HeLa PFY cells.
-
Figure 4—source data 1
Nuclear position data for cells exposed to different rapamycin stimuli in microfluidic device.
Figure 4 Time Courses. Normalized nuclear position data for cells exposed to rapamycin distributions of varied magnitudes, slopes, and orientations. Mean, standard error of the mean (SEM), and number of cells given for each time point and condition.
- https://cdn.elifesciences.org/articles/66869/elife-66869-fig4-data1-v1.xlsx
Appendix 1—figure 1
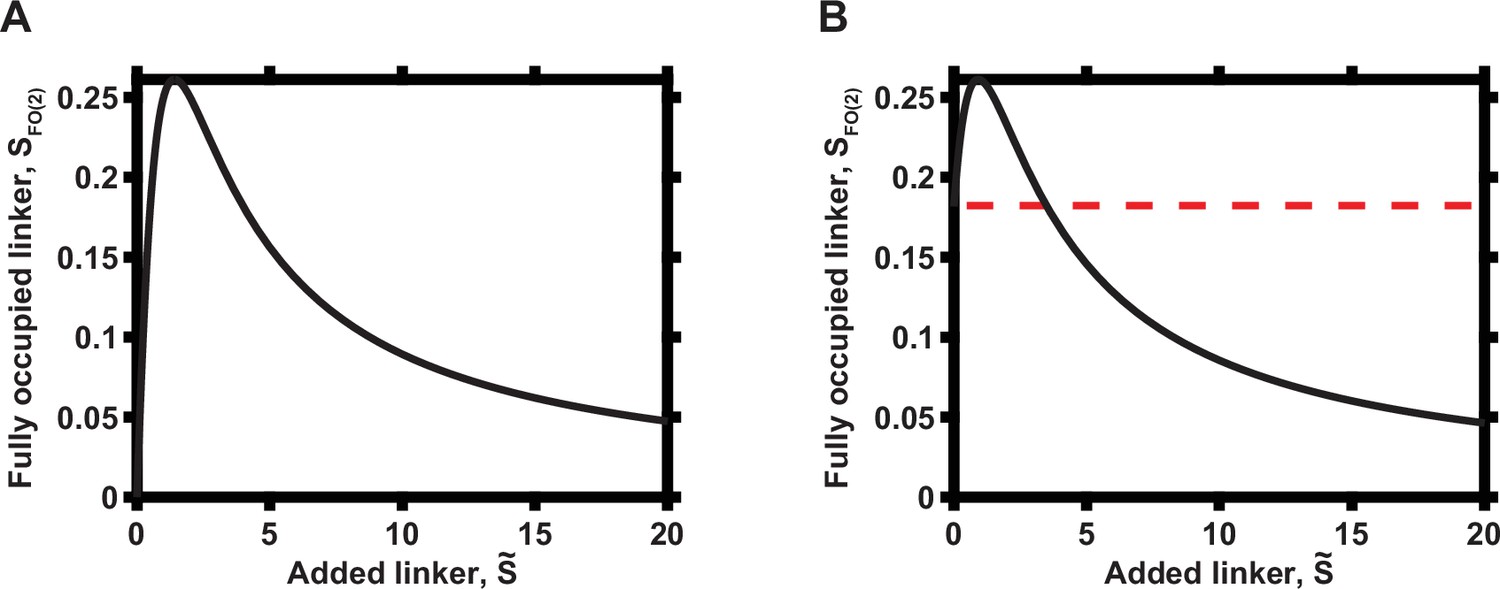
Overall dependence of functional complex concentration on the concentration of linker when N = 2.
(A) Zero initial linker concentration. (B) Non-zero initial linker concentration, prior to addition of the indicated linker molecular concentrations. The initial concentration of the linker is indicated by dashed red line.
Appendix 1—figure 2
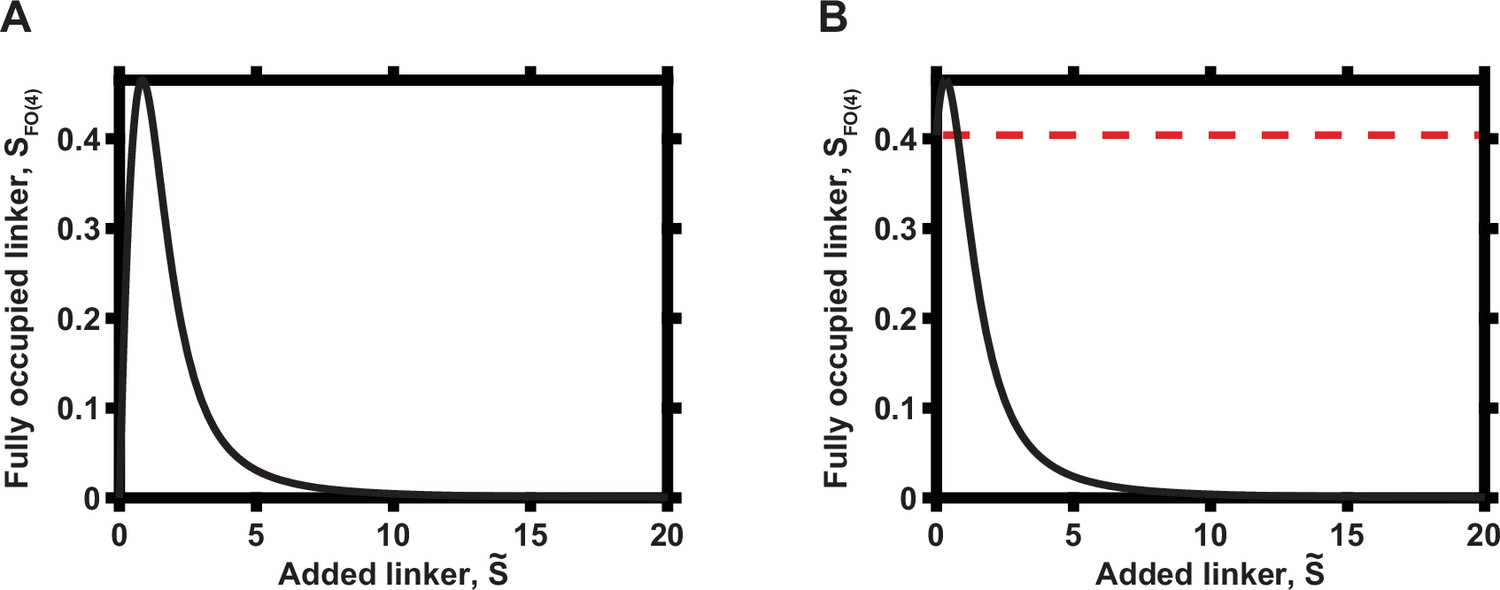
Overall dependence of functional complex concentration on the concentration of linker when N = 4.
(A) Zero initial linker concentration. (B) Non-zero initial linker concentration. The initial concentration of the linker is indicated by dashed red line.
Appendix 2—figure 1

Microfluidic gradient chip.
Cells are seeded into 16 µm wide × 6 µm tall microchannels (yellow) with gradient supplied by passive diffusion from adjacent 130 µm tall source and sink channels (light blue). Valves (dark blue) provide pressure to depress underlying 30 µm tall rounded fluidic channels (red). During experiment, medium (with or without drug) flows from inlet ports A/B or C/D to outlet port O.
Videos
Video 1
Rapamycin-induced translocation of regulatory subunit of the protein kinase A (PKA-R).
Translocation of PKA-R (green) to the plasma membrane of HeLa cells following treatment with 100 nM rapamycin at time zero as indicated in the video. Cells were co-transfected with mCherry protein (red) as a counterstain for visualization.
Video 2
Co-recruitment of catalytic subunit of the protein kinase A (PKA-C) and regulatory subunit of the protein kinase A (PKA-R) to the plasma membrane.
Co-localization of PKA-C (red) and PKA-R (green) before and after treatment with 100 nM rapamycin at time zero as indicated in the video.
Video 3
Single cell response to graded regulatory subunit of the protein kinase A (PKA-R) recruitment.
Single cell response to 20 nM rapamycin gradient applied at time zero as indicated in the video. (Green = PKAR-FKBP-YFP [stably expressed], Blue = H2β-mCerulean [transiently expressed nuclear marker], Red = Alexa Fluor 594 dye).
Video 4
Single cell response to DMSO gradient.
Single cell response to DMSO gradient applied at time zero as indicated in the video. (Green = PKAR-FKBP-YFP [stably expressed], Blue = H2β-mCerulean [transiently expressed nuclear marker], Red = Alexa Fluor 594 dye).
Tables
Key resources table
| Reagent type (species) or resource | Designation | Source or reference | Identifiers | Additional information |
|---|---|---|---|---|
| Gene (Homo sapiens) | PRKAR2B | GenBank | NCBI Reference Sequence:NM_002736.2 | mRNA sequence for PKA RIIβ |
| Strain, strain background (Escherichia coli) | DH5α | ThermoFisher Scientific | Cat#:18263012 | Competent cells |
| Cell line (human) | HeLa | Gift from Dr Jin Zhang, UCSD | RRID:CVCL_0030 | |
| Cell line (human) | HeLa PFY | This study | See ‘Cell line generation’ in Materials and methods | |
| Cell line (human) | HeLa PFM | This study | See ‘Cell line generation’ in Materials and methods | |
| Cell line (human) | HEK293FT | Laboratory stock | RRID:CVCL_6911 | Used to generate lentivirus for creation of cell lines |
| Antibody | Anti-PKA[C] (Mouse monoclonal) | BD | Cat#:610981; RRID: AB_398293 | (1:1000, WB) |
| Antibody | Anti-PKA RIIβ (Mouse monoclonal) | Santa Cruz Biotechnology | Cat#:sc-376778 | (1:400, WB) |
| Antibody | Anti-PKA RIIα (Rabbit polyclonal) | Abcam | Cat#:ab38949 | (1:1000, WB) |
| Antibody | Anti-PKA RI-α/β (Rabbit polyclonal) | Cell Signaling Technology | Cat#:3927 | (1:1000, WB) |
| Antibody | Anti-GAPDH (Rabbit monoclonal) | Cell Signaling Technology | Cat#:2118 | (1:1000, WB) |
| Recombinant DNA reagent | PKAR-FKBP-YFP transient expression plasmid | This study | See ‘Plasmid design’ in Materials and methods | |
| Recombinant DNA reagent | PKAR-FKBP-mCh transient expression plasmid | This study | See ‘Plasmid design’ in Materials and methods | |
| Recombinant DNA reagent | Lyn11-FRB transient expression plasmid | DOI:10.1126/science.1131163 | Gift from Dr Takanari Inoue, Johns Hopkins University | |
| Recombinant DNA reagent | pLenti-cmv-PKAR-FKBP-YFP-puro dest | This study | Lentiviral construct for expression of PKAR-FKBP-YFP. See ‘Cell line generation’ in Materials and methods | |
| Recombinant DNA reagent | pLenti-cmv-PKAR-FKBP-mCh-puro dest | This study | Lentiviral construct for expression of PKAR-FKBP-mCh. See ‘Cell line generation’ in Materials and methods | |
| Recombinant DNA reagent | pLenti-cmv-Lyn-FRB-blast dest | This study | Lentiviral construct for expression of Lyn11-FRB. See ‘Cell line generation’ in Materials and methods | |
| Recombinant DNA reagent | Lyn-AKAR4 | DOI:10.1039/c0mb00079e | Gift from Dr Jin Zhang, UCSD | |
| Recombinant DNA reagent | H2β-mCerulean | This study | See ‘Plasmid design’ in Materials and methods | |
| Commercial assay or kit | QIAprep Spin Miniprep kit | QIAGEN | Cat#:27104 | |
| Commercial assay or kit | Pierce BCA Protein Assay Kit | ThermoFisher Scientific | Cat#:23225 | |
| Chemical compound, drug | Rapamycin | LC Laboratories | Cat#:R-5000 | |
| Chemical compound, drug | Forskolin; Fsk | MilliporeSigma | Cat#:344270; CAS:66575-29-9 | |
| Chemical compound, drug | 3-Isobutyl-1-methylxanthine; IBMX | MilliporeSigma | Cat#:I5879; CAS:28822-58-4 | |
| Chemical compound, drug | Fugene HD Transfection Reagent | Promega | Cat#:E2311 | |
| Chemical compound, drug | TurboFect Transfection Reagent | ThermoFisher Scientific | Cat#:FERR0531 | |
| Software, algorithm | MATLAB, R2021b and prior versions | MathWorks | Used for custom image analysis. Code provided with manuscript | |
| Software, algorithm | GraphPad Prism 9.3.1 | GraphPad Software, LLC | Used for statistical analysis | |
| Software, algorithm | Fiji/ImageJ | DOI: 10.1038/nmeth.2019 | RRID:SCR_002285 | Used for immunoblot analysis |
| Other | Multilayer microfluidic device/gradient generator | This study | See Materials and methods and Appendix 2 |
Additional files
Download links
A two-part list of links to download the article, or parts of the article, in various formats.
Downloads (link to download the article as PDF)
Open citations (links to open the citations from this article in various online reference manager services)
Cite this article (links to download the citations from this article in formats compatible with various reference manager tools)
Complex effects of kinase localization revealed by compartment-specific regulation of protein kinase A activity
eLife 11:e66869.
https://doi.org/10.7554/eLife.66869


