Systematic screening of viral and human genetic variation identifies antiretroviral resistance and immune escape link
- Division of Infectious Diseases and Hospital Epidemiology, University Hospital Zurich, University of Zurich, Switzerland
- Institute of Medical Virology, Swiss National Center for Retroviruses, University of Zurich, Switzerland
- School of Life Sciences, École Polytechnique, Switzerland
- Precision Medicine Unit, Lausanne University Hospital and University of Lausanne, Switzerland
- Laboratory of Virology, Geneva University Hospital, University of Geneva, Switzerland
- Division of Immunology and Allergy, University Hospital Lausanne, University of Lausanne, Switzerland
- Transplantation & Clinical Virology, Department of Biomedicine, University of Basel, Switzerland
- Infectious Diseases and Hospital Epidemiology, Department of Medicine, University Hospital Basel, Switzerland
- Clinical Virology, Laboratory Medicine, University Hospital Basel, Switzerland
- University Clinic of Infectious Diseases, University Hospital of Bern, University of Bern, Switzerland
- Department of Infectious Diseases, Centre Hospitalier Universitaire Vaudois, University of Lausanne, Switzerland
- Division of Infectious Diseases and Hospital Epidemiology, Kantonsspital St. Gallen, Switzerland
- Division of Infectious Diseases, Regional Hospital, Switzerland
Figures
Figure 1
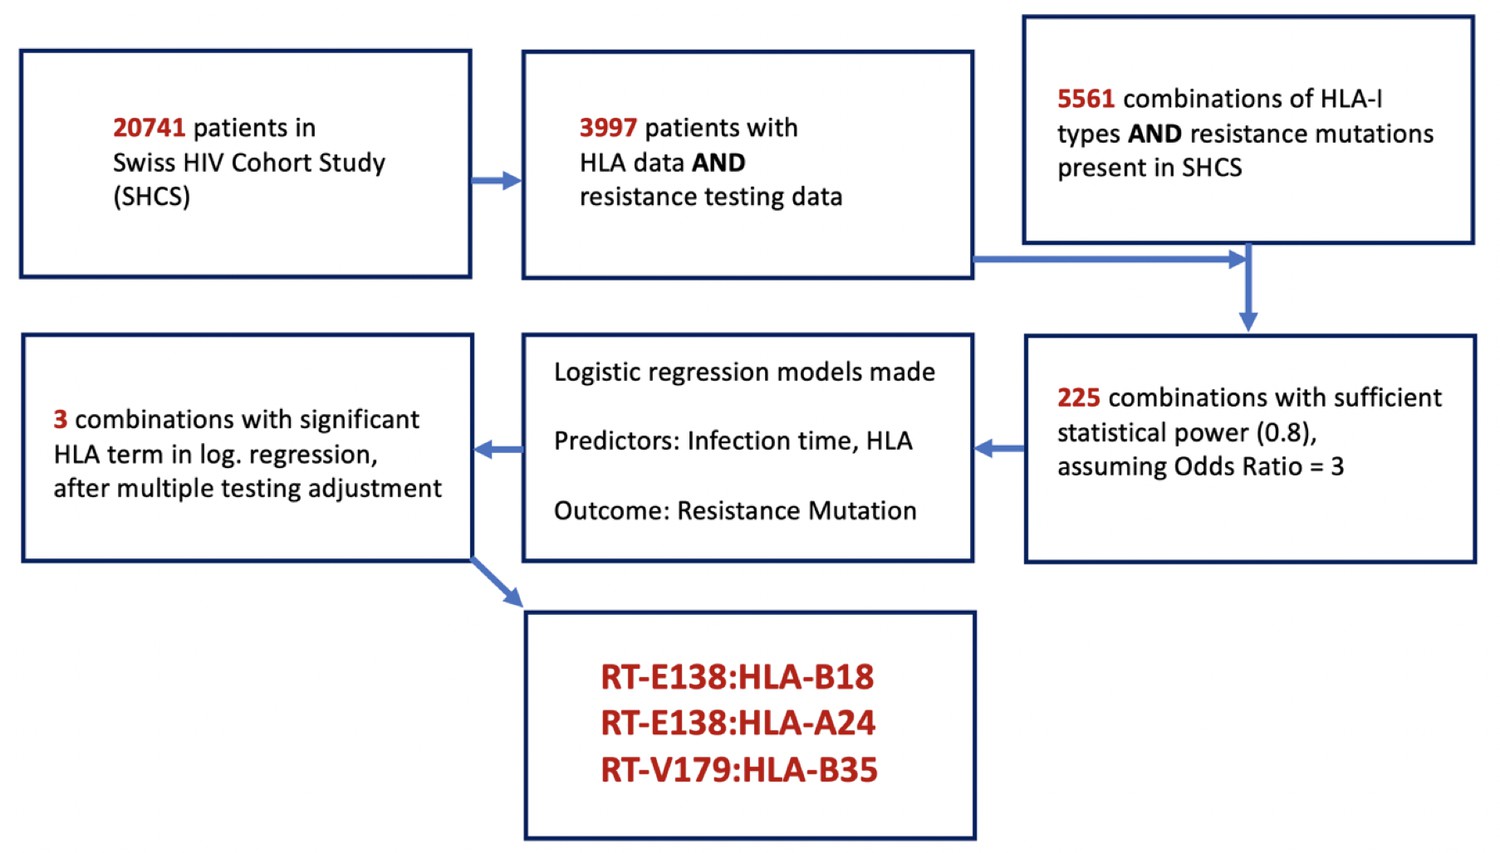
Flowchart of methodology of obtaining the candidate DRM:HLA pairs with possible epitope relationship.
From the 3997 SHCS patients with both HLA-I data and drug resistance testing data, 5561 potential combinations of HLA-I type and DRMs were examinable, from which only 225 had sufficient power for testing. From these 225, three candidate pairs were found to have a significant HLA term in a logistic regression model predicting the resistance mutation in question. DRM, drug-resistant mutation; HLA, human leukocyte antigen.
Figure 2
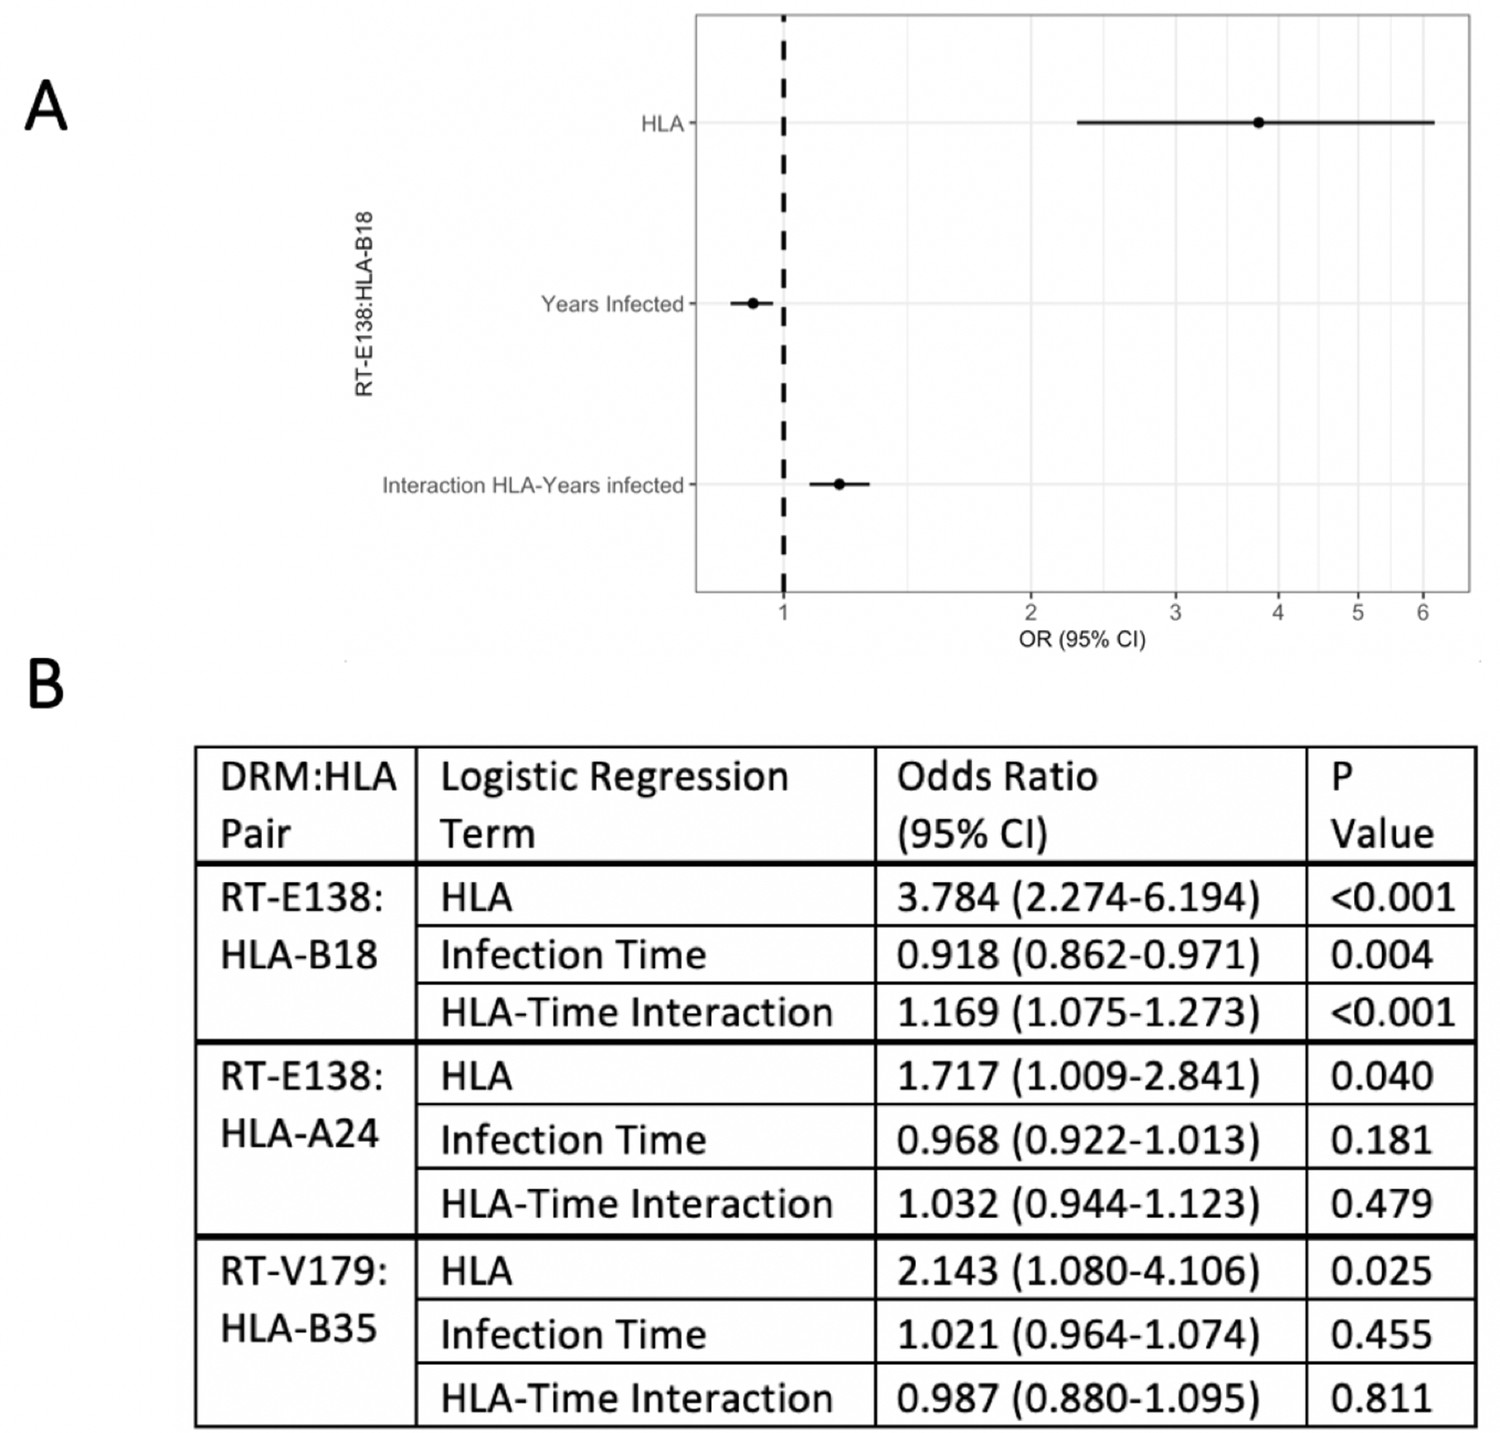
Logistic regression models testing for interaction between the queried human leukocyte antigen (HLA) type and duration of infection in predicting the presence of drug-resistant mutation (DRM).
Of the three candidate DRM:HLA type pairs, one pair, RT-E138:HLA-B18, indicates a significant interaction term between the presence of the queried HLA type and the duration of HIV infection in a logistic regression model predicting the presence of a mutation at RT-E138 (A). (B) Details of all three candidates’ logistic regression models.
Figure 3
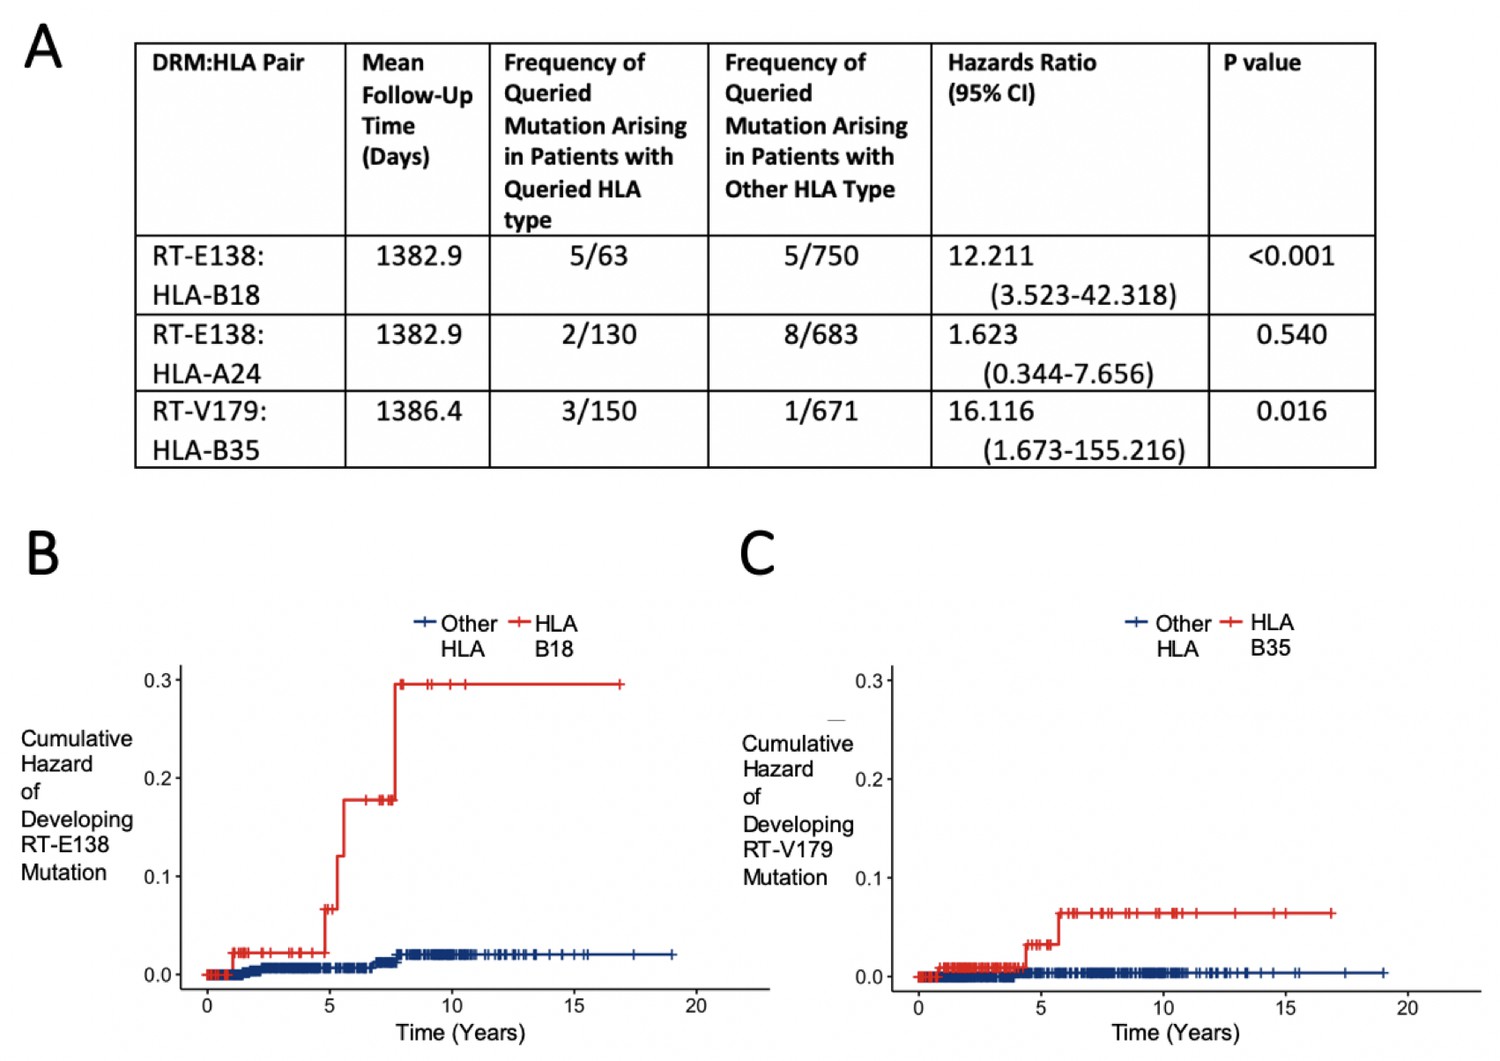
Hazard ratios and cumulative hazards of developing queried drug-resistant mutation over time in relation to the presence of human leukocyte antigen (HLA) type.
(A) Cox proportional hazard ratios for developing the queried drug-resistant mutation with the queried HLA-I type. (B, C) Cumulative hazard plots of the two pairs from (A) where the hazard ratios were significant, indicating cumulative hazards of developing the mutation among those initially wild type, with red lines indicating individuals with the queried HLA type and blue lines for those with another HLA type.
Tables
Table 1
General characteristics of SHCS patients and those with resistance mutation and human leukocyte antigen (HLA) data.
Overview of general characteristics of SHCS patients and the subsets with sequencing resistance testing data, HLA-I data, and both. IQR: interquartile range; MSM: men who have sex with men; HET: heterosexual; IDU: intravenous drug use.
| All SHCS participants | SHCS patients with resistance testing data | SHCS patients with HLA-I data | SHCS patients with HLA-I and resistance testing data | |
|---|---|---|---|---|
| Number | 20,741 | 13,116 | 6450 | 3997 |
| Median age (IQR) | 56 (48–62) | 54 (47–60) | 55 (49–62) | 54 (47–60) |
| Male (%) | 15,064 (72.6%) | 9402 (71.2%) | 4836 (75.0%) | 3027 (75.7%) |
| Risk group: MSM | 8100 (39.1%) | 5226 (39.8%) | 2777 (43.1%) | 1784 (44.6%) |
| HET | 6841 (33.0%) | 4731 (36.1%) | 2173 (33.7%) | 1439 (36.0%) |
| IDU | 4840 (23.3%) | 2568 (19.6%) | 1255 (19.5%) | 620 (15.5%) |
| Other | 960 (4.6%) | 591 (4.5%) | 245 (3.8%) | 154 (3.9%) |
| White (%) | 14044 (67.7%) | 9993 (76.2%) | 5661 (87.8%) | 3487 (87.2%) |
Table 2
Distribution of most common HLA-I A, B, and C alleles in study population.
Ten most common HLA-A, -B, and -C types in study population individuals with both HLA-I and DRM information. Frequency and percentage of individuals with each allele are indicated. DRM, drug-resistant mutation; HLA, human leukocyte antigen.
| HLA-A type | Frequency | Percentage |
|---|---|---|
| 02 | 1838 | 46.0 |
| 03 | 964 | 24.1 |
| 01 | 857 | 21.4 |
| 24 | 668 | 16.7 |
| 11 | 493 | 12.3 |
| 68 | 340 | 8.5 |
| 32 | 302 | 7.6 |
| 30 | 300 | 7.5 |
| 26 | 272 | 6.8 |
| 29 | 261 | 6.5 |
| HLA-B type | Frequency | Percentage |
| 44 | 905 | 22.6 |
| 07 | 814 | 20.4 |
| 35 | 729 | 18.2 |
| 51 | 639 | 16.0 |
| 15 | 582 | 14.6 |
| 08 | 500 | 12.5 |
| 40 | 410 | 10.3 |
| 18 | 376 | 9.4 |
| 57 | 328 | 8.2 |
| 27 | 294 | 7.4 |
| HLA-C type | Frequency | Percentage |
| 07 | 1794 | 44.9 |
| 04 | 941 | 23.5 |
| 03 | 812 | 20.3 |
| 06 | 772 | 19.3 |
| 12 | 510 | 12.8 |
| 05 | 485 | 12.1 |
| 02 | 401 | 10.0 |
| 16 | 341 | 8.5 |
| 01 | 328 | 8.2 |
| 15 | 320 | 8.0 |
Table 3
Distribution of most common drug-resistant mutations (DRMs) in study population.
Ten most common DRMs from the earliest available resistance testing of the study population, with the frequency and percentage of each among the study population indicated. Specific amino acid mutations represented in the population are shown.
| Gene | Specific DRM | Frequency | Percentage |
|---|---|---|---|
| RT-E138 | AGKQ | 145 | 3.63 |
| RT-T215 | ACDEFILNSVY | 132 | 3.30 |
| RT-V106 | AIM | 95 | 2.38 |
| RT-V179 | DEF | 82 | 2.05 |
| RT-M41 | L | 72 | 1.80 |
| PR-M46 | ILV | 47 | 1.18 |
| RT-K103 | NS | 46 | 1.15 |
| RT-K219 | ENQR | 34 | 0.85 |
| RT-D67 | EGN | 34 | 0.85 |
| RT-M184 | IV | 30 | 0.75 |
Table 4
DRM:HLA pairs corroborated by each analytical approach.
Summary of HLA–drug-resistant mutation pairs in all three approaches. Methods that corroborate the HLA–mutation relationship are indicated by ‘yes.’ DRM, drug-resistant mutation; HLA, human leukocyte antigen.
| DRM:HLA pair | Interaction term in cross-sectional logistic regression | Longitudinal/ survival analysis | Mechanistic plausibility |
|---|---|---|---|
| RT-E138:HLA-B18 | Yes | Yes | Yes |
| RT-E138:HLA-A24 | No | No | No |
| RT-V179:HLA-B35 | No | Yes | Yes |
Additional files
-
Source data 1
Data files with select anonymized variables necessary for producing main figures.
- https://cdn.elifesciences.org/articles/67388/elife-67388-data1-v1.zip
-
Supplementary file 1
Overview of Benjamini–Hochberg adjustment of DRM:HLA candidate pairs.
Overview of the Benjamini–Hochberg procedure to correct for multiple testing in selecting HLA–mutation pairs. Pairs were ranked by the p-value of the HLA term in the adjusted logistic regression model predicting for the queried mutation. The numerical rank (I) is divided by the total number of pairs (m = 225) and multiplied by the false discovery rate of 0.2 (Q). With this adjustment, the lowest-ranked pairs where the p-value is lower than (I/m)Q, along with all pairs ranked above, are included after the adjustment (in bold in the table), yielding the three candidate pairs we investigated in-depth (in bold). Only the first 25 rows of the total 225 are shown.
- https://cdn.elifesciences.org/articles/67388/elife-67388-supp1-v1.docx
-
Supplementary file 2
Table of NetMHCpan predictions of top binding peptides for each HLA–DRM candidate pair.
For each HLA–mutation pair, the binding peptides (defined as below a rank of 2% for weakly binding and below 0.5% for strongly binding) are listed ranked in decreasing predicted binding strength according to NetMHCpan. Peptides in bold denote the peptides without the mutation that bind more strongly than all other peptides for that position in the viral amino acid sequence. Peptides in bold and italics denote peptides without the mutation that bind more weakly than a mutated form.
- https://cdn.elifesciences.org/articles/67388/elife-67388-supp2-v1.docx
-
Transparent reporting form
- https://cdn.elifesciences.org/articles/67388/elife-67388-transrepform-v1.pdf
Download links
A two-part list of links to download the article, or parts of the article, in various formats.
Downloads (link to download the article as PDF)
Open citations (links to open the citations from this article in various online reference manager services)
Cite this article (links to download the citations from this article in formats compatible with various reference manager tools)
Systematic screening of viral and human genetic variation identifies antiretroviral resistance and immune escape link
eLife 10:e67388.
https://doi.org/10.7554/eLife.67388


