Design of novel cyanovirin-N variants by modulation of binding dynamics through distal mutations
- Center for Biological Physics and Department of Physics, Arizona State University, United States
- School of Molecular Sciences, Arizona State University, United States
- Sanford Burnham Prebys Medical Discovery Institute, United States
Figures
Figure 1
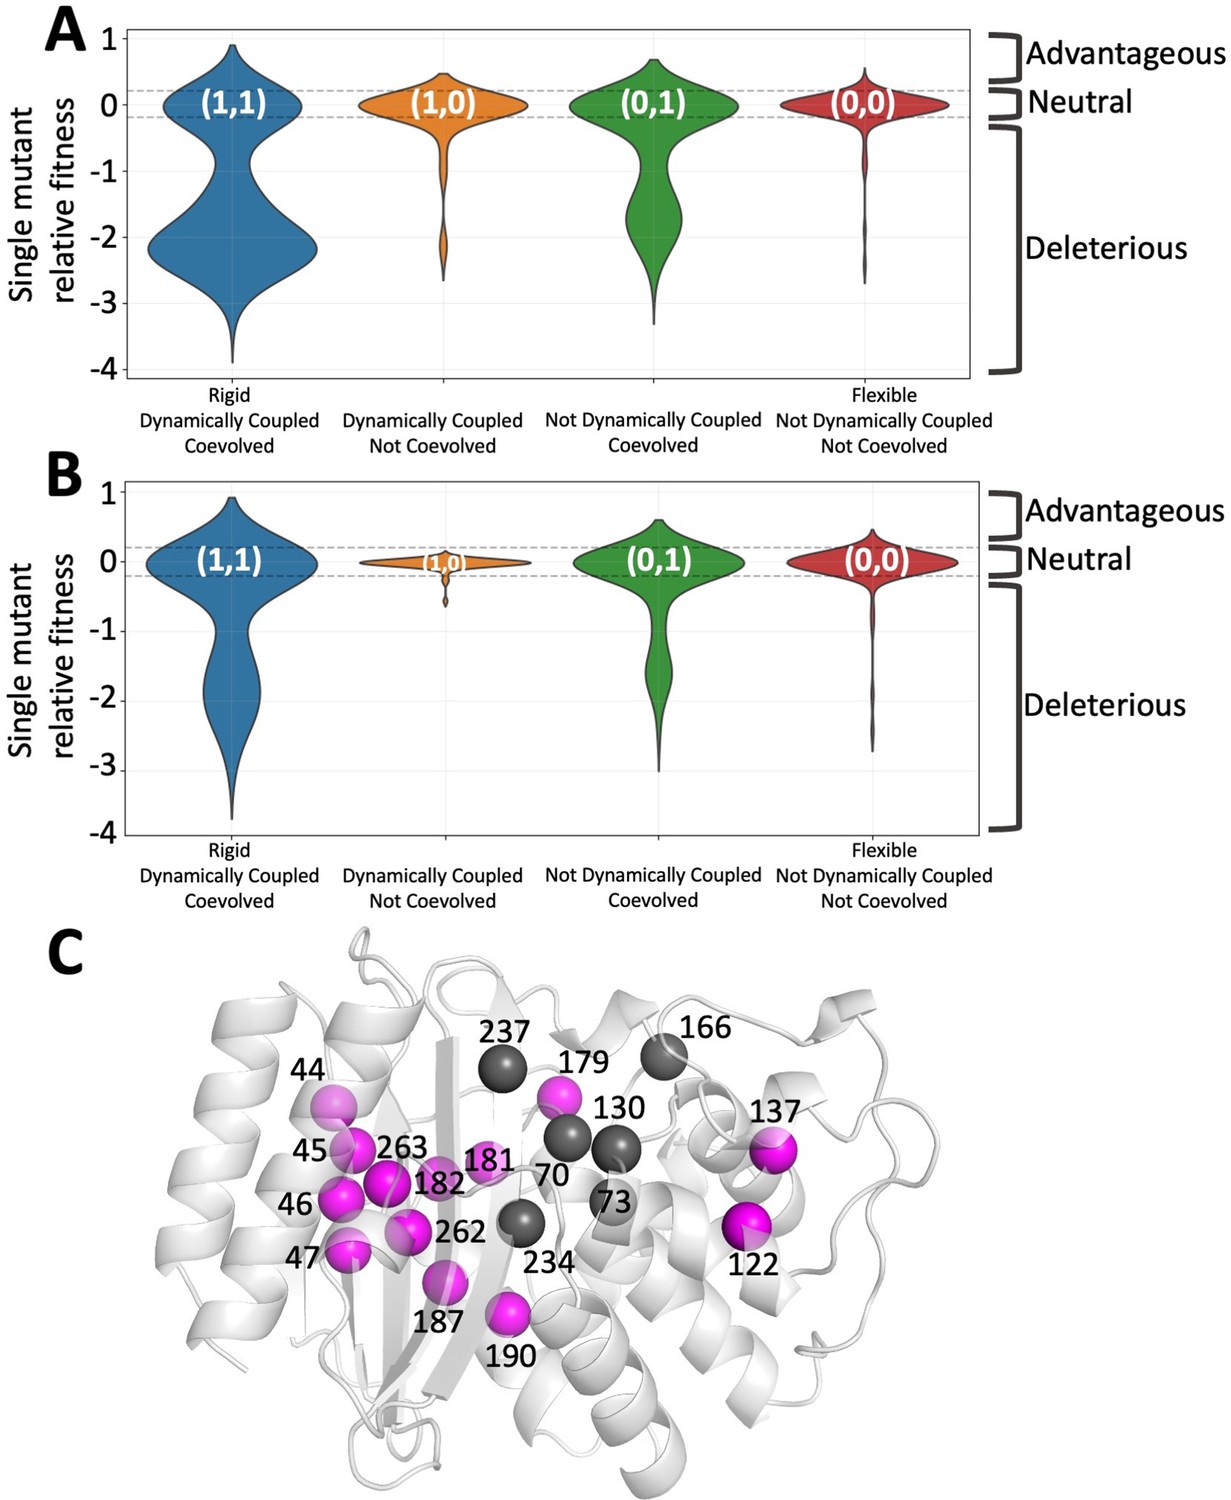
Integrated co-evolution and dynamic coupling (ICDC) categories based on the dynamics and co-evolutionary analyses applied on TEM-1 β-lactamase.
(A) The distributions in the form of violin plots are obtained for each ICDC category using all available experimental mutational data (Stiffler et al., 2015). (B) Violin plots showing the fitness values for amino acid substitutions observed in the natural sequences. (C) The category (1,1) positions are mapped on 3D structure. The catalytic site residues are shown in dark gray whereas category (1,1) positions are shown in magenta color. The function altering category (1,1) positions are widely distributed over the 3D structure.
Figure 2
Predicted binding energies for each integrated co-evolution and dynamic coupling (ICDC) category.
Mutations in category (1,1) positions comprise the highest number of binding energy enhancing mutations as well as deleterious mutations. Mutations in category (0,0) positions are mostly near neutral (category (1,1) and (0,0) p value <0.3).
Figure 3
DFI and DCI analyses on CV-N.
(A) Dynamic flexibility index (DFI) profile mapped onto cyanovirin-N (CV-N) structure: red corresponds to high DFI (very flexibile sites), and blue to low DFI values (rigid sites). Position I34 (low DFI score) is highlighted. (B) Dynamic coupling index (DCI) profile projected on CV-N structure with green corresponding to sites exhibiting high coupling with binding site residues.
Figure 4 with 5 supplements

The comparison of the crystal structures of P51G-m4 and I34Y.
(A) The crystal structures of I34Y (bound in magenta and unbound in cyan) and its template protein P51G-m4 (green) are superimposed. (B) Overlay of bound structures of I34Y (magenta) and P51G-m4 (gray) (RMSD 0.15 Å); dashed lines depict polar interactions with dimannose.
Figure 4—figure supplement 1
The flowchart of the Adaptive BP-Dock Scheme.
Starting from an unbound structure the backbone atoms are perturbed using perturbation response scanning (PRS) and perturbed pose is fed into minimization. The minimized conformation is docked with the glycan using RosettaLigand docking approach. The lowest scored docked pose is selected and used for next iteration step until convergence is established. For every lowest energy docked pose from an iteration a new binding score is reevaluated using X-score empirical scoring function.
Figure 4—figure supplement 2
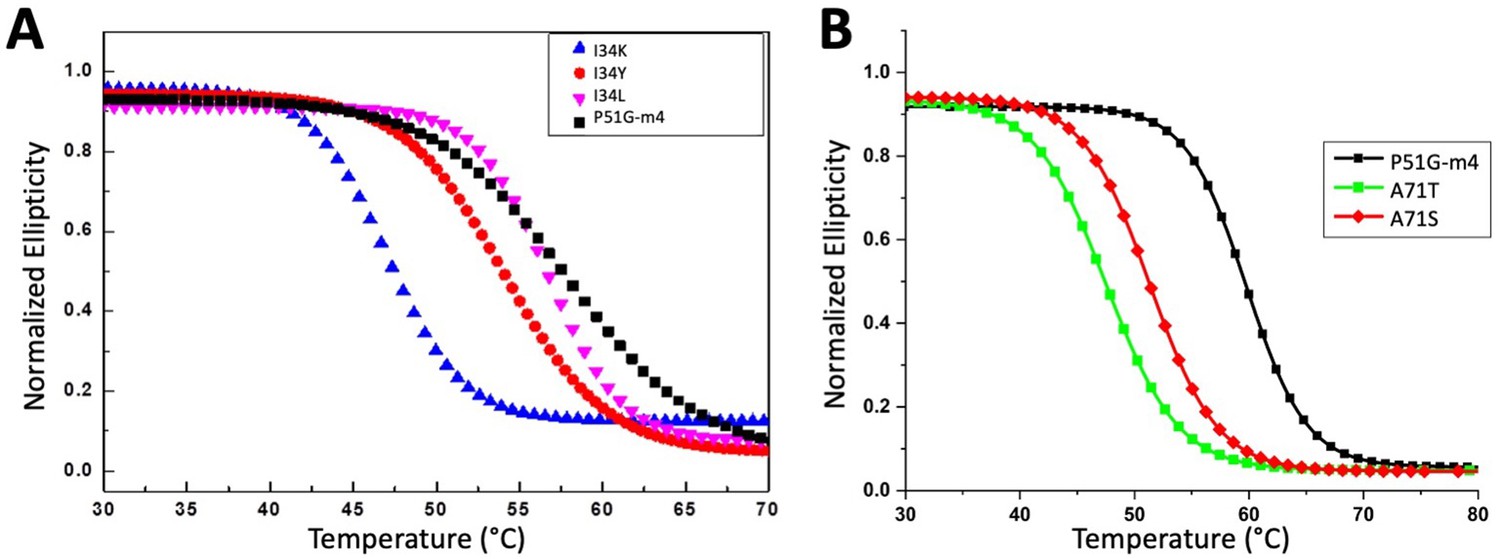
Fits for thermal melts of the cyanovirin-N (CV-N) (A) I34 variants and (B) A71 variants.
Figure 4—figure supplement 3
Fits for the chemical denaturation experiments of the variants.
(A) Chemical denaturation curve showing I330/ I360 ratio as a function of Gu-HCl concentration. (B) ∆GH2O versus Gu-HCl concentration plot for cyanovirin-N (CV-N) mutants.
Figure 4—figure supplement 4
Binding isotherms of cyanovirin-N (CV-N) mutants upon titration with dimannose: (A) I34Y, (B) P51G-m4, and (C) A71T.
Figure 4—figure supplement 5
Comparison of experimentally solved I34Y structure with docked pose from Adaptive BP-Dock algorithm.
The RMSD of the ligand is calculated as 0.75 Å.
Figure 5 with 2 supplements
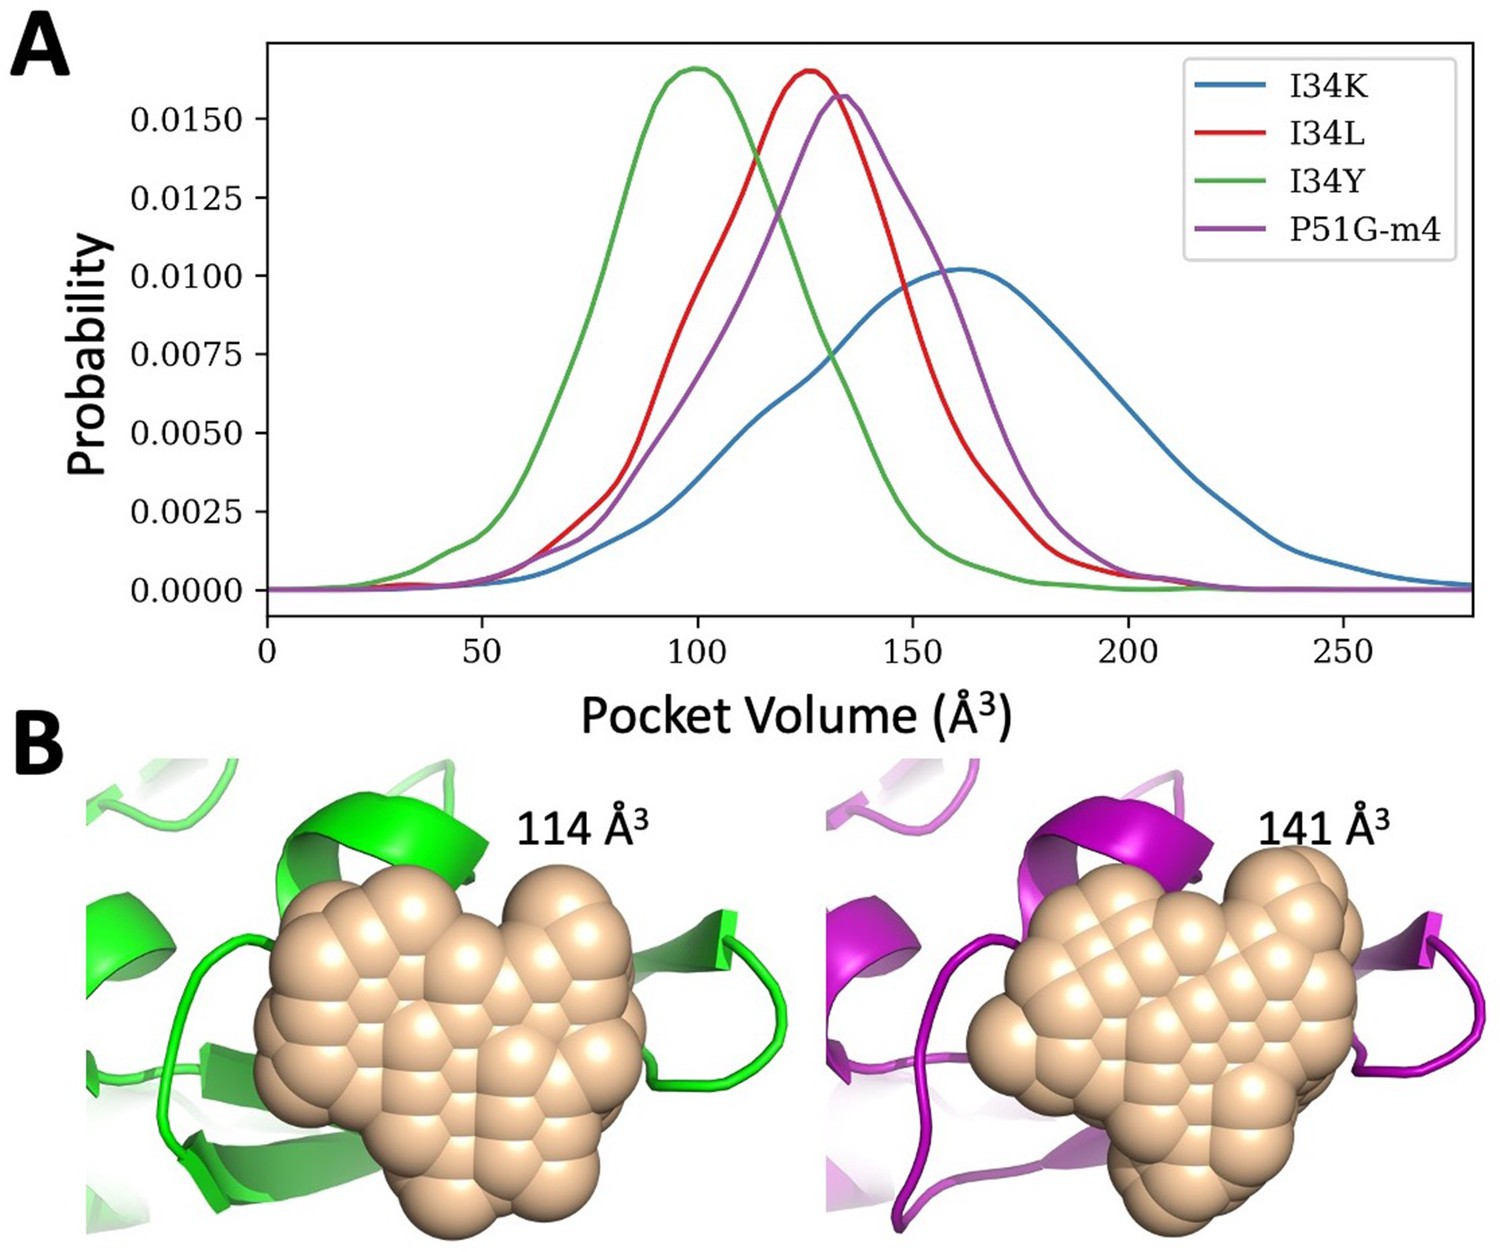
Binding pocket volume estimations for P51G-m4 and its variants.
(A) Probability distribution of the pocket volume analyses obtained from molecular dynamics (MD) simulation trajectories. I34Y populates a conformation with an optimum volume more than others. P51G-m4 and I34L variant samples similar pocket volumes, but I34K variant has a larger pocket volume compared to others. (B) Pocket volume comparison of the domain B of solved structures for P51G-m4 (purple) and I34Y variant (green).
Figure 5—figure supplement 1
The difference in accessibility of the binding pocket for P51G-m4 and I34Y.
(A) Structural difference of open versus closed conformation based on the hydrogen bond distance between residues N42 and N53. (B) Hydrogen bond distance between residue N42 and N53 from crystal structures of P51G-m4 and P51G-m4-I34Y. (C) Frequencies of hydrogen bond distance between residue N42 and N53 from GROMACS production runs showing I34Y variant sampling more open conformation compared to P51G-m4.
Figure 5—figure supplement 2
We sampled 2000 different conformations from molecular dynamics (MD) simulations for P51G-m4 cyanovirin-N (CV-N) and I34Y mutant and performed dimannose docking to obtained docked poses and then analyzed hydrogen bond patterns.
(A) Hydrogen bonds (representing the peak of the distribution on panel B) and their distances are shown between dimannose and residue R76 for P51G-m4 (blue) and I34Y (orange). (B) H-bond distance distribution between dimannose and residue R76.
Figure 6
Clustering of CV-N variants using DFI profiles and biophysical properties.
(A) 2D map of Kd and melting temperature of P51G-m4 and its variants. (B) Principal component analyses (PCA) clustering on the first two principal components of the dynamic flexibility index (DFI) profiles as a dendrogram.
Figure 7 with 2 supplements
Changes inflexibility s of the binding site residues upon mutations in bound and unbound forms.
(A) Change in flexibility of I34K, I34L, and I34Y relative to P51G-m4 in unbound form is shown. Residues E41, N42, and T57 rigidifies on I34Y compared to P51G-m4. (B) Change in flexibility of I34K, I34L, and I34Y relative to P51G-m4 in bound form is projected on structure. (C) Hydrogen bonding interactions of residues I55, E56, T57, and C58 are shown for P51G-m4 and I34Y variant.
Figure 7—figure supplement 1
Correlation between change in DFI profiles aind change in ΔG of binding.
(A) Change in ΔG of binding (ΔGmut − ΔGwt) is compared with change in total dynamic flexibility index (DFI) scores () for selected residues. The correlation with experimental binding scores is compared with the total sum of DFI values considering only domain B binding site residues first, and also summing over the domain B binding sites as well as the residues highly coupled (coupling greater than 0.8) to them. The observed high correlations indicate that these residues play an important role in the binding modulation upon mutations. The similar trend has also been seen in LacI (Campitelli et al., 2021). (B) In addition we randomly selected residues in domain B to calculate total DFI change over these positions upon mutations. Three different randomly selected residue sets all show poor correlation with change in experimental binding free energy.
Figure 7—figure supplement 2
Network of hydrogen bond interactions connecting residue location 34 to T57 is investigated in I34Y variant and P51G-m4 cyanovirin-N (CV-N).
Two hydrogen bond pathways are found connecting residue 34–57. Pathway 1 is unique to I34Y. Pathway 2 is also observed in P51G-m4 CV-N but sampled much more frequently in I34Y variant.
Tables
Table 1
Predicted binding affinities of domain B, experimental ITC data, and chemical denaturation experiments for P51G-m4 and its I34 variants.
| Protein | Predictedbindingscore(X-score energy unit) | ITC dimannoseKd (μM) | ITC dimannoseΔH (kcal/mol) | ITC dimannoseTΔS (kcal/mol) (T=298 K) | ITC dimannoseΔG (kcal/mol) | ∆GH2O (kcal/mol) | Cm (M) |
|---|---|---|---|---|---|---|---|
| P51G-m4 | –6.62 | 117±3 | –12.3±0.3 | –7.00±0.3 | –5.30±0.3 | 3.01±0.047 | 1.46±0.019 |
| P51G-m4-I34K | –5.85 | No binding | No binding | No binding | No binding | 2.40±0.124 | 0.68±0.015 |
| P51G-m4-I34L | –6.19 | 148±2 | –9.60±0.1 | –4.40±0.1 | –5.20±0.1 | 2.95±0.077 | 1.39±0.009 |
| P51G-m4-I34Y | –6.75 | 64±5 | –4.35±0.1 | 1.32±0.2 | –5.67±0.2 | 2.91±0.157 | 1.13±0.017 |
Additional files
-
Transparent reporting form
- https://cdn.elifesciences.org/articles/67474/elife-67474-transrepform1-v1.docx
-
Supplementary file 1
Dynamic flexibility index (DFI), dynamic coupling index (DCI), RaptorX, Evcoupling, and MISTIC metrics are used to identify residues in TEM-1 β-lactamase for the four unique categories (Supplementary file 5).
- https://cdn.elifesciences.org/articles/67474/elife-67474-supp1-v1.xlsx
-
Supplementary file 2
Dynamic flexibility index (DFI), dynamic coupling index (DCI), RaptorX, Evcoupling, and MISTIC metrics are used to identify residues in cyanovirin-N (CV-N) for the integrated co-evolution and dynamic coupling (ICDC) categories (Supplementary file 6).
- https://cdn.elifesciences.org/articles/67474/elife-67474-supp2-v1.xlsx
-
Supplementary file 3
The predicted binding affinities of domain B and comparison with experimental isothermal titration calorimetry (ITC) data for wild type, mutDB, and P51G-m4 benchmarking.
- https://cdn.elifesciences.org/articles/67474/elife-67474-supp3-v1.xlsx
-
Supplementary file 4
Binding free energies, enthalpy and entropy values for wild-type cyanovirin-N (CV-N) and its variants calculated with MM-PBSA approach applied on dimannose bound molecular dynamics (MD) simulations.
- https://cdn.elifesciences.org/articles/67474/elife-67474-supp4-v1.xlsx
-
Supplementary file 5
Contains the complete TEM-1 dynamic flexibility index (DFI), dynamic coupling index (DCI), RaptorX, Evcoupling, and MISTIC metric data used in this study.
- https://cdn.elifesciences.org/articles/67474/elife-67474-supp5-v1.xlsx
-
Supplementary file 6
Contains the complete cyanovirin-N (CV-N) dynamic flexibility index (DFI), dynamic coupling index (DCI), RaptorX, Evcoupling, and MISTIC metric data used in this study.
- https://cdn.elifesciences.org/articles/67474/elife-67474-supp6-v1.xlsx
Download links
A two-part list of links to download the article, or parts of the article, in various formats.
Downloads (link to download the article as PDF)
Open citations (links to open the citations from this article in various online reference manager services)
Cite this article (links to download the citations from this article in formats compatible with various reference manager tools)
Design of novel cyanovirin-N variants by modulation of binding dynamics through distal mutations
eLife 11:e67474.
https://doi.org/10.7554/eLife.67474


