High rates of evolution preceded shifts to sex-biased gene expression in Leucadendron, the most sexually dimorphic angiosperms
- Department of Ecology and Evolution, University of Lausanne, Switzerland
- Applied Biodiversity Research Division, South African National Biodiversity Institute, South Africa
Figures
Figure 1

Strong morphological sex differences of the leaves evolved repeatedly in the genus Leucadendron, yet sex-biased expression affects only few genes, and the transcriptomes of males are not similar between species, nor are transcriptomes of females similar between species.
(A) Typical male (left) and female (right) shoot tips of L. rubrum, a wind-pollinated species with strong sexual dimorphism in leaves, stems, and inflorescence. (B) Left: supermatrix species tree; scale bar indicates expected number of substitutions per site. All branches showed full Shimodaira–Hasegawa-like support. Middle: schematic outlines of male (blue) and female (red) leaves, drawn to scale from a single example photograph; background shading indicates lower sexual dimorphism as light grey and higher sexual dimorphism as dark grey, as classified by the data of Tonnabel et al., 2014. Right: bar plots showing the percentage of male-biased (blue) and female-biased (red) genes among all expressed genes.
Figure 2 with 2 supplements
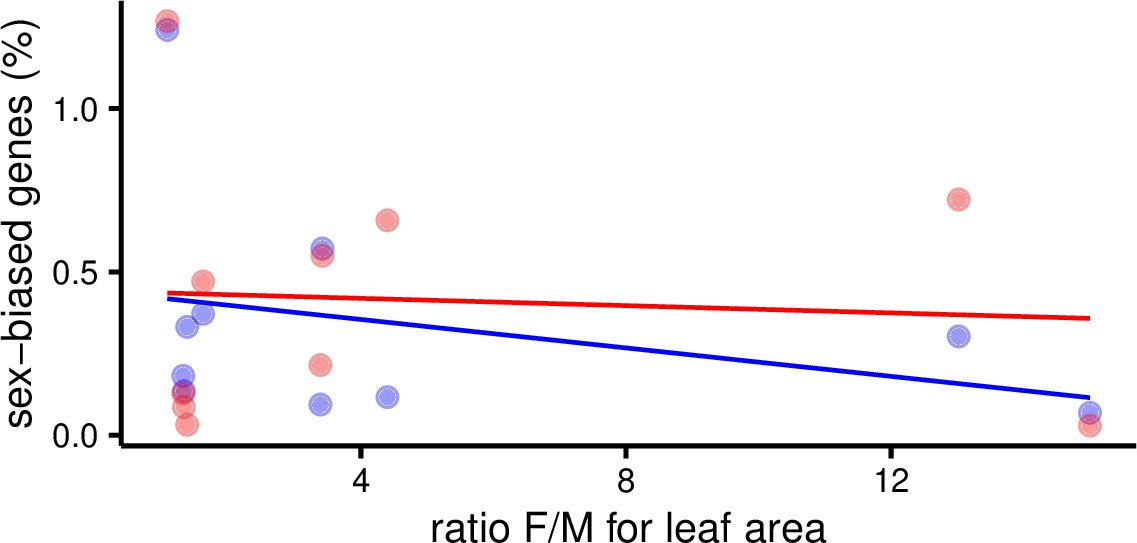
Percent of sex-biased genes in leaves as a function of morphological sexual dimorphism (ratio of female over male leaf area) in 10 species of Leucadendron.
Male-biased expression is in blue, and female-biased expression is in red points resp. lines. The underlying data are found in Supplementary file 1 – Table S3.
Figure 2—figure supplement 1
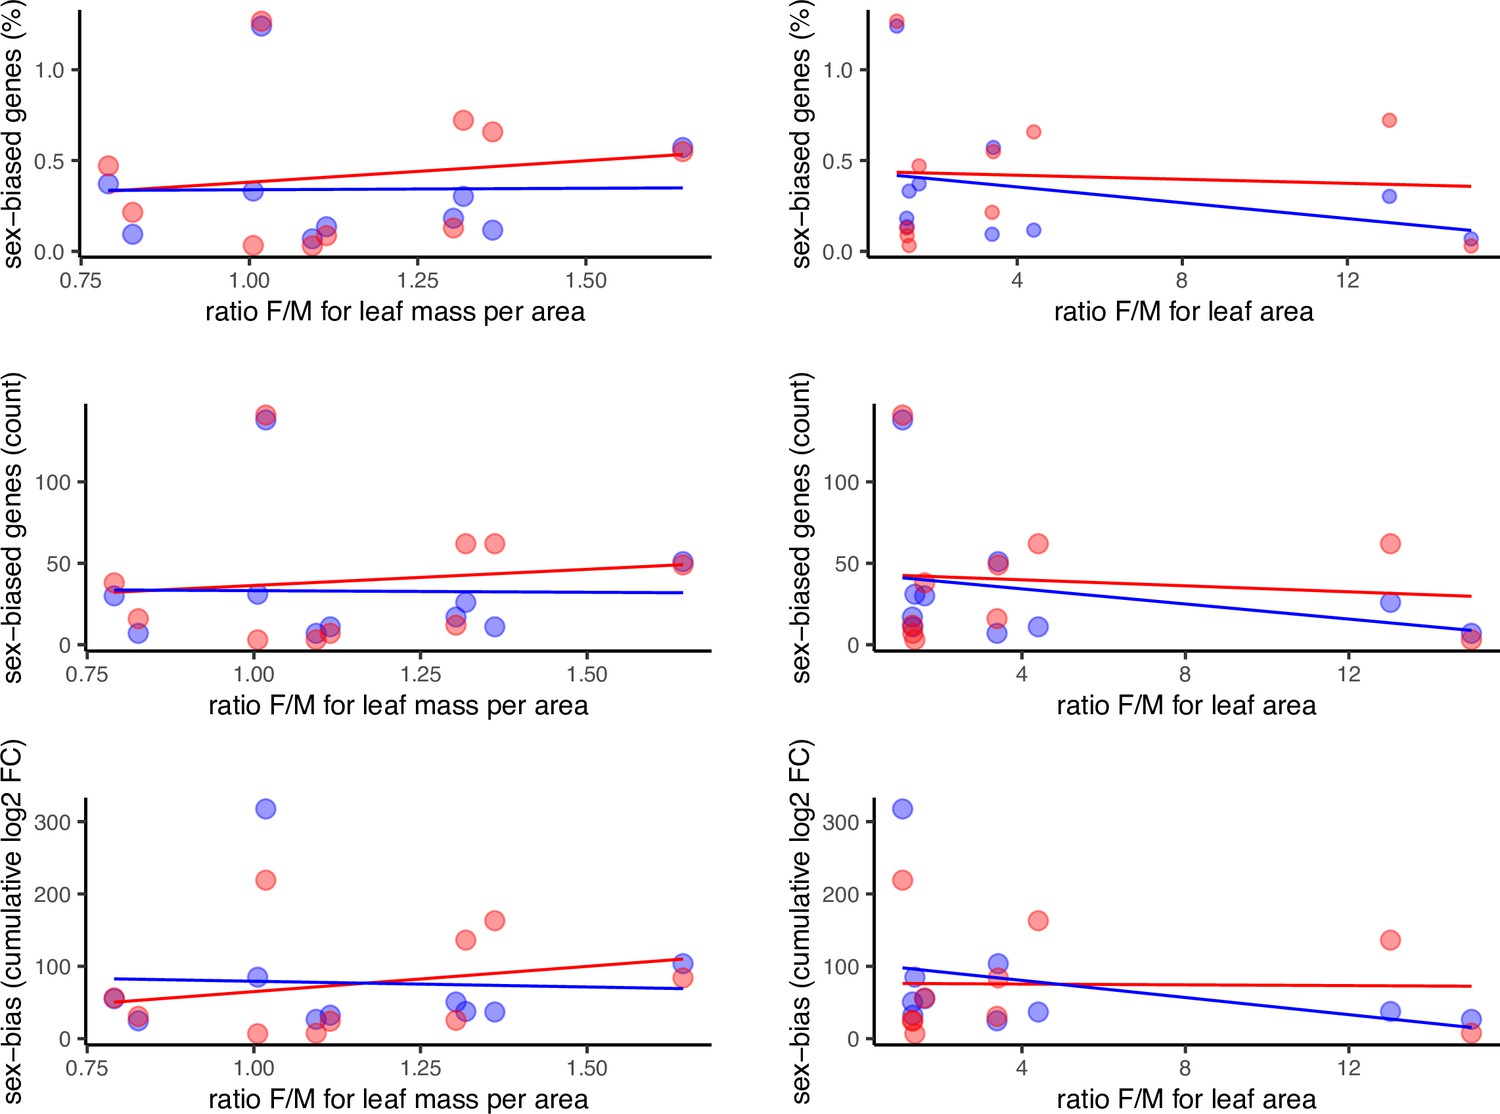
Sex-biased gene expression as a function of morphological sexual dimorphism in the leaves of 10 species of Leucadendron, shown in 6 alternative scatter plots for all combinations of 2 sexual dimorphism measures and 3 statistics of sex-biased gene expression.
Male-biased expression is in blue, and female-biased expression is in red points resp. lines. The underlying data are found in Supplementary file 1 – Table S3.
Figure 2—figure supplement 2
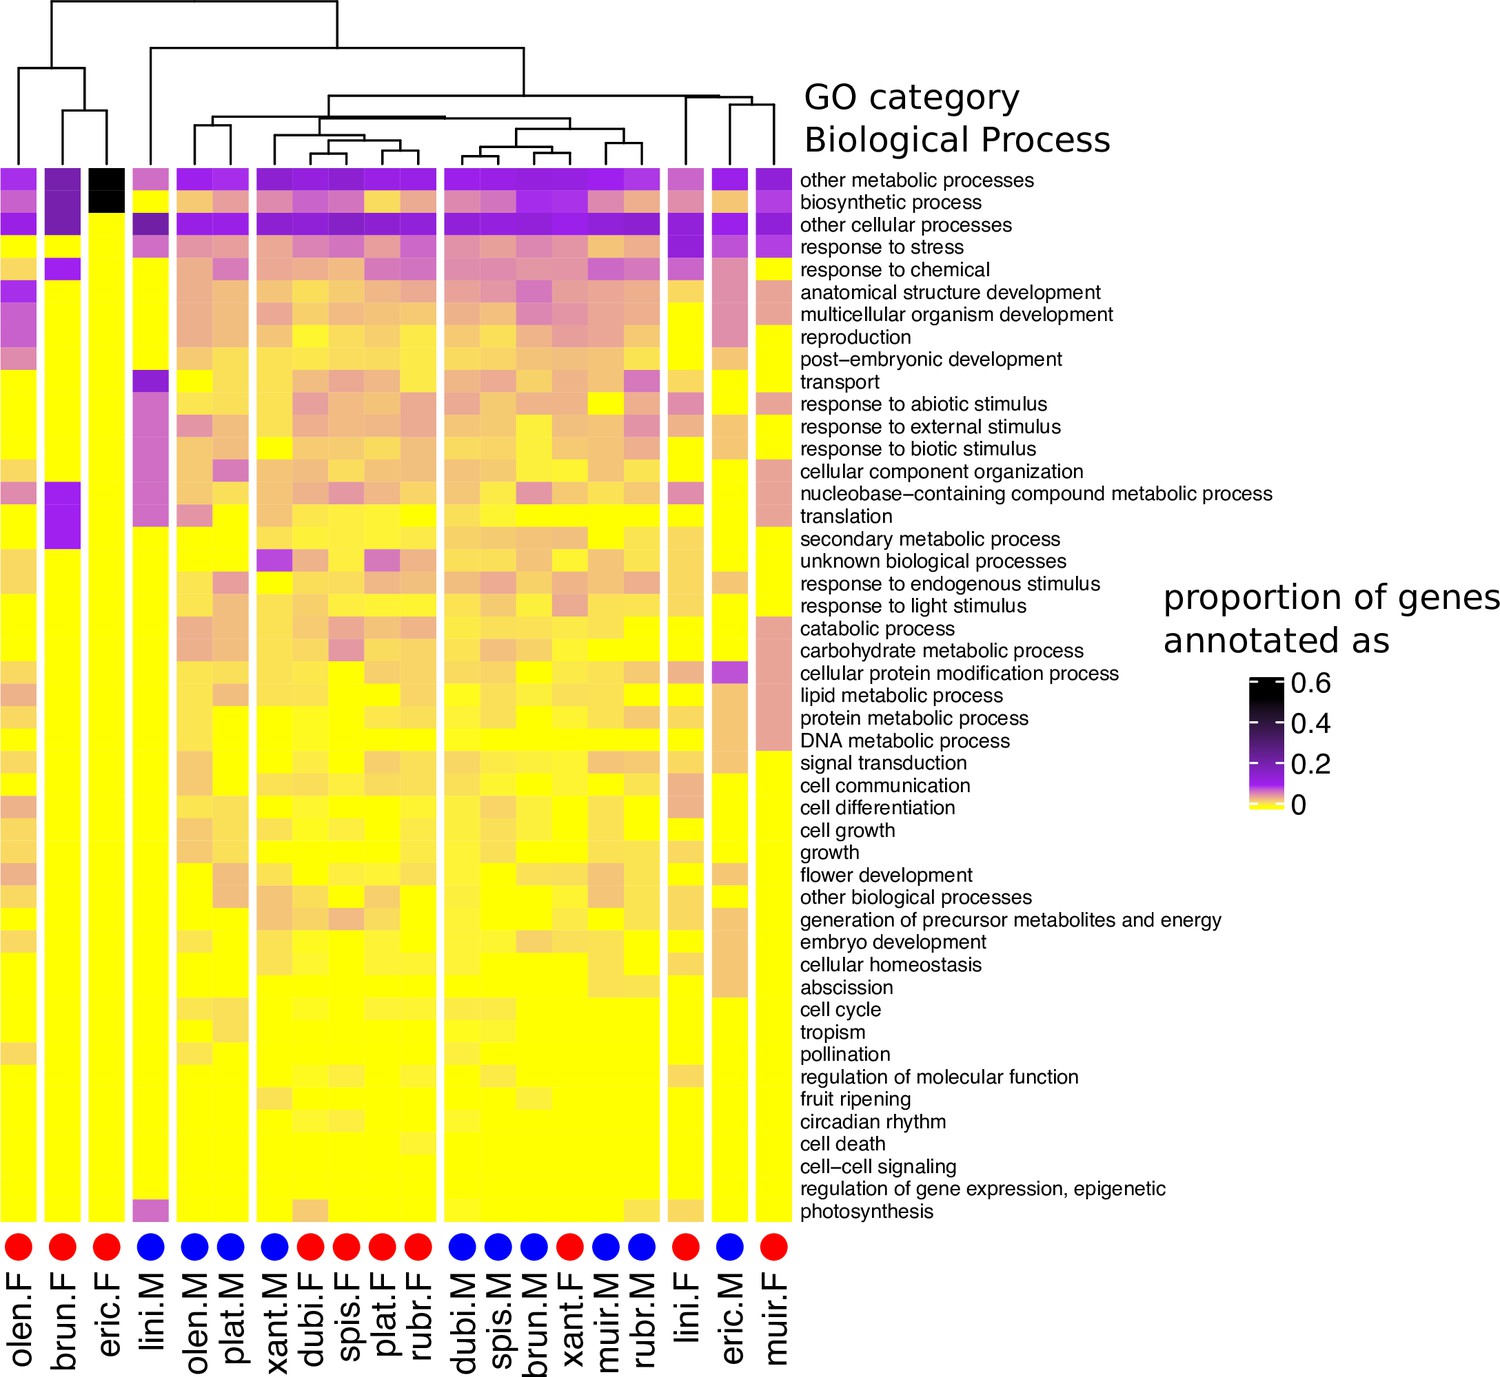
Heatmap and cluster dendrogram for biological processes putatively regulated by sex-biased genes in 10 Leucadendron species.
Values are the proportions of sex-biased genes annotated with a given biological process (functional categorization according to TAIR database). The cluster dendrogram is based on Pearson’s correlation coefficient. Species names are abbreviated as follows: L. brunioides, brun; L. dubium, dubi; L. ericifolium, eric; L. linifolium, lini; L. muirii, muir; L. olens, olen; L. platyspermum, plat; L. rubrum, rubr; L. spissifolium, spis; L. xanthoconus, xant.
Figure 3
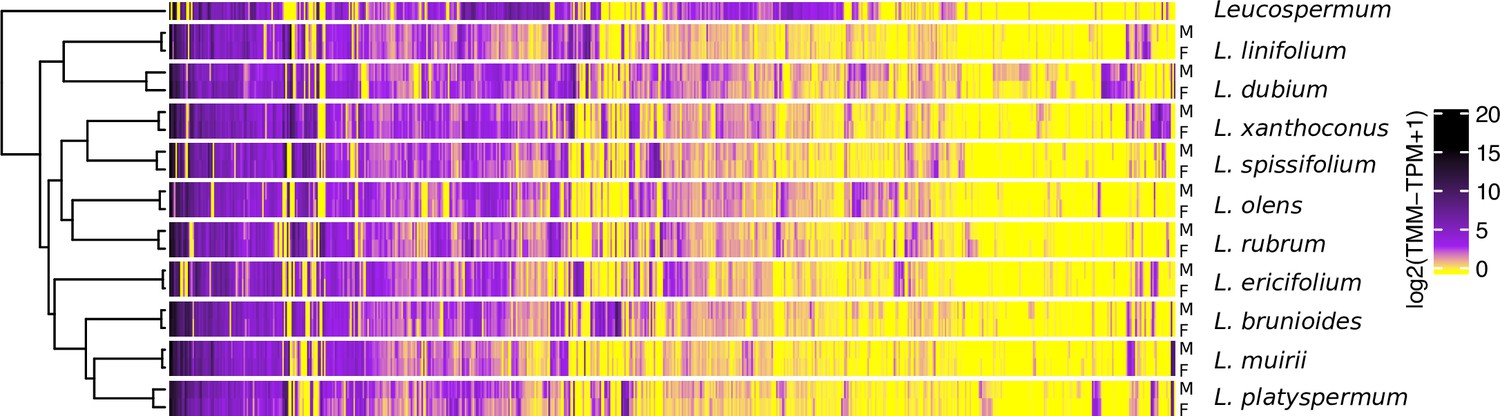
Gene expression heatmap and hierarchical clustering dendrogram for the sexes of 10 Leucadendron species and the hermaphroditic Leucospermum outgroup, for sex-biased genes only (650 genes).
Gene expression values (columns) are the mean log2(TMM − TPM + 1) per species and sex. The clustering of groups (rows) is based on distances calculated as 1 − Pearson’s correlation coefficient.
Figure 4
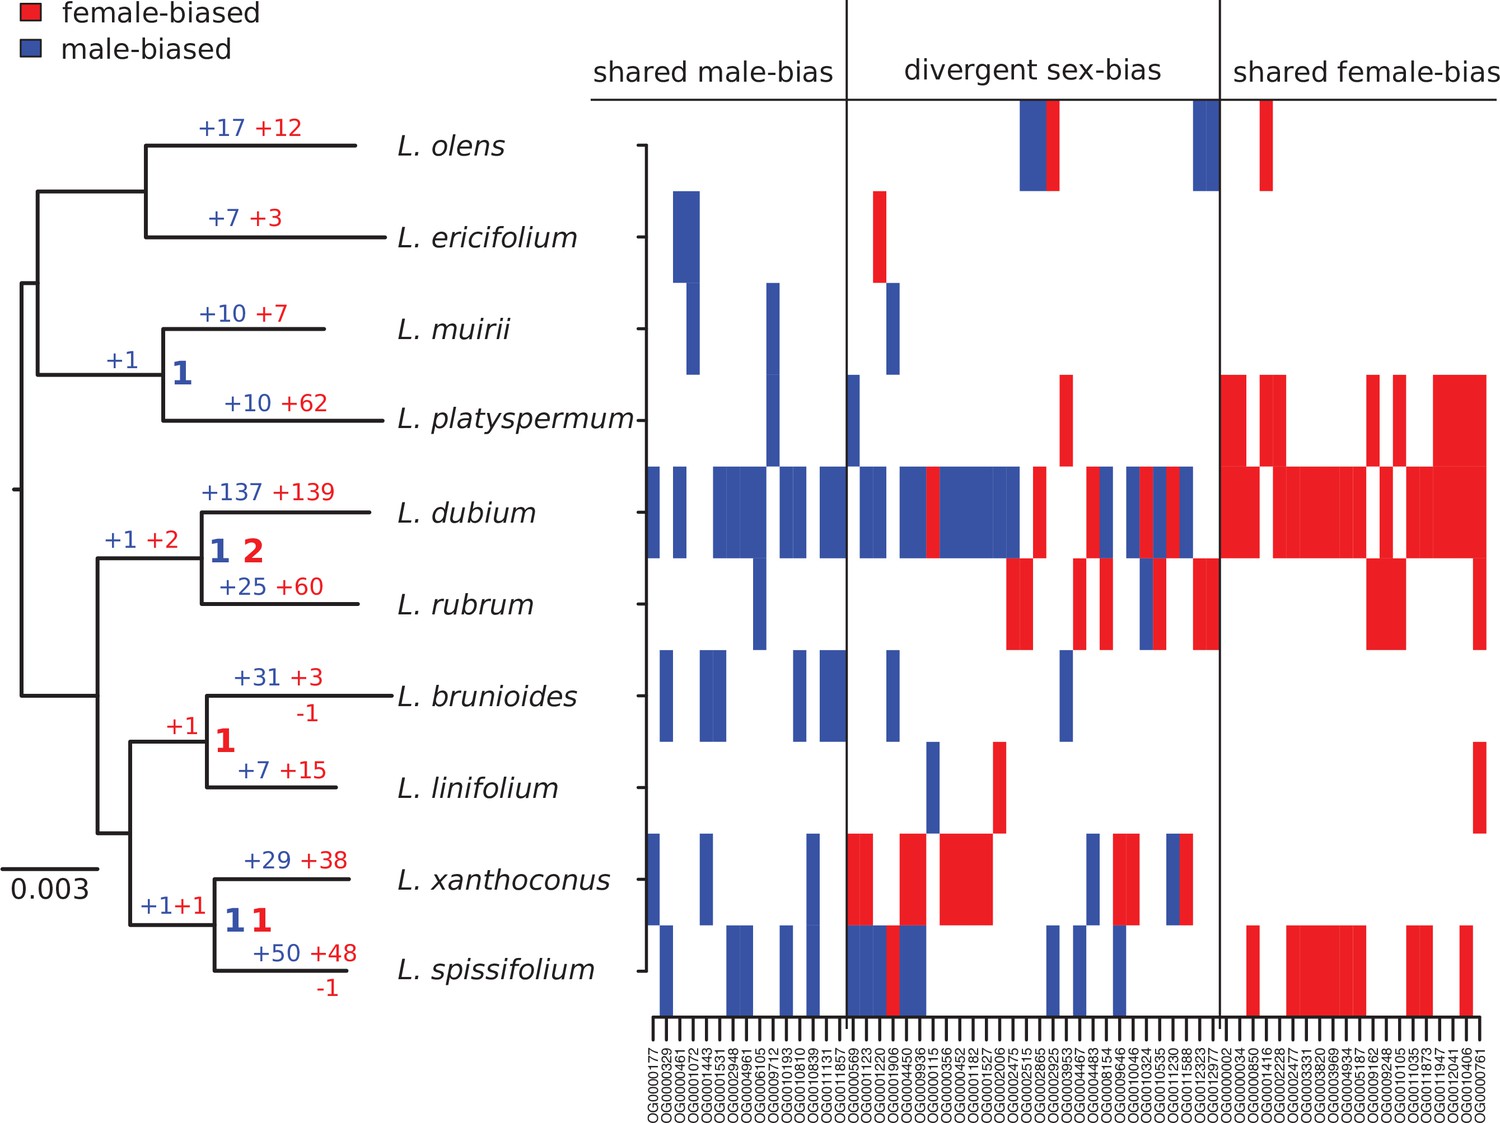
Summary of evolutionary histories inferred for sex-biased gene expression (SBGE) in Leucadendron.
Left: species tree annotated with inferred numbers of sex-biased genes at ancestral nodes (bold), and gains of sex-biased genes annotated on each branch; no losses were inferred. Right: table marking the sex-bias status for the 63 genes that showed sex bias in more than 1 species (either shared bias in the same direction, or divergent sex bias). For details, see Supplementary file 1 – Table S4.
Figure 5 with 1 supplement

Molecular sequence evolution measured as omega (dN/dS) for sex-biased and unbiased genes of Leucadendron.
(A) Omega estimated over the deep evolutionary timescale between Arabidopsis thaliana and the genus Leucadendron. Violin plots (horizontal bar marks the median, dots show the mean) for the three categories of bias status, with different sets of genes in each category. Mean omega was not significantly different between unbiased and either sex-biased category (permutation tests p > 0.05). (B) Omega estimated over the more recent evolutionary timescale between species of Leucadendron. Histograms show pairwise differences in omega for genes observed under both male bias and unbiased (i.e., in different species). The mean difference in omega is indicated by a vertical line, and does not deviate from zero significantly (permutation test, p = 0.8). (C) The same as (B) but for genes observed under both female bias and unbiased, again the mean difference in omega is not deviating from zero (permutation test, p = 0.9).
Figure 5—figure supplement 1
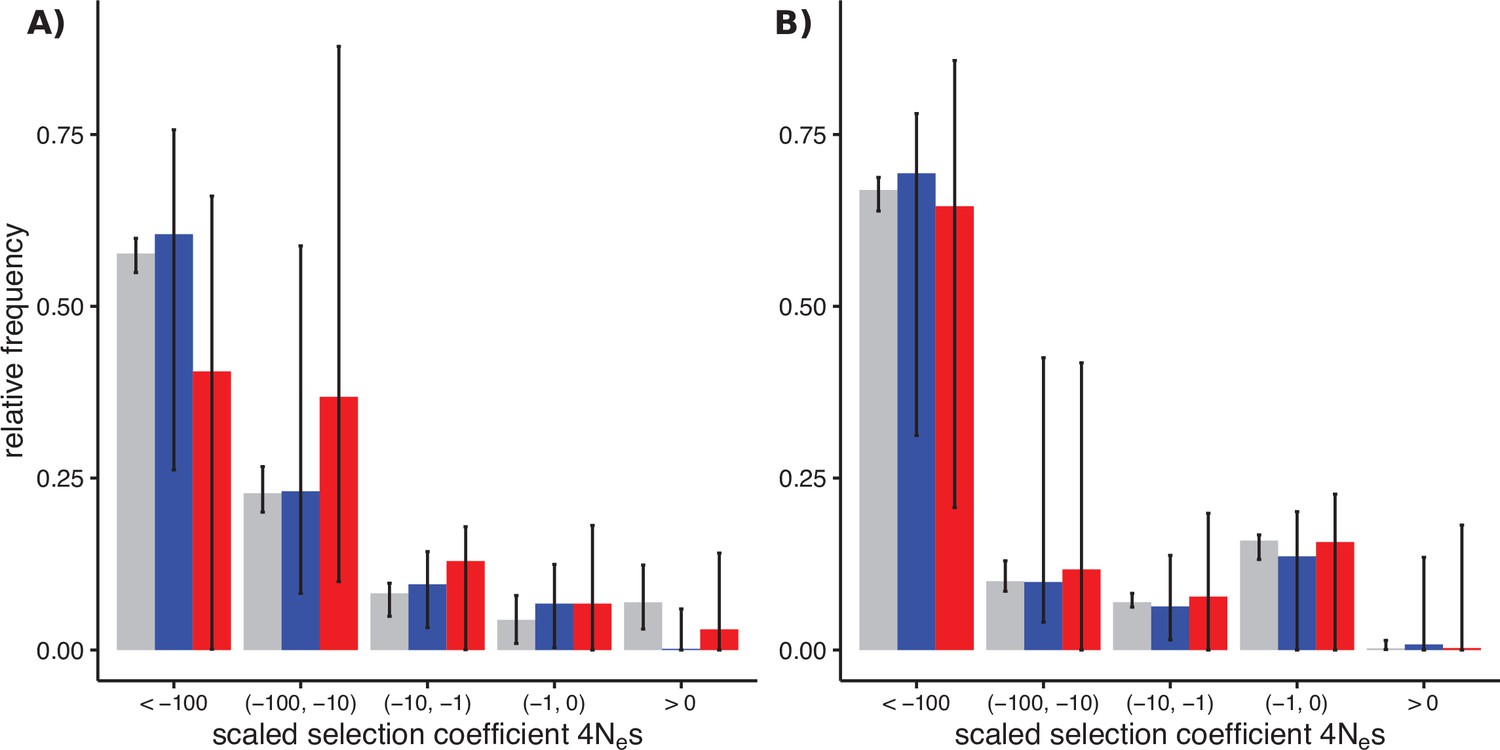
Distributions of fitness effects (DFEs) of sex-biased genes (SBGs; male bias, blue; female bias, red) and unbiased genes (grey) in two Leucadendron populations.
Bars show the Akaike-information criterion (AIC)-weighted point estimates under four different DFE models, and error bars show the 95% confidence intervals of 200 site-level bootstrap replicates, fitted to the four models in proportion of their AIC weight. (A) DFEs in L. dubium. The SBGs shown here were defined by differential gene expression tests in this species. (B) DFEs in the distantly related L. ericifolium. The SBGs shown are those of L. dubium, whereas L. ericifolium itself had almost no SBGs, and none overlapped with L. dubium. The unbiased genes here are largely shared with L. dubium.
Figure 6 with 3 supplements
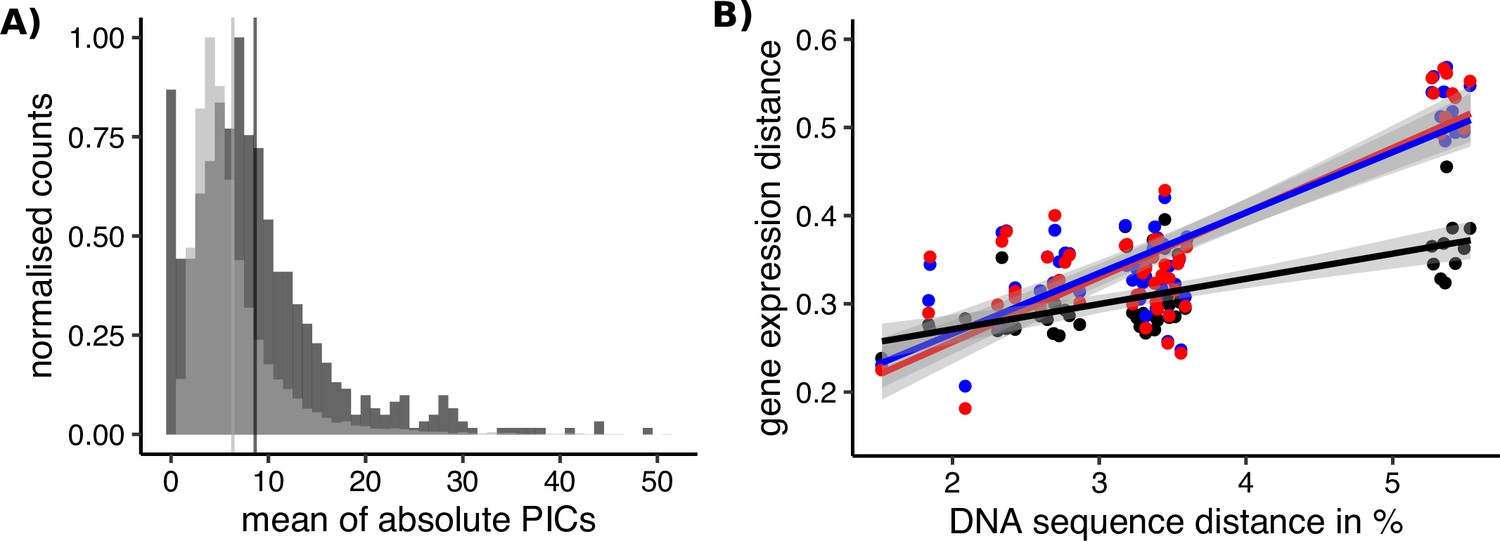
Sex-biased genes in Leucadendron have ancestrally and intrinsically higher rates of expression evolution.
(A) Histograms of mean absolute standardized phylogenetically independent contrasts (PICs) of gene expression for sex-biased (dark grey) and unbiased genes (light grey). The difference in means of the two categories is 2.3 (permutation, p = 2 × 10⁻⁵). Sex-biased expressions themselves were excluded when calculating the PICs. (B) Interspecific gene expression distance as a function of DNA sequence distance for 55 species pairs of dioecious Leucadendron and the hermaphrodite relative Leucospermum. Sex-biased expressions themselves were excluded when calculating gene expression distances. Gene expression distances are shown for three different categories: distance between species (mean over the sexes) for unbiased genes (black points and line), distance between males for sex-biased genes (blue points and line), and distance between females for sex-biased genes (red points and line). DNA distances > 4% pertain to Leucadendron–Leucospermum pairs. The shaded envelopes around linear regression lines represent parameter standard errors. DNA sequence distance was significantly correlated with each of the three categories of gene expression distance (Mantel tests, all p ≤ 0.0225).
Figure 6—figure supplement 1
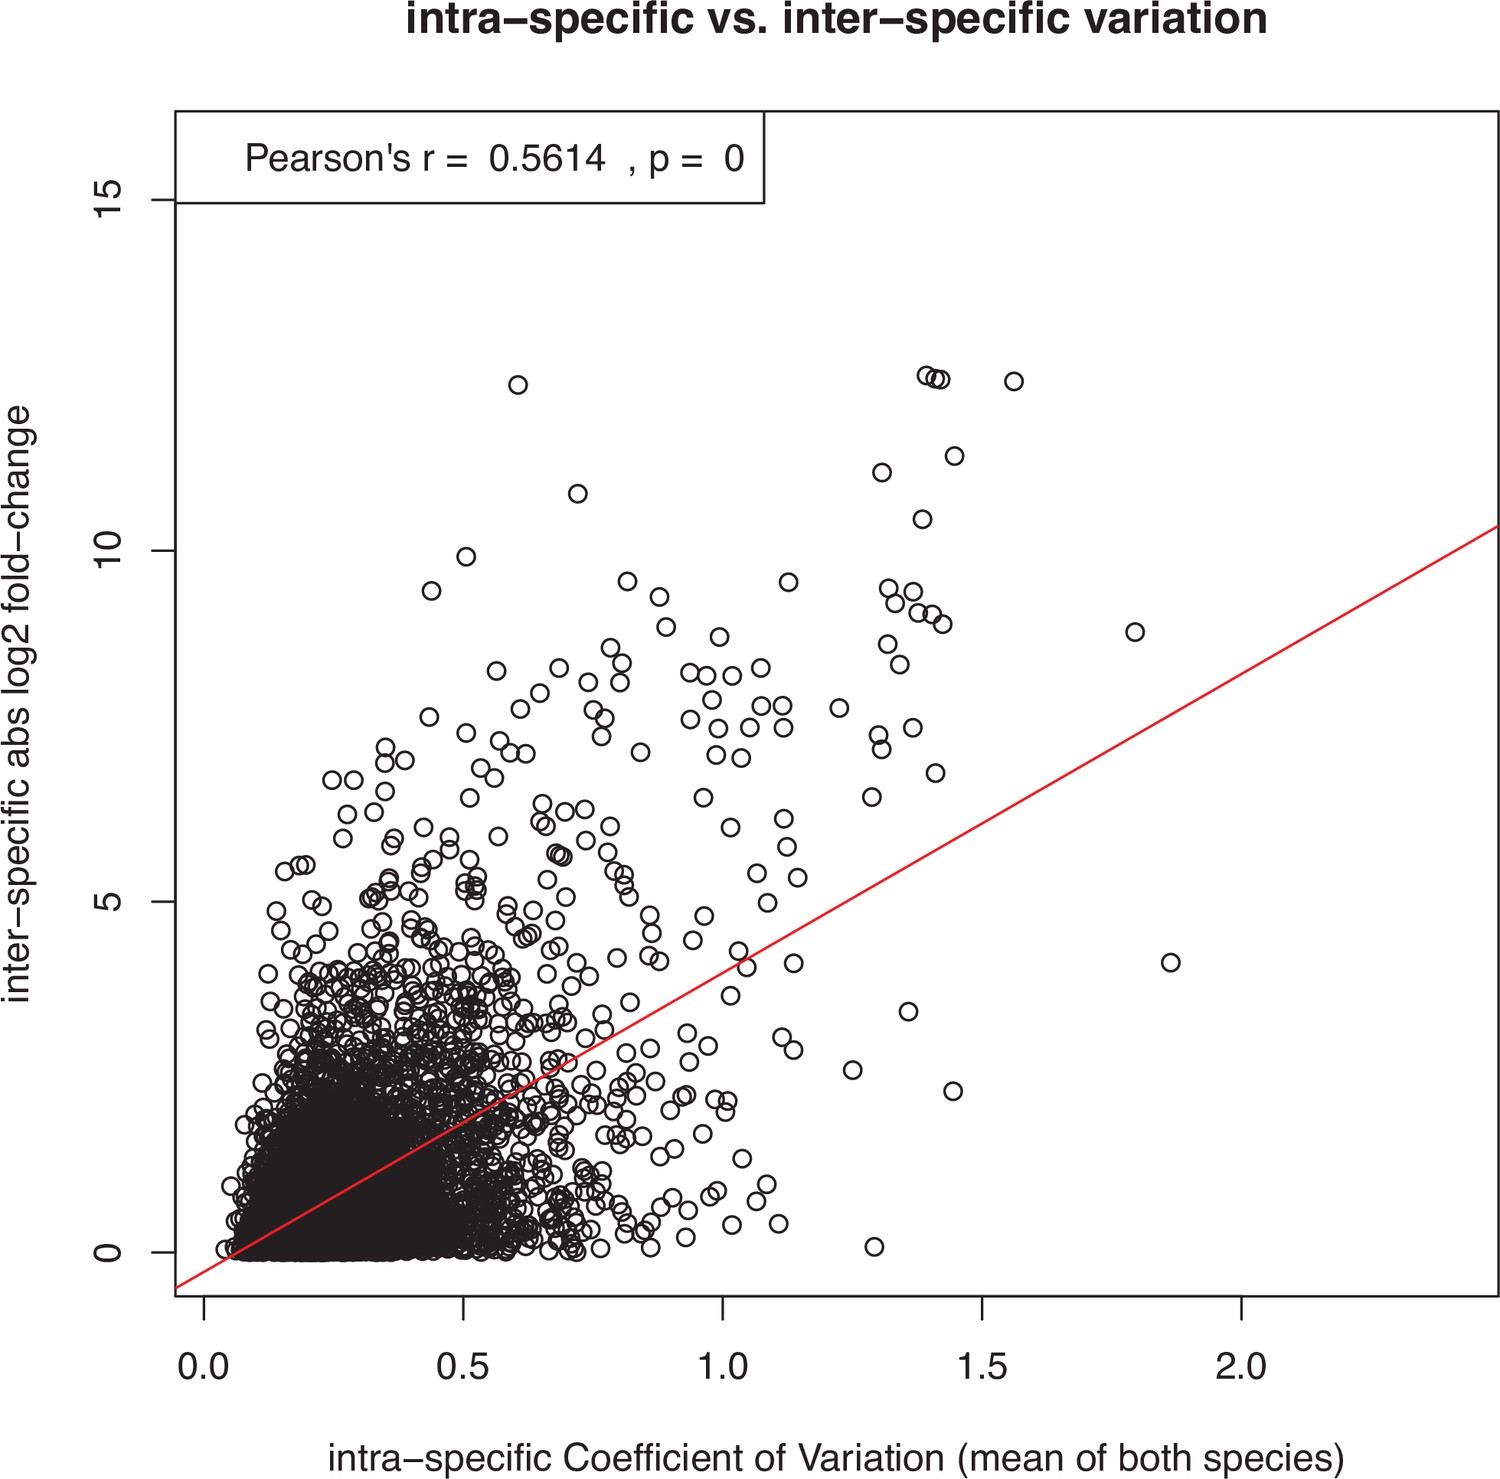
Demonstration that interspecific differences in expression level tend to correlate positively with the level of intraspecific expression variation, posing the risk that genes with noisy expression are mistakenly inferred to have fast rates of expression evolution.
This example scatter plot and correlation test shows all expressed genes in the species pair L. rubrum and L. dubium. The x-axis shows the intraspecific coefficient of variation over all 12 replicates per species, averaged over both species. The y-axis shows the interspecific log2 fold-change between the mean expression levels of the two species. Similar results were obtained for all other pairs of species and also with entirely artificial, randomly simulated data (not shown). However, as described in the main text and shown in Supplementary files 1 and 2, this trend did not confound the inference of faster expression evolution for sex-biased genes in this study, because sex-biased genes showed low expression noise (i.e., expression variation within sexes).
Figure 6—figure supplement 2
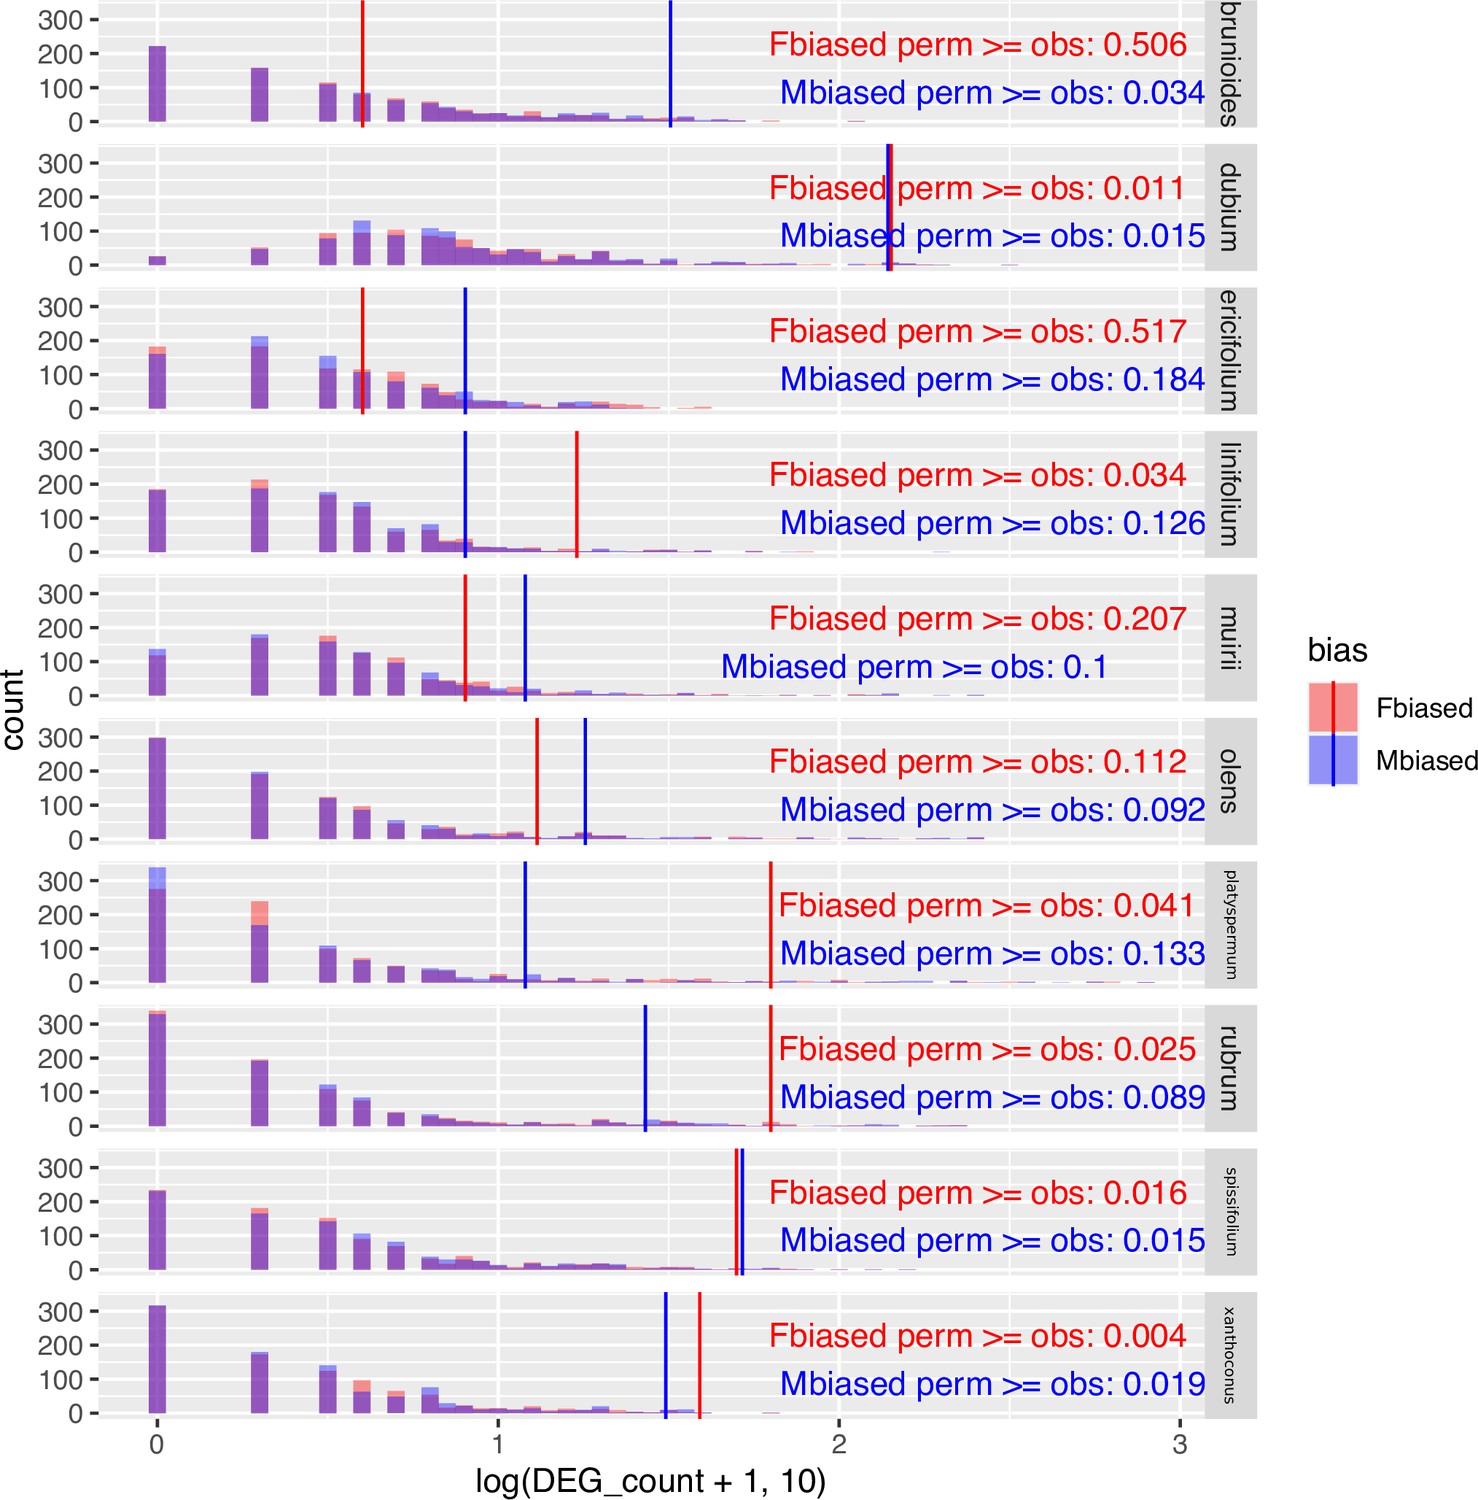
Challenging the inference of sex-biased genes by repeated permutation of the sexes.
In most species and sexes, observed counts of sex-biased genes are significantly greater than counts from permuted datasets, indicating that the observed sex-biased genes are unlikely to represent stochastic artefacts. 'Fbiased' refers to the number of female-biased genes, and 'Mbiased' denotes the number of male-biased genes. 'perm' stands for permutated datasets (light coloured bars in histograms), whereas 'obs' stands for the observed result from the unpermutated data (solid vertical lines). Sex-biased genes are defined under the conventional thresholds of 5% FDR and two-fold change between the sexes.
Figure 6—figure supplement 3
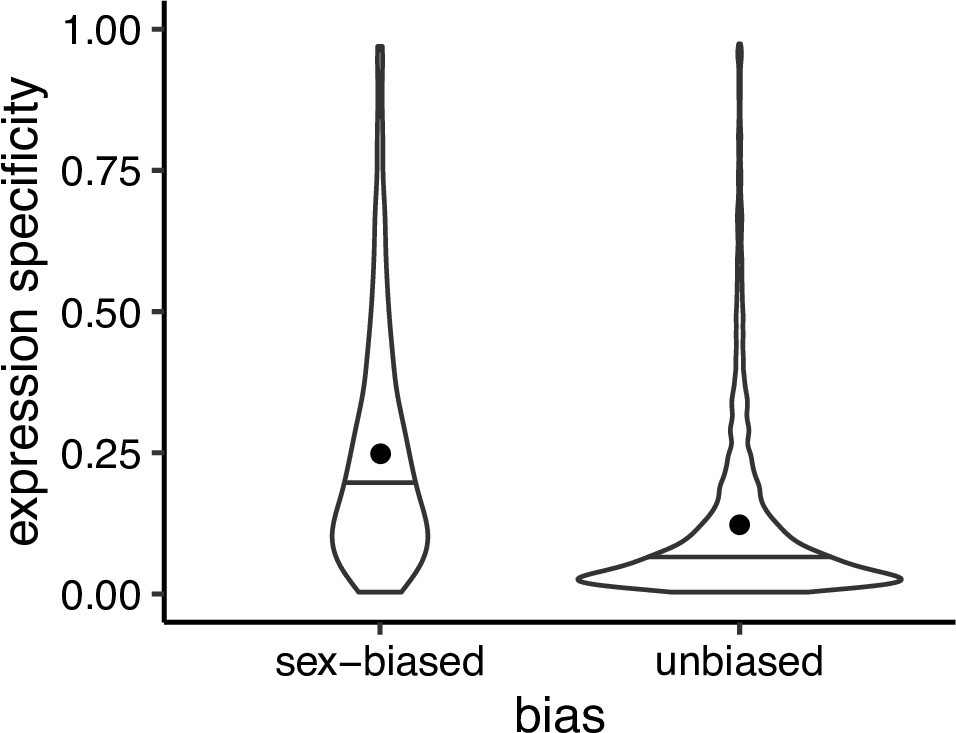
Expression specificity (Shannon entropy) over different tissues and developmental stages for sex biased and unbiased genes in Leucadendron, using gene expression specificity data of homologous Arabidopsis thaliana genes (Klepikova et al., 2016).
Violins show the complete distributions, horizontal bars indicate the medians and dots the means. The difference of the means is 0.095 (permutation, p = 2 × 10⁻⁵).
Tables
Table 1
Summary of inferred evolutionary histories for 650 sex-biased genes in Leucadendron.
Permutations were used to generate numbers of genes in each category expected under the null hypothesis that the identity of sex-biased genes (SBGs) is random within each species, excluding the three genes that gained sex bias only ancestrally. All observed counts were significantly different from the null. The phylogenetic patterns of shared and divergent sex-biased gene expression (SBGE) are shown in Figure 3.
| Category of sex bias | Observed | Mean of expected | p value (one-sided) |
|---|---|---|---|
| Uniquely male biased, gained at tip | 265 | 312 | <1 × 10⁻⁵ |
| Uniquely female biased, gained at tip | 322 | 377.5 | <1 × 10⁻⁵ |
| Shared male biased, single ancestral gain | 3 | NA | NA |
| Shared female biased, single ancestral gain | 1 | NA | NA |
| Shared male biased, repeatedly gained (ancestral and/or tip) | 12 | 2.4 | <1 × 10⁻⁵ |
| Shared female biased, repeatedly gained (ancestral and/or tip) | 19 | 3.7 | <1 × 10⁻⁵ |
| Divergent sex biased (gains ancestral and/or tip) | 28 | 6.1 | <1 × 10⁻⁵ |
Table 2
Counts and chi-squared tests for shifts in gene expression in 10 Leucadendron spp. as classified by an index of selection and by sex bias.
Shifts are defined as differences of 1.5-fold or greater in mean expression between sister species. Delta-x, an index of selection, is the ratio of absolute difference in expression between sister species to the standard deviation of expression in a focal species. Shifts in the category ‘high delta-x’ (here set to 5.0 and greater) are more consistent with directional selection (adaptation) than ‘low delta-x’ shifts.
| Male expression shifts | Female expression shifts | ||||
|---|---|---|---|---|---|
| Sex biased | Unbiased | Sex biased | Unbiased | ||
| Observed | High delta-x | 103 | 22,349 | 100 | 21,639 |
| Low delta-x | 394 | 34,002 | 373 | 36,412 | |
| Chi-squared expectations | High delta-x | 196.3 | 22,255.7 | 175.7 | 21,563.3 |
| Low delta-x | 300.7 | 34,095.3 | 297.3 | 36,487.7 | |
| Chi-squared Yates, df = 1 | 73.134 | 51.622 | |||
| p | <2.2 × 10⁻¹⁶ | 6.73 × 10⁻¹³ | |||
Appendix 1—table 1
Overview of key results under three thresholds for defining sex-biased expression: stringent (0.1% FDR, minimum threefold change), conventional (5% FDR, minimum twofold change), and permissive (uncorrected p ≤ 5%, no minimum fold-change).
Statistically non-significant results are labelled as n.s. Results that are not completely consistent are shaded in grey. Subdirectory refers to the Supporting Documents at https://doi.org/10.5061/dryad.jsxksn0b4 .
| Result | Stringent | Conventional | Permissive | Subdirectory |
|---|---|---|---|---|
| Total number of SBGs | 89 | 650 | 1973 | SD_01 |
| Minimum number of SBGs per species | L. ericifolium (two genes, 0.02%) | L. ericifolium (10 genes, 0.1%) | L. ericifolium (358 genes, 3.5%) | SD_01 |
| Maximum number of SBGs per species | L. dubium (27 genes, 0.24%) | L. dubium (279 genes, 2.5%) | L. dubium (1669 genes, 15%) | SD_01 |
| Correlation between leaf dimorphism and male-biased proportion | Weak negative correlation with the ratio of leaf areas | Weak negative correlation with the ratio of leaf areas | Weak negative correlation with the ratio of leaf areas | SD_02 |
| Correlation between leaf dimorphism and female-biased proportion | n.s. | n.s. | n.s. | SD_02 |
| Hierarchical clustering by expression values of SBGs | Cluster by species, not by sex | Cluster by species, not by sex | Cluster by species, not by sex | SD_03 |
| Count (percentage) of SBGs shared by two or more species | 3 (3.4%) | 63 (9.7%) | 373 (18.9%) | SD_04 |
| Count of genes with inferred ancestral sex bias | 0 | 4 | 8 | SD_04 |
| Count of genes with inferred repeated evolution to SBGE | 3 | 59 | 365 | SD_04 |
| dN/dS of SBGs versus unbiased genes: Arabidopsis–Leucadendron | Difference of averages n.s. | Difference of averages n.s. | Female-biased genes show higher average dN/dS | SD_05 |
| dN/dS within Leucadendron: paired test of the same genes with and without sex-biased expression | On average, no difference | On average, no difference | On average, no difference | SD_05 |
| Rates of expression evolution: PICs | Elevated for SBGs | Elevated for SBGs | Elevated for SBGs | SD_06 |
| Rates of expression evolution: slope of expression distance versus sequence divergence | Slopes of SBGs and unbiased genes are similar | Elevated for SBGs | Elevated for SBGs | SD_07 |
| Expression specificity over tissues and developmental stages | Elevated for SBGs | Elevated for SBGs | Elevated for SBGs | SD_08 |
| Signatures of adaptation of expression level (shift threshold = 1.5-fold, high delta-x: delta-x ≥ 5) | Depleted in shifts to M bias, n.s. for shifts to F bias | Depleted in shifts to SBGE | Depleted in shifts to SBGE | SD_09 |
Appendix 2—table 1
Conclusions for the proportion of adaptive shifts in gene expression (delta-x) in shifts to sex bias and unbiased shifts under varying thresholds.
Results that are not completely consistent with the main text choice of threshold are shaded in grey. The columns ‘stringent’, ‘conventional’, and ‘permissive’ refer to the DGE thresholds for defining genes as sex biased (see Appendix 1). Data and code supporting this table is found in subdirectory ‘SD_09’ of the Supporting Documents at https://doi.org/10.5061/dryad.jsxksn0b4 .
| Shift and delta-x thresholds | Stringent | Conventional | Permissive |
|---|---|---|---|
| Shift threshold = 1.5-fold, high delta-x: delta-x ≥ 1.5 | Adaptations depleted in shifts to M bias, n.s. for shifts to F bias | Adaptations depleted in shifts to SBGE | Adaptations depleted in shifts to SBGE |
| Shift threshold = 1.5-fold, high delta-x: delta-x ≥ 5 | Adaptations depleted in shifts to M bias, n.s. for shifts to F bias | Adaptations depleted in shifts to SBGE | Adaptations depleted in shifts to SBGE |
| Shift threshold = 1.5-fold, high delta-x: delta-x ≥ 10 | Adaptations depleted in shifts to SBGE | Adaptations depleted in shifts to SBGE | Adaptations depleted in shifts to SBGE |
| Shift threshold = 3-fold, high delta-x: delta-x ≥ 1.5 | Adaptations depleted in shifts to M bias, n.s. for shifts to F bias | Adaptations depleted in shifts to SBGE | Adaptations depleted in shifts to SBGE |
| Shift threshold = 3-fold, high delta-x: delta-x ≥ 5 | Adaptations depleted in shifts to SBGE | Adaptations depleted in shifts to SBGE | Adaptations depleted in shifts to SBGE |
| Shift threshold = 3-fold, high delta-x: delta-x ≥ 10 | Adaptations depleted in shifts to SBGE | Adaptations depleted in shifts to SBGE | Adaptations depleted in shifts to SBGE |
Appendix 2—table 2
Partitioning gene expression shifts into decreases and increases in either of the sexes shows a consistent trend of depletion of high-delta-x values in shifts towards sex-biased expression as compared to unbiased shifts.
| Observed counts | ||||||
|---|---|---|---|---|---|---|
| Type of expr. change | Sex biased | Unbiased | Obs – exp for shifts to sex bias with high delta-x | Chi-squared statistic | p value | |
| Expression decrease in females | High delta-x | 30 | 14,416 | −41.2 | 43.977 | 3.322E−11 |
| Low delta-x | 122 | 16,273 | ||||
| Expression increase in females | High delta-x | 70 | 7223 | −14.6 | 3.2139 | 0.07302 |
| Low delta-x | 251 | 20,139 | ||||
| Expression decrease in males | High delta-x | 33 | 13,999 | −46.1 | 55.116 | 1.14E−13 |
| Low delta-x | 119 | 12,814 | ||||
| Expression increase in males | High delta-x | 70 | 8350 | −27.2 | 10.337 | 0.001304 |
| Low delta-x | 275 | 21,188 | ||||
Additional files
-
Supplementary file 1
Supplementary Tables S1 to S8.
- https://cdn.elifesciences.org/articles/67485/elife-67485-supp1-v2.xlsx
-
Supplementary file 2
Plots showing comparisons of coefficient of variation per sex for sex-biased and unbiased genes, separately for each Leucadendron species.
- https://cdn.elifesciences.org/articles/67485/elife-67485-supp2-v2.pdf
-
Supplementary file 3
Plots showing comparisons of linear model coefficients for gene expression distance between species as a function of sequence divergence between species, for sex-biased genes and unbiased genes.
Shown are the observed intercept and slope estimates, together with histograms of the same estimates for 1000 datasets in which the actual sex-biased genes were replaced by an equal number of unbiased genes that are matched to the expression noise level of sex-biased genes (i.e., within 95%–105% of their coefficient of variation in expression over all species and sexes).
- https://cdn.elifesciences.org/articles/67485/elife-67485-supp3-v2.pdf
-
Transparent reporting form
- https://cdn.elifesciences.org/articles/67485/elife-67485-transrepform1-v2.pdf
Download links
A two-part list of links to download the article, or parts of the article, in various formats.
Downloads (link to download the article as PDF)
Open citations (links to open the citations from this article in various online reference manager services)
Cite this article (links to download the citations from this article in formats compatible with various reference manager tools)
High rates of evolution preceded shifts to sex-biased gene expression in Leucadendron, the most sexually dimorphic angiosperms
eLife 10:e67485.
https://doi.org/10.7554/eLife.67485


