Recapitulating human cardio-pulmonary co-development using simultaneous multilineage differentiation of pluripotent stem cells
- Department of Biomedical Engineering, Carnegie Mellon University, United States
- Advanced Medical and Dental Institute, Universiti Sains Malaysia, Malaysia
- Department of Materials Science and Engineering, Carnegie Mellon University, United States
- Center for Biologic Imaging, University of Pittsburgh, United States
- Center for Regenerative Medicine of Boston University and Boston Medical Center, United States
Figures
Figure 1 with 1 supplement
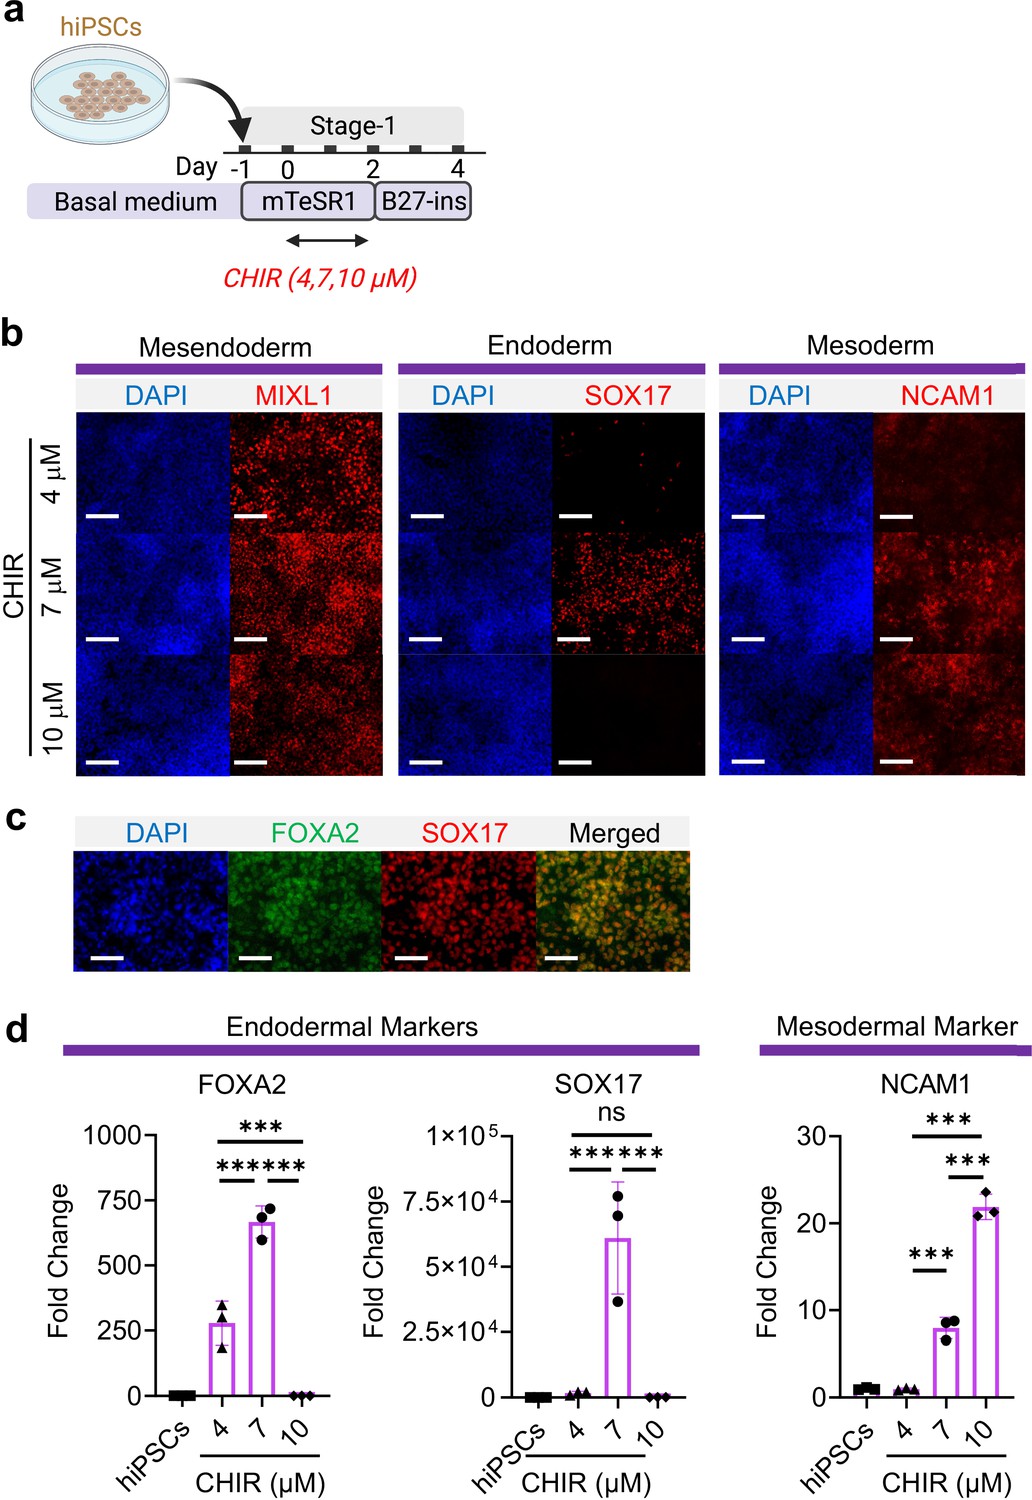
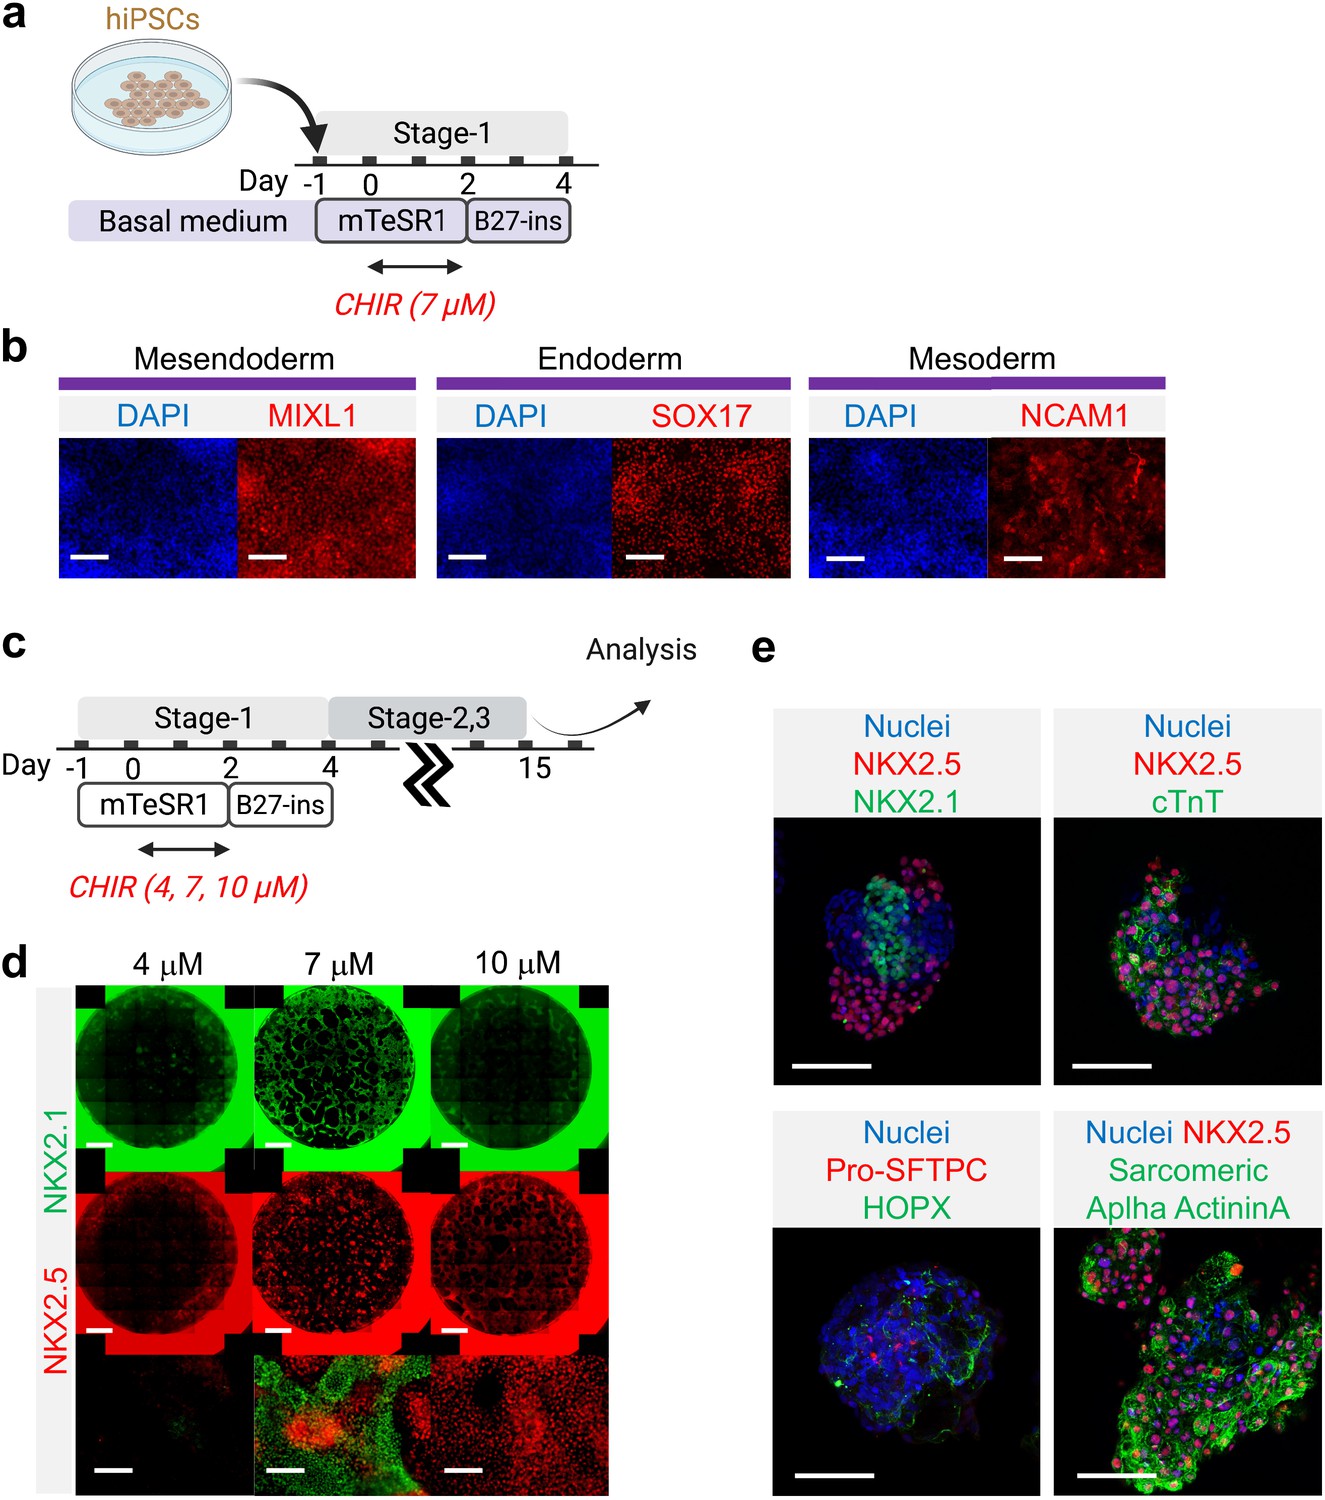
Mesoderm and endoderm co-induction from hiPSCs using CHIR.
(a) Diagram showing the experimental design (b) Cells following Stage-1 differentiation expressed MIXL1 (Mesendodermal lineage), SOX17 (definitive endoderm), and NCAM1 (mesoderm). Scale bar = 125 μm. (c) Majority of SOX17 cells were also FOXA2+. Scale bar = 62.5 μm. (d) Fold change of hiPSCs for FOXA2 (n = 3 each; 4 vs 7, p < 0.001; 7 vs 10, p < 0.001; 4 vs 10, p < 0.001), SOX17 (n = 3 each; 4 vs 7, p < 0.001; 7 vs 10, p < 0.001; 4 vs 10, p = 0.9978) and NCAM1 (n = 3 each; 4 vs 7, p < 0.001; 7 vs 10, p < 0.001; 4 vs 10, p < 0.001). All data are mean ± SD. *p < 0.05; **p < 0.01; ***p < 0.001. ‘n’ refers to biological replicates. Diagram created using BioRender (http://biorender.com/).
-
Figure 1—source data 1
Raw data for Figure 1d.
- https://cdn.elifesciences.org/articles/67872/elife-67872-fig1-data1-v2.xlsx
Figure 1—figure supplement 1
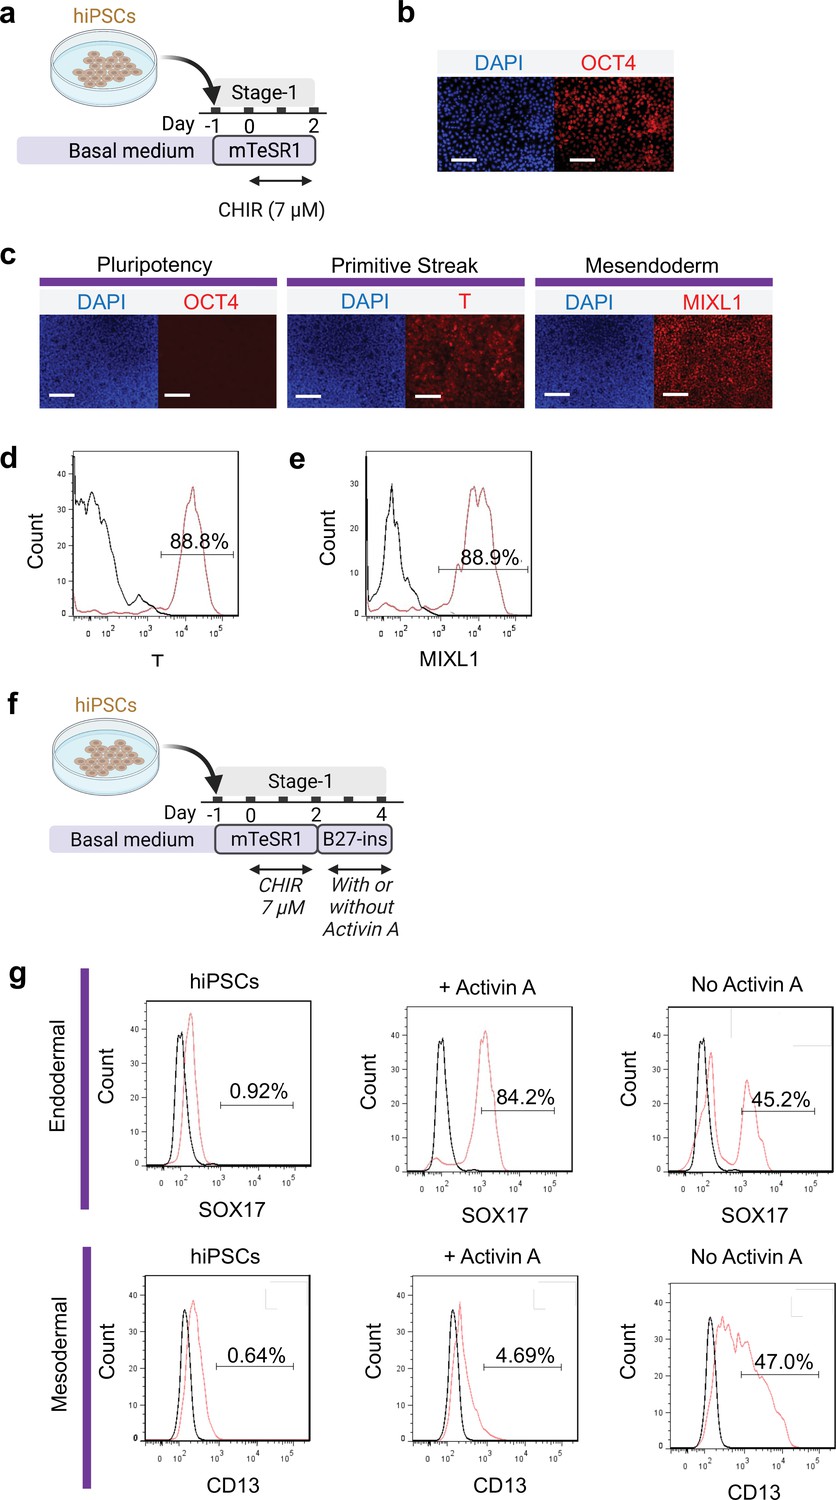
Primitive streak induction from hiPSCs using CHIR.
(a) Diagram showing the experimental design. (b) Pluripotent marker (OCT4) expression on hiPSCs prior to induction with CHIR. (c) Cells following 48 hr CHIR treatment expressed T (primitive streak), MIXL1 (Mesendodermal lineage) but not pluripotent (OCT4) marker. FACS analysis of cells for (d) T and (e) MIXL1. (f) Schematic diagram showing the experimental design for flow cytometry analysis at the end of Stage-2 co-differentiation. (g) Flow cytometry analysis of endoderm marker (SOX17) and mesodermal marker (CD13) on hiPSCs, cells differentiated from standard protocol with or without Activin A. Scale bar = 125 μm for 20 X images. Diagram created using BioRender (http://biorender.com/).
Figure 2 with 1 supplement
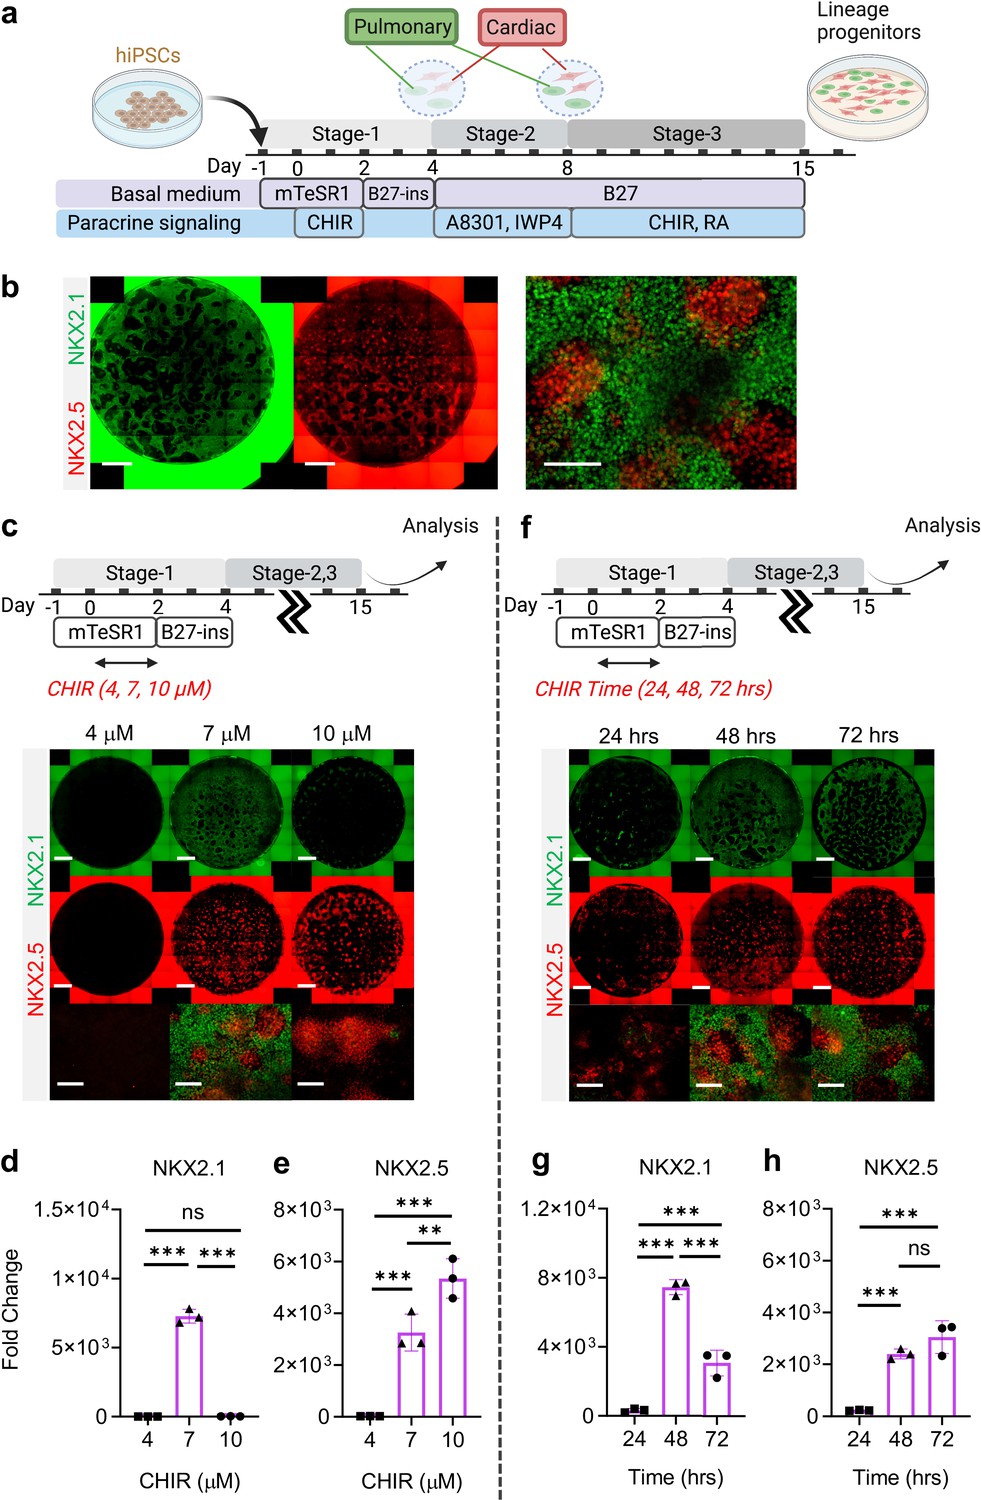
Stepwise cardio-pulmonary co-differentiation from hiPSCs using chemical defined, growth factor-free protocol.
(a) Schematic diagram showing the overall differentiation strategy. (b) Immunofluorescence (IF) showing staining of lung (NKX2.1+) and cardiac (NKX2.5+). (c) IF (d,e) and quantitative PCR (qPCR) analysis of the induction of lung and cardiac progenitors on Day-15 of differentiation. (c–e) The effects of different CHIR concentrations during Stage-1 of differentiation. Fold change over hiPSCs (d) NKX2.1 (n = 3 each; 4 vs 7, p < 0.001; 7 vs 10, p < 0.001; 4 vs 10, p = 0.9993) and (e) NKX2.5 (n = 3 each; 4 vs 7, p< 0.001; 7 vs 10, p = 0.0053; 4 vs 10, p < 0.001). (f–h) The effects of different exposure time of CHIR (7 µM) treatment during the first 2 days of differentiation. qPCR analysis of (g) NKX2.1 (n = 3 each; 24 vs 48, p < 0.001; 48 vs 72, p < 0.001; 24 vs 72, p < 0.001) and (h) NKX2.5 (n = 3 each; 24 vs 48, p < 0.001; 48 vs 72, p = 0.1503; 24 vs 72, p < 0.001). Scale bar = 500 μm for whole well scan; Scale bar = 125 μm for 20 X images. All data are mean ± SD. *p < 0.05; **p < 0.01; ***p < 0.001. ‘n’ refers to biological replicates. Diagram created using BioRender (http://biorender.com/).
-
Figure 2—source data 1
Raw data for Figure 2d, e, g and h.
- https://cdn.elifesciences.org/articles/67872/elife-67872-fig2-data1-v2.xlsx
Figure 2—figure supplement 1
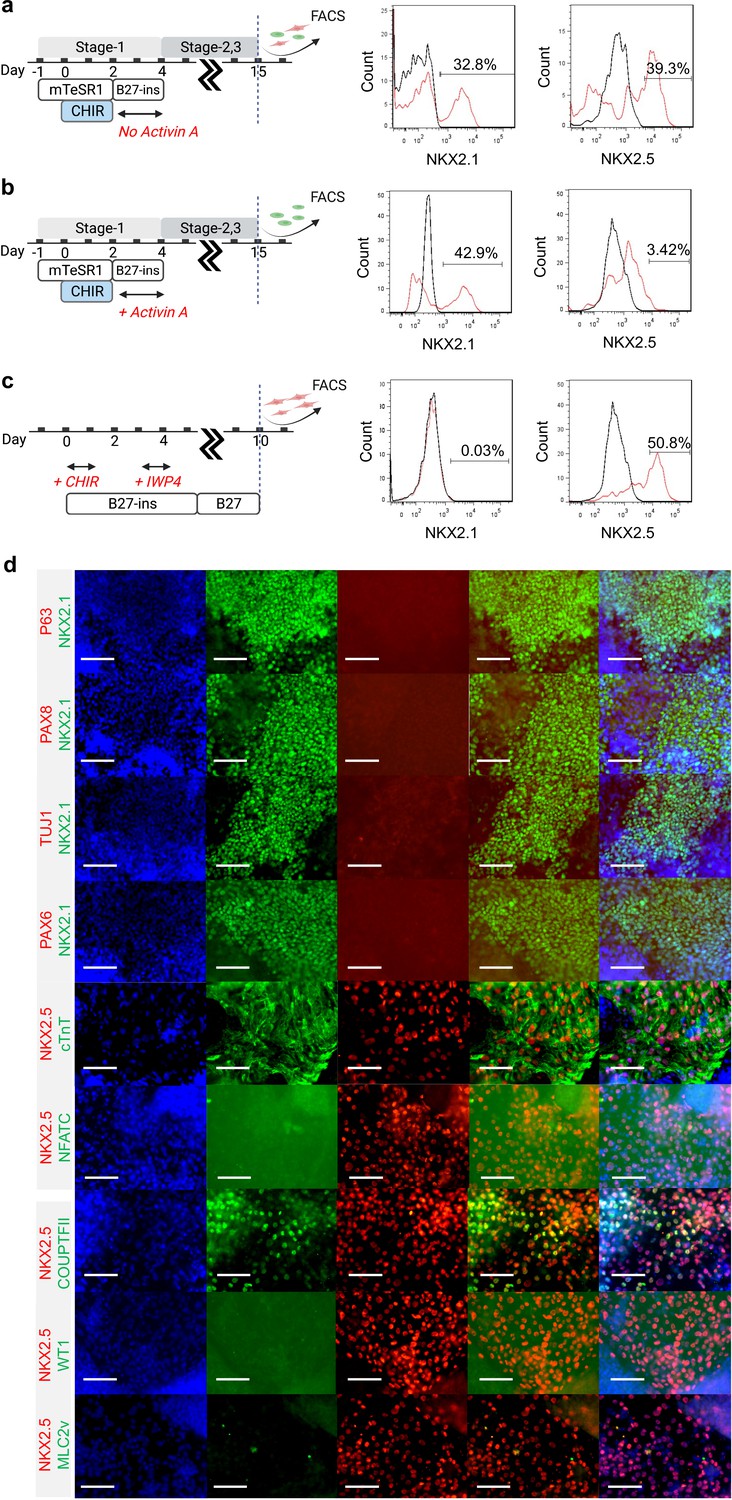
Characterization of Day-15 cardio-pulmonary progenitors.
FACS analysis of Day-15 cells from (a) cardio-pulmonary, (b) pulmonary, and (c) cardiac differentiation protocol. (d) Day-15 cardio-pulmonary progenitors did not express p63, PAX8, TUJ1, PAX6 markers; NKX2.5 expression colocalized with cTnT, and partially with COUPTFII; and expression of NFATC, WT1 and MLC2v was not detected. Scale bar = 75 μm for 40 X images.
Figure 3 with 3 supplements
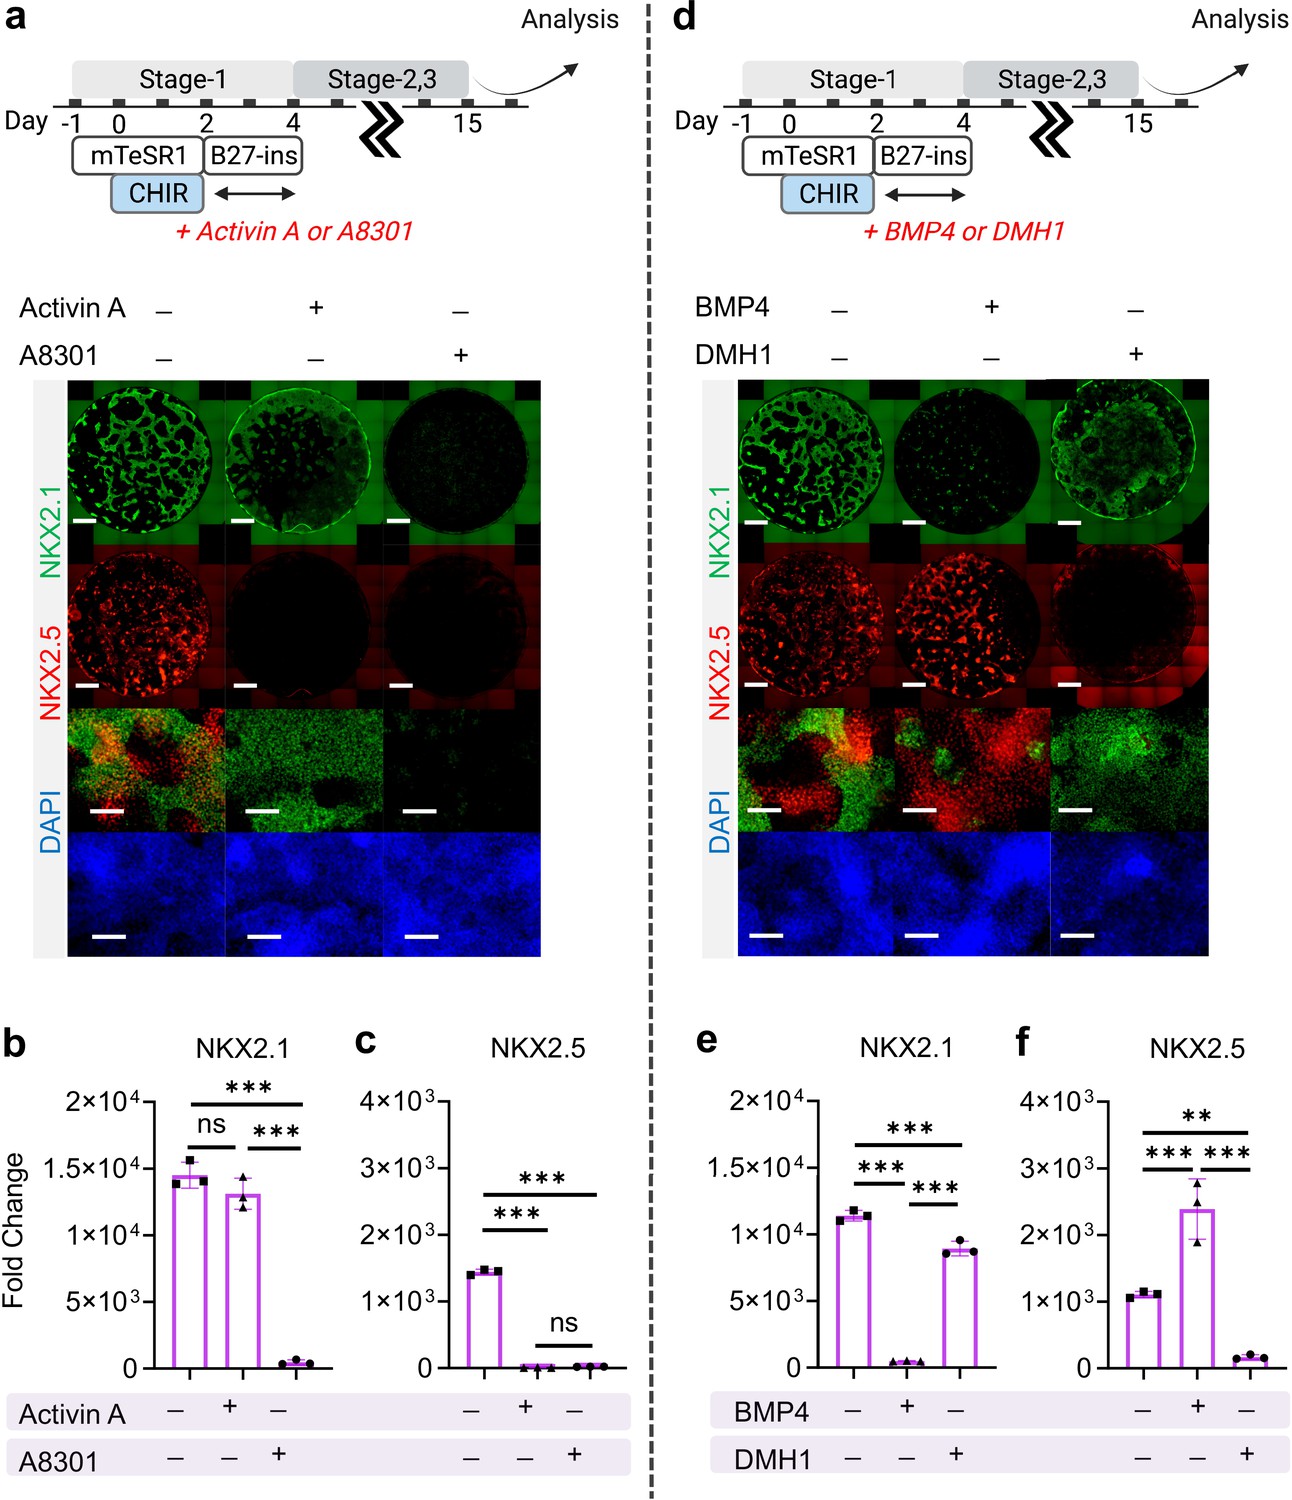
The effect of Nodal and BMP signaling during Stage-1 of co-differentiation on cardio-pulmonary induction.
IF (a,d) and qPCR (b,c,e,f) analysis of the induction of lung (NKX2.1+) and cardiac (NKX2.5+) progenitors on Day-15 of differentiation (a–c) The effects of exogenous nodal activation (Activin A, 20 ng/mL) or its inhibition (A8301, 1 µM). Fold change over hiPSCs for (b) NKX2.1 (n = 3 each; Activin A─ /A8301─ vs. Activin A+ /A8301─, p = 0.1939; Activin A─ /A8301─ vs. Activin A─ /A8301+, p < 0.001; Activin A+ /A8301─ vs. Activin A─ /A8301+, p < 0.001) and (c) NKX2.5 (n = 3 each; Activin A─ /A8301─ vs. Activin A+ /A8301─, p < 0.001; Activin A─ /A8301─ vs. Activin A─ /A8301+, p < 0.001; Activin A+ /A8301─ vs. Activin A─ /A8301+, p = 0.8649). (d-f) The effects of exogenous BMP4 (20 ng/mL) or BMP inhibitor (DMH1, 2 µM). qPCR analysis of (e) NKX2.1 (n = 3 each; BMP4─ /DMH1─ vs. BMP4+ /DMH1─, p < 0.001; BMP4─ /DMH1─ vs. BMP4─ /DMH1+, p < 0.001; BMP4+ /DMH1─ vs. BMP4─ /DMH1+, p < 0.001) and (f) NKX2.5 (n = 3 each; BMP4─ /DMH1─ vs. BMP4+ /DMH1─, p < 0.001; BMP4─ /DMH1─ vs. BMP4─ /DMH1+, p = 0.0044; BMP4+ /DMH1─ vs. BMP4─ /DMH1+, p < 0.001). Scale bar = 500 μm for whole well scan; Scale bar = 125 μm for 20 X images. All data are mean ± SD. *p < 0.05; **p < 0.01; ***p < 0.001. ‘n’ refers to biological replicates. Diagram created using BioRender (http://biorender.com/).
-
Figure 3—source data 1
Raw data for Figure 3b, c, e and f.
- https://cdn.elifesciences.org/articles/67872/elife-67872-fig3-data1-v2.xlsx
Figure 3—figure supplement 1
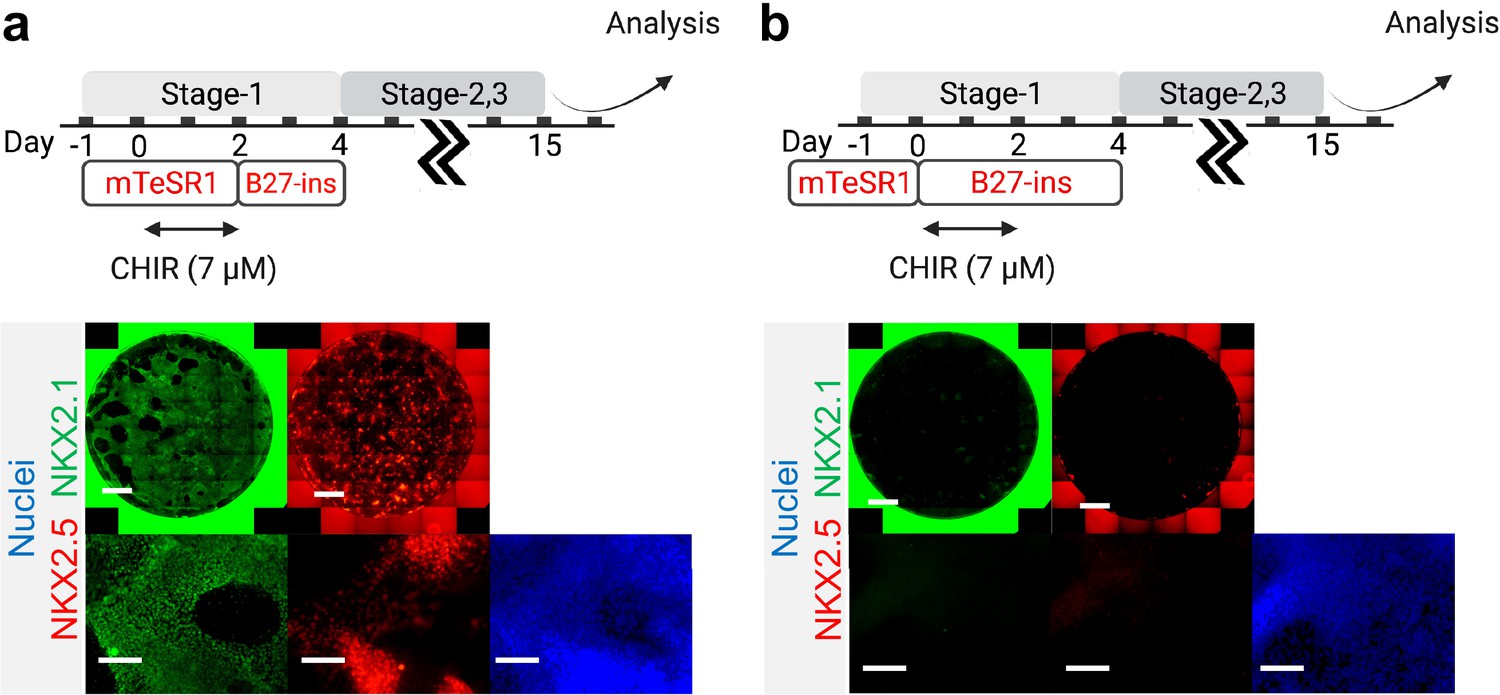
Initial co-induction medium for CHIR-directed differentiation.
Cells were induced by CHIR in (a) mTESR1 (b) and RPMI-based medium, followed by representative IF staining of NKX2.1 and NKX2.5 following 15 days of differentiation. Scale bar = 500 μm for whole well scan; Scale bar = 125 μm for 20 X images. Diagram created using BioRender (http://biorender.com/).
Figure 3—figure supplement 2
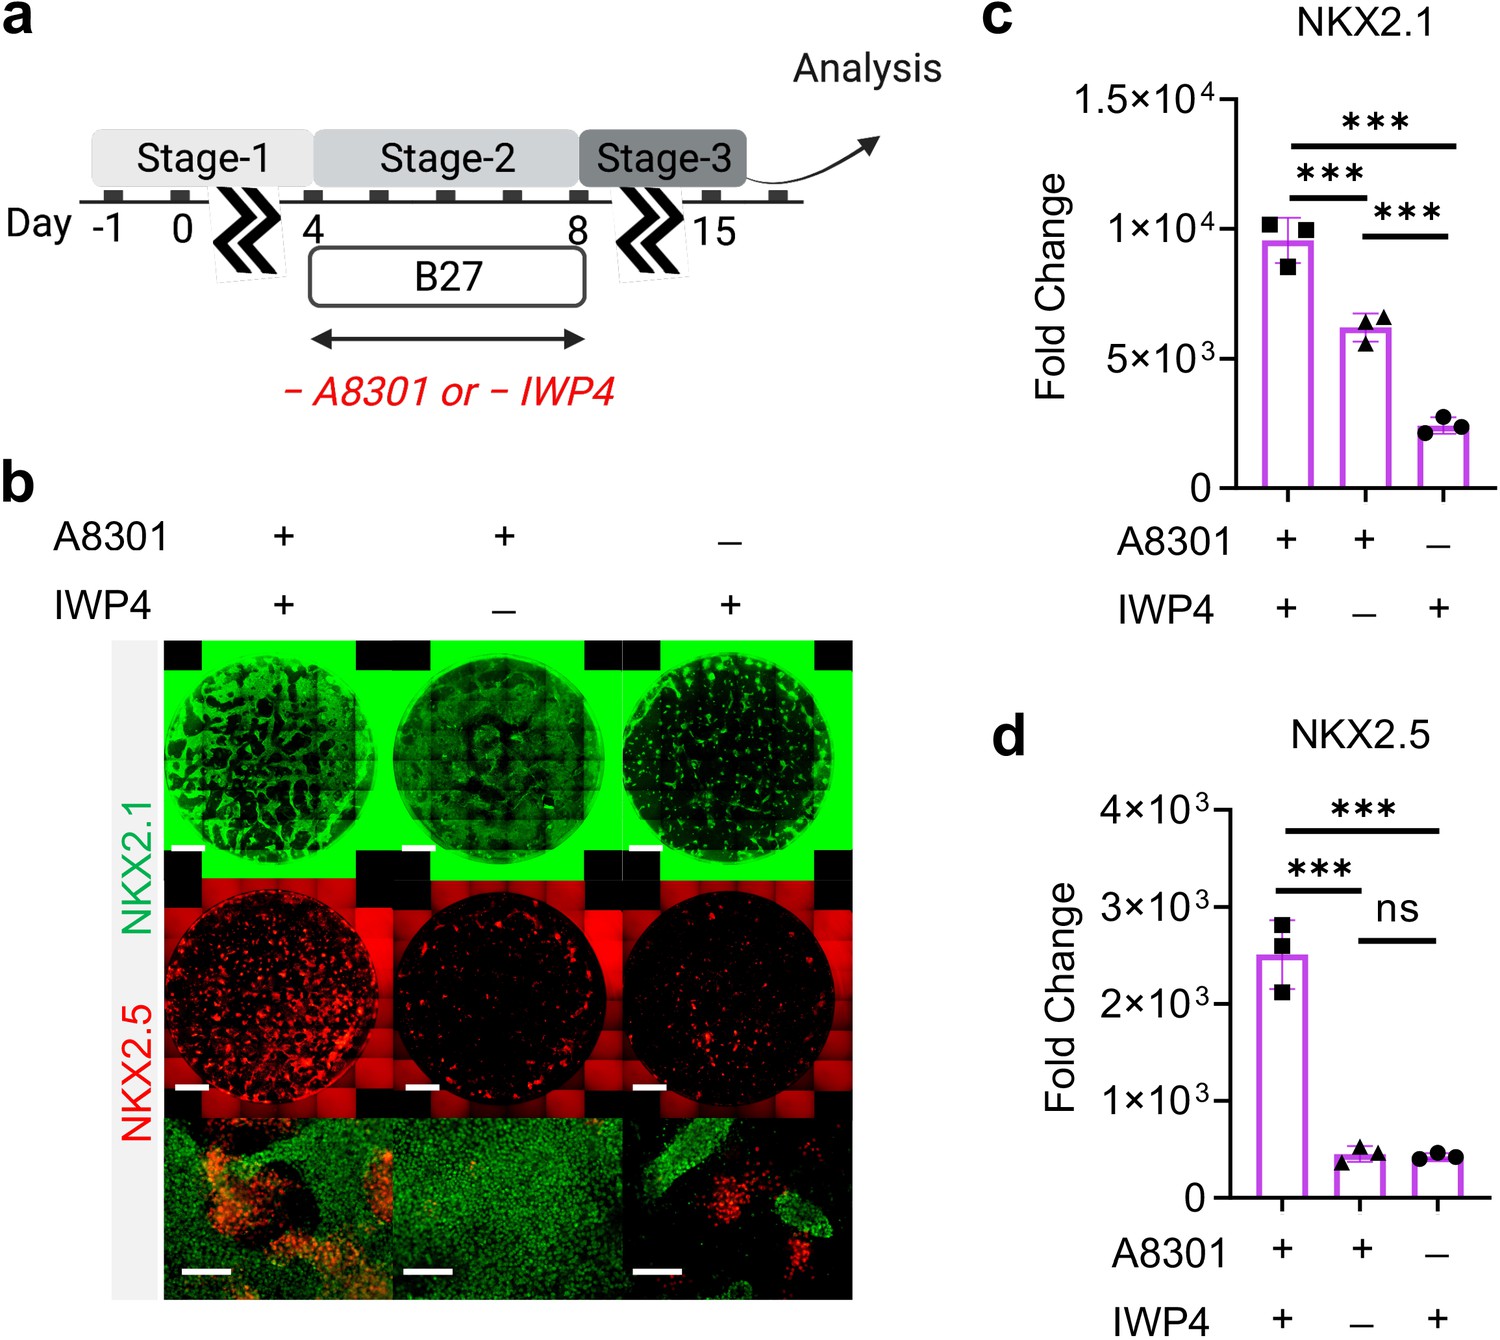
Combination of TGF-β and WNT inhibition during Stage-2 of co-differentiation is required for cardio-pulmonary induction.
(a) Schematic diagram illustrating the experimental design. (b–d) IF staining showing NKX2.1 and NKX2.5 expression on Day-15 of differentiation (b), and the corresponding qPCR analysis of (c) NKX2.1 (n = 3 each; A8301+ /IWP4+ vs. A8301+ /IWP4─, p < 0.001; A8301+ /IWP4+ vs. A8301─ /IWP4+, p < 0.001; A8301+ /IWP4─ vs. A8301─ /IWP4+, p < 0.001) and (d) NKX2.5 (n = 3 each; A8301+ /IWP4+ vs. A8301+ /IWP4─, p < 0.001; A8301+ /IWP4+ vs. A8301─ /IWP4+, p < 0.001; A8301+ /IWP4─ vs. A8301─ /IWP4+, p = 0.9986). Scale bar = 500 μm for whole well scan; Scale bar = 125 μm for 20 X images. All data are mean ± SD. *p < 0.05; **p < 0.01; ***p < 0.001. Diagram created using BioRender (http://biorender.com/).
-
Figure 3—figure supplement 2—source data 1
Raw data for Figure 3—figure supplement 2c,d.
- https://cdn.elifesciences.org/articles/67872/elife-67872-fig3-figsupp2-data1-v2.xlsx
Figure 3—figure supplement 3
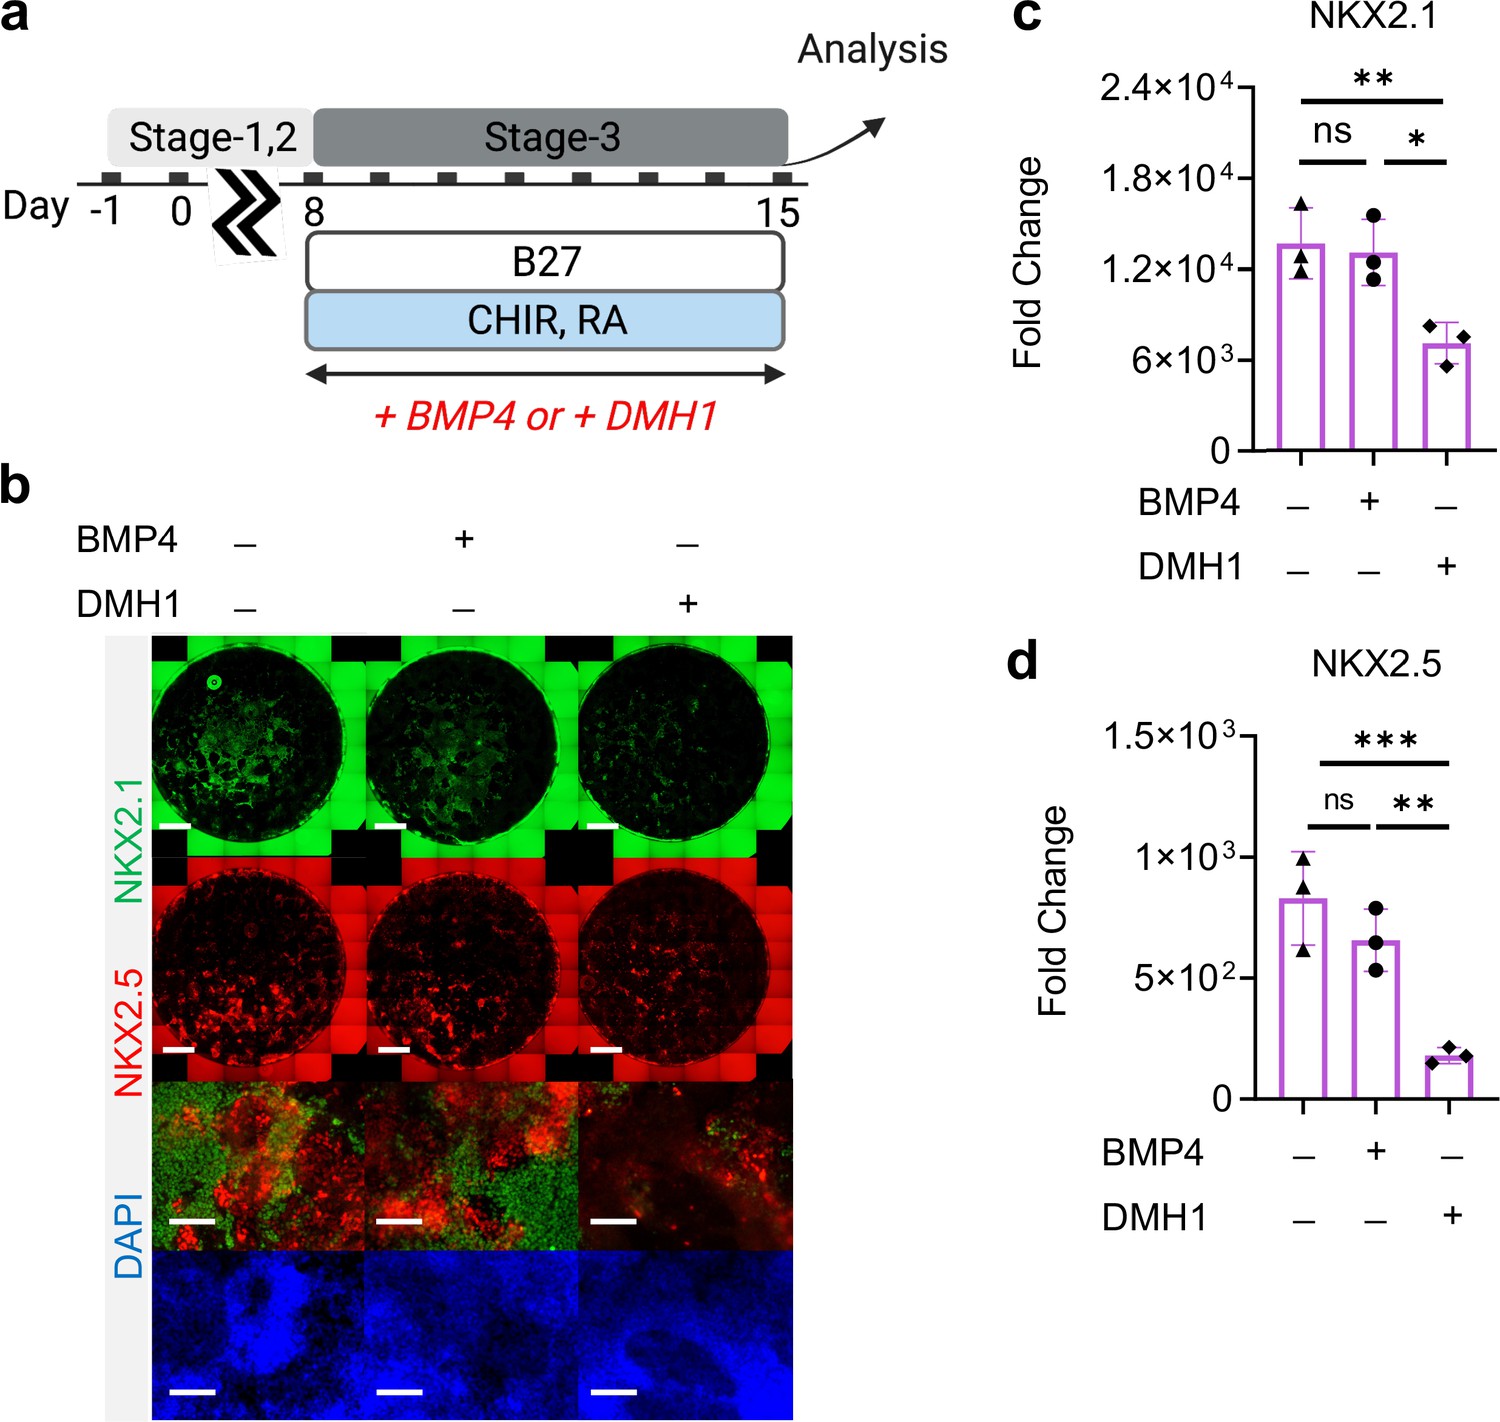
Roles of BMP4 during Stage-3 of co-differentiation.
(a) Schematic diagram illustrating the experimental design. (b) IF staining showing NKX2.1 and NKX2.5 expression on Day-15 of differentiation, and the corresponding qPCR analysis of (c) NKX2.1 (n = 3 each; BMP4─ /DMH1─ vs. BMP4+ /DMH1─, p = 0.9737; BMP4─ /DMH1─ vs. BMP4─ /DMH1+, p < 0.01; BMP4+ /DMH1─vs. BMP4─ /DMH1+, p = 0.0128) and (d) NKX2.5 (n = 3 each; BMP4─ /DMH1─ vs. BMP4+ /DMH1─, p = 0.3330; BMP4─ /DMH1─ vs. BMP4─ /DMH1+, p < 0.001; BMP4+ /DMH1─vs. BMP4─ /DMH1+, p < 0.01). Scale bar = 500 μm for whole well scan; Scale bar = 125 μm for 20 X images. All data are mean ± SD. *p < 0.05; **p < 0.01; ***p < 0.001. Diagram created using BioRender (http://biorender.com/).
-
Figure 3—figure supplement 3—source data 1
Raw data for Figure 3—figure supplement 3c,d.
- https://cdn.elifesciences.org/articles/67872/elife-67872-fig3-figsupp3-data1-v2.xlsx
Figure 4 with 6 supplements

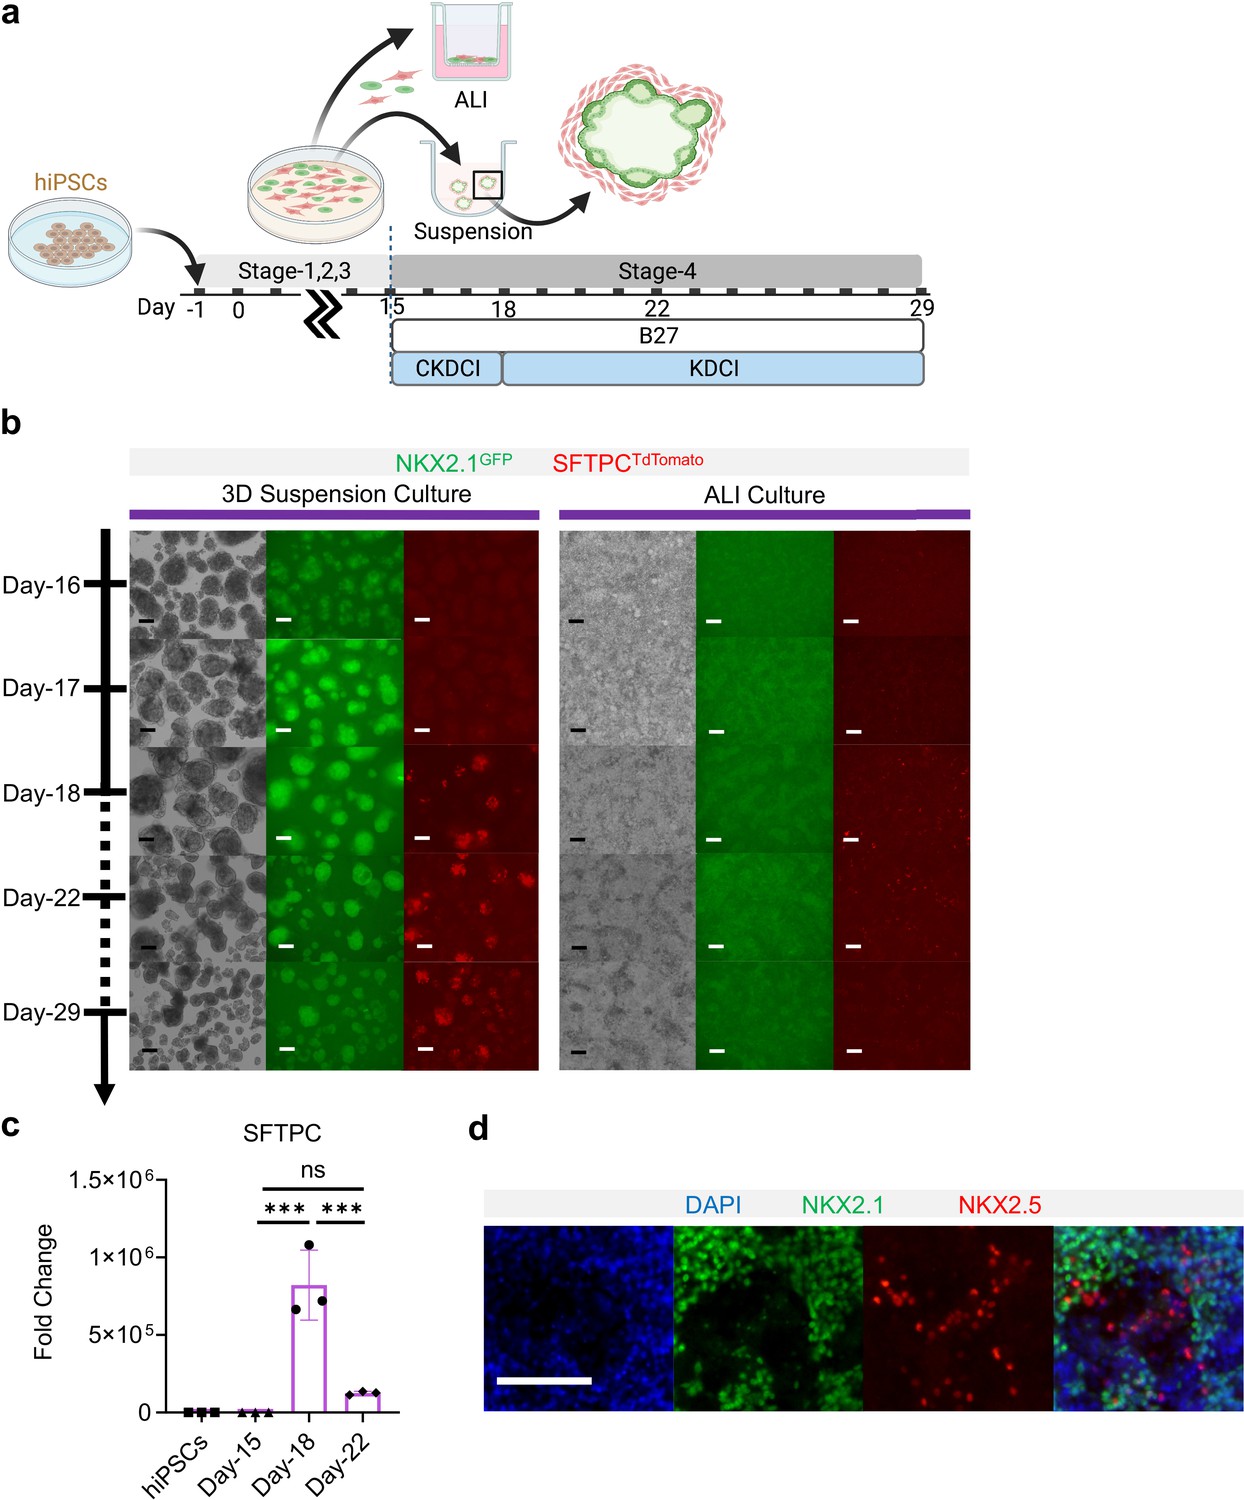
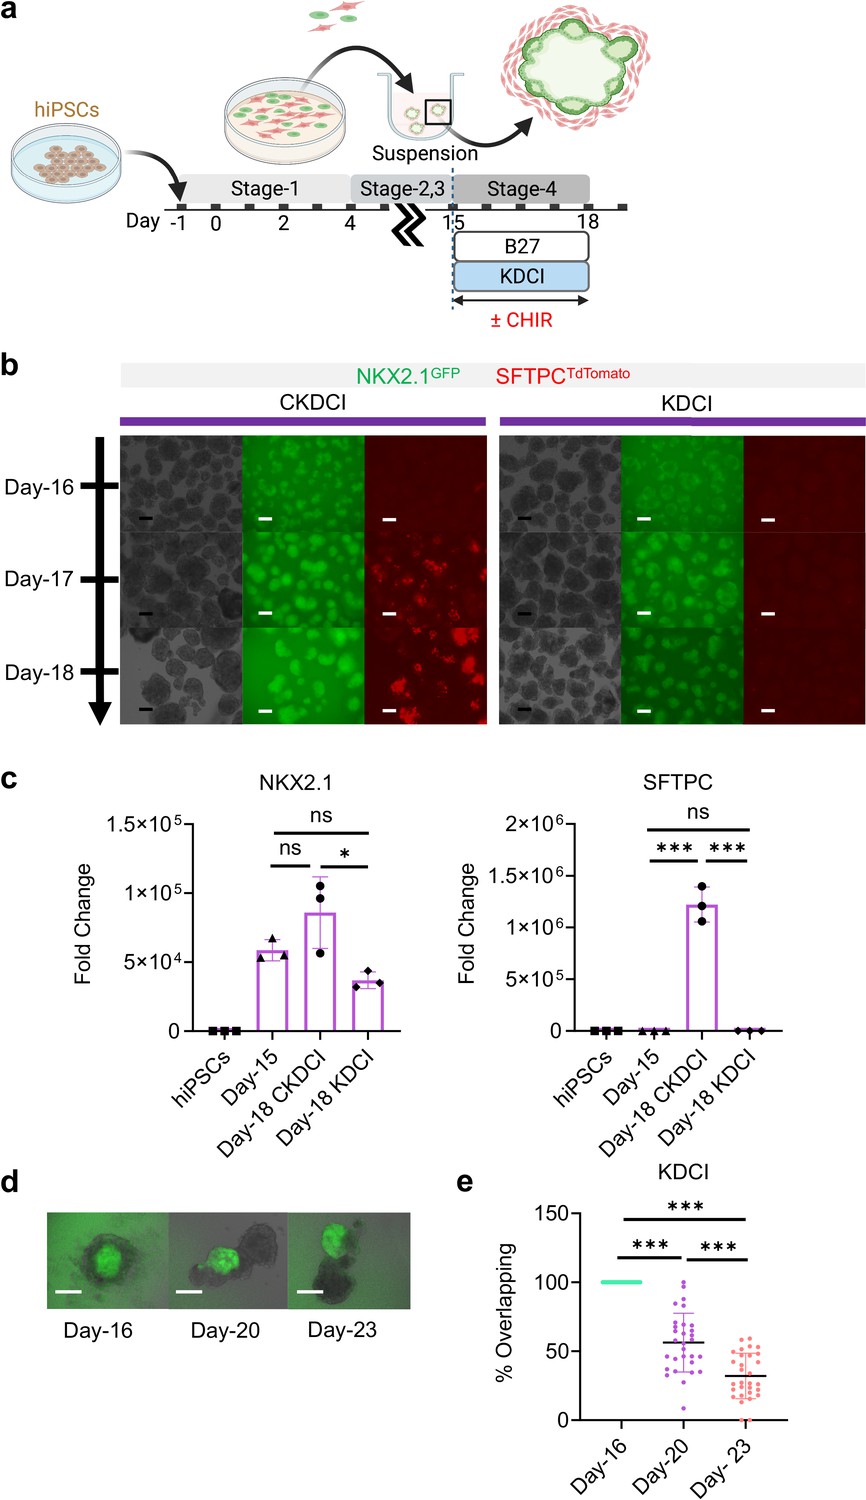
3D suspension culture of cardio-pulmonary μTs expedites AT2 maturation.
(a) Schematic diagram illustrating the Stage-4 maturation protocol involving replating of Day-15 cardiac and pulmonary progenitors onto ultra-low adhesion plate (for 3D suspension culture) or the transwell insert (for ALI culture). (b) Whole mount staining of cardiopulmonary μT on Day-18, scale bar 75 μm. (c) Live μT imaging of NKX2.1GFP and SFTPCTdTomato reporter signals during the first 3 days of maturation (Day-16 – Day-18). (d-f) qPCR analysis of hiPSC control, Day-15 cells and Day-18 cells (from ALI or suspension culture) for (d) NKX2.1 (n = 3 each; Day-15 vs. ALI, p = 0.9998; Day-15 vs. Suspension, p = 0.0547; ALI vs. Suspension, p = 0.0486), (e) SFTPC (n = 3 each; Day-15 vs. ALI, p = 0.1896; Day-15 vs. Suspension, p < 0.001; ALI vs. Suspension, p < 0.01). (f) NKX2.5 (n = 3 each; Day-15 vs. ALI, p < 0.001; Day-15 vs. Suspension, p = 0.8367; ALI vs. Suspension, p < 0.001). Scale bar = 125 μm. (g–n) Schematic diagram showing the differentiation procedure without (g) and with (j) Activin A during Stage-1 of differentiation (h, k) Live μT imaging of NKX2.1GFP and SFTPCTdTomato reporter signals during Day-16 to Day-18. Scale bar = 125 μm for 10 X images. (i, l) Whole mount staining of μTs on Day-18. (m–n) qPCR analysis of hiPSC control, Day-15 cells and Day-18 cells (from Activin-free or Activin) for (m) NKX2.1 (n = 3 each; Day-15 (No Activin) vs. Day-18 (No Activin), p < 0.001; Day-15 (Activin) vs Day-18 (Activin), p = 0.0147; Day-15 (No Activin) vs. Day-15 (Activin), p = 0.1316), (n) SFTPC (n = 3 each; Day-15 (No Activin) vs. Day-18 (No Activin), p < 0.001; Day-15 (Activin) vs Day-18 (Activin), p = 0.2417; Day-18 (No Activin) vs. Day-18 (Activin), p < 0.001). All data are mean ± SD. *p < 0.05; **p < 0.01; ***p < 0.001. Scale bar = 125 μm. ‘n’ refers to biological replicates. Diagram created using BioRender (http://biorender.com/).
-
Figure 4—source data 1
Raw data for Figure 4d, e, f, m and n.
- https://cdn.elifesciences.org/articles/67872/elife-67872-fig4-data1-v2.xlsx
-
Figure 4—source data 2
Raw data for Figure 1c.
- https://cdn.elifesciences.org/articles/67872/elife-67872-fig4-data2-v2.xlsx
Figure 4—figure supplement 1
Co-maturation of Day-15 cardiac and pulmonary progenitors on ALI and 3D suspension culture platforms.
(a) Schematic diagram showing the experimental design. (b) Live cell μTs imaging on the NKX2.1GFP and SFTPCTdTomato reporter signal over time. Scale bar = 125 μm for 10 X images. (c) qPCR for SFTPC (n = 3 each; Day-15 vs. Day-18, p < 0.001; Day-15 vs. Day-22, p = 0.5569; Day-18 vs. Day-22, p < 0.001). (d) IF of NKX2.1 and NKX2.5 on ALI membrane. Scale bar = 125 μm for 20 X images. All data are mean ± SD. *p < 0.05; **p < 0.01; ***p < 0.001. Diagram created using BioRender (http://biorender.com/).
Figure 4—figure supplement 2
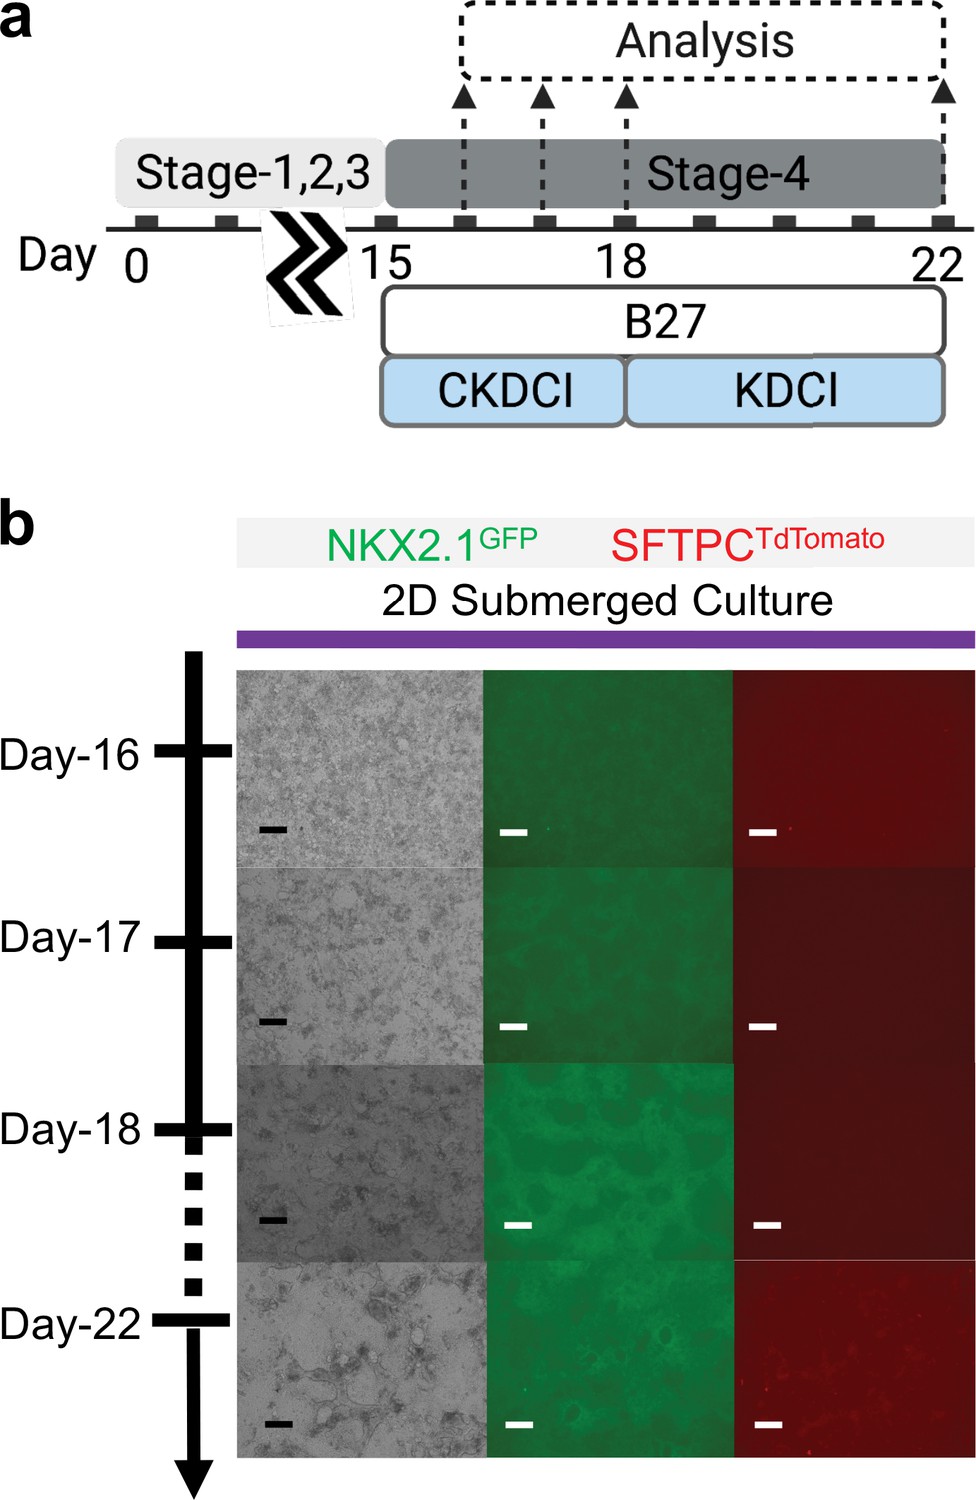
Co-maturation of Day-15 cardiac and pulmonary progenitors on 2D submerged culture.
(a) Schematic diagram showing the experimental design. (b) Live cell imaging of the NKX2.1GFP and SFTPCTdTomato reporter signal over time. Scale bar = 125 μm for 10 X images. Diagram created using BioRender (http://biorender.com/).
Figure 4—figure supplement 3
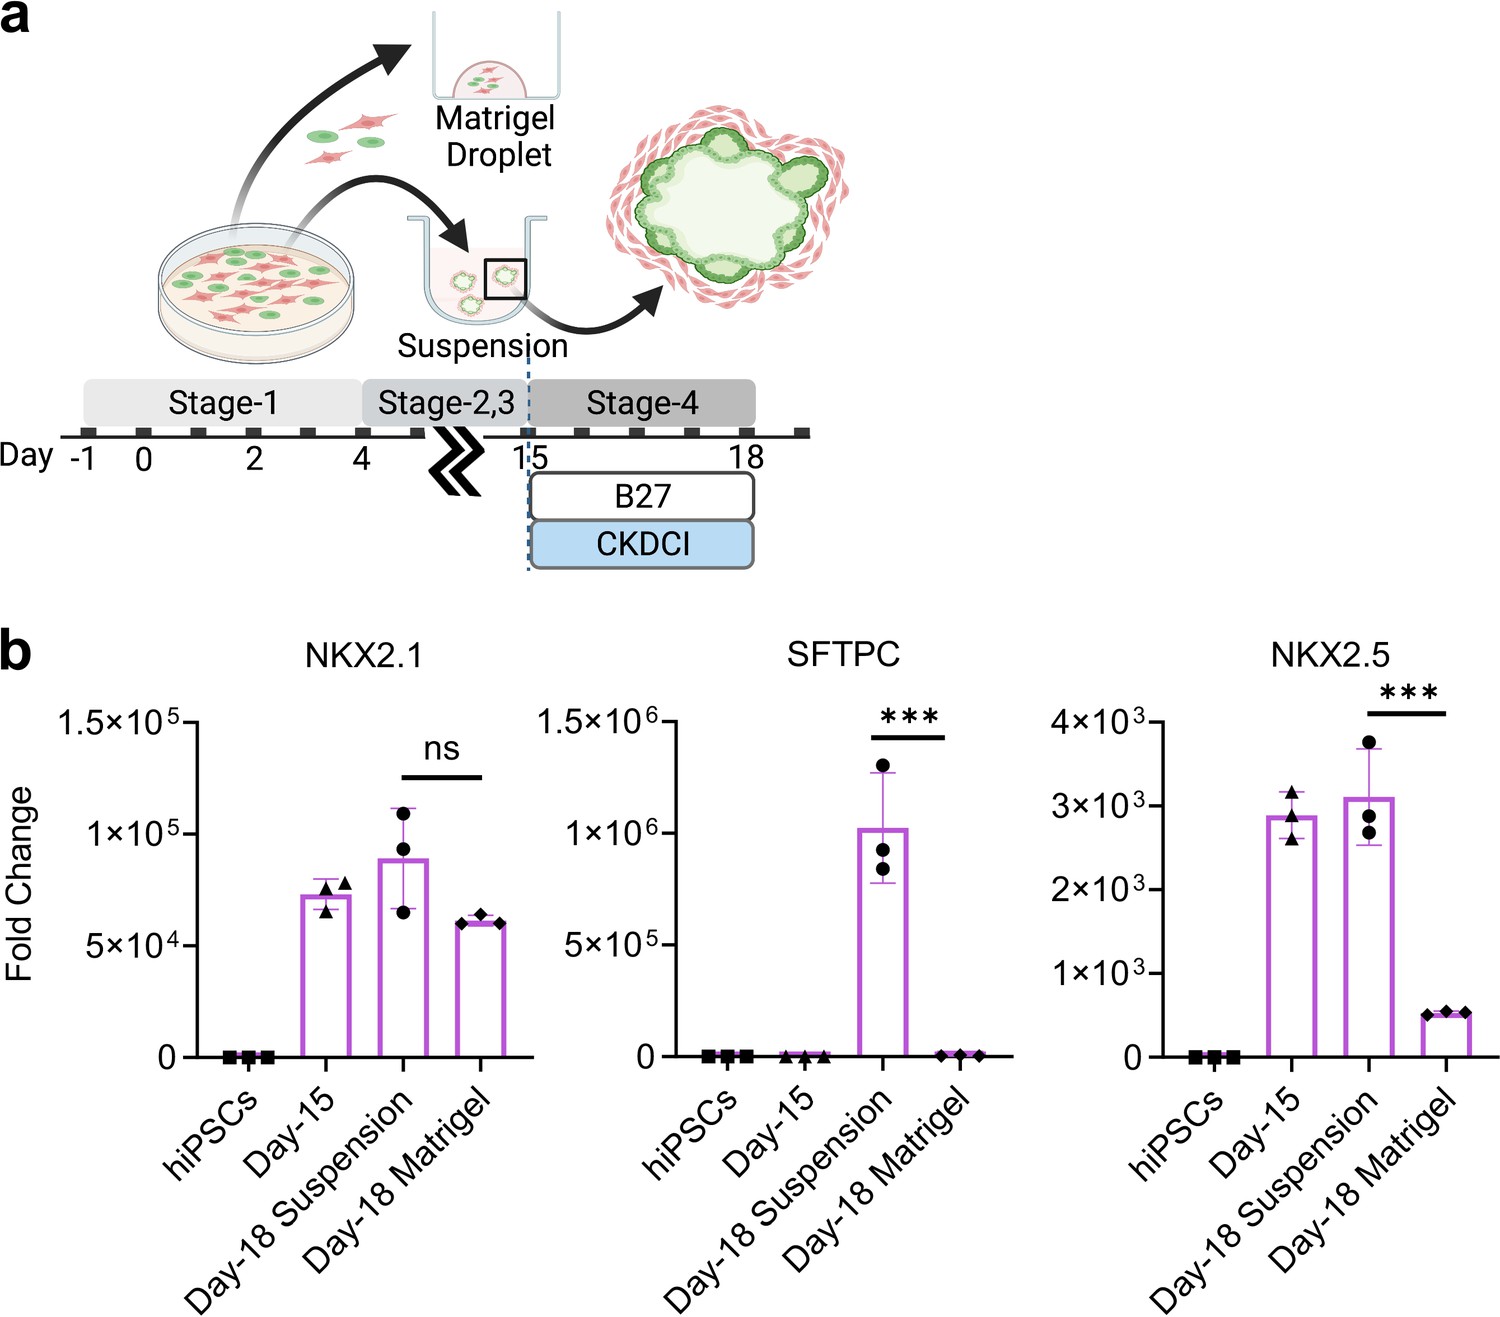
Co-maturation of Day-15 cardiac and pulmonary progenitors in Matrigel Droplet and 3D suspension culture platforms.
(a) Schematic diagram showing the experimental design. (b) qPCR for NKX2.1 (n = 3 each; Day-18 Suspension vs. Day-18 Matrigel, p = 0.0781), SFTPC (n = 3 each; Day-18 Suspension vs. Day-18 Matrigel, p < 0.001), NKX2.5 (n = 3 each; Day-18 Suspension vs. Day-18 Matrigel, p < 0.001). All data are mean ± SD. *p < 0.05; **p < 0.01; ***p < 0.001. Diagram created using BioRender (http://biorender.com/).
-
Figure 4—figure supplement 3—source data 1
Raw data for Figure 4—figure supplement 3b.
- https://cdn.elifesciences.org/articles/67872/elife-67872-fig4-figsupp3-data1-v2.xlsx
Figure 4—figure supplement 4
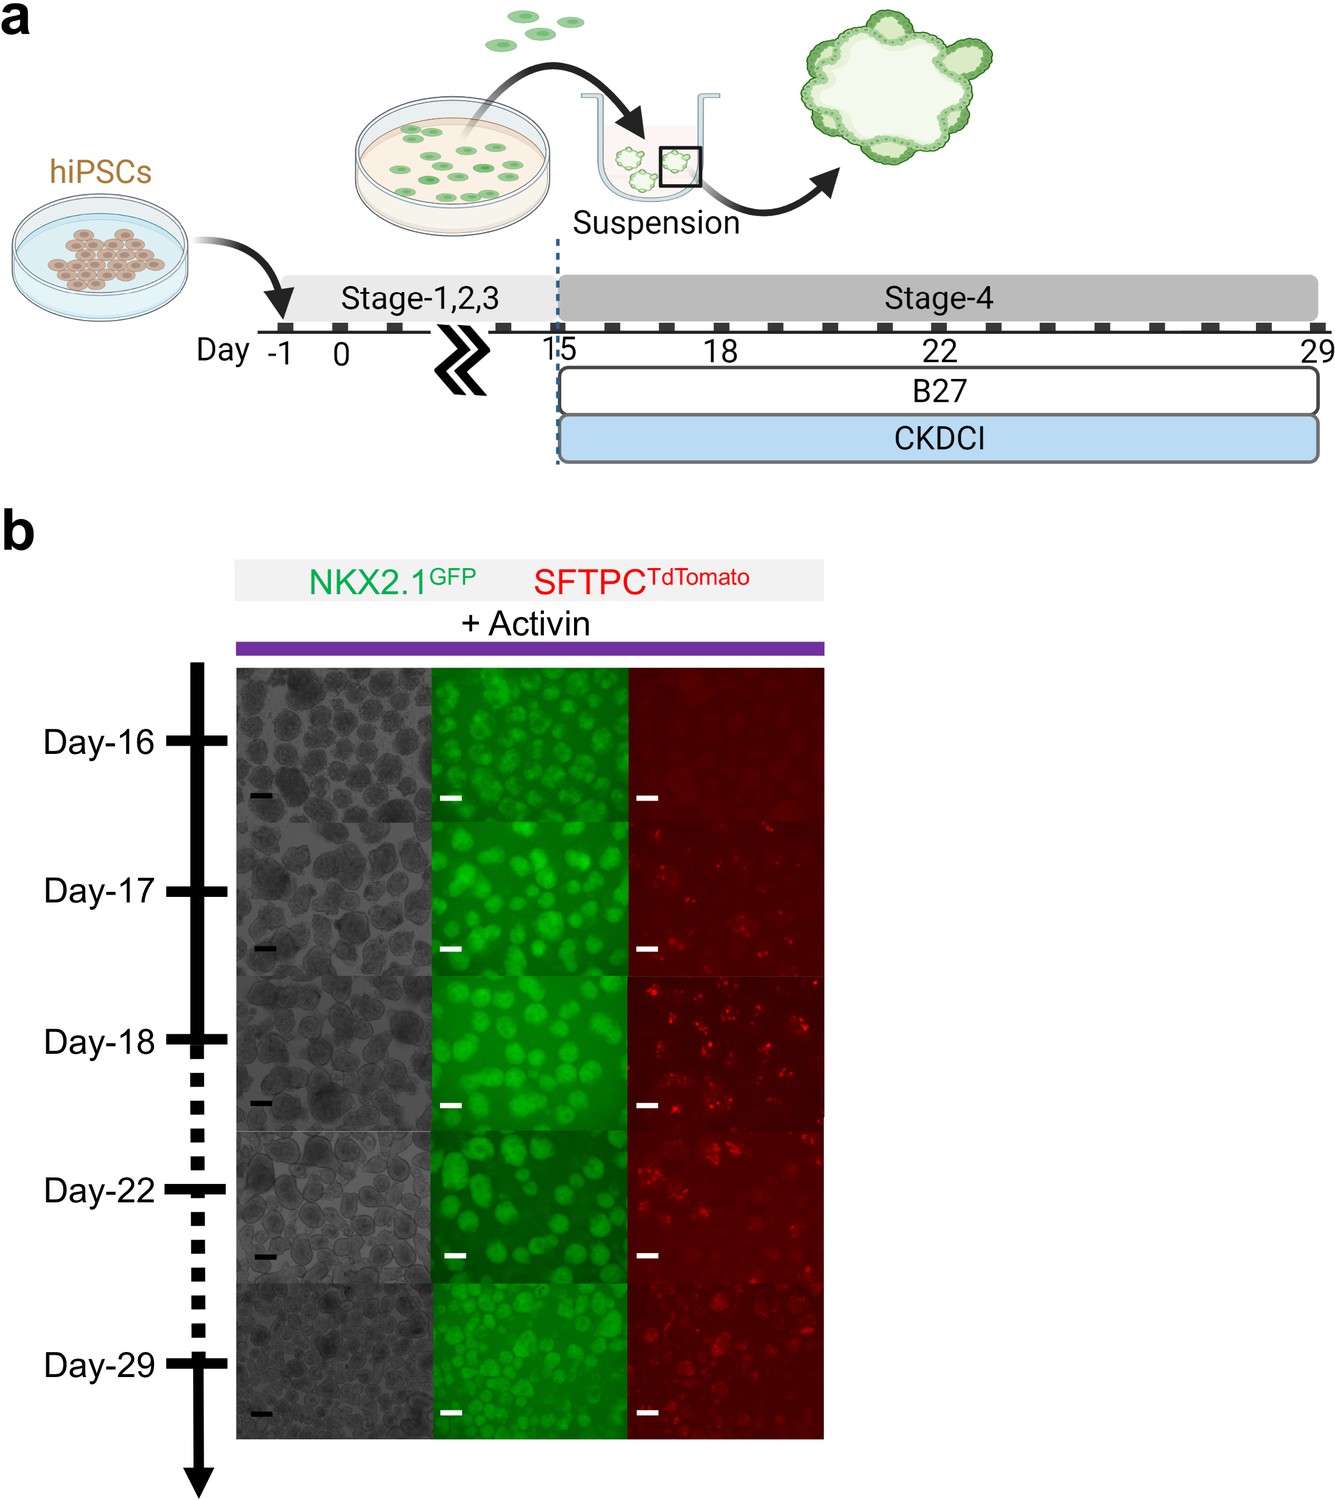
Maturation of pulmonary progenitors derived from Activin A-based protocol on 3D suspension culture.
(a) Schematic diagram showing the experimental design. (b) Live μT imaging on the NKX2.1GFP and SFTPCTdTomato reporter signal over time. Scale bar = 125 μm for 10 X images. Diagram created using BioRender (http://biorender.com/).
Figure 4—figure supplement 5
Verification of cardio-pulmonary co-differentiation protocol on BU1 hiPSCs.
(a) Schematic diagram illustrating the process of cardio-pulmonary co-differentiation, highlighting the adjustment of CHIR concentration during the first 2 days of differentiation. (b) IF staining of mesendoderm, endoderm and mesoderm after Stage-1 differentiation with 7 μM CHIR. (c,d) IF staining of NKX2.1 and NKX2.5 following 15 days of co-differentiation. Scale bar = 500 μm for whole well scan; Scale bar = 125 μm for 20 X images; (e) Confocal imaging of Day-18 μT. Scale bar = 125 μm for confocal images. Diagram created using BioRender (http://biorender.com/).
Figure 4—figure supplement 6

Comparing fluorescence of NKX2.1GFP and SFTPCTdTomato of BU3-NGST vs. non-reporter BU1.
No autofluorescence was observed in non-reporter line BU1 on Day-18. Scale bar = 125 μm.
Figure 5 with 1 supplement
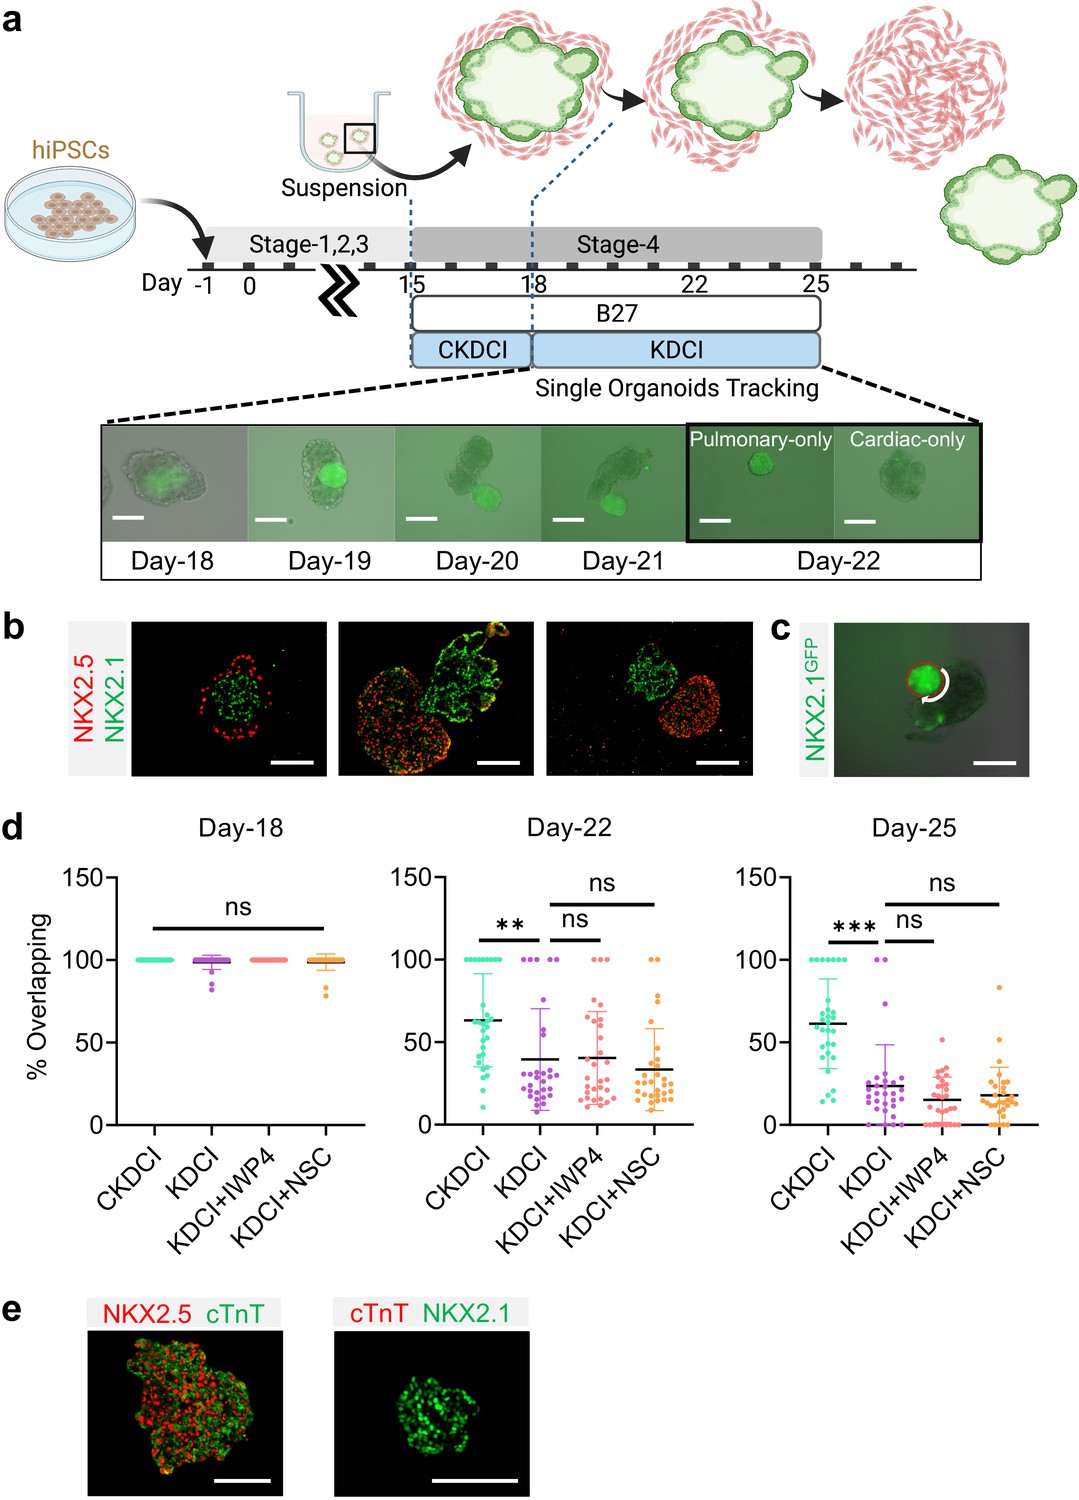
Cardio-pulmonary segregation in the dual-lineage μT.
(a) Schematic diagram illustrating the timeline for the investigation. Scale bar = 125 μm (b) Histological analysis of cardio-pulmonary μTs at different stages of segregation. Scale bar = 125 μm (c) Diagram showing measurement of the total perimeter of GFP+ pulmonary compartment (red color) and its overlapping perimeter with non-GFP compartment (white color) using Image J. Scale bar = 125 μm (d) Box plot showing percentage overlapping region of GFP+ with non-GFP tissues on Day- 18 (n = 30 each;; CKDCI vs. KDCI, p = 0.3979; CKDCI vs. KDCI+ IWP4; p > 0.9999; CKDCI vs. KDCI+ NSC, p = 0.4293; KDCI vs. KDCI+ IWP4, p = 0.3979; KDCI vs. KDCI+ NSC, p > 0.9999; KDCI+ IWP4 vs. KDCI+ NSC, p = 0.4293), Day-22 (n = 30 each; CKDCI vs. KDCI, p = 0.0077; CKDCI vs. KDCI+ IWP4; p = 0.0112; CKDCI vs. KDCI+ NSC, p < 0.001; KDCI vs. KDCI+ IWP4, p = 0.9994; KDCI vs. KDCI+ NSC, p = 0.8318; KDCI+ IWP4 vs. KDCI+ NSC, p = 0.7674) and Day-25 (n = 30 each; CKDCI vs. KDCI, p < 0.001; CKDCI vs. KDCI+ IWP4; p < 0.001; CKDCI vs. KDCI+ NSC, p < 0.001; KDCI vs. KDCI+ IWP4, p = 0.4271; KDCI vs. KDCI+ NSC, p = 0.7275; KDCI+ IWP4 vs. KDCI+ NSC, p = 0.9623). (e) Histological analysis of cTnT expression on the segregated cardiac and pulmonary μTs, with co-staining of NKX2.5 and NKX2.1. Scale bar = 125 μm. All data are mean ± SD. *p < 0.05; **p < 0.01; ***p < 0.001. ‘n’ refers to biological replicates. Diagram created using BioRender (http://biorender.com/).
-
Figure 5—source data 1
Raw data for Figure 5d.
- https://cdn.elifesciences.org/articles/67872/elife-67872-fig5-data1-v2.xlsx
Figure 5—figure supplement 1
Day-15 cells in CKDCI vs. KDCI for co-maturation.
(a) Schematic diagram showing the experimental design. (b) Live μT imaging on the NKX2.1GFP and SFTPCTdTomato reporter signal over time. Scale bar = 125 μm for 10 X images. (c) qPCR analysis for NKX2.1 (n = 3 each; Day-15 vs. Day-18 CKDCI, p = 0.1522; Day-15 vs. Day-18 KDCI, p = 0.2912; Day-18 CKDCI vs. Day-18 KDCI, p < 0.05), SFTPC (n = 3 each; Day-15 vs. Day-18 CKDCI, p < 0.001; Day-15 vs. Day-18 KDCI, p > 0.9999; Day-18 CKDCI vs. Day-18 KDCI, p < 0.001). (d) Time-lapse images of μTs cultured in KDCI medium from Day-16 to Day-23. Scale bar = 125 μm. (e) Percent overlapping of GFP vs. non-GFP (Day-16 vs. Day-20, p < 0.001; Day-16 vs. Day-23, p < 0.001; Day-20 vs. Day-23, p < 0.001). All data are mean ± SD. *p < 0.05; **p < 0.01; ***p < 0.001. Diagram created using BioRender (http://biorender.com/).
-
Figure 5—figure supplement 1—source data 1
Raw data for Figure 5—figure supplement 1c,e.
- https://cdn.elifesciences.org/articles/67872/elife-67872-fig5-figsupp1-data1-v2.xlsx
Figure 6 with 1 supplement
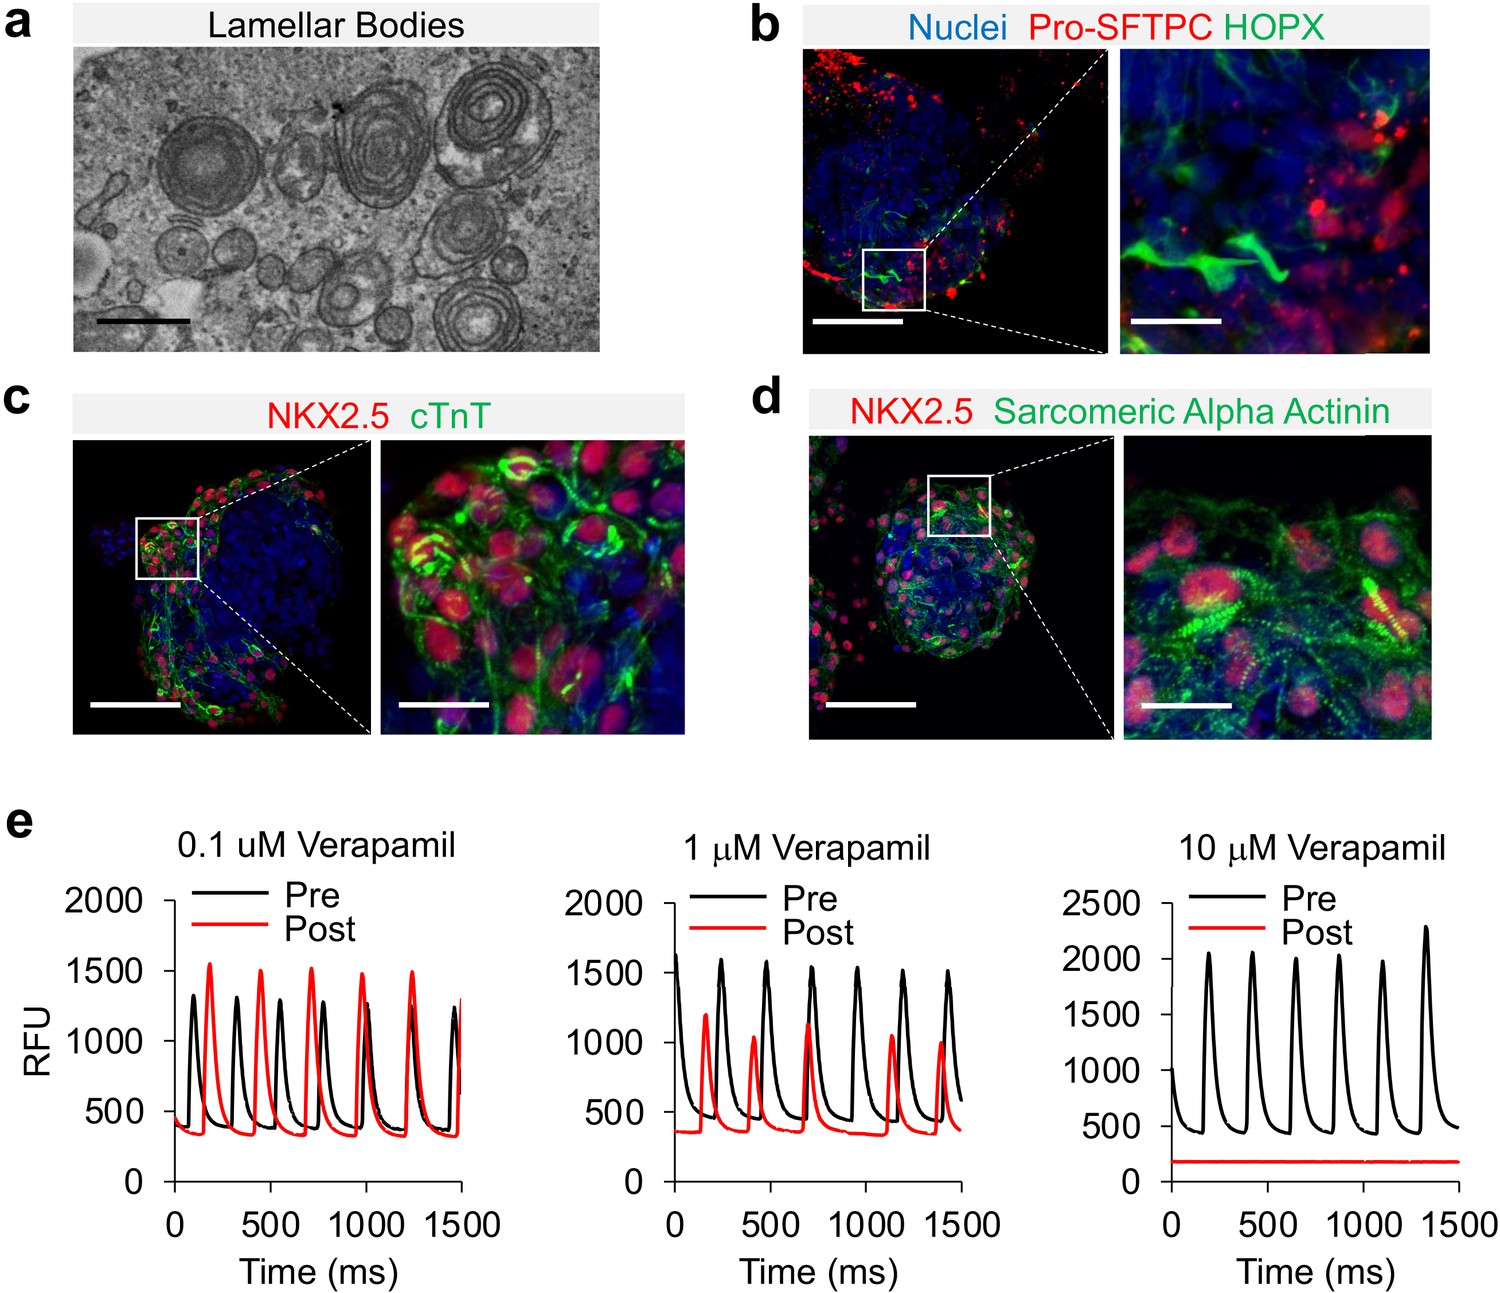
Characterization of cardio-pulmonary μT maturation.
(a) Lamellar bodies found in cardio-pulmonary μT. Scale bar = 1 μm. Cardio-pulmonary μT expressing (b) Pro-SFTPC and HOPX. Cardio-pulmonary μT also exhibited striated pattern as indicated by (c) cTnT and (d) Sarcomeric Alpha Actinin. Scale bar = 125 μm. (e) Calcium imaging of cardiac μTs following treatment with Verapamil.
-
Figure 6—source data 1
Raw data for Figure 6e.
- https://cdn.elifesciences.org/articles/67872/elife-67872-fig6-data1-v2.xlsx
Figure 6—figure supplement 1
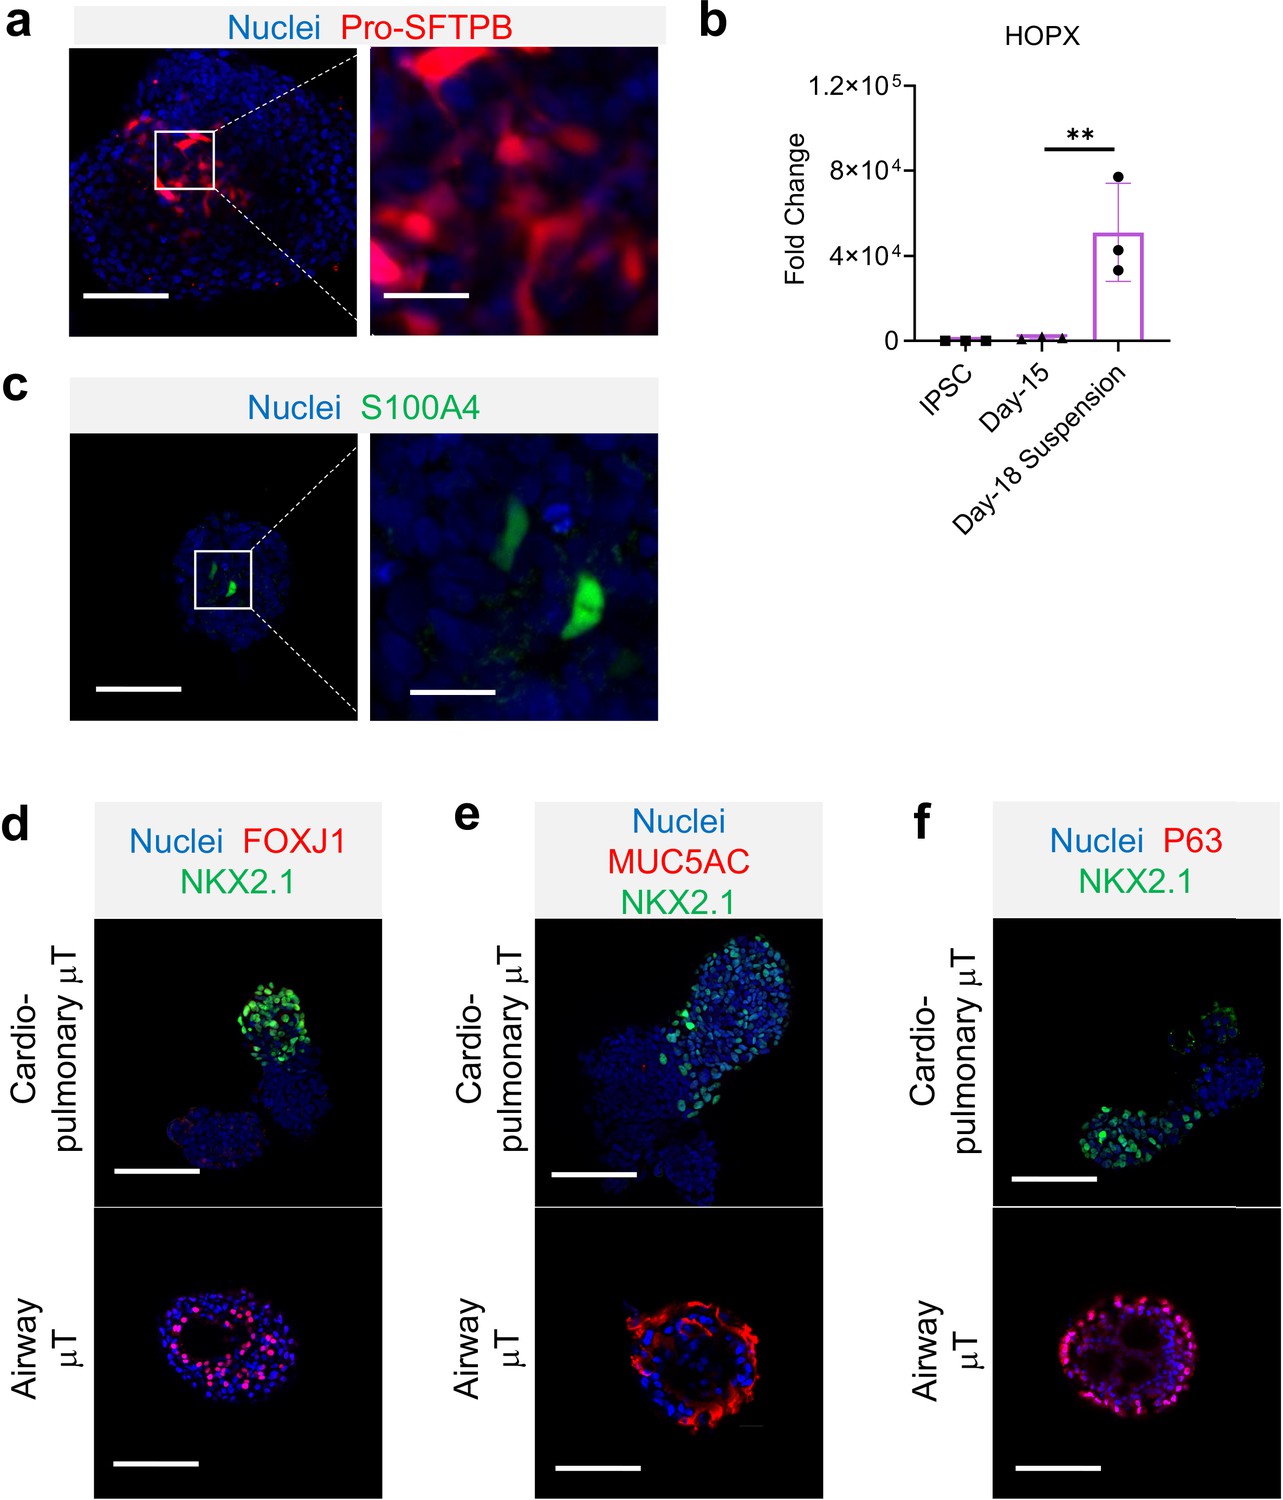
Characterization of cardio-pulmonary μT.
IF for (a) Pro-SFTPB and (b) HOPX gene expression (n = 3 each; Day-15 vs. Day-18 Suspension, P < 0.01). IF for (c) S100A4. (d) FOXJ1, (e) MUC5AC, and (f) p63. Scale bar = 125 μm.
-
Figure 6—figure supplement 1—source data 1
Raw data for Figure 6—figure supplement 1b.
- https://cdn.elifesciences.org/articles/67872/elife-67872-fig6-figsupp1-data1-v2.xlsx
Videos
Video 1
Contacting cardiac μT following 7 days after withdrawal of CHIR.
Video 2
Calcium influx capability of cardiac μT loaded with Cal-520.
Tables
Appendix 1—key resources table
| Reagent type (species) or resource | Designation | Source or reference | Identifiers | Additional information |
|---|---|---|---|---|
| Gene (Homo sapiens) | β-actin | GenBank (NM_001101.3) | Hs01060665_g1 | |
| Gene (Homo sapiens) | NKX2.1 | GenBank (NM_001079668.2) | Hs00968940_m1 | |
| Gene (Homo sapiens) | FOXA2 | GenBank (NM_02178.4) | Hs00232764_m1 | |
| Gene (Homo sapiens) | SOX17 | GenBank (NM_022454.3) | Hs00751752_s1 | |
| Gene (Homo sapiens) | NKX2.5 | GenBank (NM_004387.3) | Hs00231763_m1 | |
| Gene (Homo sapiens) | SFTPC | GenBank (NM_001172357.1) | Hs00161628_m1 | |
| Gene (Homo sapiens) | NCAM1 | GenBank (NM_000615.6) | Hs00941821_m1 | |
| Gene (Homo sapiens) | HOPX | GenBank (NM_001145459.1) | Hs04188695_m1 | |
| Cell line (Homo sapiens) | BU3-NGST | Boston University (Kotton’s Lab) | RRID:CVCL_WN82 | |
| Cell line (Homo sapiens) | BU1 | Boston University (Kotton’s Lab) | - | |
| Cell line (Homo sapiens) | Normal Human Bronchial Epithelial (NHBE) cells | Lonza | Cat# CC-2541; RRID:CVCL_S124 | |
| Antibody | anti-NKX2.1(Rabbit monoclonal) | Abcam | Cat# ab76013;RRID:AB_1310784 | 1:500 |
| Antibody | anti-NKX2.5 (Goat polyclonal) | R&D Systems | Cat# AF2444;RRID:AB_355269 | 1:500 |
| Antibody | anti-Pro-SFTPB (Rabbit polyclonal) | Seven Hills | Cat# WRAB-55522RRID:AB_ | 1:200 |
| Antibody | anti-Pro-SFTPC (Rabbit polyclonal) | Seven Hills | Cat# WRAB-9937; RRID:AB_451721 | 1:500 |
| Antibody | anti-HOPX (Mouse monoclonal) | Santa Cruz | Cat# Sc-398703; RRID:AB_2687966 | 1:100 |
| Antibody | anti-cTnT (Mouse monoclonal) | Thermo Fisher Scientific | Cat# MA5-12960; RRID:AB_11000742 | 1:200 |
| Antibody | anti-Sarcomeric Alpha Actinin (Mouse Monoclonal) | Thermo Fisher Scientific | Cat# MA1-22863; RRID:AB_557426 | 1:200 |
| Antibody | anti-p63 (Mouse monoclonal) | Biocare Medical | Cat# CM163A; RRID:AB_10582730 | 1:100 |
| Antibody | anti-MUC5AC (Mouse monoclonal) | Thermo Fisher Scientific | Cat# MA5-12178;RRID:AB_10978001 | 1:100 |
| Antibody | anti-FOXJ1 (Mouse monoclonal) | Thermo Fisher Scientific | Cat# 14-9965-80; RRID:AB_1548836 | 1:100 |
| Antibody | anti-PAX8 (Mouse monoclonal) | ThermoFisher Scientific | Cat# MA1-117RRID:AB_2536828 | 1:100 |
| Antibody | anti-β-Tubulin III (Mouse monoclonal) | Sigma-Aldrich | Cat# T8578RRID:AB_1841228 | 1:100 |
| Antibody | anti-PAX6 (Mouse monoclonal) | BioLegends | Cat# 862,001RRID:AB_2801237 | 1:100 |
| Antibody | anti-COUPTFII (Mouse monoclonal) | R&D Systems | Cat# PP-H7147-00RRID:AB_1964214 | 1:100 |
| Antibody | anti-MLC2v (Rabbit Polyclonal) | ProteinTech Group | Cat# 10906–1-APRRID:AB_2147453 | 1:100 |
| Antibody | anti-NFATC (Mouse monoclonal) | Thermo Fisher Scientific | Cat# MA3-024RRID:AB_2236037 | 1:100 |
| Antibody | anti-WT1 (Mouse monoclonal) | Novus Biologicals | Cat# NBP2-44606RRID:AB_not found | 1:100 |
| Antibody | anti-Brachyury (Goat polyclonal) | R&D Systems | Cat# AF2085; RRID:AB_2200235 | 1:50 |
| Antibody | anti-MIXL1 (Rabbit polyclonal) | Thermo Fisher Scientific | Cat# PA5-64903; RRID:AB_2664737 | 1:50 |
| Antibody | anti-NCAM1 (Rabbit monoclonal) | Cell Signaling Technologies | Cat# 99,746T; RRID:AB_2868490 | 1:50 |
| Antibody | anti-FOXA2 (Mouse monoclonal) | Santa Cruz Technology | Cat# Sc-271103; RRID:AB_10614496 | 1:50 |
| Antibody | anti-SOX17 (Goat polyclonal) | R&D Systems | Cat# AF1924; RRID:AB_355060 | 1:200 |
| Antibody | anti-OCT4 (Mouse monoclonal) | Santa Cruz | Cat# sc-5279RRID:AB_628051 | 1:100 |
| Antibody | anti-CD13 APC-conjugated | BD Biosciences | Cat# 557454; RRID:AB_398624 | 1:10 |
| Antibody | Donkey anti-mouse IgG (H + L), Alexa Fluor 488 | Thermo Fisher Scientific | Cat# A21202; RRID:AB_141607 | 1:500 |
| Antibody | Donkey anti-rabbit IgG (H + L), Alexa Fluor 488 | Thermo Fisher Scientific | Cat# A21206; RRID:AB_2535792 | 1:500 |
| Antibody | Donkey anti-rabbit IgG (H + L), Alexa Fluor 568 | Thermo Fisher Scientific | Cat# A10042; RRID:AB_2757564 | 1:500 |
| Antibody | Donkey anti-goat IgG (H + L), Alexa Fluor 647 | Thermo Fisher Scientific | Cat# A21447; RRID:AB_141844 | 1:500 |
| Recombinant DNA protein | Activin A | R&D Systems | 338-AC-010 | |
| Recombinant DNA protein | Recombinant human BMP4 | R&D Systems | 314 BP | |
| Recombinant DNA protein | Recombinant human KGF | PeproTech | 100–19 | |
| Commercial assay, kit | High-Capacity cDNA Reverse Transcription kit | Applied Biosystems | 4368814 | |
| Commercial assay, kit | TaqMan Fast Advanced Master Mix | Thermo Fisher Scientific | 4444556 | |
| Commercial assay, kit | Fixable Violet Dead Cell Stain Kit | Thermo Fisher Scientific | L34955 | |
| Chemical compound, drugs | hESC-qualified Matrigel Basement Membrane Matrix | Corning | 354,234 | |
| Chemical compound, drugs | Growth Factor Reduced Basement Membrane Matrix | Corning | 354,230 | |
| Chemical compound, drugs | mTESR Plus | Stem Cell Technologies | 05825 | |
| Chemical compound, drugs | Dulbecco’s Phosphate-Buffered Saline (DPBS) | Corning | 45000–430 | |
| Chemical compound, drugs | ReLESR | Stem Cell Technologies | 05873 | |
| Chemical compound, drugs | StemPro Accutase Cell Dissociation Reagent | Thermo Fisher Scientific | A1110501 | |
| Chemical compound, drugs | RPMI1640 | Corning | 10–040-CV | |
| Chemical compound, drugs | GlutaMAX | Thermo Fisher Scientific | 35050061 | |
| Chemical compound, drugs | B-27 minus insulin Supplement | Thermo Fisher Scientific | A1895601 | |
| Chemical compound, drugs | B-27 Supplement (Complete) | Thermo Fisher Scientific | 12587–010 | |
| Chemical compound, drugs | TrypLE Express | Thermo Fisher Scientific | 12605028 | |
| Chemical compound, drugs | Hyclone FetalClone 1 Serum (U.S) | GE Healthcare | SH30080.03 | |
| Chemical compound, drugs | Y-27632 dihydrochloride | Cayman Chemical | 1000558310 | |
| Chemical compound, drugs | CHIR99021 | Reprocell | 04000402 | |
| Chemical compound, drugs | A8301 | Sigma Aldrich | SSML1314-1MG | |
| Chemical compound, drugs | DMH-1 | Tocris | 4126/10 | |
| Chemical compound, drugs | IWP4 | Tocris | 5214/10 | |
| Chemical compound, drugs | All-trans Retinoic Acid | Cayman | 11,017 | |
| Chemical compound, drugs | Dexamethasone | Sigma Aldrich | D4902 | |
| Chemical compound, drugs | 8-bromoadenosine 3’,5’-cyclic monophosphate sodium salt (cAMP) | Sigma Aldrich | B7880 | |
| Chemical compound, drugs | 3-Isobutyl-1-methylxanthine (IBMX) | Sigma Aldrich | I5879 | |
| Chemical compound, drugs | NSC668036 | Tocris | 5813/10 | |
| Chemical compound, drugs | PneumaCult-ALI Basal Medium | Stemcell Technologies | 05002 | |
| Chemical compound, drugs | PneumaCult-ALI Maintenance Supplement | Stemcell Technologies | 05006 | |
| Chemical compound, drugs | TRIzol Reagent | Thermo Fisher Scientific | 15596018 | |
| Chemical compound, drugs | Chloroform | Sigma-Aldrich | C2432 | |
| Chemical compound, drugs | Glycoblue | Thermo Fisher Scientific | AM9516 | |
| Chemical compound, drugs | Isopropanol | ACROS Organic | 327272500 | |
| Chemical compound, drugs | Ethanol 200 Proof | Pharmaco-AAPL | DSP-C7-18 | |
| Chemical compound, drugs | Methanol | Fisher Chemical | BPA412-1 | |
| Chemical compound, drugs | Paraformaldehyde | Sigma Aldrich | P6148-500G | |
| Chemical compound, drugs | Triton X-100 | Sigma Aldrich | X100-500ML | |
| Chemical compound, drugs | Bovine Serum Albumin | Fisher BioReagents | BP9706-100 | |
| Chemical compound, drugs | Phosphate Buffer Saline 20 X | Growcells | MRGF-695–010 L | |
| Chemical compound, drugs | Histoclear | Great Lakes | GL-1100–01 | |
| Chemical compound, drugs | Antigen Unmasking Solution, Citric Acid Based | Vector Laboratories | H-3300; RRID:AB_2336227 | |
| Chemical compound, drugs | DAPI-Fluoromount-G | Southern Biotech | 0100–20 | |
| Chemical compound, drugs | Hoechst 33,342 | Thermo Fisher Scientific | 62,249 | |
| Chemical compound, drugs | TrypLE Express Enzyme | Thermo Fisher Scientific | 12605010 | |
| Software | Image J | Version 1.8.0.182; RRID:SCR_003070 | ||
| Software | Flowjo | Version 7.6.1; RRID:SCR_008520 | ||
| Other | Transwell insert (0.4 μm) | Greiner Bio-One | 662,641 | |
| Other | Ultra-low adherence 24-well Plate | Greiner Bio-One | 662,970 | |
| Other | Ultra-low adherence 96-well Plate | Greiner Bio-One | 650,979 | |
| Other | Nanodrop 2000 Spectrophotometer | Thermo Fisher Scientific | ND2000CLAPTOP; RRID:SCR_018042 | |
| Other | EVOS FL Auto 2 Imaging System | Thermo Fisher Scientific | AMAFD2000 | |
| Other | CFX96 Touch Real-Time PCR Detection System | Bio-Rad | 1855196; RRID:SCR_018064 | |
| Other | ImmEdge Hydrophobic Barrier PAP Pen | Vector Laboratories | H-4000; RRID:AB_2336517 | |
| Other | HistoGel Specimen Processing Gel | Richard Allen Scientific | 11330057 |
Additional files
-
Supplementary file 1
Media Recipes/Composition.
- https://cdn.elifesciences.org/articles/67872/elife-67872-supp1-v2.docx
-
Transparent reporting form
- https://cdn.elifesciences.org/articles/67872/elife-67872-transrepform1-v2.docx
Download links
A two-part list of links to download the article, or parts of the article, in various formats.
Downloads (link to download the article as PDF)
Open citations (links to open the citations from this article in various online reference manager services)
Cite this article (links to download the citations from this article in formats compatible with various reference manager tools)
Recapitulating human cardio-pulmonary co-development using simultaneous multilineage differentiation of pluripotent stem cells
eLife 11:e67872.
https://doi.org/10.7554/eLife.67872


