Role of Nrp1 in controlling cortical inter-hemispheric circuits
- Department of Cellular and Molecular Biology, Centro Nacional de Biotecnología, Consejo Superior de Investigaciones Científicas (CNB-CSIC), Campus de Cantoblanco, Darwin, Spain
- Centro de Biología Molecular Severo Ochoa (CSIC/UAM), Campus de Cantoblanco, Nicolás Cabrera, Spain
Figures
Figure 1 with 1 supplement
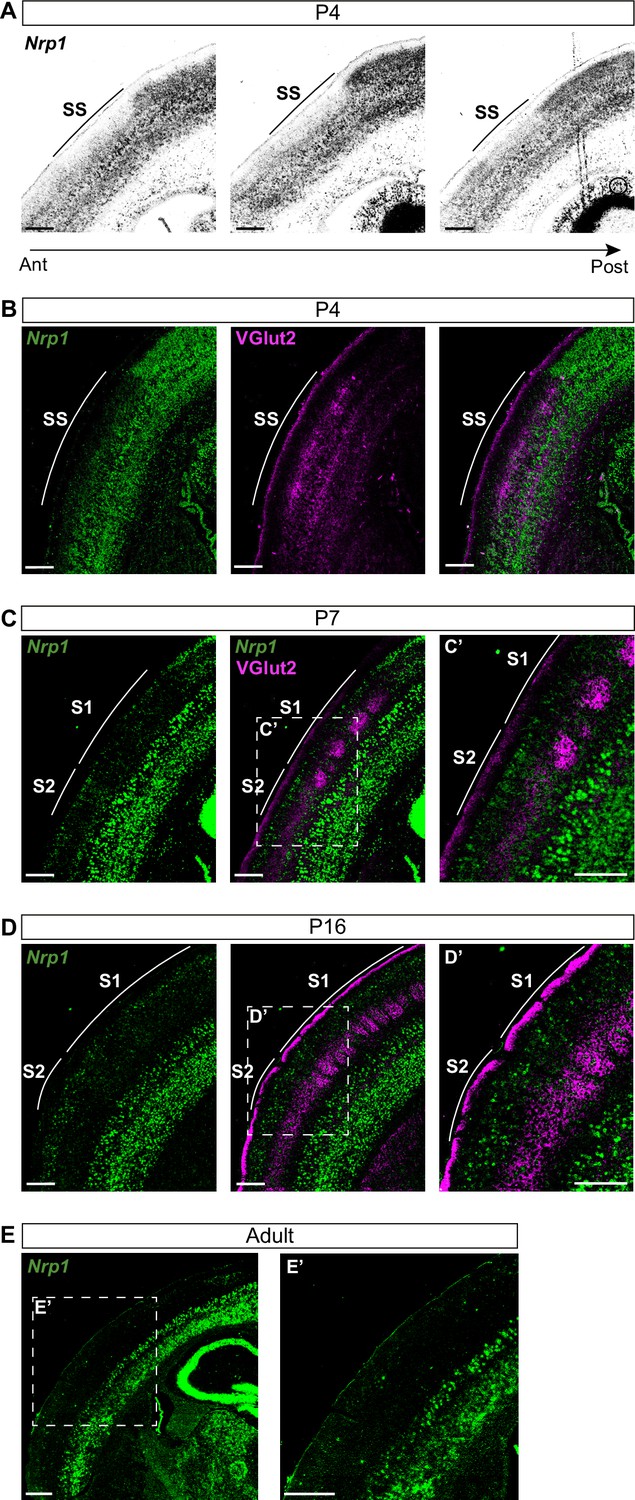
Nrp1 expression in somatosensory cortex during postnatal development.
(A) In situ hybridization (ISH) analysis of Nrp1 expression in coronal sections of P4 brain. (B–D) ISH in combination with fluorescent antibody staining of VGlut2. Green = Nrp1, Magenta = VGlut2. Scale bar = 300 µm. (B) Analysis of P4 brains. VGlut2 signal is located in the somatosensory (SS) area. (C) Sections of P7 brains. VGlut2 expression delimitates the barrel field area in S1. S2 is located lateral to the barrel field. (D) At P16, expression differences of Nrp1 in S1 and S2L2/3 neurons disappeared. (E) Nrp1 expression in brain sections of adult mice. The upper layers of the cortex lose Nrp1 expression in the SS cortex. Green = Nrp1. Scale bar = 500 µm.
Figure 1—figure supplement 1
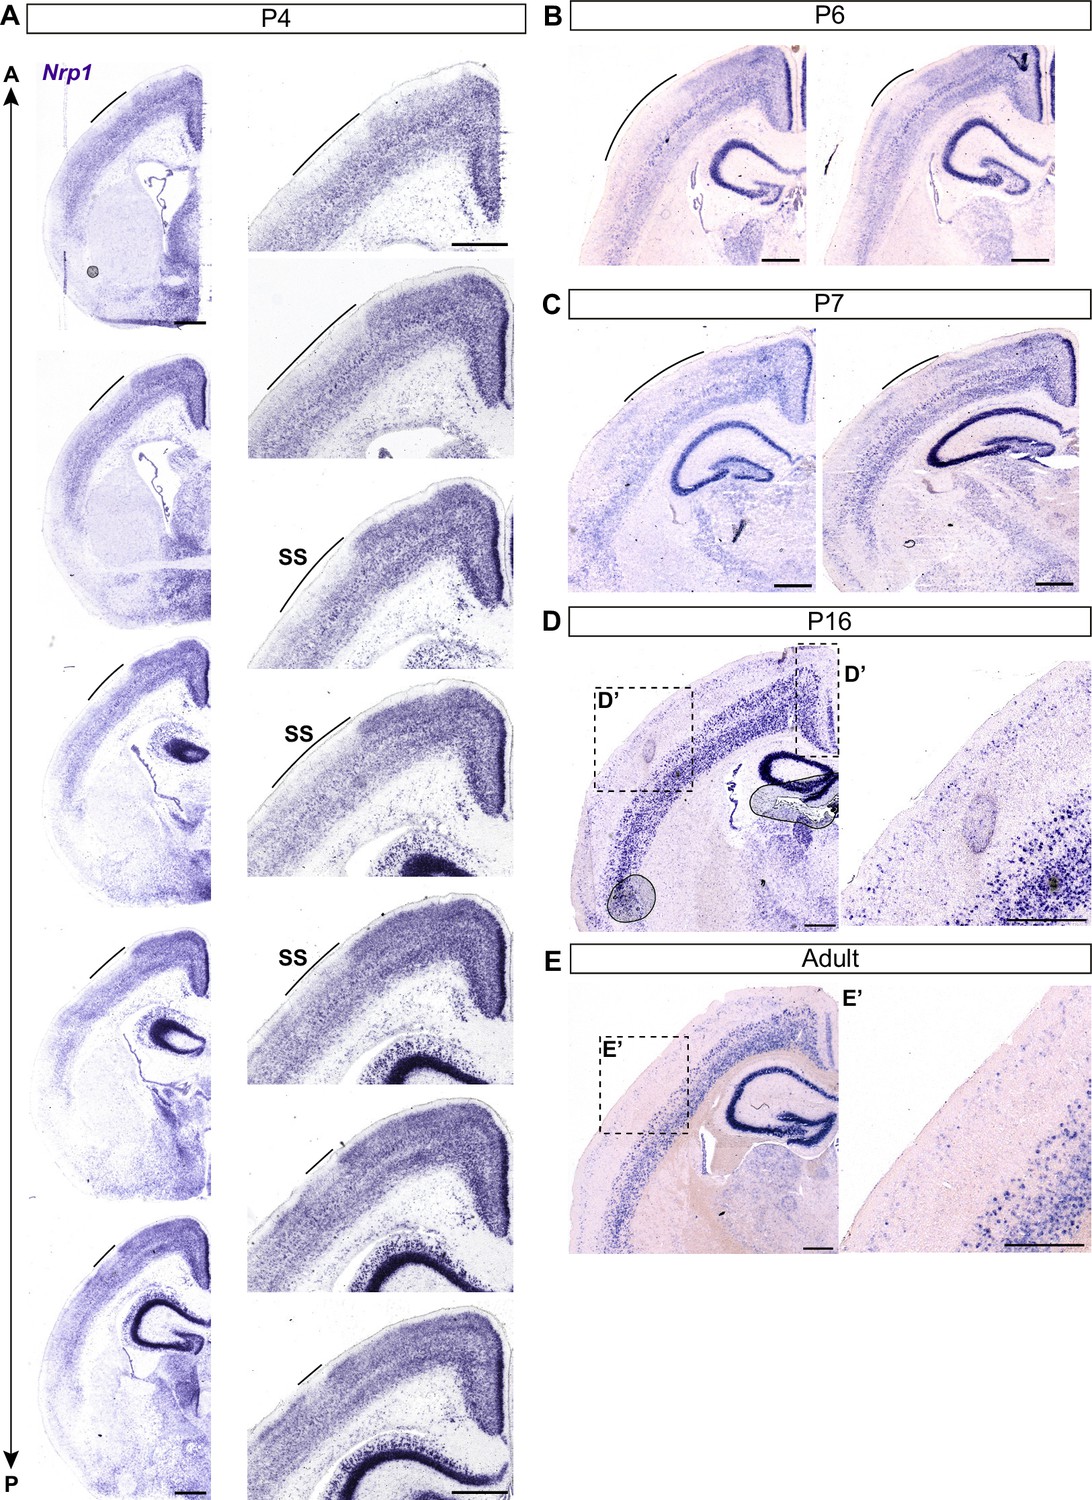
Nrp1 expression in the postnatal somatosensory cortex.
(A) In situ hybridization of Nrp1 in serial coronal sections of P4 brain. Nrp1 expression shows a discontinuity in the upper layers of the somatosensory cortex (Upper images: anterior, lower images: posterior). (B–E) Images showing in situ hybridization of Nrp1 in coronal sections of P6 brain (B), P7 (C), P16 (D), and adult brains (E). Scale bar = 500 µm. SS: somatosensory cortex.
Figure 2 with 3 supplements

Distribution of GFP+ callosal axons in the contralateral hemisphere after knocking down or over-expressing Nrp1.
(A) Scheme of the experimental approach. Callosal projections from electroporated L2/3 neurons establish the S1/S2 axonal column (blue arrow) and the S2 column (magenta arrow) in the non-electroporated hemisphere. (B) Confocal image of a coronal section of P30 control brain IUE at E15.5 with CAG-GFP. Dashed boxes indicate the divisions into the primary (S1) and secondary (S2) somatosensory cortex. + = GFP, Blue = DAPI. Scale bar = 500 µm. (C–E) High magnification images showing the contralateral hemisphere of P30 brains IUE with control plasmid (C), shNrp1 (D), or CAG-Nrp1 (E). GFP+ axons (green), S1/S2 (blue arrow), S2 columns (magenta arrow). Scale bar = 300 µm. (F–H) Quantifications of axonal distribution in the contralateral hemisphere. The left panels depict schemes showing the selected ROIs in which GFP+ is quantified (shaded areas). Graphs show values of GFP signal relative to the number of L2/3GFP+ neurons quantified in the opposite (ipsilateral) electroporated hemisphere of the same coronal section. Innervation values are normalized to the mean value of controls. Mean ± SEM (n = 8 mice, 2 sections per brain, in all conditions). S1/S2 column (blue arrow), S2 column (magenta arrow). Statistics (n total = 24): (F) One-way ANOVA: p-value = 0.3044 (n.s). (G) One-way ANOVA: p-value = 0.4762 (n.s.). (H) One-way ANOVA: p-value = 0.0003. Posthoc with Tukey’s test: * p-value Control – shNrp1 = 0.0157, *** p-value Control – CAG-Nrp1 = 0.0002. Source data are provided as a Source Data file.
-
Figure 2—source data 1
Raw data of measurements.
- https://cdn.elifesciences.org/articles/69776/elife-69776-fig2-data1-v1.xlsx
Figure 2—figure supplement 1

The electroporation of shNrp1 plasmid at E15.5 reduces the expression of Nrp1 transcripts in P16 brains.
(A) The efficiency of shRNA after IUE was assessed in the anterior cingulate cortex (ACC), a region expressing high levels of Nrp1. For this, shNrp1 plasmid was electroporated at E15.5 together with the CAG-GFP plasmid with the electrodes’ polarity inverted with respect to IUE in the SS to target the ACC. After the electroporation, the electroporated and non-electroporated areas were dissected, RNA extracted and transcript quantified by RT-q-PCR. Shaded boxes indicate the dissected areas. Green = GFP, Magenta = Nrp1. Scale bar = 300 µm. (B–C) Relative gene expression of GFP and Nrp1 in the ipsilateral -electroporated- and contralateral -non-electroporated- areas. Mean ± SEM (n = 3 mice). Statistics (n total = 6): (B) One-tailed t-test: p-value < 0.1 (#). (C) One-tailed t-test: p-value < 0,001 (***). Source data are provided as a Source Data file.
-
Figure 2—figure supplement 1—source data 1
Raw data of qPCR.
- https://cdn.elifesciences.org/articles/69776/elife-69776-fig2-figsupp1-data1-v1.xlsx
Figure 2—figure supplement 2
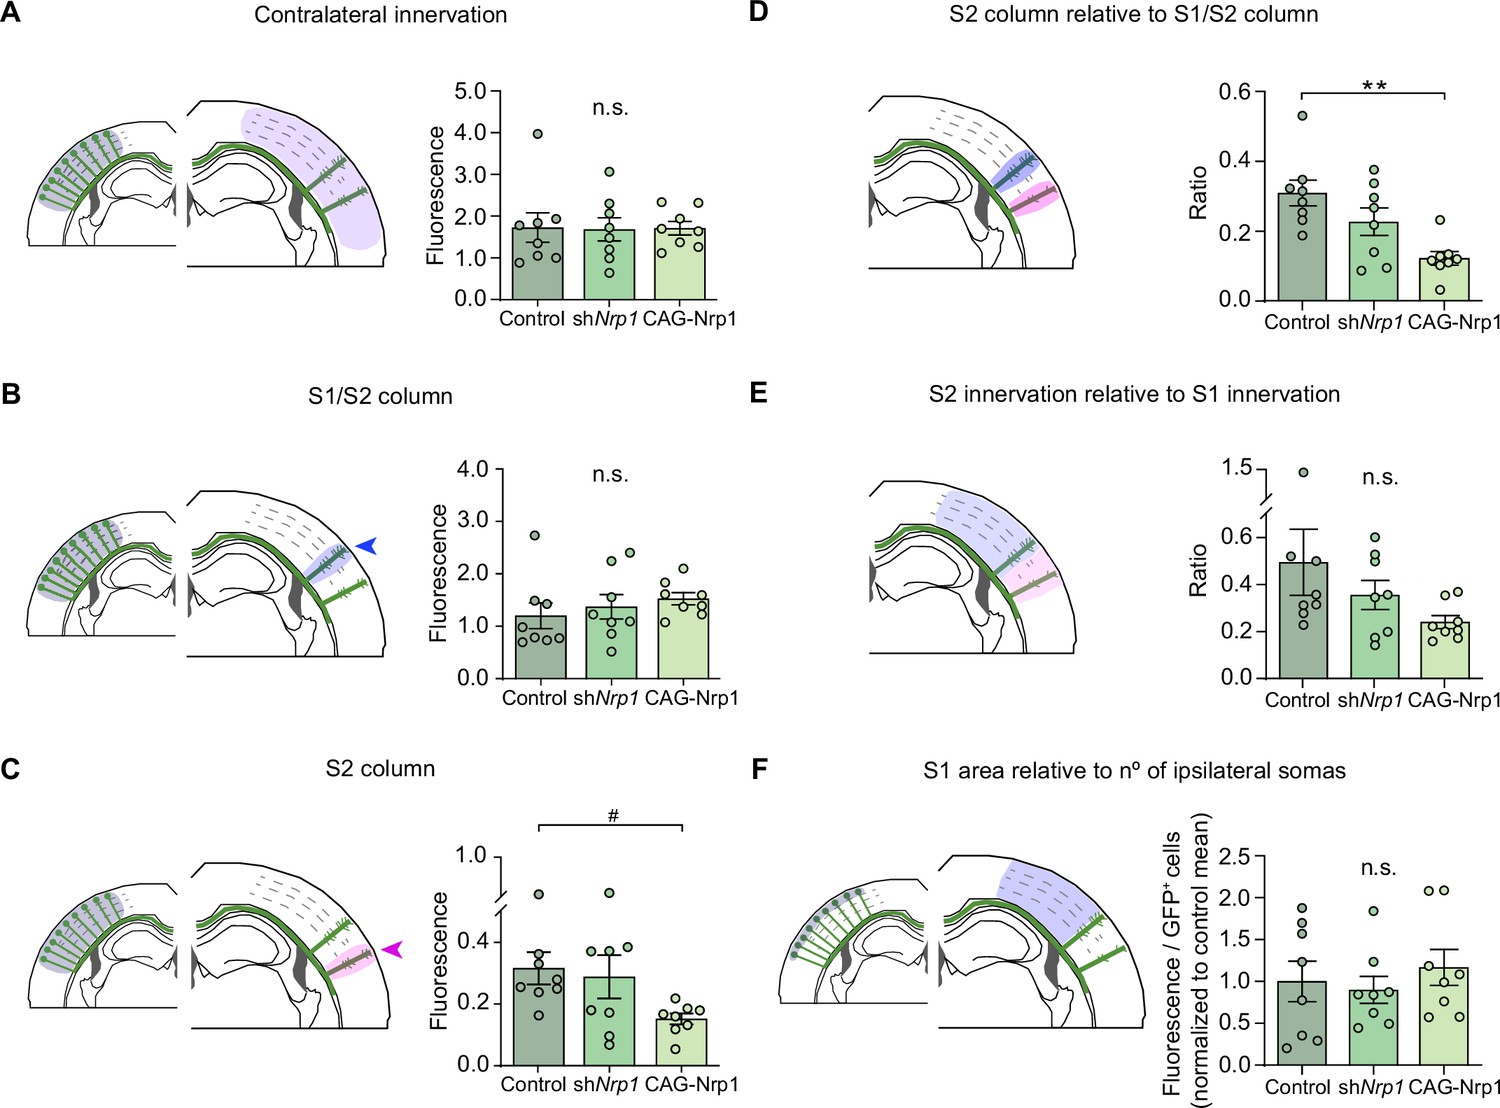
Analysis of contralateral innervation of SS cortex at P30 upon Nrp1 modifications.
(A–F) Quantification of axonal distribution in the contralateral hemisphere relative to ipsilateral fluorescence (A–C), contralateral fluorescence (D–E) or GFP+ neurons (F). The left panels depict schemes showing the selected ROIs in which fluorescence is quantified (shaded areas). Graphs show values of relative contralateral GFP innervation. Mean ± SEM (n = 8 mice per condition). Statistics (n total = 24): (A) One-way ANOVA: p-value = 0.9943 (n.s.). (B) One-way ANOVA: p-value = 0.5519 (n.s.). (C) One-way ANOVA: p-value < 0.1. Posthoc with Tukey’s test: # p-value Control – CAG-Nrp1 = 0.0849. (D) One-way ANOVA: p-value = 0.0025. Post-hoc with Tukey’s test: ** p-value Control – CAG-Nrp1 = 0.0017. (E) One-way ANOVA: p-value = 0.1620 (n.s.). (F) One-way ANOVA: p-value = 0.7564 (n.s.). Source data are provided as a Source Data file.
-
Figure 2—figure supplement 2—source data 1
Raw data of measurements.
- https://cdn.elifesciences.org/articles/69776/elife-69776-fig2-figsupp2-data1-v1.xlsx
Figure 2—figure supplement 3
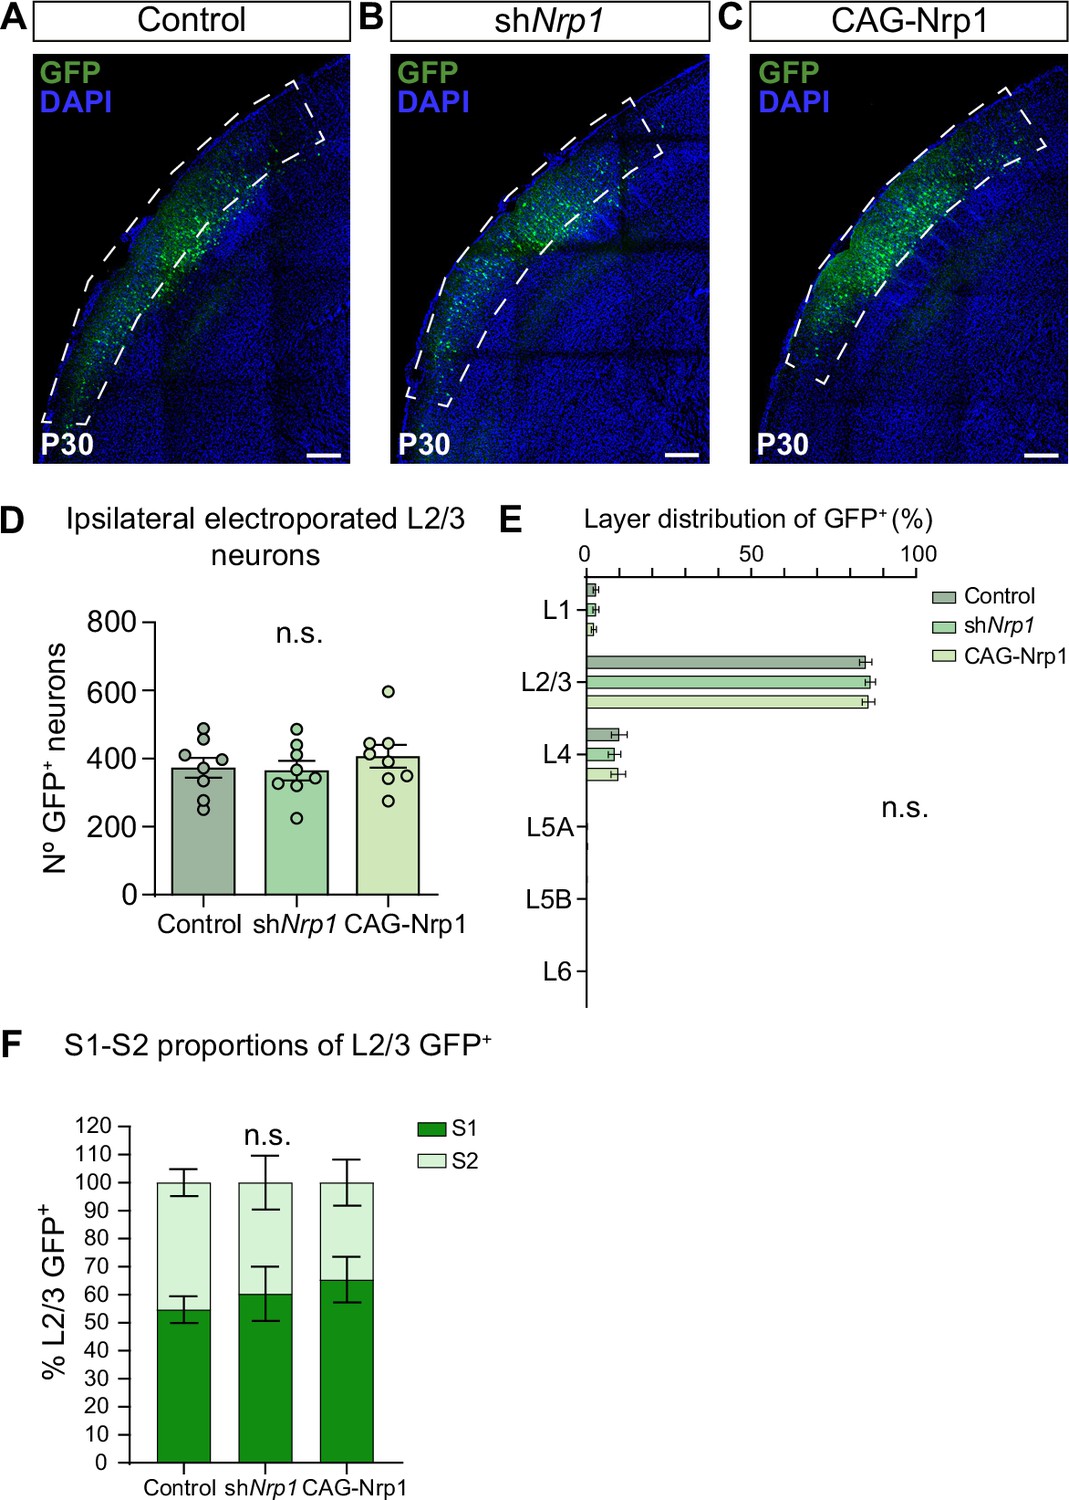
Quantification of GFP+ neurons in the electroporated hemisphere.
(A–C) Confocal images of the ipsilateral hemisphere of P30 brains electroporated at E15.5 Dashed boxes delineate the area containing L2/3 electroporated cells. Scale bar = 300 µm. (D) Quantification of the number of L2/3 GFP+ neurons in P30 brains. Mean ± SEM (n = 8 mice per condition). One-way ANOVA (n total = 24): p-value = 0.6039 (n.s.). (E) Quantification of the proportion of GFP+ neurons along cortical layers at P30 in all conditions. Mean ± SEM (n = 8 mice per condition). Two-way ANOVA (n total = 24): p-value > 0.9999 (n.s.). (F) Proportions of L2/3 GFP+ at P30. Graphs show the percentage of S1 and S2 in the electroporated population. Mean ± SEM (n = 8 mice per condition). Two-way ANOVA (n total = 24): p-value > 0.9999 (n.s.). Source data are provided as a Source Data file.
-
Figure 2—figure supplement 3—source data 1
Raw data-countings.
- https://cdn.elifesciences.org/articles/69776/elife-69776-fig2-figsupp3-data1-v1.xlsx
Figure 3 with 3 supplements
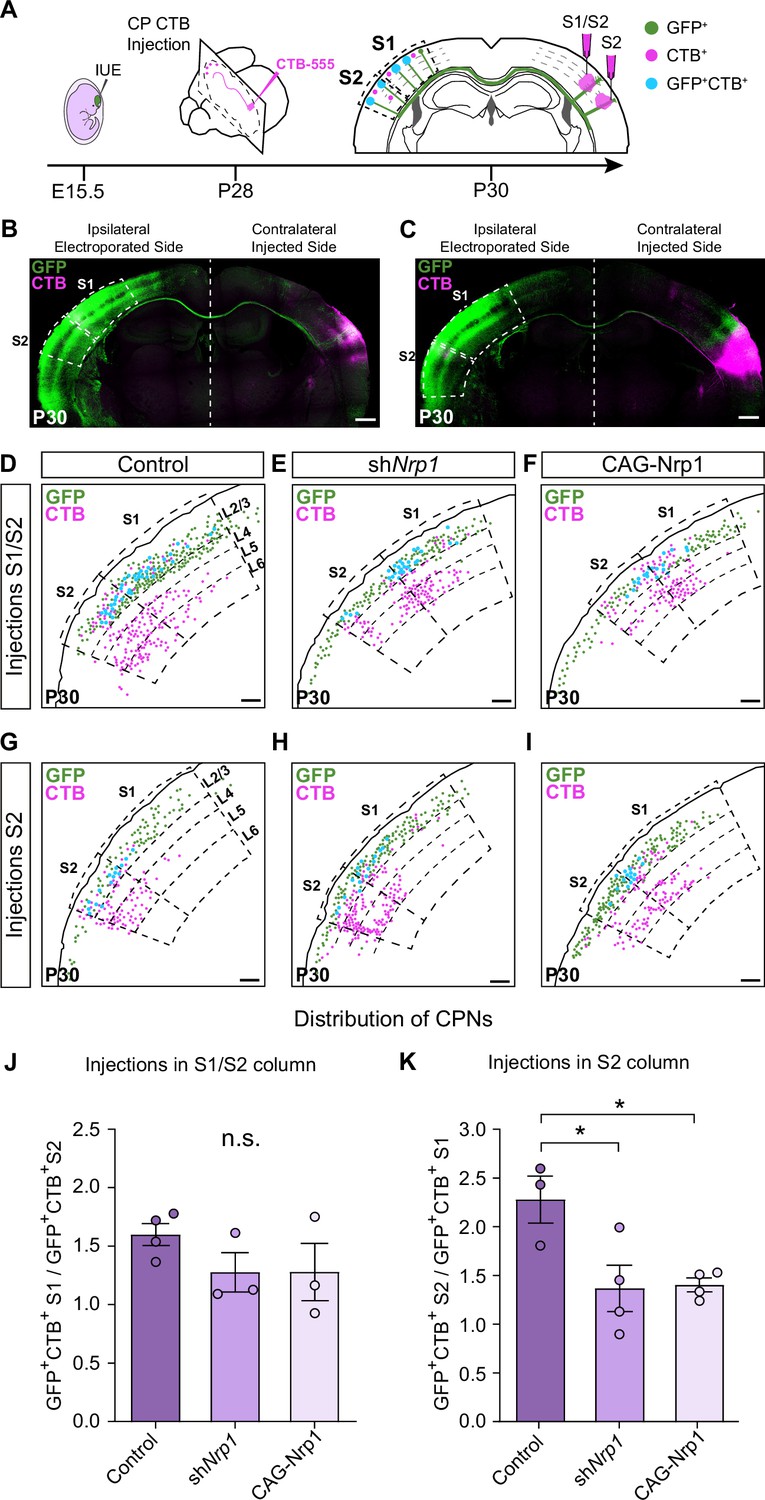
Analysis of homotopic and heterotopic projections in control, shNrp1, and CAG-Nrp1 IUE brains.
(A) Experimental workflow. After IUE at E15.5, brains are stereotaxically injected with CTB in the cortical plate (CP). Separate animals are injected in the S1/S2 column or the S2 column at P28 and 2 days after (P30) the numbers of GFP+CTB+ CPNs are quantified in the S1 and S2 areas of the electroporated hemisphere. (B–C) Tilescan images of control IUE brains injected in S1/S2 (B) or S2 (C). Green = GFP, Magenta = CTB. Scale bar = 500 µm. (D–I) Representative examples of the analysis reporting the location of GFP+ (green dots), CTB+ (magenta dots), and GFP+CTB+ (blue dots) neurons in injected brains as in (A). Scale bar = 300 µm. (J) Quantification of the distribution of GFP+CTB+ cells in brains injected in the S1/S2 column. The values represent the number of GFP+CTB+ cells in S1 divided by the number of GFP+CTB+ cells in S2 in the same section. Mean ± SEM (n ≥ 3 mice, ≥ 2 sections per brain, in all conditions). One-way ANOVA (n total = 10): p-value = 0.3155 (n.s.). (K) Quantification of the distribution of GFP+CTB+ cells in brains injected in S2. The values represent the ratio of the number of GFP+CTB+ in S2 divided by the number of GFP+CTB+ cells in S1 in the same section. Mean ± SEM (n ≥ 3 mice, ≥ 2 sections per brain, in all conditions). One-way ANOVA (n total = 11): p-value = 0.0218. Posthoc with Tukey’s test: * p-value Control – shNrp1 = 0.0288; * p-value Control – CAG-Nrp1 = 0.0346. Source data are provided as a Source Data file.
-
Figure 3—source data 1
Raw data-countings.
- https://cdn.elifesciences.org/articles/69776/elife-69776-fig3-data1-v1.xlsx
Figure 3—figure supplement 1
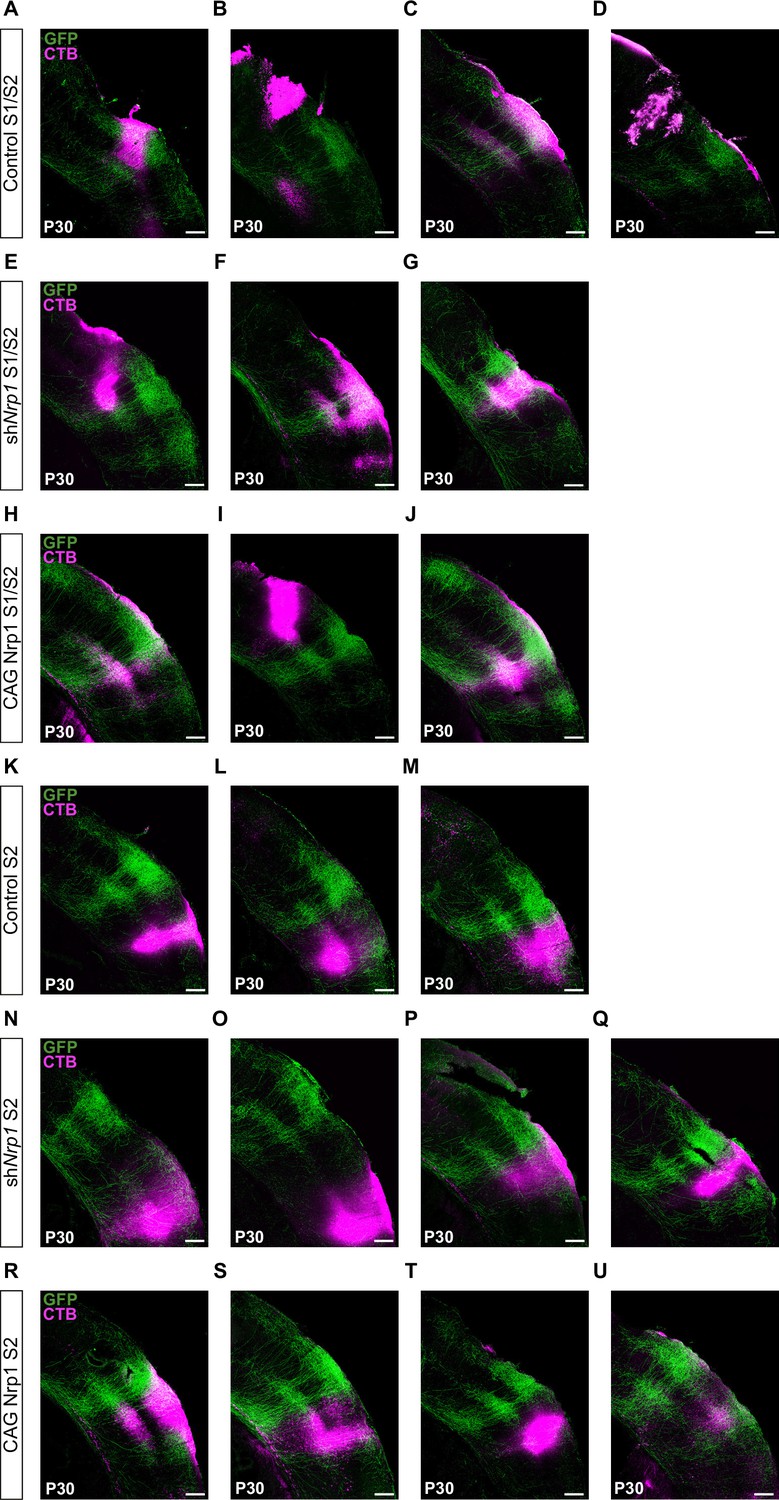
Images of the injection sites in stereotaxic surgeries.
Merged images of GFP (Green) and CTB (magenta) signal in injected electroporated brains sections. (A–J) Injections in S1/S2. (K–U) Injections in S2. Scale bar = 300 µm.
Figure 3—figure supplement 2
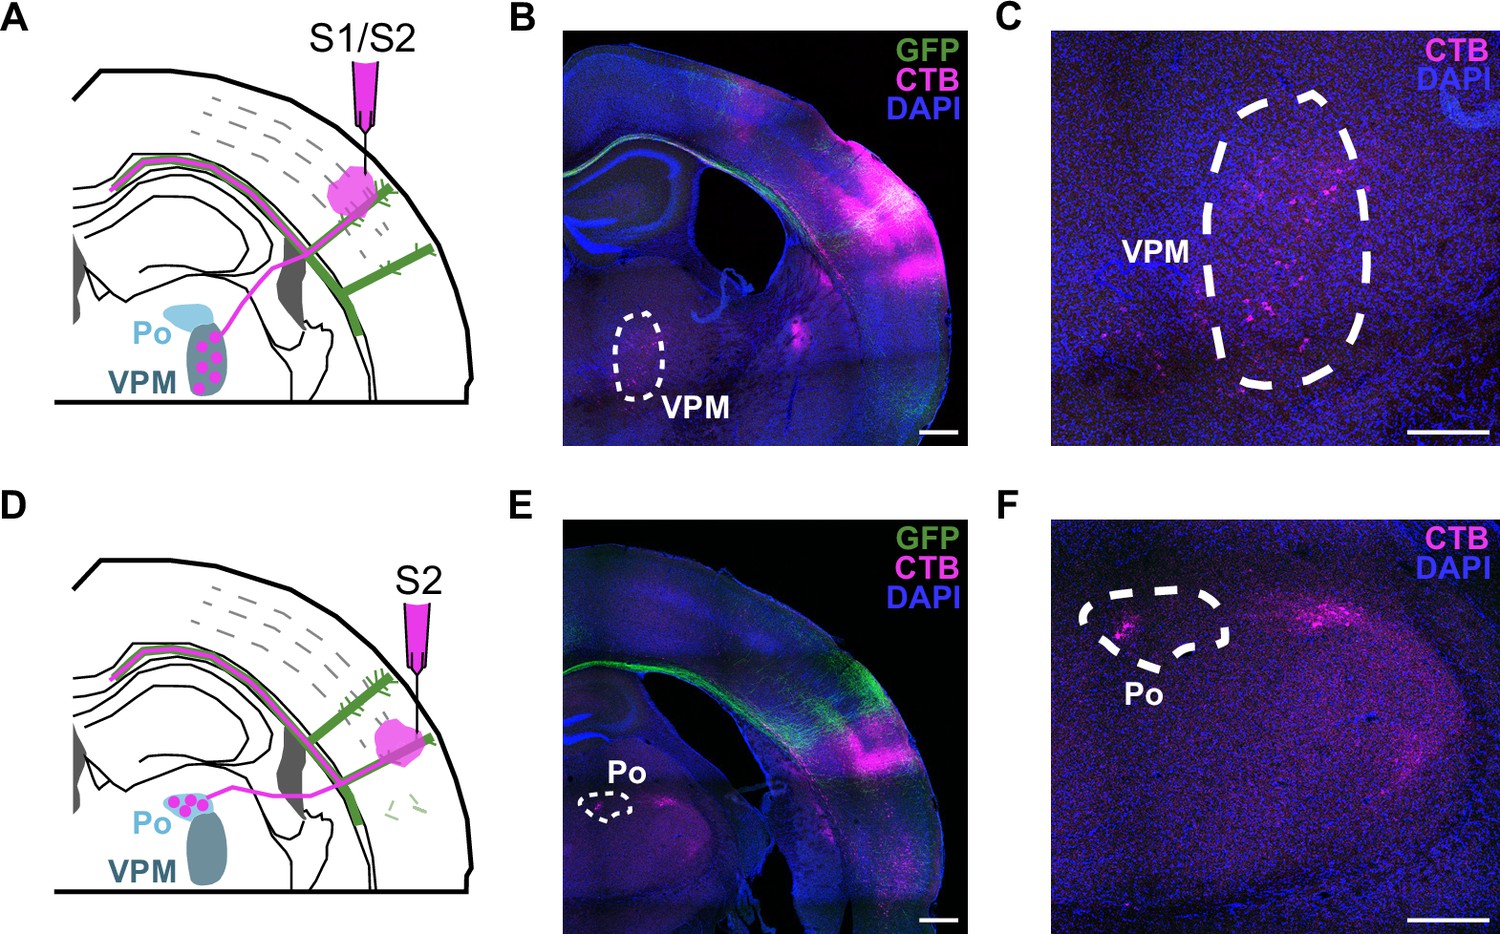
The whole image of a coronal section-including the thalamus-for the retrospective control of stereotaxic injections.
(A) Schematic drawing of a P30 coronal section after injection in the S1/S2 column. Thalamus nucleus VPM (ventral posteromedial nuclei) neurons project thalamocortical axons to the S1/S2 column. (B) Merged image of a coronal section of a brain injected in S1/S2. Dashed line marks VPM, where thalamic neurons are CTB+. Scale bar = 500 µm. (C) Detail of VPM nucleus. Scale bar = 200 µm. (D) Scheme of a P30 coronal section of a brain injected in the S2 column. Thalamus nucleus Po (posterior nucleus) extends thalamocortical axons to the S2 column. (E) Merged image of a coronal section of an S2 injected brain. Dashed line marks Po, where thalamic neurons are CTB+. Scale bar = 500 µm. (F) Detail of Po nucleus. Scale bar = 200 µm. (A–F) Green = GFP, Magenta = CTB, Blue = DAPI.
Figure 3—figure supplement 3
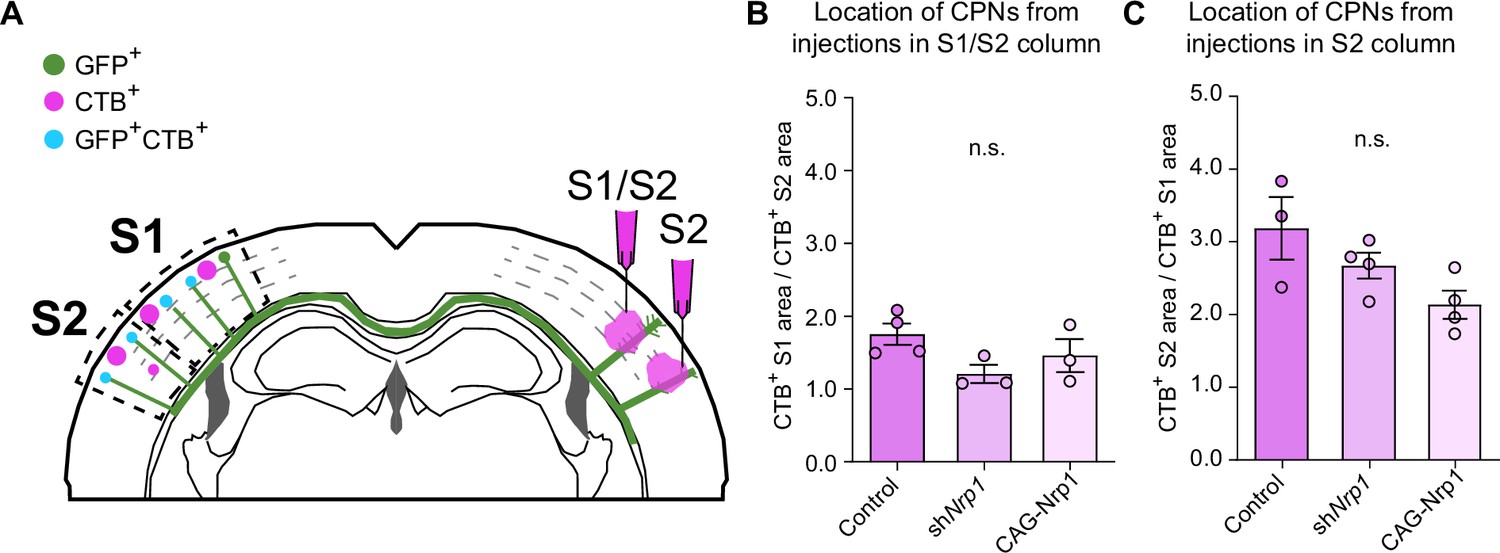
Analysis of the location of CPNs in the somatosensory cortex of electroporated brains.
(A) Scheme of the experimental design showing a coronal section of a brain electroporated at E15.5 showing the alternative injection sites in the SS cortex for the analysis of CPNs. Injections were made in the S1/S2 column in one group and the S2 column in the other. (B–C) The number of CTB+ cells in the S1 and S2 areas were quantified in each section and expressed as ratios. Quantification of CTB+ CPNs from injections in S1/S2 column (B) and S2 column (C). For the S1/S2 injections, the ratio is the number of CTB+ neurons in S1 divided by the number of CTB+ neurons in S2. For S2 injections, the ratio expresses the number of CTB+ neurons in S2 divided by CTB+ neurons in S1. Mean ± SEM (n ≥ 3 mice per condition). Statistics: (B) One-way ANOVA (n total = 10): p-value = 0.1322 (n.s.). (C) One-way ANOVA (n total = 11): p-value = 0.0644 (n.s.). Source data are provided as a Source Data file.
-
Figure 3—figure supplement 3—source data 1
Raw data-countings.
- https://cdn.elifesciences.org/articles/69776/elife-69776-fig3-figsupp3-data1-v1.xlsx
Figure 4 with 3 supplements

Comparisons of the postnatal changes of contralateral axons during the P10 to P30 window upon manipulations in Nrp1 expression.
(A) Schematic representation of contralateral innervation dynamics during postnatal development. (B–G) Tilescan images of the contralateral hemisphere of IUE brains analyzed at P10 and P16. Blue arrow = S1/S2 column. Magenta arrow = S2 column. Green = GFP. Scale bar = 300 µm. (H–K) Quantifications of GFP+ innervation in the indicated area. GFP values are expressed relative to the number of L2/3 GFP+ neurons in the electroporated hemisphere and normalized to the mean value of P10 control. Mean ± SEM (n ≥ 3 mice, 2 sections per brain, in all conditions). Statistics (n total = 47): (H) Two-way ANOVA: p-value Dynamics of contralateral innervation = 0.3938; p-value Postnatal day = 0.6903; p-value Experimental condition = 0.0010. Posthoc with Tukey’s test: * p-value Control P16 – shNrp1 P16 = 0.0156; ## p-value Control P16 – CAG-Nrp1 P16 = 0.0037. (I) Two-way ANOVA: p-value Dynamics of S1/S2 column = 0.4979; p-value Postnatal day = 0.6520; p-value Experimental condition = 0.0125. Posthoc with Tukey’s test: # p-value Control P16 – CAG-Nrp1 P16 = 0.0157. (J) Two-way ANOVA: p-value Dynamics of S2 column <0.0001; p-value Postnatal day = 0.0078; p-value Experimental condition <0.0001. Posthoc with Tukey’s test: **** p-value Control P16 – shNrp1 P16 <0.0001; #### p-value Control P16 – CAG-Nrp1 P16 <0.0001; ** p-value Control P30 – shNrp1 P30 = 0.0022; #### p-value Control P30 – CAG-Nrp1 P30 <0.0001. (K) Two-way ANOVA: p-value Dynamics S2 column relative to S1/S2 column = 0.0057; p-value Postnatal day = 0.2288; p-value Experimental condition = 0.0737. Posthoc with Tukey’s test: * p-value Control P16 – shNrp1 P16 = 0.0392; ### p-value Control P30 – CAG-Nrp1 P30 = 0.0002; § p-value shNrp1 P30 – CAG-Nrp1 P30 = 0.0446. Data for P30 are from Figure 2 and Figure 2—figure supplement 2. Source data are provided as a Source Data file.
-
Figure 4—source data 1
Raw data of measurements.
- https://cdn.elifesciences.org/articles/69776/elife-69776-fig4-data1-v1.xlsx
Figure 4—figure supplement 1
Quantification of GFP+ neurons in the electroporated hemisphere and rostro-caudal classification of analyzed sections.
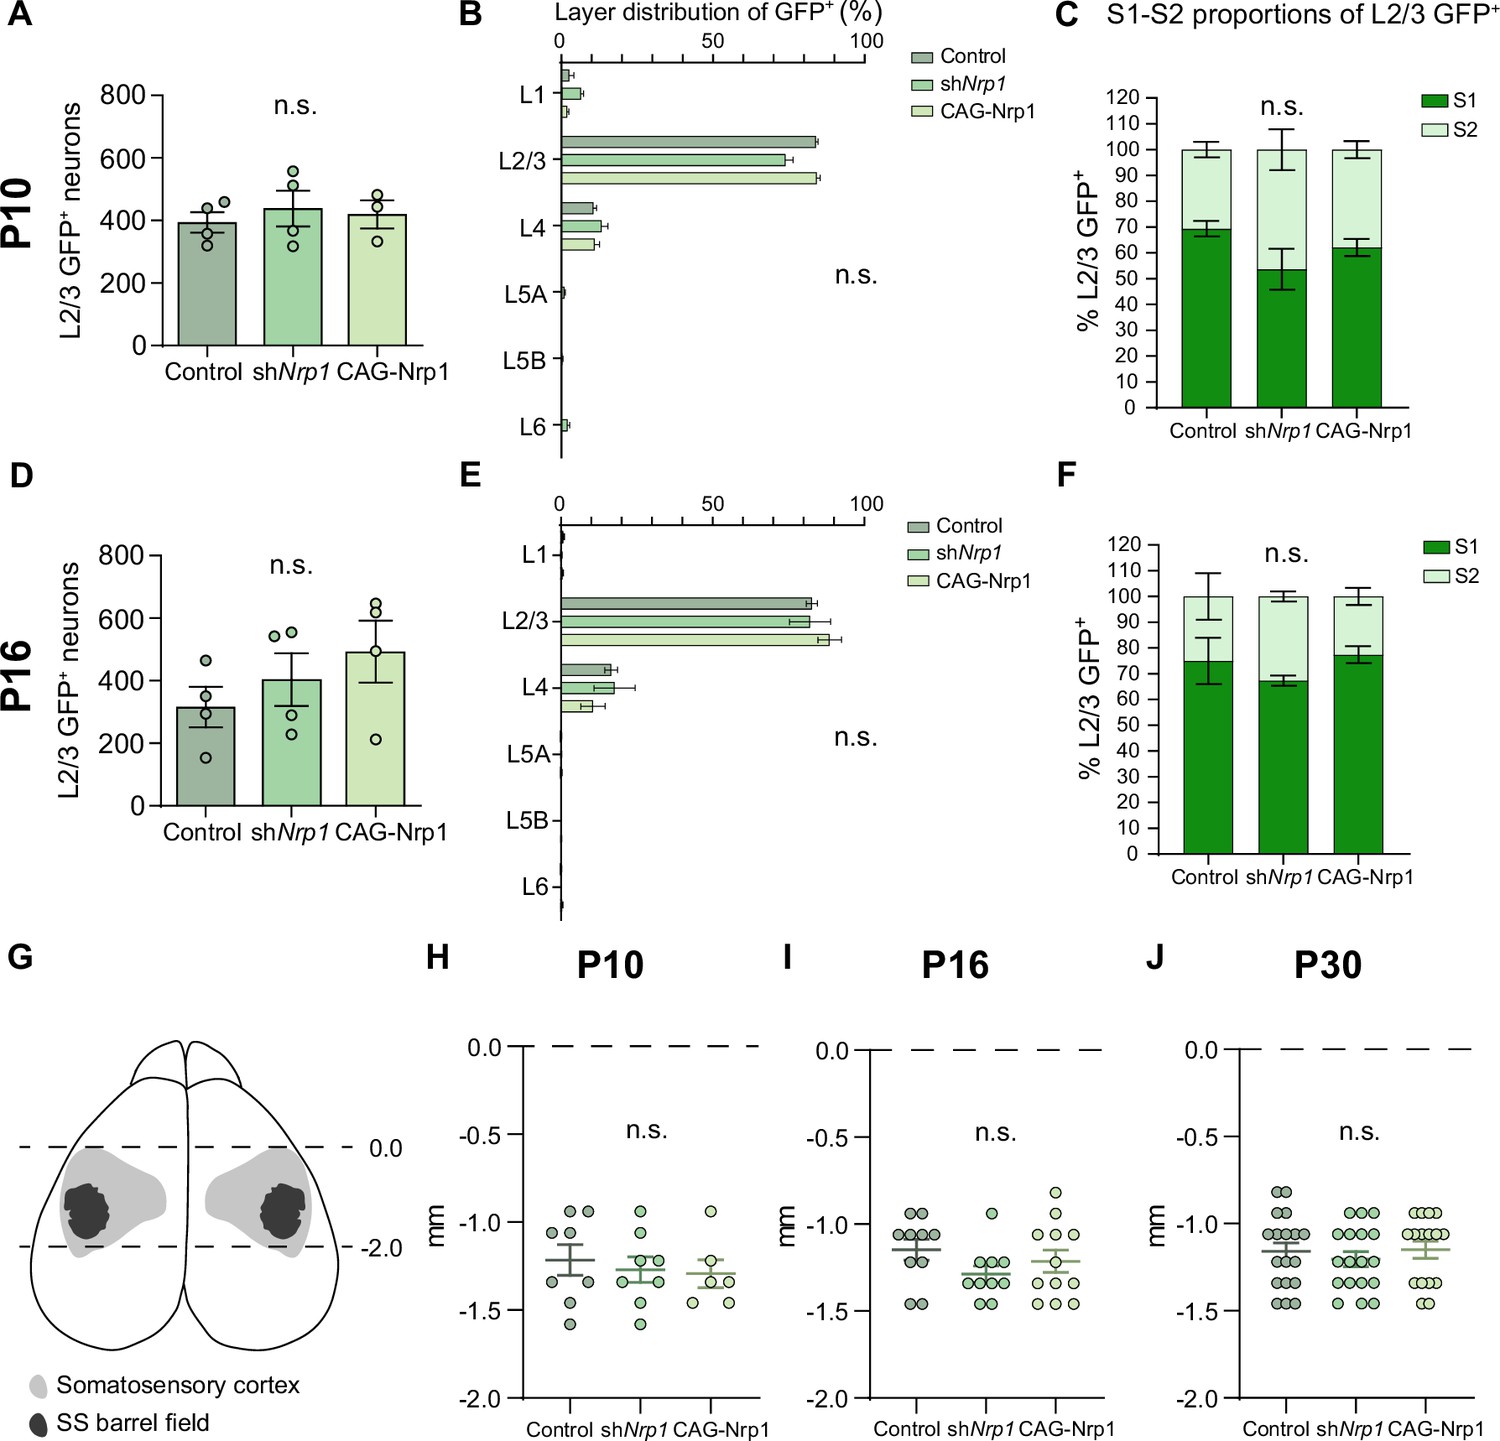
(A) Total number of L2/3 GFP+ neurons at P10. Mean ± SEM (n ≥ 3 mice per condition). One-way ANOVA (n total = 11): p-value = 0.7856 (n.s.). (B) Quantification of the proportion of GFP+ neurons along cortical layers at P10 in all conditions. Mean ± SEM (n ≥ 3 mice per condition). Two-way ANOVA: p-value > 0.9999 (n.s.). (C) Proportions of L2/3 GFP+ at P10. Graphs show the percentage of S1 and S2 in the electroporated population. Mean ± SEM (n ≥ 3 mice per condition). Two-way ANOVA (n total = 11): p-value > 0.9999 (n.s.). (D) Total number of L2/3 GFP+ neurons at P16. Mean ± SEM (n = 4 mice per condition). One-way ANOVA (n total = 12): p-value = 0.3699 (n.s.). (E) Quantification of the proportion of GFP+ neurons along cortical layers at P16 in all conditions. Mean ± SEM (n = 4 mice per condition). Two-way ANOVA: p-value > 0.9999 (n.s.). (F) Proportions of L2/3 GFP+ at P16. Graphs show the percentage of S1 and S2 in the electroporated population. Mean ± SEM (n = 4 mice per condition). Two-way ANOVA (n total = 12): p-value > 0.9999 (n.s.). (G) Somatosensory cortex is found between stereotaxic coordinates Bregma 0.0 and –2.0 mm. Scheme depicts a horizontal view of mouse brain with SS cortex and SS barrel field location. (H–J) Classification of all sections analyzed with respect to Bregma (0.0 mm). (H) Coronal sections at P10. Mean ± SEM (n ≥ 3 mice per condition). One-way ANOVA (n total = 22): p-value = 0.7867 (n.s.). (I) Coronal sections at P16. Mean ± SEM (n ≥ 5 mice per condition). One-way ANOVA (n total = 32): p-value = 0.2763 (n.s.). (J) Coronal sections at P30. Mean ± SEM (n ≥ 8 mice per condition). One-way ANOVA (n total = 52): p-value = 0.6850 (n.s.). Source data are provided as a Source Data file.
-
Figure 4—figure supplement 1—source data 1
Raw data-countings and sterotaxic coordinates.
- https://cdn.elifesciences.org/articles/69776/elife-69776-fig4-figsupp1-data1-v1.xlsx
Figure 4—figure supplement 2
Analysis of contralateral innervation of SS cortex at P10 and P16 upon Nrp1 modifications.
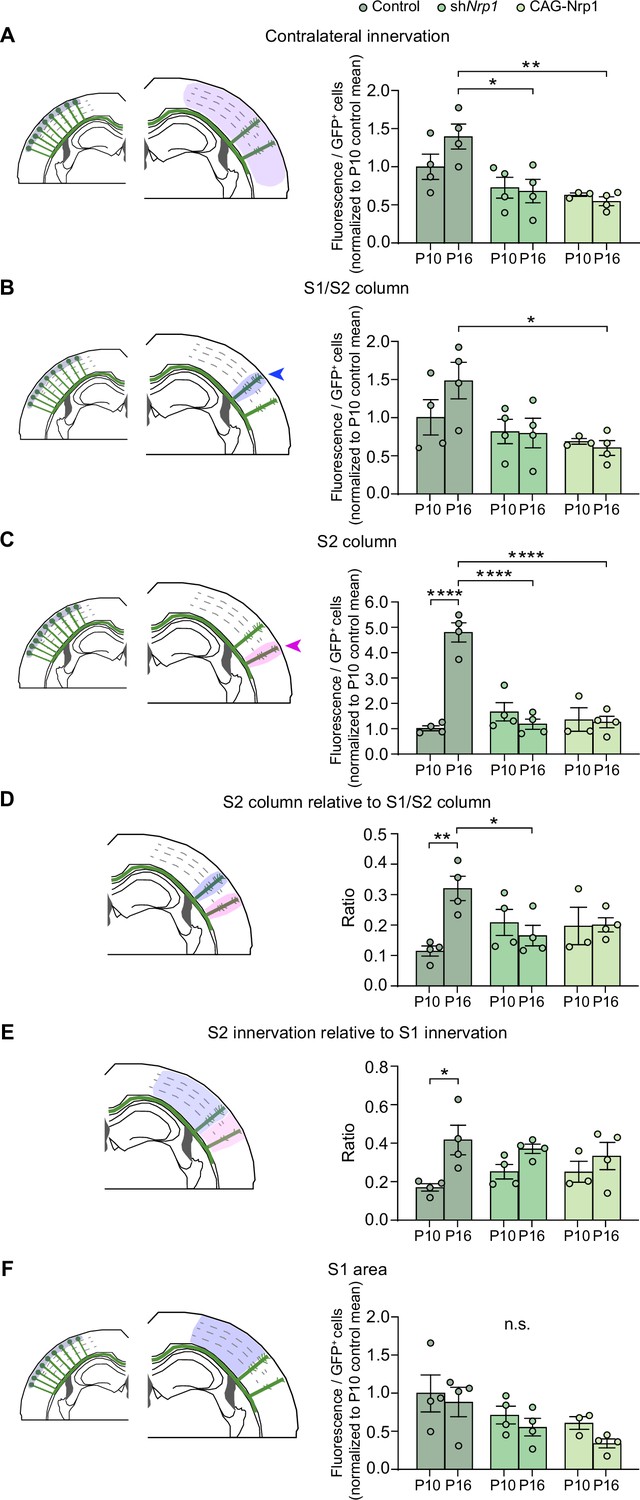
(A–F) Quantifications of axonal distribution in the contralateral hemisphere. The left panels depict schemes shaded areas show the selected ROIs in which GFP+ cells and contralateral axons are quantified. Graphs on the right show values of relative contralateral GFP innervation. Mean ± SEM (n ≥ 3 mice, per condition). Statistics (n = 23): (A) Two-way ANOVA: p-value Dynamics of contralateral innervation = 0.1767; p-value Postnatal day = 0.4462; p-value Experimental condition = 0.0008. Posthoc with Tukey’s test: * p-value Control P16 – shNrp1 P16 = 0.0153; ** p-value Control P16 – CAG-Nrp1 P16 = 0.0036. (B) Two-way ANOVA: p-value Dynamics of S1/S2 column = 0.2626; p-value Postnatal day = 0.4021; p-value Experimental condition = 0.0133. Posthoc with Tukey’s test: * p-value Control P16 – CAG-Nrp1 P16 = 0.0297. (C) Two-way ANOVA: p-value Dynamics of S2 column <0.0001; p-value Postnatal day = 0.0004; p-value Experimental condition <0.0001. Posthoc with Tukey’s test: **** p-value Control P10 – Control P16 <0.0001; **** p-value Control P16 – shNrp1 P16 <0.0001; **** p-value Control P16 – CAG-Nrp1 P16 <0.0001. (D) Two-way ANOVA: p-value Dynamics S2 column relative to S1/S2 column = 0.0071; p-value Postnatal day = 0.0860; p-value Experimental condition = 0.7033. Posthoc with Tukey’s test: ** p-value Control P10 – Control P16 <0.0092; * p-value Control P16 – shNrp1 P16 <0.0166. (E) Two-way ANOVA: p-value Dynamics S2 innervation relative to S1 innervation = 0.2739; p-value Postnatal day = 0.0030; p-value Experimental condition = 0.9229. Posthoc with Tukey’s test: * p-value Control P10 – Control P16 = 0.0325. (F) Two-way ANOVA: p-value Dynamics S1 area = 0.8887 (n.s.); p-value Postnatal day = 0.1726 (n.s.); p-value Experimental condition = 0.0252 (n.s.). Source data are provided as a Source Data file.
-
Figure 4—figure supplement 2—source data 1
Source data file for Figure 4—figure supplement 2.
Raw data of measurements.
- https://cdn.elifesciences.org/articles/69776/elife-69776-fig4-figsupp2-data1-v1.xlsx
Figure 4—figure supplement 3
Analysis of the dorsoventral distribution of axons at the midline.
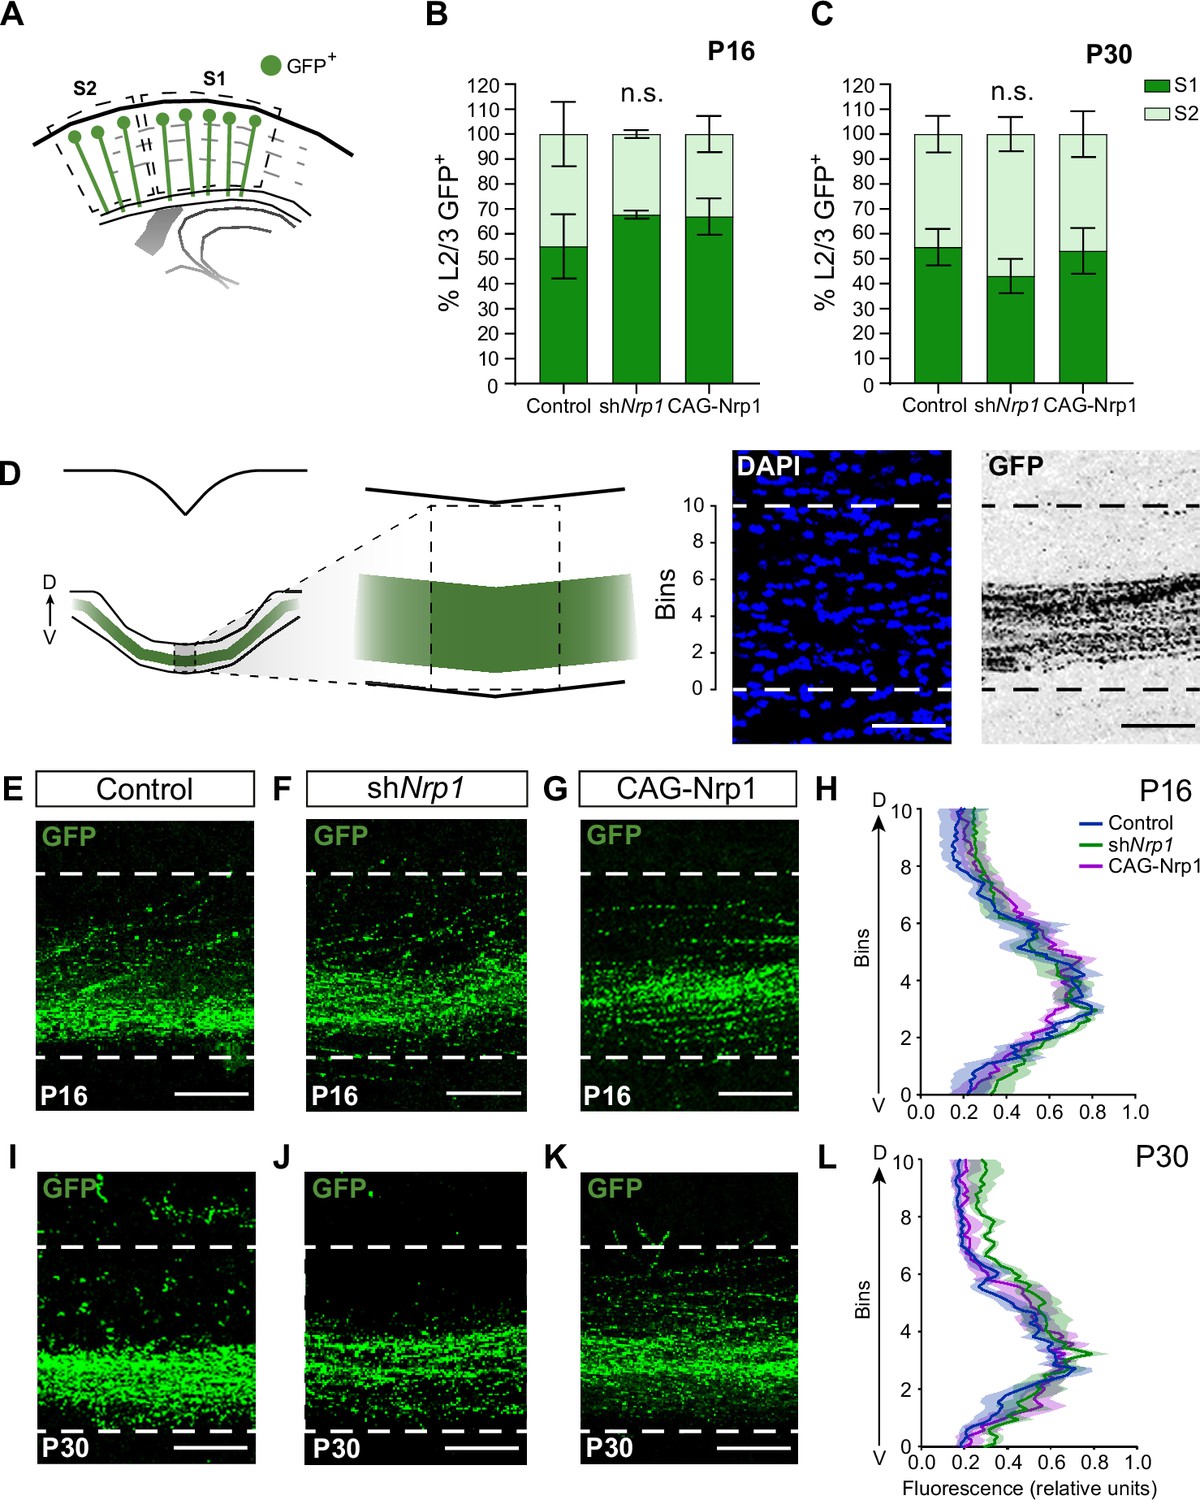
(A) Quantification of L2/3 GFP+ neurons in S1 and S2 areas in the ipsilateral electroporated hemisphere demonstrating similar distributions in S1 and S2 of the electroporated neurons. (B–C) Percentage of GFP+ neurons in S1 and S2 at P16 (B) and P30 (C). Mean ± SEM (n ≥ 3 mice per condition). Statistics (n total = 21): (B) Two-way ANOVA: p-value Experimental condition >0.9999 (n.s.), (C) Two-way ANOVA: p-value Experimental condition >0.9999 (n.s.). (D) The left panel depicts the scheme of the analysis of the distribution of axons at the midline. The right panel shows the ROI divided into 10 equal bins for quantification. DAPI = blue. GFP = gray. Scale bar = 50 µm. (E–G) Images of the CC at the midline in P16 brains. Green = GFP. Scale bar = 50 µm. (H) Quantification of the dorsoventral distribution of GFP signal at P16 (ventral position, bins 0; dorsal position, bins 10). Mean (line)± SEM (shade) (n ≥ 3 mice per condition). Two-way ANOVA (n total = 10): p-value CC distribution >0.9999. (I–K) Images of the CC at the midline in P30 brains. Green = GFP. Scale bar = 50 µm. (L) Quantification of the dorsoventral distribution of GFP signal at P30 (ventral position, bins 0; dorsal position, bins 10). Mean (line)± SEM (shade) (n ≥ 3 mice per condition). Two-way ANOVA (n total = 11): p-value CC distribution >0.9999. Source data are provided as a Source Data file.
-
Figure 4—figure supplement 3—source data 1
Raw data of measurements.
- https://cdn.elifesciences.org/articles/69776/elife-69776-fig4-figsupp3-data1-v1.xlsx
Figure 5 with 2 supplements
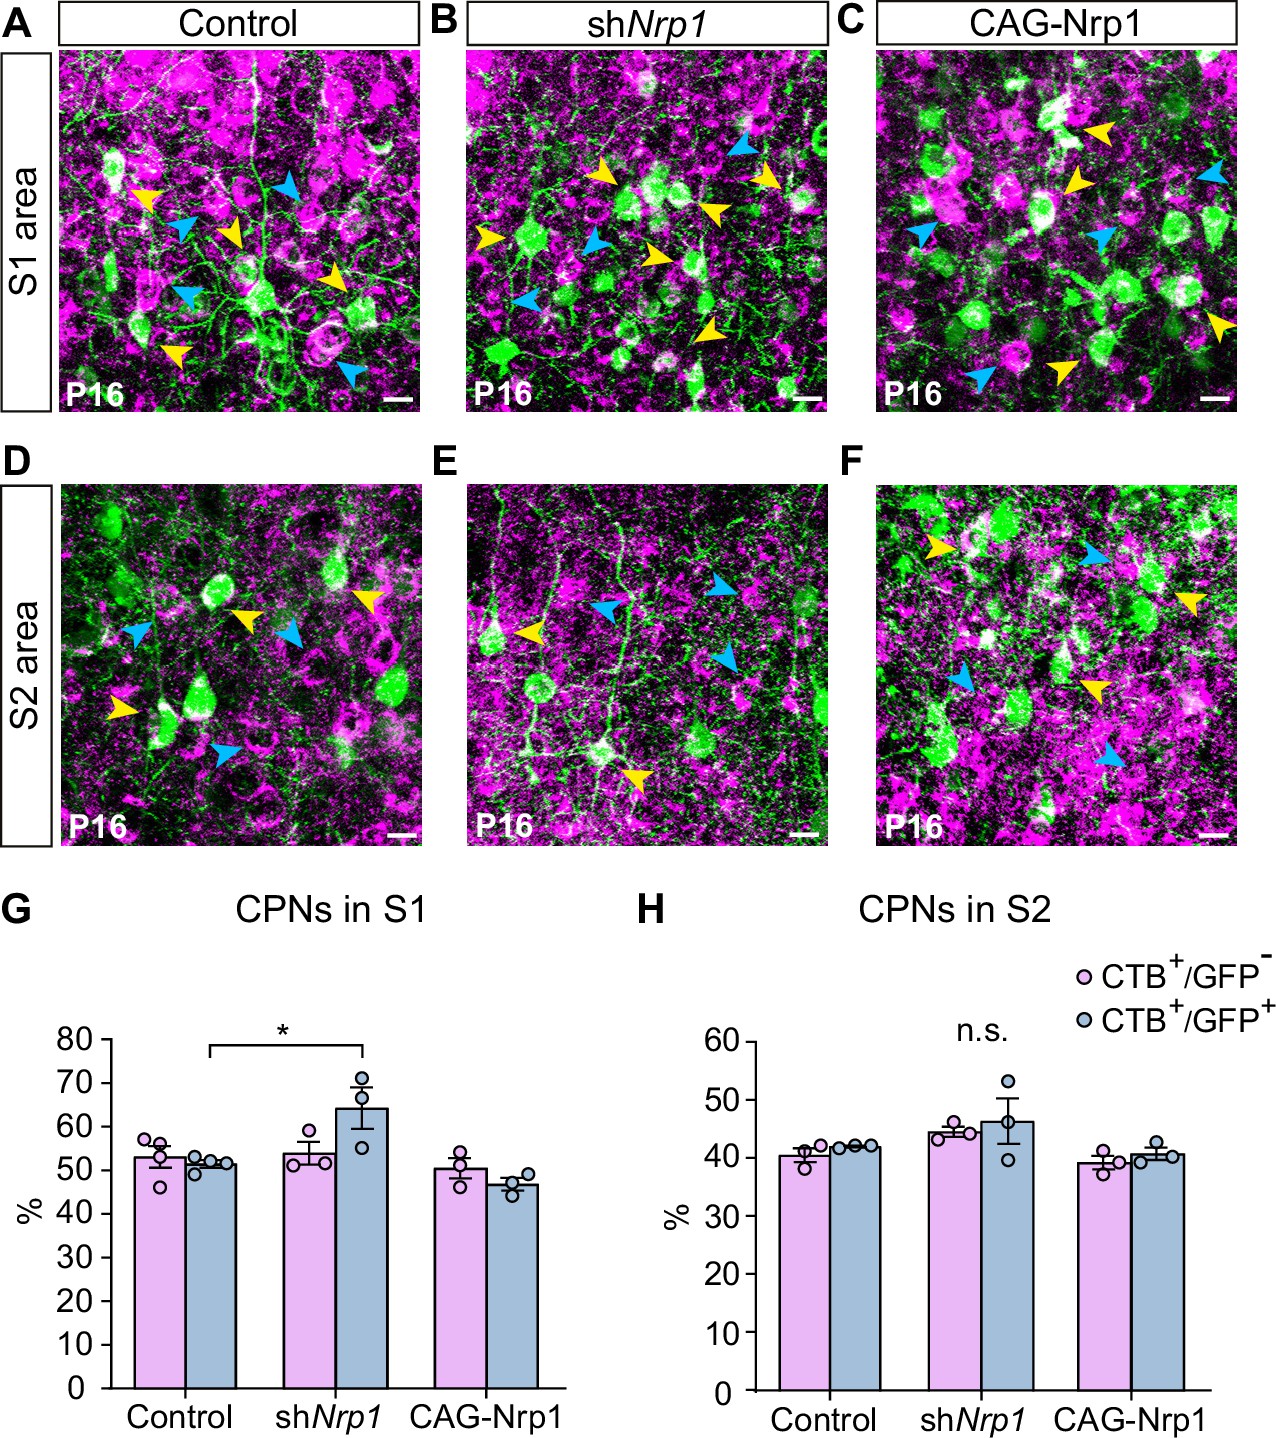
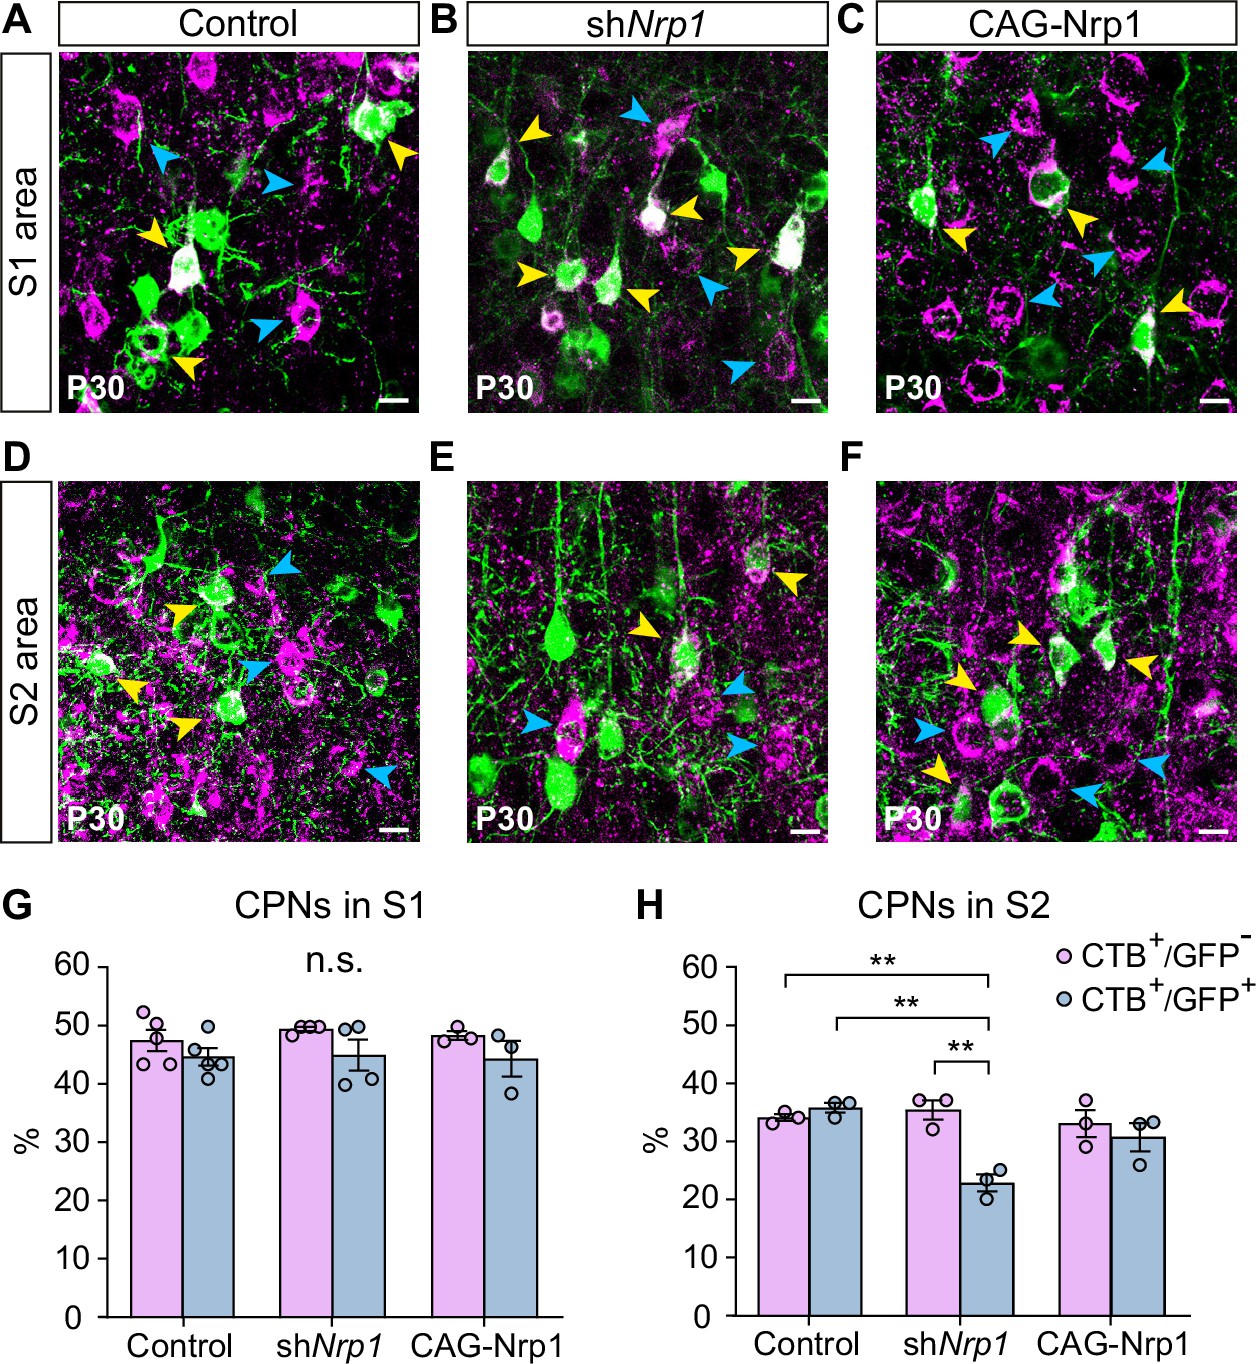
CPNs refinement during the P16 to P30 developmental window.
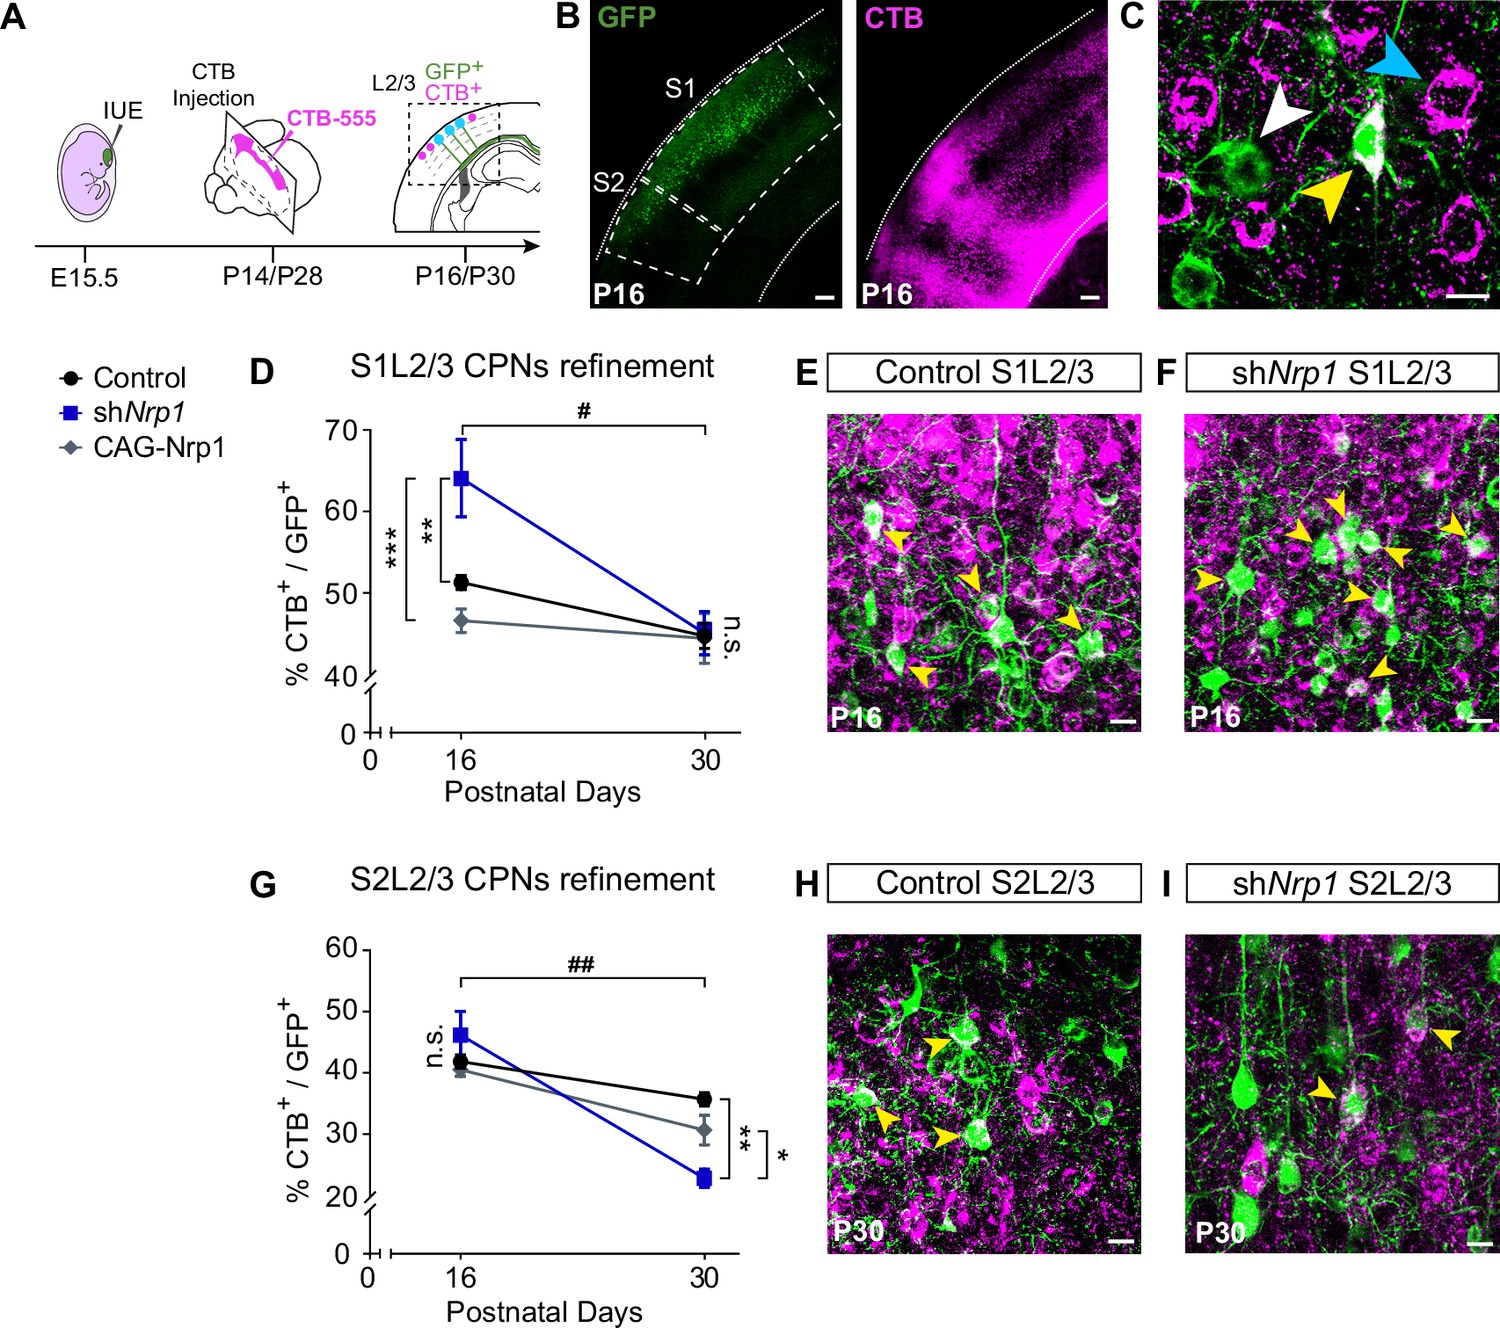
(A) Scheme of the experimental workflow. To analyze the effect of developmental refinement on the number of CPNs in the electroporated population, stereotaxic CTB injections at the midline were performed, after IUE at E15.5. (B) Images showing ipsilateral cortices of electroporated P16 brains with S1 and S2 regions delimitated by dashed lines. CTB signal is found in axonal columns and somas. Green = GFP. Magenta = CTB. Scale bar = 300 µm. (C) High-magnification image of L2/3 neurons in an injected P16 brain. White arrowhead = GFP+ neurons, blue arrowhead = CTB+ neurons, yellow arrowhead = GFP+CTB+ neurons. Scale bar = 10 µm. (D) Proportion of GFP+ CPNs (number of GFP+CTB+/number of GFP+) in S1 area in P16 and P30 brains. Mean ± SEM (n ≥ 3 mice, 2 sections per brain, in all conditions). Two-way ANOVA (n total = 21): ## p-value S1L2/3 CPNs refinement = 0.0120; p-value Experimental condition = 0.0075; p-value Postnatal day = 0.0003. Posthoc with Tukey’s test: ** p-value Control P16 – shNrp1 P16 = 0.0064; *** p-value shNrp1 P16 – CAG-Nrp1 P16 = 0.0008. (E–F) Merge images of control (E) and shNrp1 (F) S1L2/3 neurons at P16. Yellow arrowheads = GFP+CTB+ neurons. Scale bar = 10 µm. (G) Quantifications of CPNs in S2 at P16 and P30. Mean ± SEM (n ≥ 3 mice, 2 sections per brain, all conditions). Two-way ANOVA (n total = 21): ## p-value S2L2/3 CPNs refinement = 0.0029; p-value Experimental condition = 0.1358; p-value Postnatal day <0.0001. Posthoc with Tukey’s test: ** p-value Control P30 – shNrp1 P30 = 0.0021; * p-value shNrp1 P30 – CAG-Nrp1 P30 = 0.0448. (H–I) Merge images of control (H) and shNrp1 (I) S2L2/3 neurons at P16. Yellow arrowheads = GFP+CTB+. Scale bar = 10 µm. Source data are provided as a Source Data file.
-
Figure 5—source data 1
Source data file for Figure 5.
Raw data-countings.
- https://cdn.elifesciences.org/articles/69776/elife-69776-fig5-data1-v1.xlsx
Figure 5—figure supplement 1
Proportions of non-electroporated and electroporated CPNs at P16.
(A–F) Images of L2/3 neurons in electroporated brains (images in A and B are duplicated from Figure 5E and F, respectively). Blue arrowheads = CTB+, yellow arrowheads = GFP+CTB+. Scale bar = 10 µm. S1L2/3 neurons (A–C) and S2L2/3 neurons (D–F). (G–H) Proportion of CTB+ cells in GFP- and GFP+ subpopulations in S1 and S2. Mean ± SEM (n ≥ 3 mice per condition). Statistics: (G) Two-way ANOVA (n total = 11): p-value Experimental condition = 0.0051; p-value Population = 0.4379. Posthoc with Tukey’s test: * p-value Control GFP+ – shNrp1 GFP+ = 0.0284. (H) Two-way ANOVA (n total = 9): p-value Experimental condition = 0.067 (n.s.); p-value Population = 0.2994. Source data are provided as a Source Data file.
-
Figure 5—figure supplement 1—source data 1
Raw data-countings.
- https://cdn.elifesciences.org/articles/69776/elife-69776-fig5-figsupp1-data1-v1.xlsx
Figure 5—figure supplement 2
Proportions of non-electroporated and electroporated CPNs at P30.
(A–F) Images of L2/3 neurons in electroporated brains (images in D and E are duplicated from Figure 5H and I, respectively). Blue arrowheads = CTB+, yellow arrowheads = GFP+CTB+. Scale bar = 10 µm. S1L2/3 neurons (A–C) and S2L2/3 neurons (D–F). (G–H) Proportion of CTB+ cells in GFP- and GFP+ subpopulations in S1 and S2. Mean ± SEM (n ≥ 3 mice per condition). Statistics: (G) Two-way ANOVA (n total = 11): p-value Experimental condition = 0.8045 (n.s.); p-value Population = 0.0288. (H) Two-way ANOVA (n total = 9): p-value Experimental condition = 0.0168; p-value Population = 0.0077. Posthoc with Tukey’s test: ** p-value shNrp1 CTB+GFP- – shNrp1 CTB+GFP+ = 0.0021; ** p-value Control CTB+GFP+ – shNrp1 CTB+GFP+ = 0.0017; ** p-value Control CTB+GFP- – shNrp1 CTB+GFP+ = 0.0053. Source data are provided as a Source Data file.
-
Figure 5—figure supplement 2—source data 1
Raw data-countings.
- https://cdn.elifesciences.org/articles/69776/elife-69776-fig5-figsupp2-data1-v1.xlsx
Figure 6
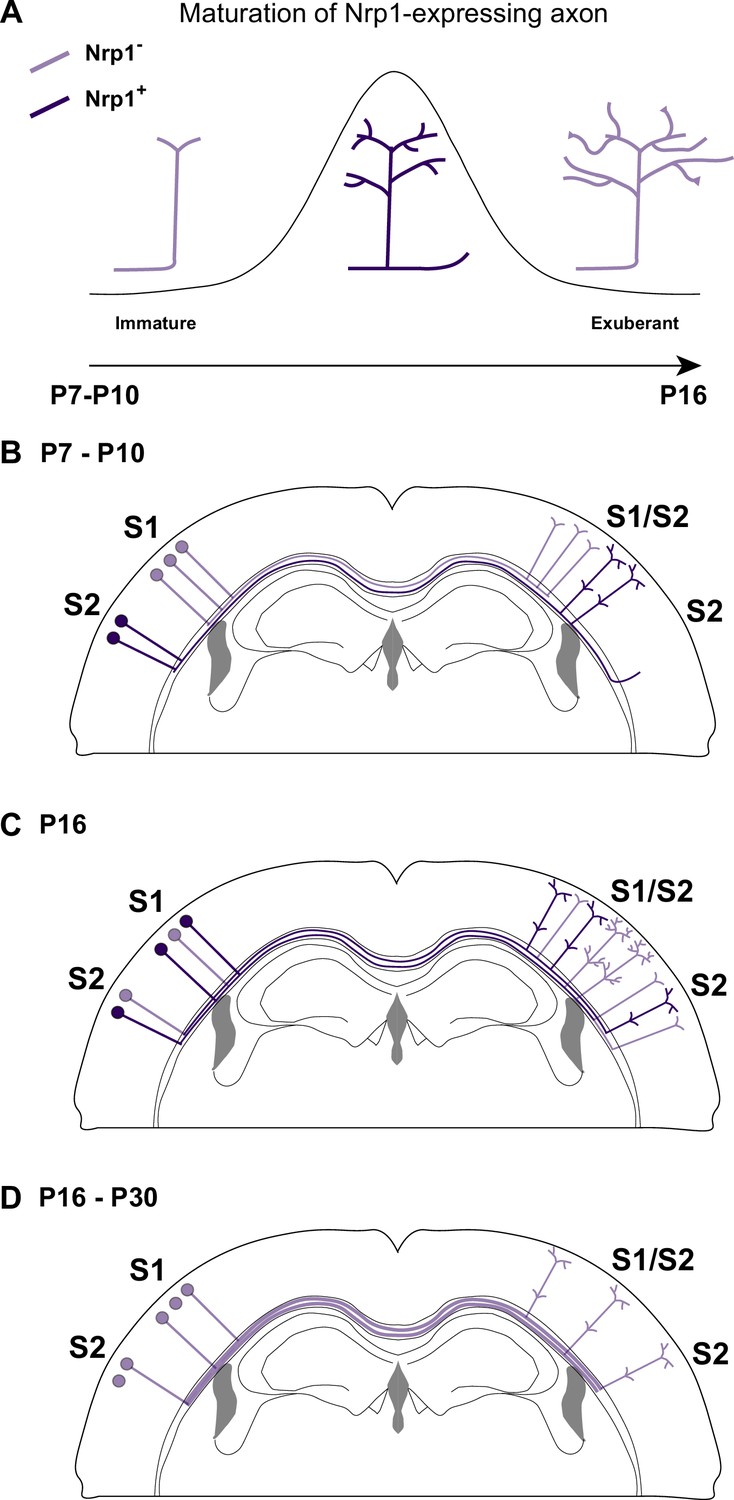
A possible model of the effects of Nrp1 transient expression in the branching and connectivity of callosal projections during development.
(A) Transient expression of Nrp1 promotes branching at the axonal tips as well as the formation of collaterals. Both shNrp1 and CAG-Nrp1 block arborization. A possible mechanistic explanation is that upregulation of Nrp1 expression stabilizes branching points and initiates the formation of secondary branches, while downregulation of Nrp1 allows the growth of these projections, or vice versa. (B) During the P7-P10 window, the S1/S2 column forms in a Nrp1-independent manner. Callosal projections from S1L2/3 present fewer branches compared to S2L2/3 neurons. CC collaterals projected by S2L2/3 axons begging to arrive at S2. (C) Between P10 and P16, Nrp1 expression is upregulated in S1L2/3 subpopulations and downregulated in many S2L2/3 neurons. Nrp1 upregulation promotes the growth of exuberant arbors in the S1/S2 and the S2 columns and, the formation of new collaterals. (C) After P16, CC axons continue their development by Nrp1-independent growth and refinement mechanisms.
Tables
Key resources table
| Reagent type (species) or resource | Designation | Source or reference | Identifiers | Additional information |
|---|---|---|---|---|
| Gene (Mus musculus. C57BL/6 J) | Nrp1 | Genebank | Gene ID: 18,186 | |
| Strain, strain background (Mus musculus. Male and female) | C57BL/6JRccHsd | Envigo | Genetic background used in all experiments | |
| Transfected construct (Aequorea victoria) | pCAG-GFP | AddGene | Plasmid #11,150RRID: Addgene_11150 | Plasmid construct to over-express GFP |
| Transfected construct (Mus musculus) | pCAG-Nrp1 | Gift from Prof. Mu-ming Poo Zhou et al., 2013 | Plasmid construct to over-express Nrp1 | |
| Transfected construct (Mus musculus) | pLKO.1 – shNrp1 | Sigma-Aldrich | ID: TRCN0000029859 | Lentiviral construct to express the shNrp1. |
| Antibody | Anti-digoxigenin-alkaline phosphatase (sheep polyclonal. IgG) | Roche | ID:11093274910RRID: AB_514497 | 1:5,000 |
| Antibody | Anti-GFP (chicken polyclonal. IgY) | Abcam | ID: AB13970RRID: AB_300798 | 1:500 |
| Antibody | Anti-Vglut2 (guinea pig polyclonal. Serum) | Merck | ID: AB2251RRID: AB_2665454 | 1:500 |
| Antibody | Anti-GFP (rabbit polyclonal. IgG) | Thermofisher Scientific | ID: A11122RRID: AB_221569 | 1:500 |
| Antibody | Anti-Chicken Alexa488 (goat polyclonal. IgY) | Thermofisher Scientific | ID: A11039RRID: AB_142924 | 1:500 |
| Antibody | Anti-Rabbit Alexa488 (goat polyclonal. IgG) | Thermofisher Scientific | ID: A11034RRID: AB_2576217 | 1:500 |
| Antibody | Anti-Guinea pig Alexa594 (goat polyclonal. IgG) | Thermofisher Scientific | ID: A11076RRID: AB_141930 | 1:500 |
| Sequence-based reagent | Antisense digoxigenin-labeled | Roche | ID: 11277073910 | |
| Sequence-based reagent | Nrp1 probe | Gift from V. Gil-Fernández and J.A del Río | Mata et al., 2018 | |
| Sequence-based reagent | Nrp1-FW | This paper | qPCR primers | ACACAGAAATTAAAATTGATGAAACAG |
| Sequence-based reagent | Nrp1-RV | This paper | qPCR primers | GGATGGGATCCAGGGTCT |
| Sequence-based reagent | GFP-FW | This paper | qPCR primers | CAACCACTACCTGAGCACCC |
| Sequence-based reagent | GFP-RV | This paper | qPCR primers | GTCCATGCCGAGAGTGATCC |
| Sequence-based reagent | Gus-FW | This paper | qPCR primers | AGCCGCTACGGGAGTCG |
| Sequence-based reagent | Gus-RV | This paper | qPCR primers | GCTGCTTCTTGGGTGATGTCA |
| Peptide, recombinant protein | Subunit B of cholera toxin (CTB) conjugated to Alexa 555 | Thermofisher Scientific | ID: C34776 | Axonal retrograde labelling |
| Commercial assay or kit | NZY Total RNA isolation | NZYTech | ID: MB13402 | RNA extraction |
| Commercial assay or kit | First-strand cDNA Synthesis kit | Merck | ID: 27-9261-01 | cDNA synthesis |
| Commercial assay or kit | GoTaq qPCR Master Mix | Promega | ID: A6002 | RT-qPCR |
| Commercial assay or kit | Qiagen Plasmid Maxi Kit | Qiagen | ID: 12,165 | Plasmid DNA purification Kit |
| Chemical compound, drug | PFA (paraformaldehyde) | Merck | ID:1.04005.1000 | Tissue fixation |
| Chemical compound, drug | PBS 10 X (phosphate buffer saline) | iNtRON Biotechnology | ID: 102,309 | |
| Chemical compound, drug | Sucrose | Merck | ID:1.07651.1000 | Tissue cryoprotection |
| Chemical compound, drug | Sucrose | Merck | ID: S0389 | Tissue cryoprotection |
| Chemical compound, drug | Formalin solution, neutral buffered, 10% | Sigma-aldrich | ID: HT501128-4L | Tissue fixation |
| Chemical compound, drug | Deionized formamide | Millipore | ID: S4117 | |
| Chemical compound, drug | Denhardst’s 1 X | Sigma-Aldrich | ID: D2532 | |
| Chemical compound, drug | Dextran sulphate 10 X | Sigma-Aldrich | ID: 4,911 | |
| Chemical compound, drug | tRNA | Sigma-Aldrich | ID: R6625 | |
| Chemical compound, drug | Blocking solution | Roche | ID: 11096176001 | |
| Chemical compound, drug | Hoechst 33,342 | Invitrogen | ID: H1399 | Nuclei staining |
| Chemical compound, drug | 4’,6-diamidino-2-phenylindole (DAPI) | Merck | ID: D9542 | Nuclei staining |
| Chemical compound, drug | PBS·DEPC | Sigma-aldrich | ID: D5758 | |
| Chemical compound, drug | O.C.T Tissue-Tek compound | Sakura Tissue-Tek | ID: 4,583 | Freeze solution |
| Software, algorithm | Graphpad Prism 8 | Graphpad Software | RRID:SCR_002798 | Statistical software |
| Software, algorithm | Fiji-ImageJ | Fiji | Schindelin, J. et al. 2012.RRID:SCR_003070 | Imaging software |
| Software, algorithm | Semi-automated counting cells macros | This paper | GitHub: https://github.com/FMartin30/Macros; Bragg-Gonzalo, 2022 | Macros to semi-automated counted of GFP+ cells |
| Other | Fetal Bovine Serum (FBS) | Thermofisher Scientific | ID: A31605 | Blocking solution for immunofluorescence |
Additional files
Download links
A two-part list of links to download the article, or parts of the article, in various formats.
Downloads (link to download the article as PDF)
Open citations (links to open the citations from this article in various online reference manager services)
Cite this article (links to download the citations from this article in formats compatible with various reference manager tools)
Role of Nrp1 in controlling cortical inter-hemispheric circuits
eLife 11:e69776.
https://doi.org/10.7554/eLife.69776


