STIM1-dependent peripheral coupling governs the contractility of vascular smooth muscle cells
- Department of Pharmacology, Center for Molecular and Cellular Signaling in the Cardiovascular System, University of Nevada, United States
- Department of Physiology and Cell Biology, Center for Molecular and Cellular Signaling 18 in the Cardiovascular System, University of Nevada, United States
- Department of Cellular and Molecular Physiology, Penn State Cancer Institute, Penn State University, United States
- Department of Pharmacology and Chemical Biology, and Vascular Medicine Institute, University of Pittsburgh, United States
Figures
Figure 1 with 3 supplements
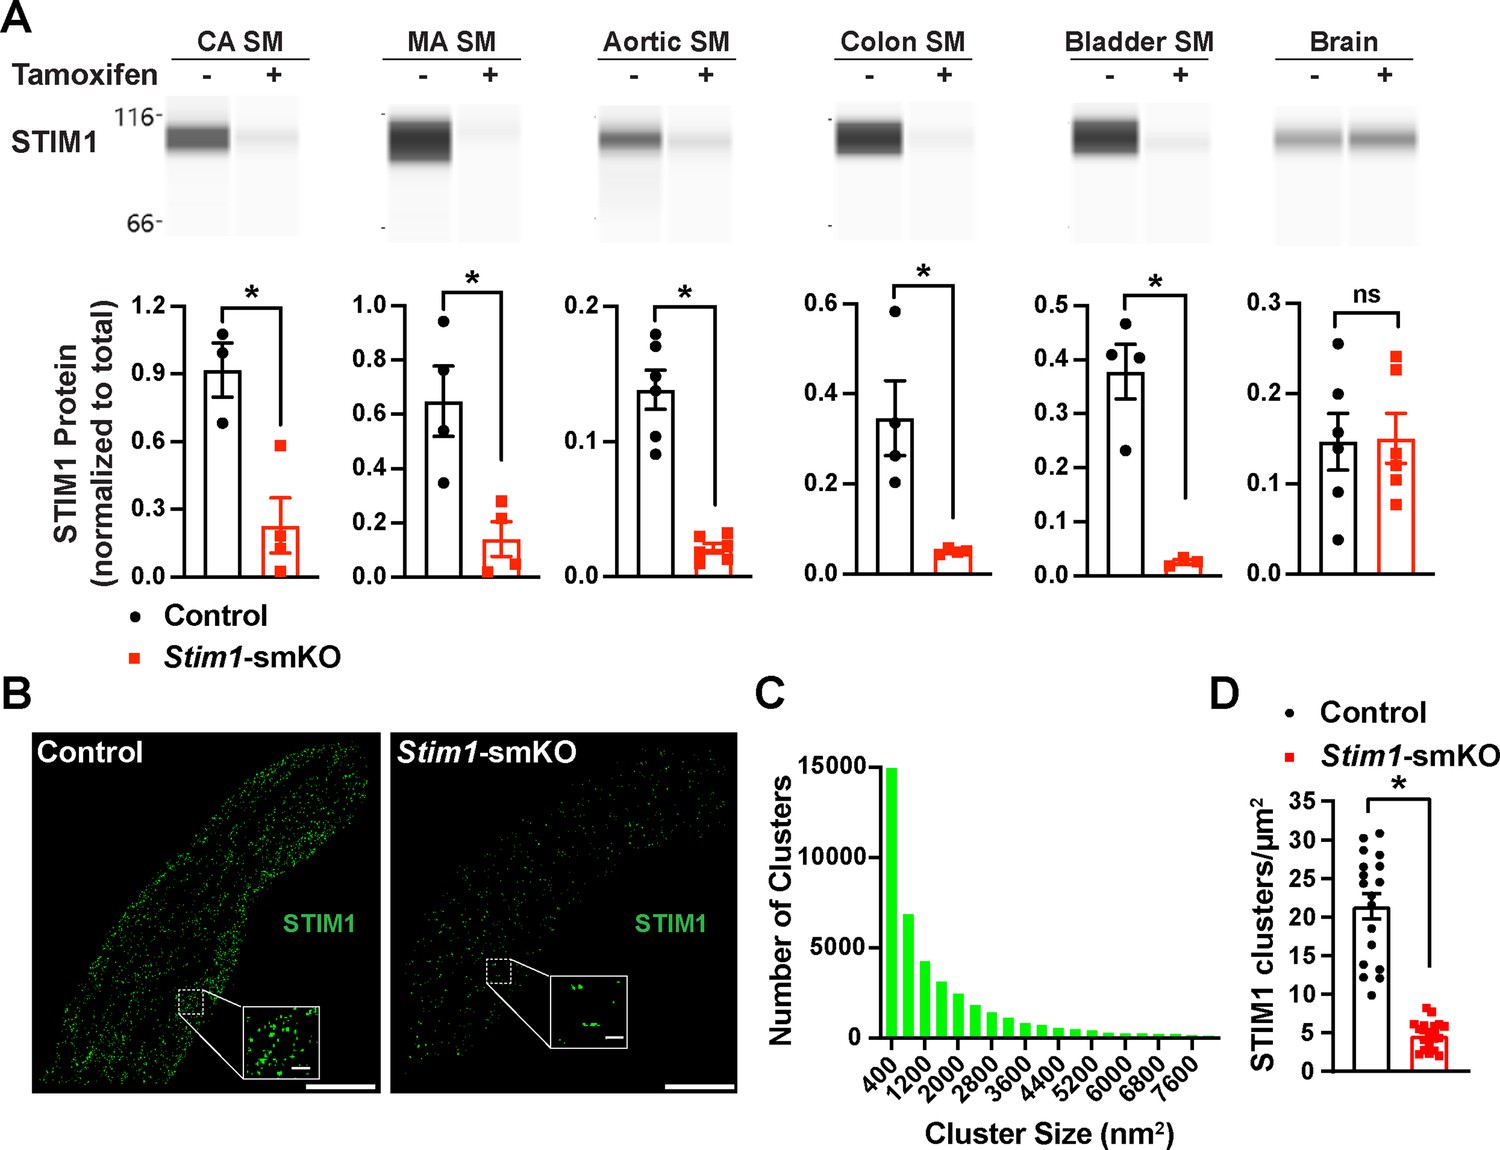
Inducible smooth muscle cell (SMC)-specific Stim1 knockout.
(A) Representative Wes protein capillary electrophoresis experiments, presented as Western blots, showing STIM1 protein expression levels in smooth muscle tissues and brains of control and Stim1-smKO mice. Summary data showing densitometric analyses of STIM1 protein expression in cerebral artery smooth muscle (CA SM), mesenteric artery smooth muscle (MA SM), aortic smooth muscle, colonic smooth muscle, bladder smooth muscle, and brain, normalized to total protein (n = 3–6 mice/group; *p<0.05, unpaired t-test). ns, not significant. (B) Representative epifluorescence superresolution localization maps of isolated cerebral artery SMCs from control and Stim1-smKO mice immunolabeled for STIM1. Insets: enlarged areas highlighted by the white squares in the main panels. Scale bars: 3 µm (main panels) and 250 nm (inset panels). (C) Distribution plot of the surface areas of individual STIM1 clusters in cerebral artery SMCs isolated from control mice (n = 42,726 clusters from 18 cells from three mice). (D) STIM1 cluster density in cerebral artery SMCs isolated from control and Stim1-smKO mice (n = 18 cells from three mice/group; *p<0.05, unpaired t-test).
-
Figure 1—source data 1
Individual data points and analysis summaries for datasets shown in Figure 1.
- https://cdn.elifesciences.org/articles/70278/elife-70278-fig1-data1-v2.xlsx
Figure 1—figure supplement 1
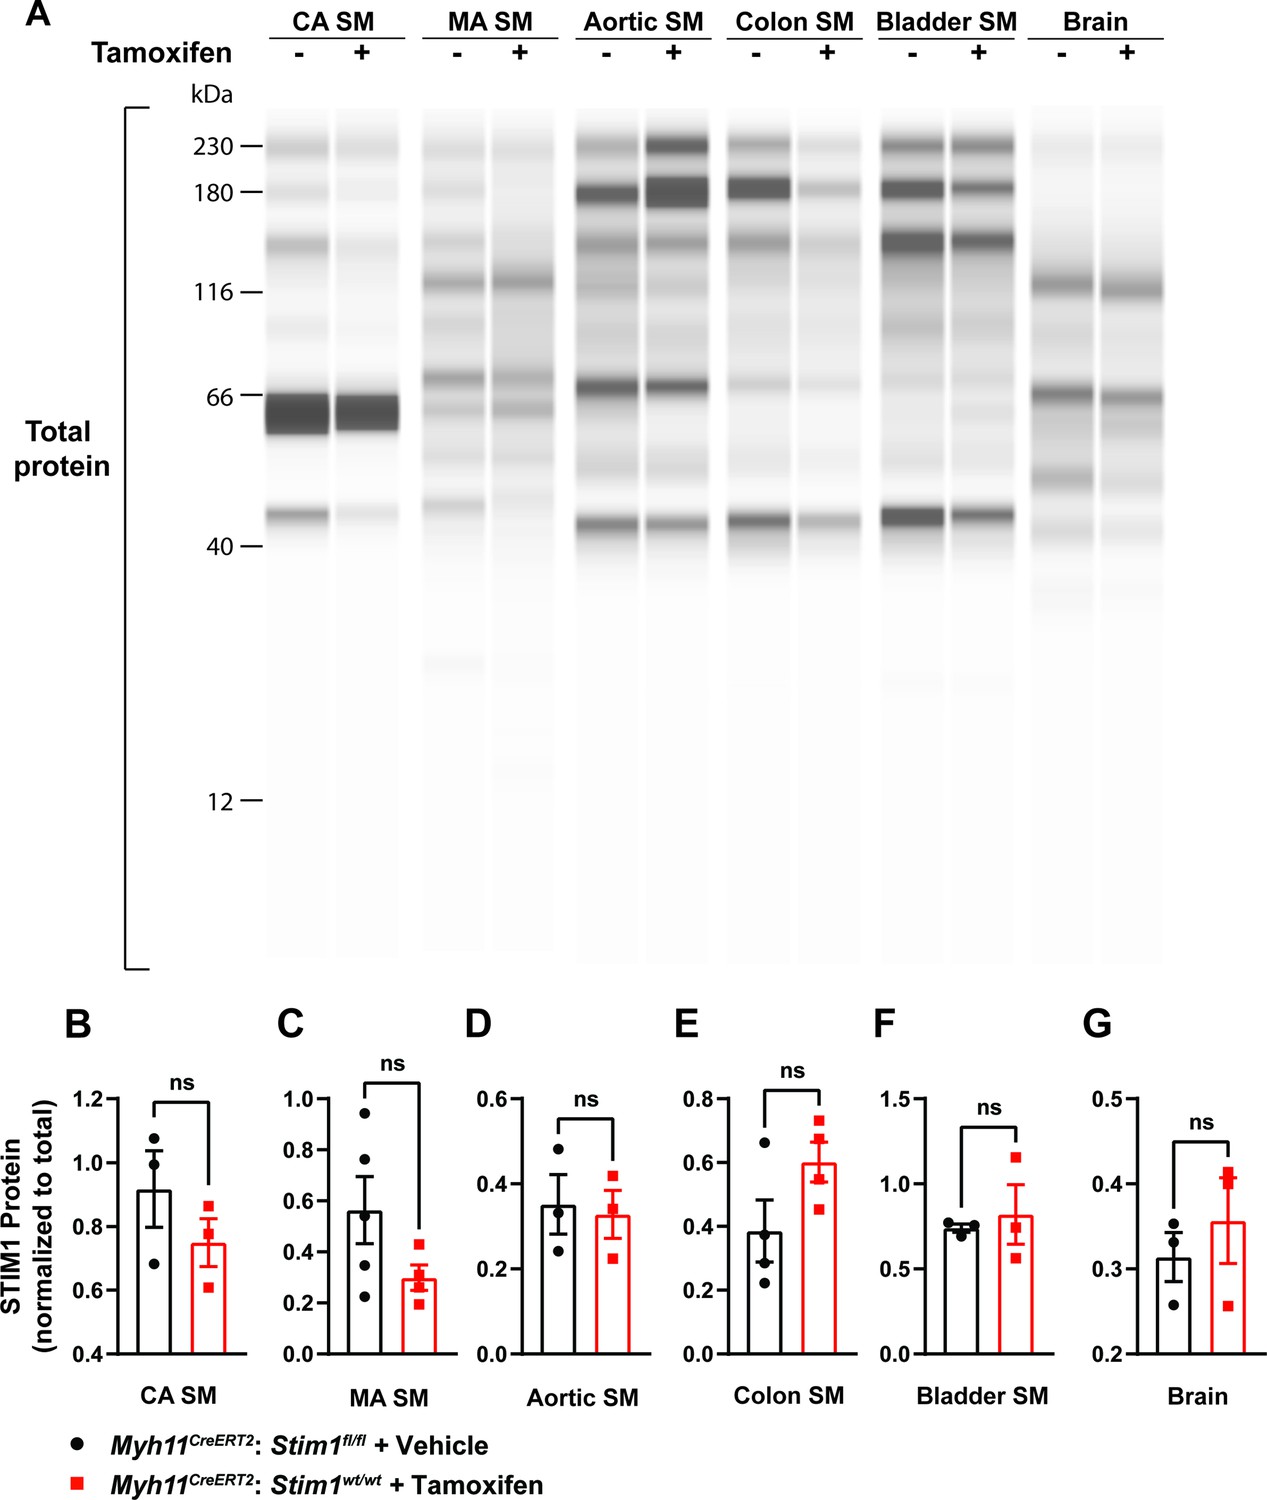
STIM1 protein expression remains unaltered in tamoxifen-injected Myh11CreERT2: Stim1fl/fl mice.
(A) Representative Wes blot showing total protein levels in cerebral artery smooth muscle (CA SM), mesenteric artery smooth muscle (MA SM), aortic smooth muscle, colonic smooth muscle, bladder smooth muscle, and whole-brain tissues isolated from control and Stim1-smKO mice. (B–G) Summary data showing STIM1 protein expression normalized to total protein levels in CA SM (B), MA SM (C), aortic smooth muscle (D), colonic smooth muscle (E), bladder smooth muscle (F), and brain (G) tissues isolated from vehicle-injected Myh11CreERT2: Stim1fl/fl mice and tamoxifen-injected Myh11CreERT2: Stim1wt/wt mice (n = 3–5 mice/group, unpaired t-test). ns, not significant.
-
Figure 1—figure supplement 1—source data 1
Individual data points and analysis summaries for datasets shown in Figure 1—figure supplement 1.
- https://cdn.elifesciences.org/articles/70278/elife-70278-fig1-figsupp1-data1-v2.xlsx
Figure 1—figure supplement 2
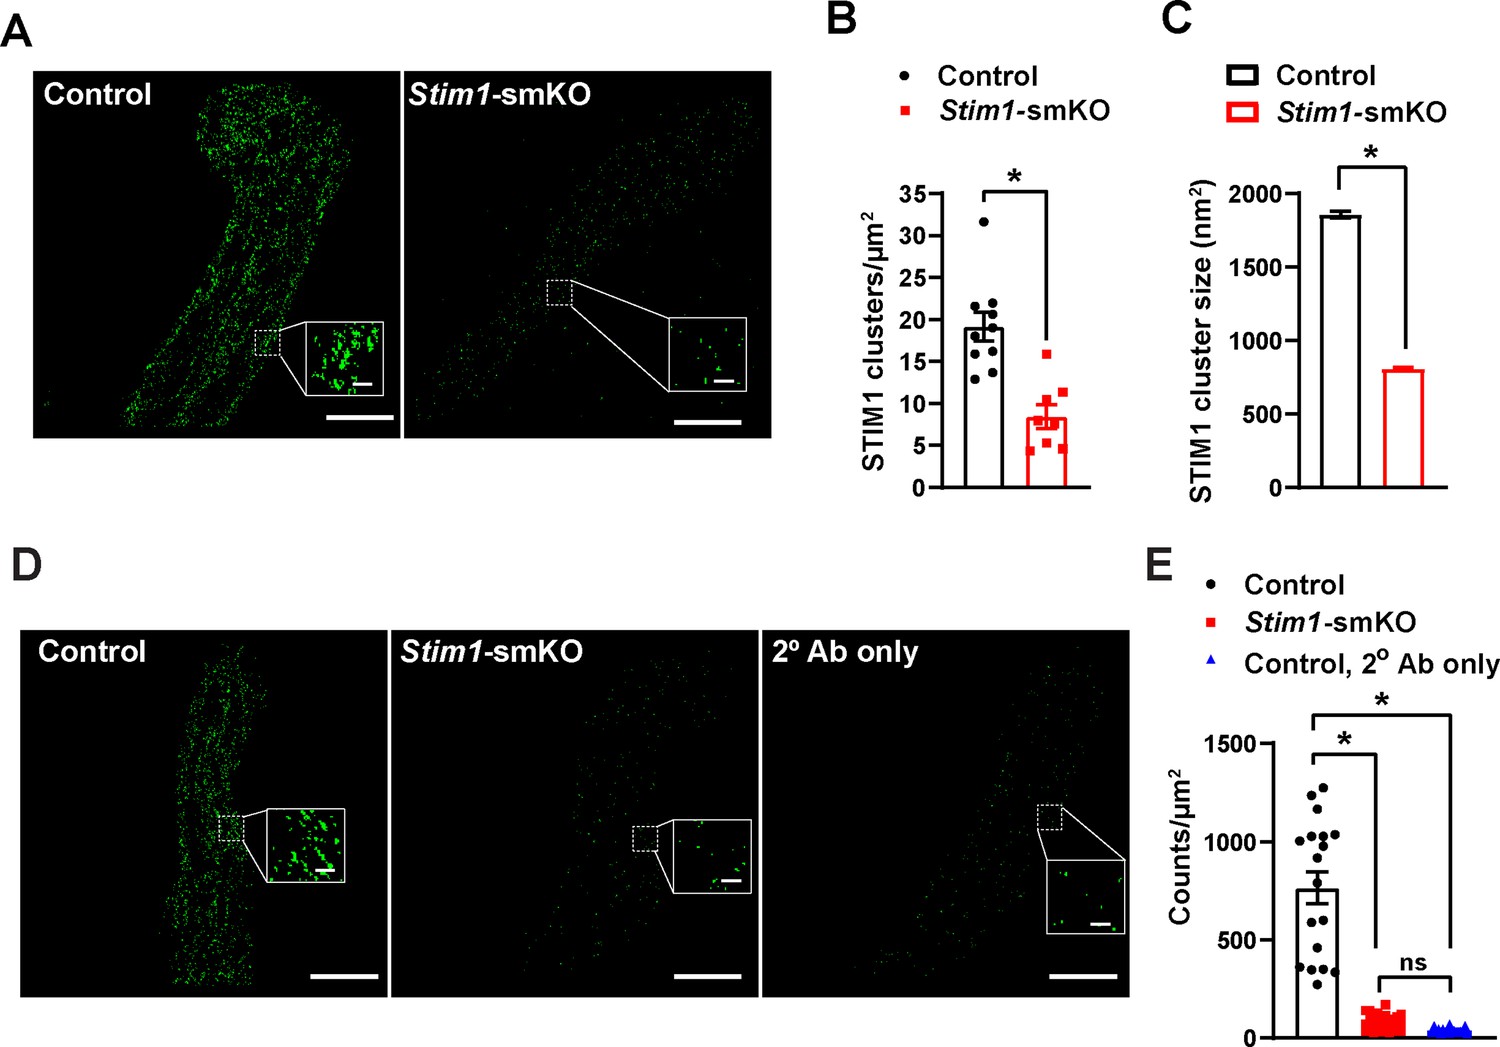
Cerebral artery SMCs from Stim1-smKO mice exhibit reduced STIM1 cluster size and density.
(A) Representative total internal reflection fluorescence (TIRF)-mode superresolution localization maps of isolated cerebral artery smooth muscle cells (SMCs) from control and Stim1-smKO mice immunolabeled for STIM1 (green). Insets: enlarged areas highlighted by the white squares in the main panels. Scale bars: 3 µm (main panels) and 250 nm (inset panels). (B) Cluster density (clusters per unit area) of STIM1 clusters in cerebral artery SMCs from control and Stim1-smKO mice. (C) Mean cluster size of STIM1 clusters in isolated cerebral artery SMCs from control and Stim1-smKO mice. (Data from 11,566 clusters from 10 cells from three mice for control and 2968 clusters from 8 cells from three mice for Stim1-smKO, *p<0.05, unpaired t-test). (D) Representative epifluorescence ground state depletion followed by individual molecule return (GSDIM) superresolution localization maps of vascular smooth muscle cells (VSMCs) from a control and Stim1-smKO mice immunolabeled for STIM1, and a control mouse immunolabeled with only the secondary antibody (2° Ab) used to detect STIM1 (goat anti-rabbit Alexa Fluor 647). Insets: enlarged areas highlighted by the white squares in the main panels. Scale bars: 3 µm (main panels) and 250 nm (inset panels). (E) GSDIM counts detected per unit area in cerebral artery SMCs isolated from control and Stim1-smKO mice immunolabeled with anti-STIM1 antibody, and VSMCs isolated from control mice immunolabeled with the secondary antibody only. Data are presented as means ± SEM (n = 18 cells from three mice in each group; *p<0.05 vs. control, one-way ANOVA). ns, not significant.
-
Figure 1—figure supplement 2—source data 1
Individual data points and analysis summaries for datasets shown in Figure 1—figure supplement 2.
- https://cdn.elifesciences.org/articles/70278/elife-70278-fig1-figsupp2-data1-v2.xlsx
Figure 1—figure supplement 3
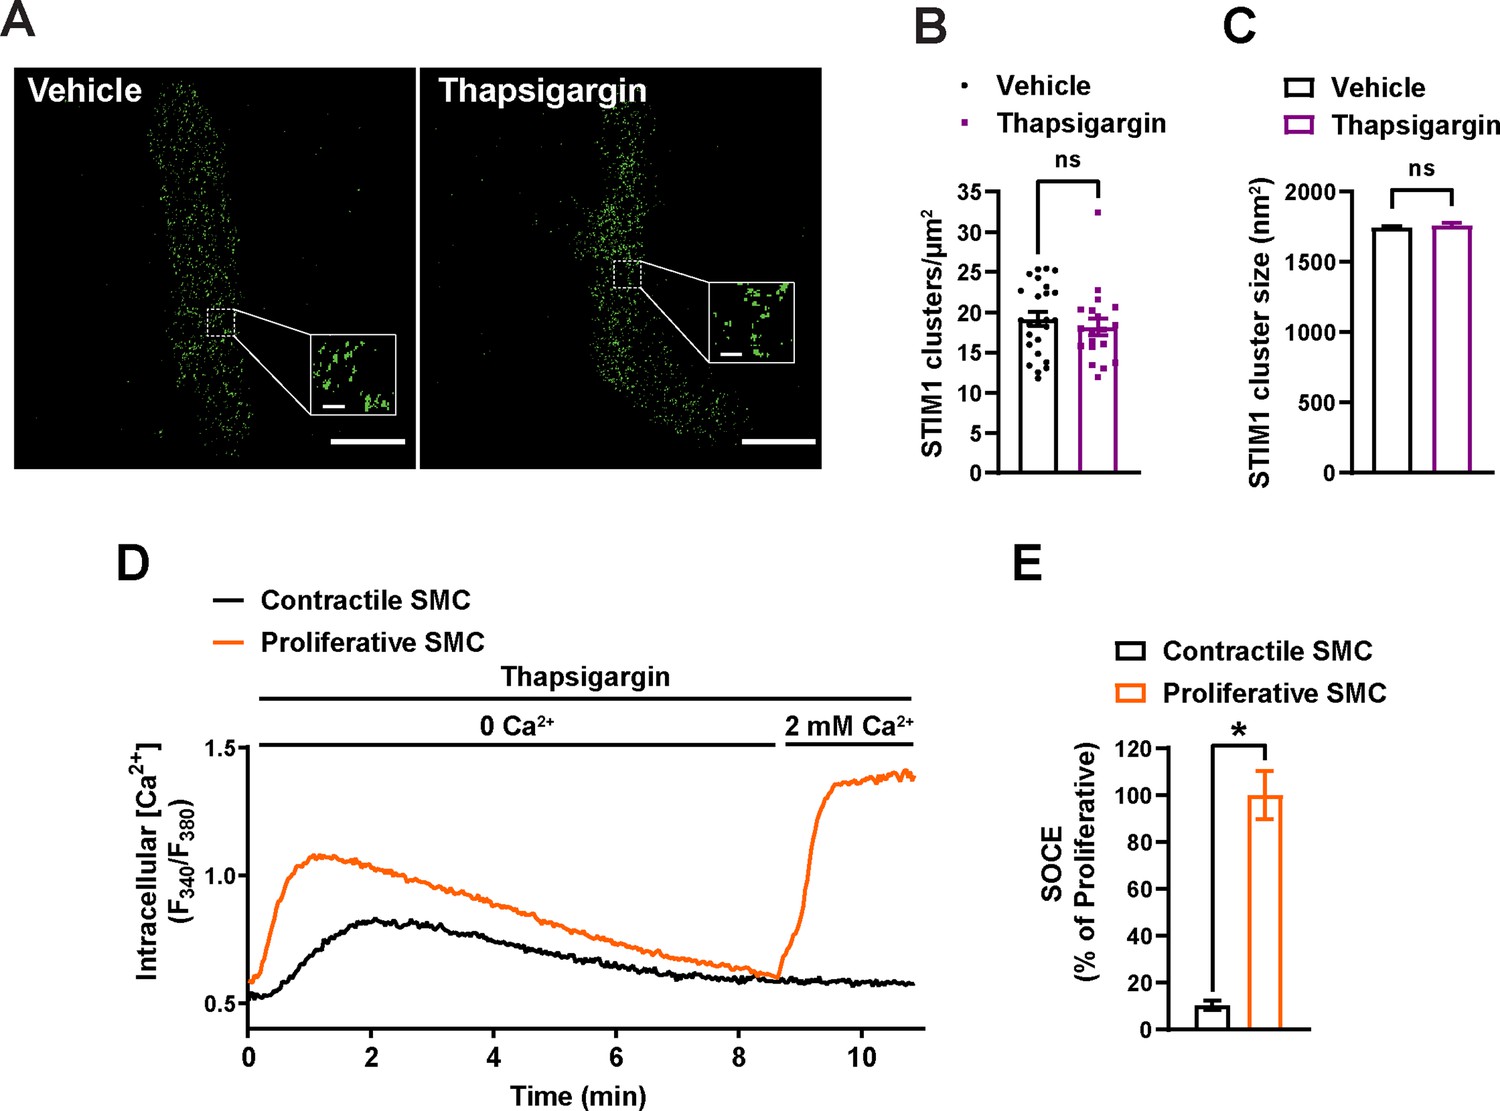
SR calcium store depletion does not affect STIM1 cluster size or density in isolated cerebral artery SMCs.
(A) Representative superresolution localization maps of vascular smooth muscle cells (VSMCs) isolated from control mice treated with vehicle or thapsigargin (2 μM) for 10 min and immunolabeled for STIM1 (green). Insets: enlarged areas highlighted by the white squares in the main panels. Scale bars: 3 µm (main panels) and 250 nm (inset panels). (B) Density (clusters per unit area) of STIM1 clusters in vehicle and thapsigargin-treated VSMCs. (C) Mean cluster size of STIM1 clusters in vehicle and thapsigargin-treated VSMCs. (Data from 31,779 clusters from 25 cells from three mice for vehicle and 18,846 clusters from 19 cells from three mice for thapsigargin, unpaired t-test). ns, not significant. (D) Representative traces showing changes in intracellular [Ca2+] expressed as change in ratiometric fluorescence (F340/F380) in proliferative and contractile VSMCs after depletion of sarcoplasmic reticulum (SR) Ca2+ by treatment with thapsigargin (2 μM) in Ca2+-free solution, followed by restoration of extracellular Ca2+ (2 mM) to induce store-operated Ca2+ entry (SOCE). (E) Summary data of SOCE (expressed as peak F340/F380 ratio) in proliferative and contractile SMCs (n = 6 cells in each group, *p<0.05, unpaired t-test).
-
Figure 1—figure supplement 3—source data 1
Individual data points and analysis summaries for datasets shown in Figure 1—figure supplement 3.
- https://cdn.elifesciences.org/articles/70278/elife-70278-fig1-figsupp3-data1-v2.xlsx
Figure 2
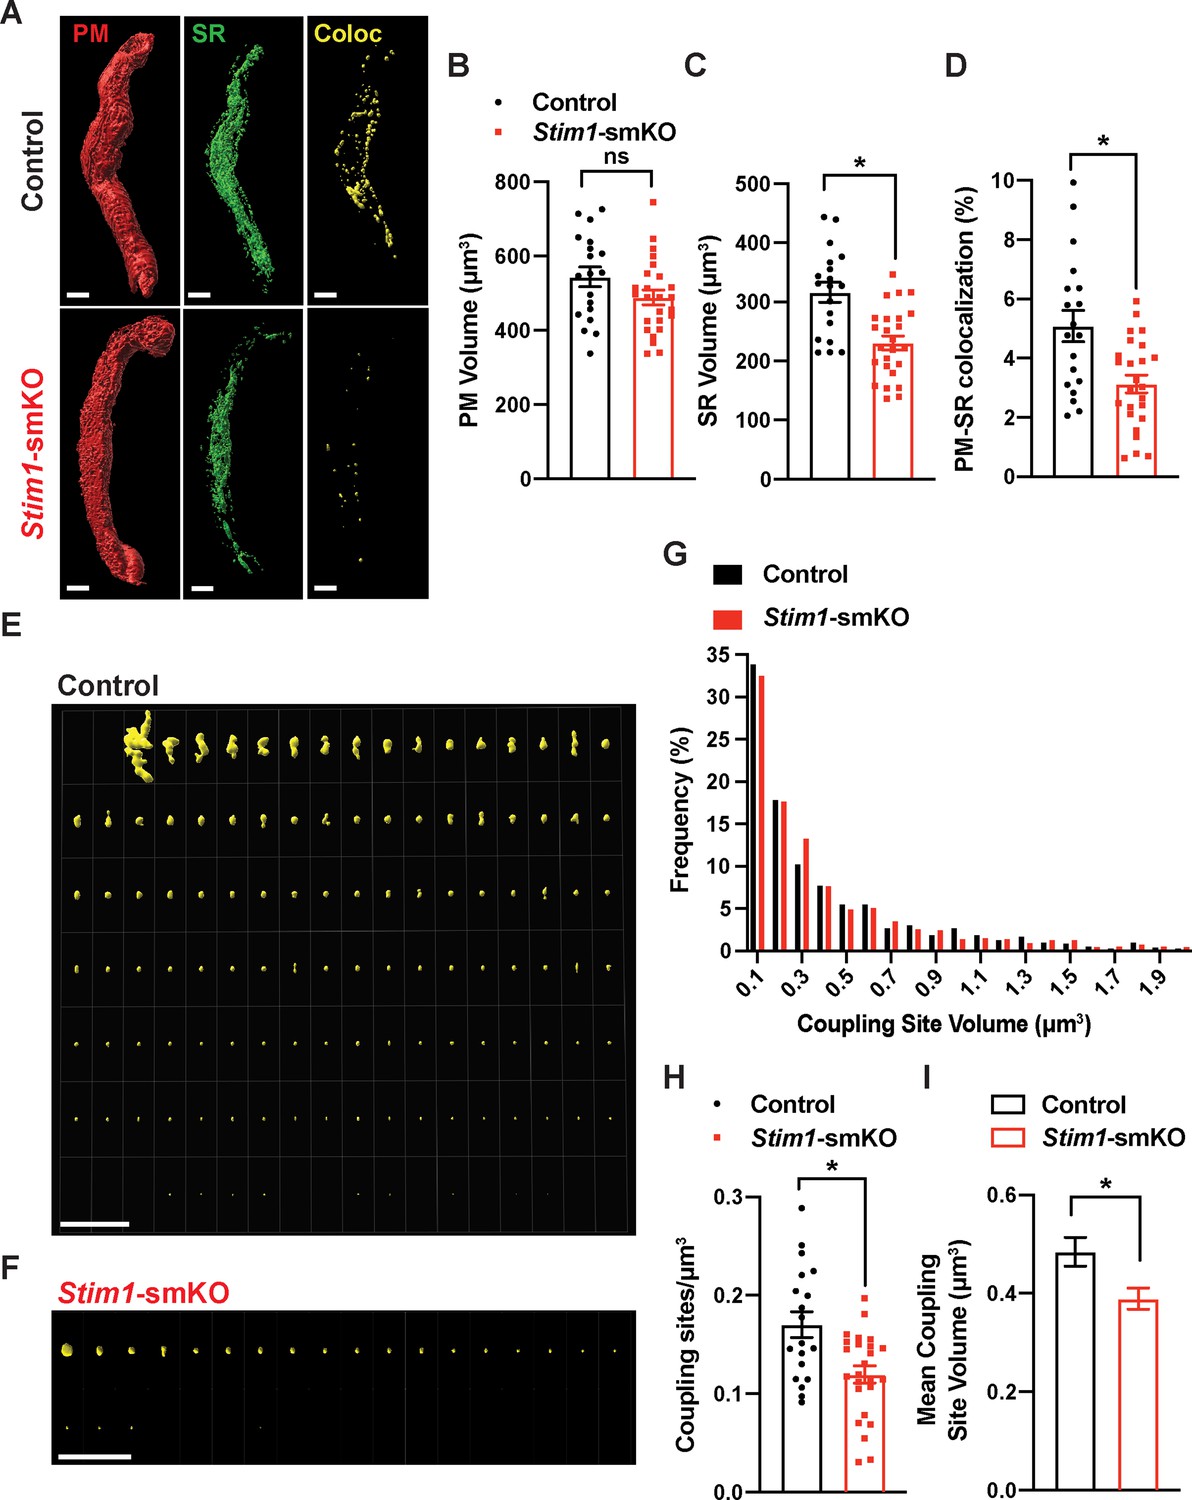
Stim1 knockout decreases the density and area of plasma membrane-sarcoplasmic reticulum (PM-SR) coupling sites.
(A) Representative 3D surface reconstructions of cerebral artery smooth muscle cells (SMCs) isolated from control and Stim1-smKO mice labeled with PM (red) and SR (green) dyes and imaged using structured illumination microscopy (SIM). Representations of colocalizing PM and SR surfaces (yellow), generated from surface reconstructions. Scale bar: 5 µm. (B, C) PM and SR volumes and (D) PM-SR colocalization (%) in cells from control and Stim1-smKO mice. (E, F) Ensemble images of all PM-SR colocalization sites in single cells from the control and Stim1-smKO mice shown in panel (A). Scale bar: 10 µm. (G) Frequency distribution of the volumes of individual PM-SR colocalization sites in VSMCs isolated from control and Stim1-smKO mice. (H) Densities and (I) mean volumes of individual coupling sites in VSMCs from control and Stim1-smKO mice. Data are for 1736 colocalization sites in 19 cells from six mice for control and 1484 colocalization sites in 25 cells from seven mice for Stim1-smKO (*p<0.05, unpaired t-test). ns, not significant.
-
Figure 2—source data 1
Individual data points and analysis summaries for datasets shown in Figure 2.
- https://cdn.elifesciences.org/articles/70278/elife-70278-fig2-data1-v2.xlsx
Figure 3
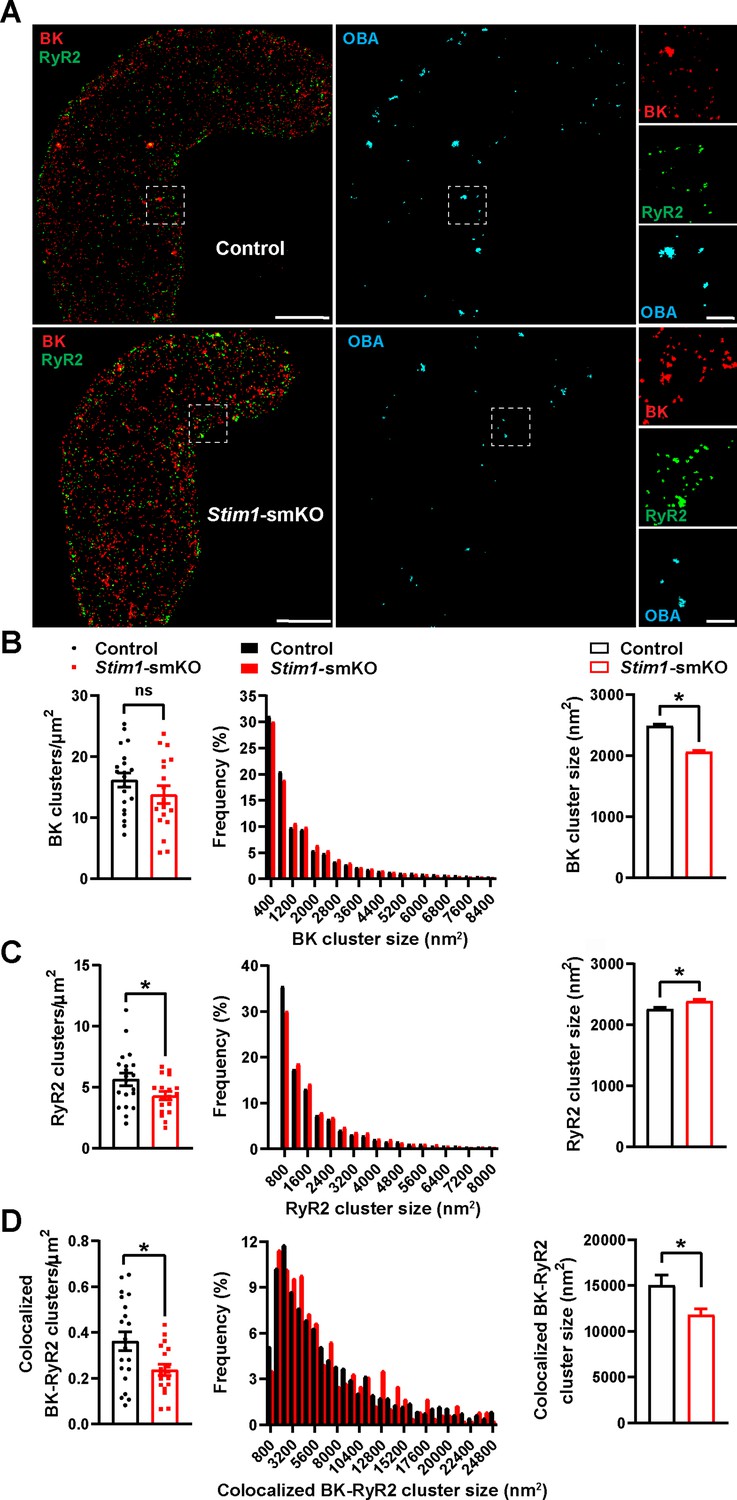
Stim1 knockout decreases colocalization of BK and RyR2 protein clusters.
(A) Epifluorescence-mode superresolution localization maps of freshly isolated vascular smooth muscle cells (VSMCs) from control and Stim1-smKO mice immunolabeled for BK (red) and RyR2 (green). Colocalized BK and RyR2 clusters were identified by object-based analysis (OBA) and mapped (cyan). Scale bar: 3 µm. Panels to the right show enlarged areas of the original superresolution maps indicated by the white boxes. Scale bar: 500 nm. (B) Summary data showing the density (clusters per unit area), frequency distribution of sizes, and mean size of BK channel clusters. (C) Summary data showing the density, frequency distribution of sizes, and mean size of RyR2 clusters. (D) Summary data showing the density, frequency distribution of sizes, and mean size of colocalizing BK and RyR2 clusters, identified using OBA. For density data, n = 20 cells from three mice for controls and n = 18 cells from three mice for Stim1-smKO mice. For frequency distribution and mean cluster size data: control, n = 44,340 BK channel clusters, n = 15,193 RyR2 clusters, and n = 1054 colocalizing clusters; Stim1-smKO: n = 30,552 BK channel clusters, n = 9702 RyR2 clusters, and n = 547 colocalizing clusters (*p<0.05, unpaired t-test). ns, not significant.
-
Figure 3—source data 1
Individual data points and analysis summaries for datasets shown in Figure 3.
- https://cdn.elifesciences.org/articles/70278/elife-70278-fig3-data1-v2.xlsx
Figure 4
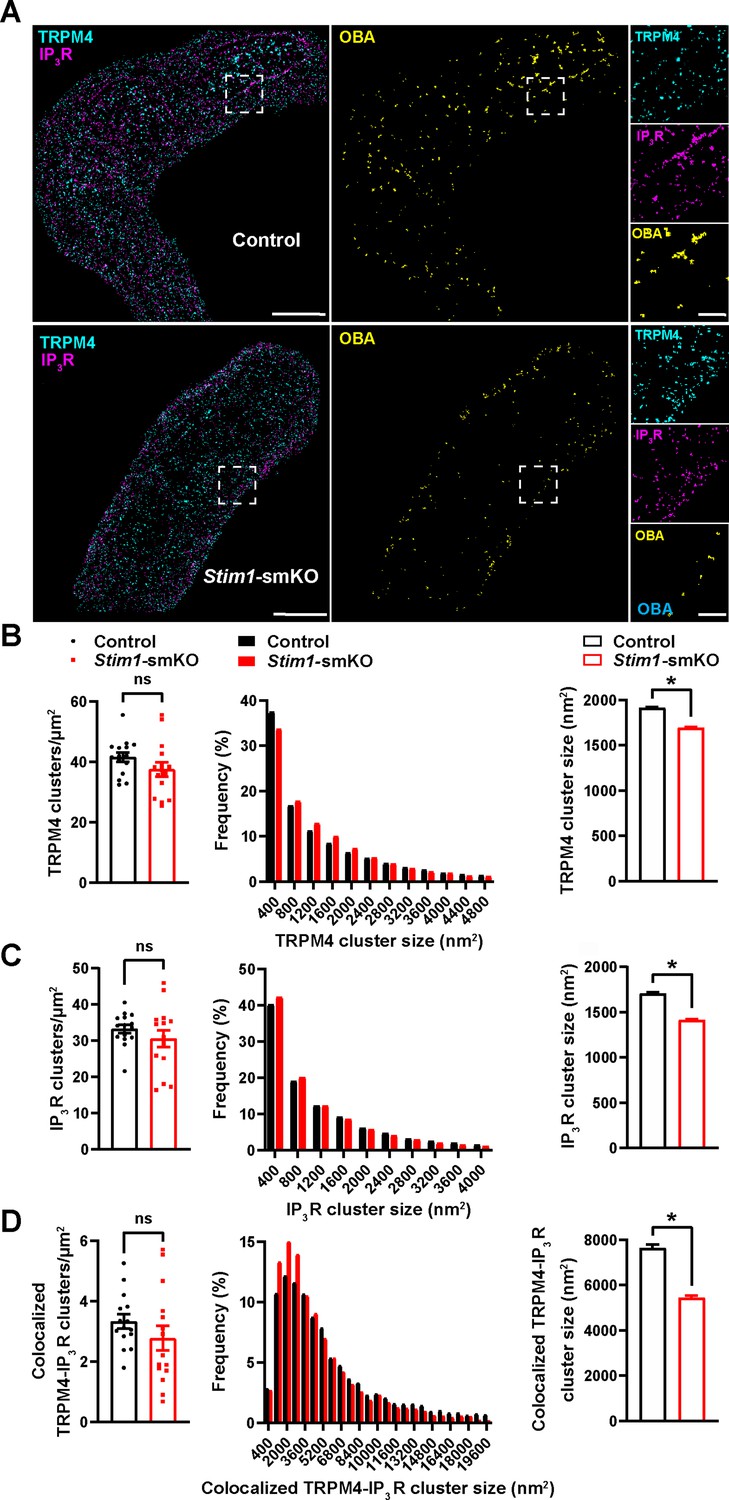
Stim1 knockout decreases colocalization of TRPM4 and IP3R protein clusters.
(A) Epifluorescence-mode superresolution localization maps of freshly isolated vascular smooth muscle cells (VSMCs) from control and Stim1-smKO mice immunolabeled for TRPM4 (cyan) and IP3R (magenta). Colocalized TRPM4 and IP3R clusters were identified by object-based analysis (OBA) and mapped (yellow). Scale bar: 3 µm. Panels to the right show enlarged areas of the original superresolution maps indicated by white boxes. Scale bar: 500 nm. (B) Summary data showing the density (clusters per unit area), frequency distribution of sizes, and mean size of TRPM4 channel protein clusters. (C) Summary data showing the density, frequency distribution of sizes, and mean size of IP3R clusters. (D) Summary data showing the density, frequency distribution of sizes, and mean size of colocalizing TRPM4 and IP3R clusters, identified using OBA. For density data, n = 15 cells from three mice for both control and Stim1-smKO mice. For frequency distribution and mean cluster size data: control, n = 64,292 TRPM4 channel clusters, n = 51,728 IP3R clusters, and n = 5164 colocalizing clusters; Stim1-smKO mice, n = 56,771 TRPM4 channel clusters, n = 45,717 IP3R, and n = 3981 colocalizing clusters (*p<0.05, unpaired t-test). ns, not significant.
-
Figure 4—source data 1
Individual data points and analysis summaries for datasets shown in Figure 4.
- https://cdn.elifesciences.org/articles/70278/elife-70278-fig4-data1-v2.xlsx
Figure 5
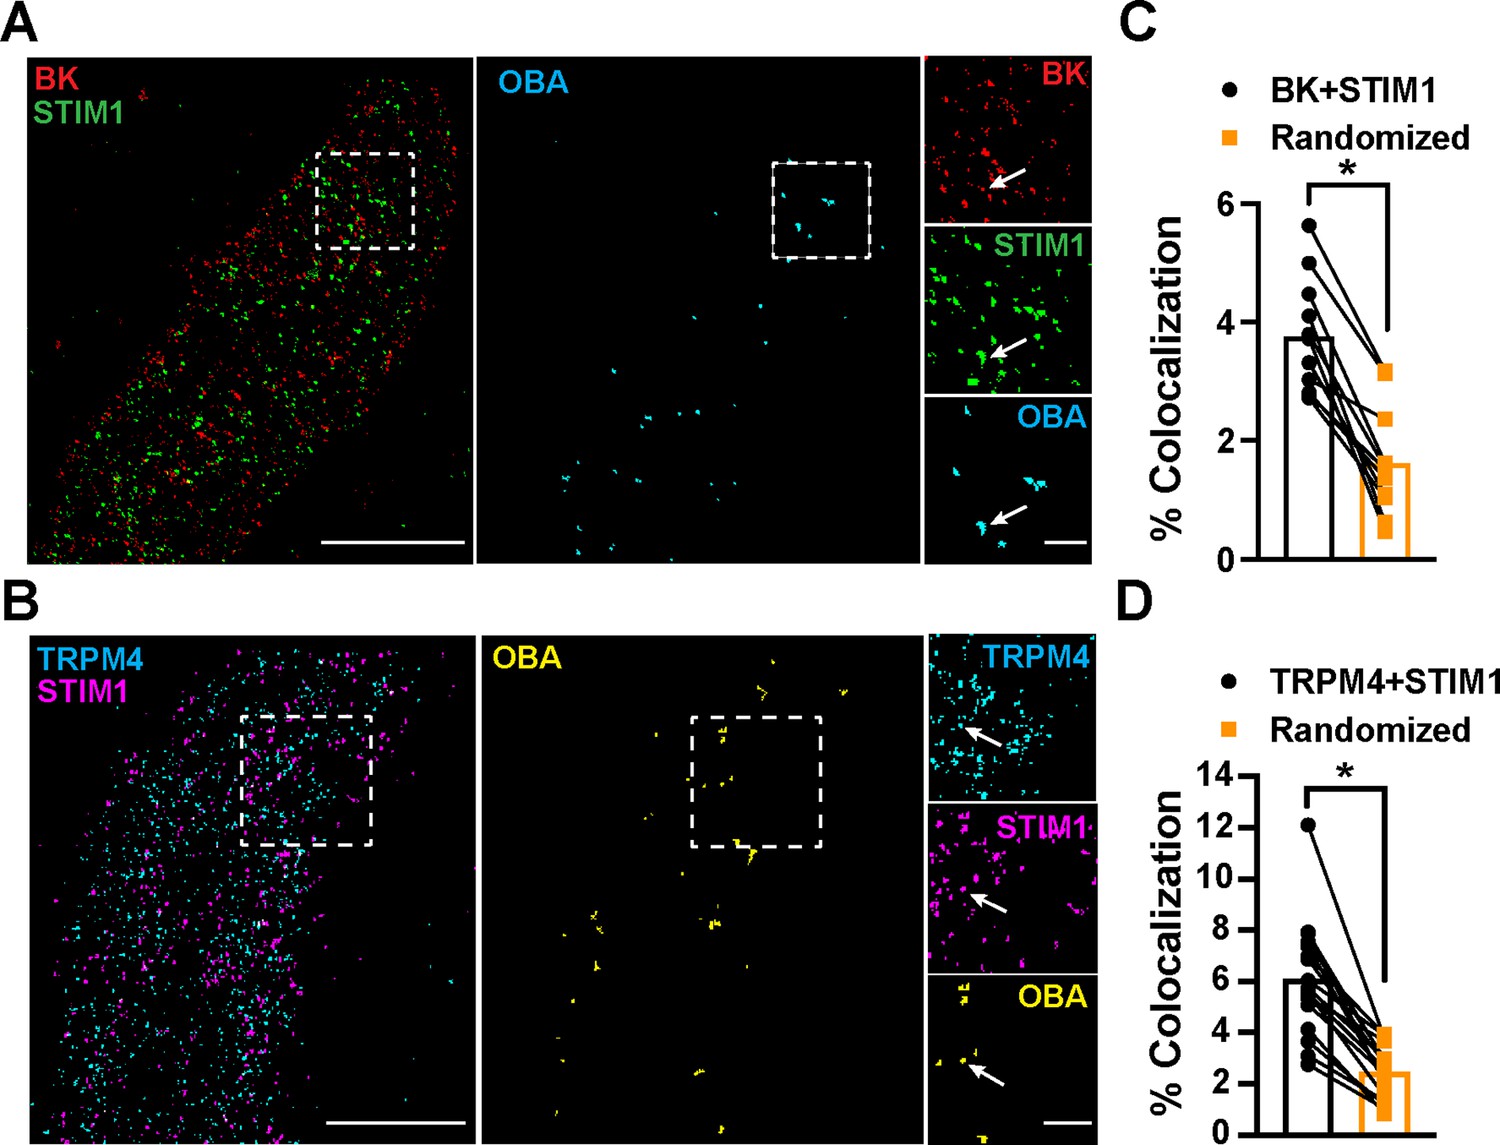
STIM1 colocalizes with BK and TRPM4.
(A) Total internal reflection fluorescence (TIRF)-mode superresolution localization maps of freshly isolated vascular smooth muscle cells (VSMCs) from control mice immunolabeled for BK (red) and STIM1 (green). Colocalized BK and STIM1 clusters were identified by object-based analysis (OBA) and mapped (cyan). Scale bar: 3 µm. Panels to the right show enlarged areas of the original superresolution maps indicated by the white boxes. Arrows show examples of colocalizing clusters. Scale bar: 500 nm. (B) TIRF-mode superresolution localization maps of freshly isolated VSMCs from control mice immunolabeled for TRPM4 (cyan) and STIM1 (magenta). Colocalized TRPM4 and STIM1 clusters were identified by OBA and mapped (yellow). Scale bar: 2 µm. Panels to the right show enlarged areas of the original superresolution maps indicated by the white boxes. Arrows show examples of colocalizing clusters. Scale bar: 500 nm. (C) Colocalization frequency of BK and STIM1 clusters in imaged cells compared to colocalization frequency of BK and STIM1 clusters in randomized maps generated from respective cells. n = 11 cells from four mice (*p<0.05, paired t-test). (D) Colocalization frequency of TRPM4 and STIM1 clusters in imaged cells compared to colocalization frequency of TRPM4 and STIM1 clusters in randomized maps generated from respective imaged cells (n = 11 cells from four mice; *p<0.05, paired t-test).
-
Figure 5—source data 1
Individual data points and analysis summaries for datasets shown in Figure 5.
- https://cdn.elifesciences.org/articles/70278/elife-70278-fig5-data1-v2.xlsx
Figure 6
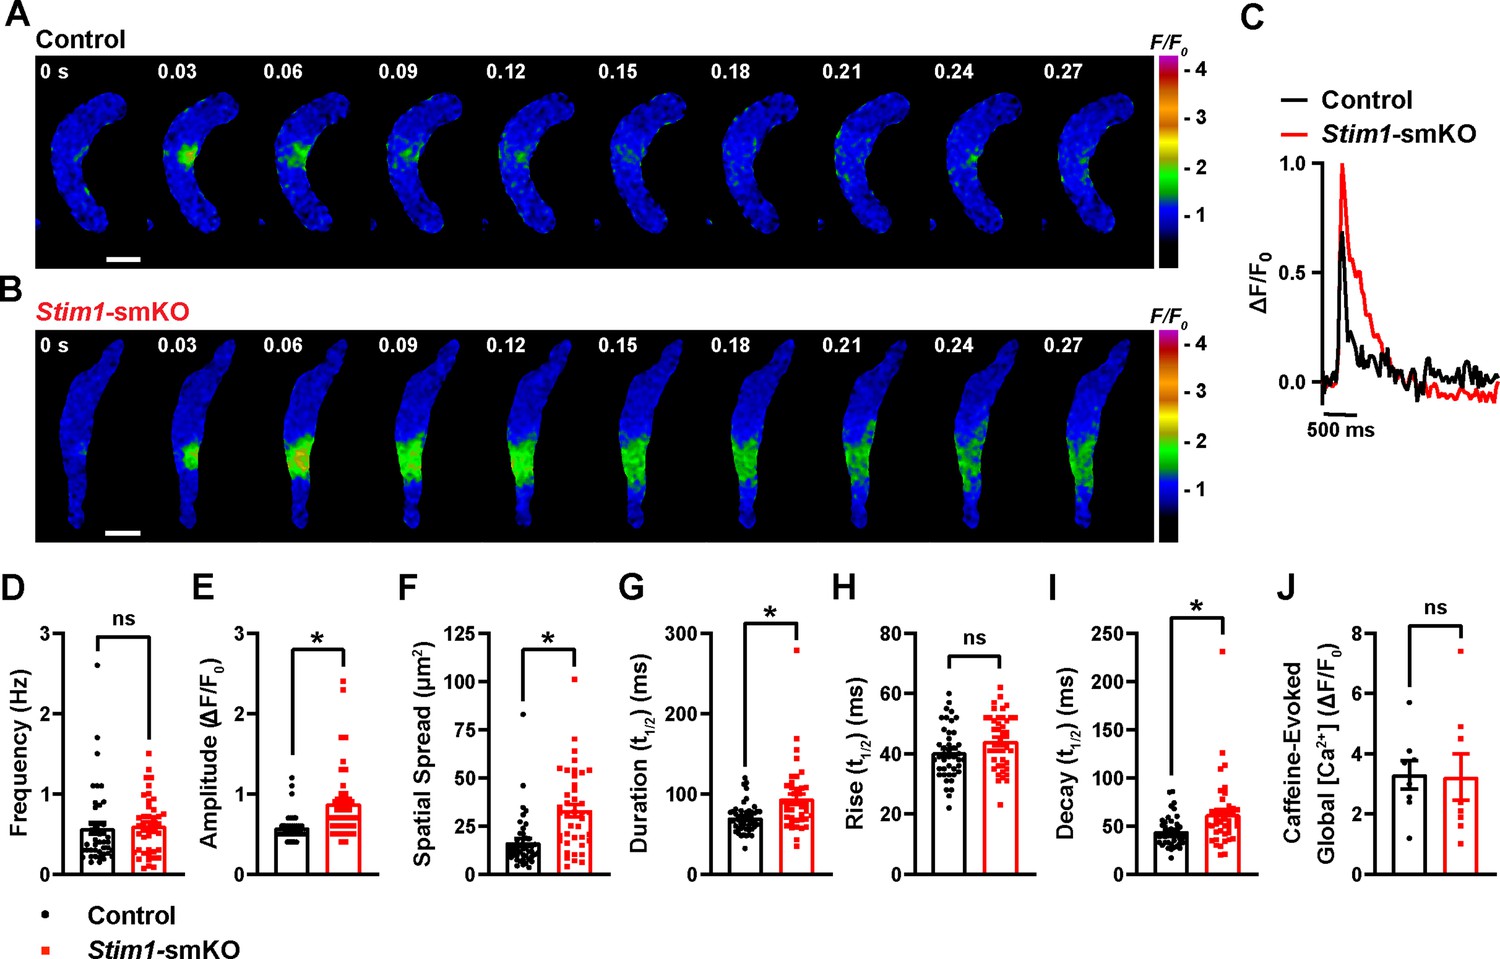
Stim1 knockout alters Ca2+ spark properties.
(A, B) Representative time-course images of cerebral artery smooth muscle cells (SMCs) isolated from a control (A) or Stim1-smKO (B) mouse exhibiting Ca2+ spark events, presented as changes in fractional fluorescence (F/F0). The elapsed time of the event is shown in seconds (s). Scale bar: 10 µm. (C) Representative traces of Ca2+ spark events in cerebral artery SMCs isolated from a control (black trace) or Stim1-smKO (red trace) mice presented as changes in fractional fluorescence (ΔF/F0) vs. time. (D–I) Summary data showing Ca2+ spark frequency (D), amplitude (E), spatial spread (F), event duration (G), rise time (H), and decay time (I) in vascular smooth muscle cells (VSMCs) isolated from control and Stim1-smKO mice (control, n = 43 spark sites in 18 cells from four mice; Stim1-smKO, n = 41 spark sites in 19 cells from four mice; *p<0.05, unpaired t-test). ns, not significant. (J) Summary data showing caffeine (10 mM)-evoked changes in global Ca2+ in cerebral artery SMCs isolated from control and Stim1-smKO mice (control, n = 8 cells from four mice; Stim1-smKO, n = 8 cells from four mice, unpaired t-test). ns, not significant.
-
Figure 6—source data 1
Individual data points and analysis summaries for datasets shown in Figure 6.
- https://cdn.elifesciences.org/articles/70278/elife-70278-fig6-data1-v2.xlsx
Figure 7 with 2 supplements

Stim1 knockout diminishes physiological BK and TRPM4 channel activity.
(A) Representative traces of spontaneous transient outward currents (STOCs) in cerebral artery smooth muscle cells (SMCs) from control and Stim1-smKO mice, recorded by perforated patch-clamp electrophysiology over a range of membrane potentials (−60 to 0 mV). (B, C) Summary data showing STOC frequency (B) and amplitude (C) (control, n = 13 cells from four animals; Stim1-smKO, n = 17 cells from five mice; *p<0.05, two-way ANOVA). (D) Representative traces of paxilline (1 μM)-sensitive BK currents in cerebral artery SMCs from control and Stim1-smKO mice, recorded by patch-clamping in conventional whole-cell mode during a series of command voltage steps (−100 to +100 mV). (E) Summary data for whole-cell BK currents (control, n = 6 cells from three mice; Stim1-smKO, n = 7 cells from three mice; two-way ANOVA). (F) Representative traces of TRPM4 currents in cerebral artery SMCs from control and Stim1-smKO mice voltage-clamped at –70 mV, recorded using perforated patch-clamp electrophysiology. TRPM4 currents were evoked as transient inward cation currents (TICCs) by application of negative pressure (–20 mmHg) through the patch pipette and were blocked by bath application of 9-phenanthrol (9-phen; 30 μM). (G) Summary data showing TICC activity as TRPM4 channel open probability (NPo) and (H) TICC amplitude in control (n = 12 cells from five mice) and Stim1-smKO (n = 15 cells from five mice) mice (*p<0.05, unpaired t-test). (I) Representative conventional whole-cell patch-clamp recordings of 9-phenanthrol–sensitive TRPM4 currents in cerebral artery SMCs from control and Stim1-smKO mice. Currents were activated by free Ca2+ (200 µM), included in the patch pipette solution, and were recorded using a ramp protocol from –100 to 100 mV from a holding potential of –60 mV. (J) Summary of whole-cell TRPM4 current density at +100 mV (control, n = 5 cells from three mice; Stim1-smKO, n = 5 cells from three mice, unpaired t-test). ns, not significant.
-
Figure 7—source data 1
Individual data points and analysis summaries for datasets shown in Figure 7.
- https://cdn.elifesciences.org/articles/70278/elife-70278-fig7-data1-v2.xlsx
Figure 7—figure supplement 1
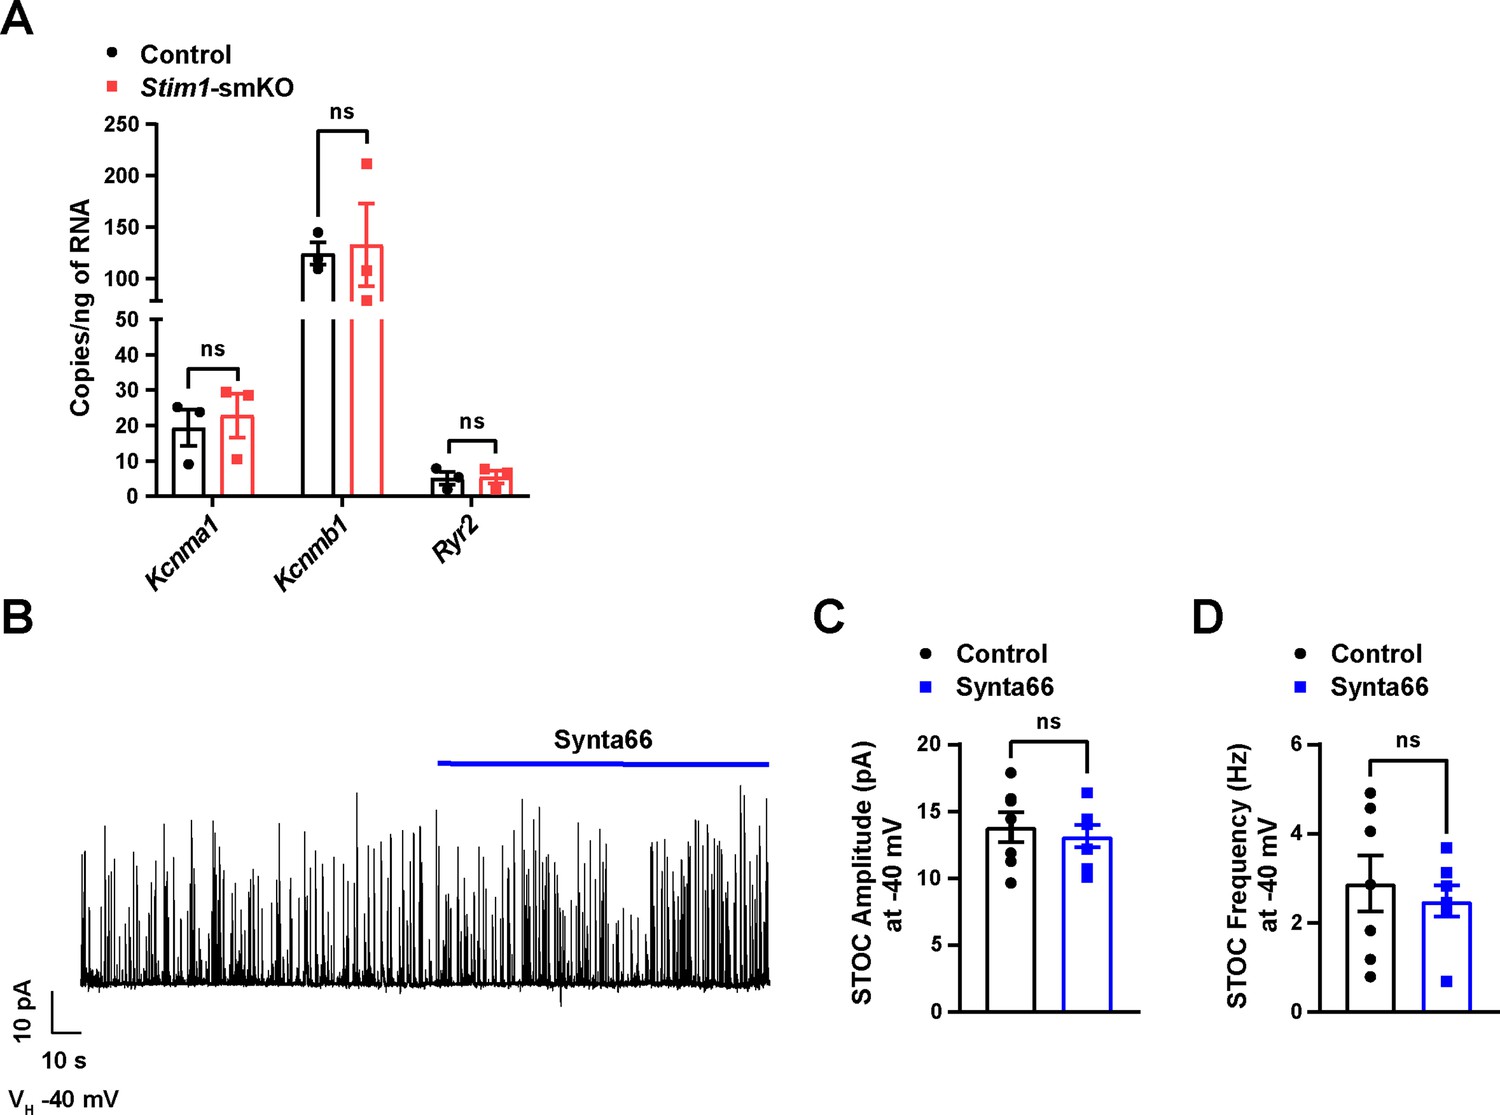
Orai1 blockade by Synta66 does not affect STOC amplitude or frequency in cerebral artery SMCs.
(A) mRNA expression levels (transcript copies/ng of RNA) of Kcnma1 (BKα1), Kcnmb1 (BKβ1), and Ryr2 (RyR2) in cerebral arteries from control and Stim1-smKO mice. Data are presented as means ± SEM (n = 3 mice in each group, unpaired t-test). ns, not significant. (B) Representative trace of spontaneous transient outward currents (STOCs) recorded from a vascular smooth muscle cell (VSMC) isolated from a control mouse before and after the selective Orai1 blocker Synta66 (10 µM) was applied. (C, D) Summary data showing STOC amplitude (C) and frequency (D) in the absence (control) and presence of Synta66 (10 µM) (n = 7 cells from four animals, unpaired t-test). ns, not significant.
-
Figure 7—figure supplement 1—source data 1
Individual data points and analysis summaries for datasets shown in Figure 7—figure supplement 1.
- https://cdn.elifesciences.org/articles/70278/elife-70278-fig7-figsupp1-data1-v2.xlsx
Figure 7—figure supplement 2
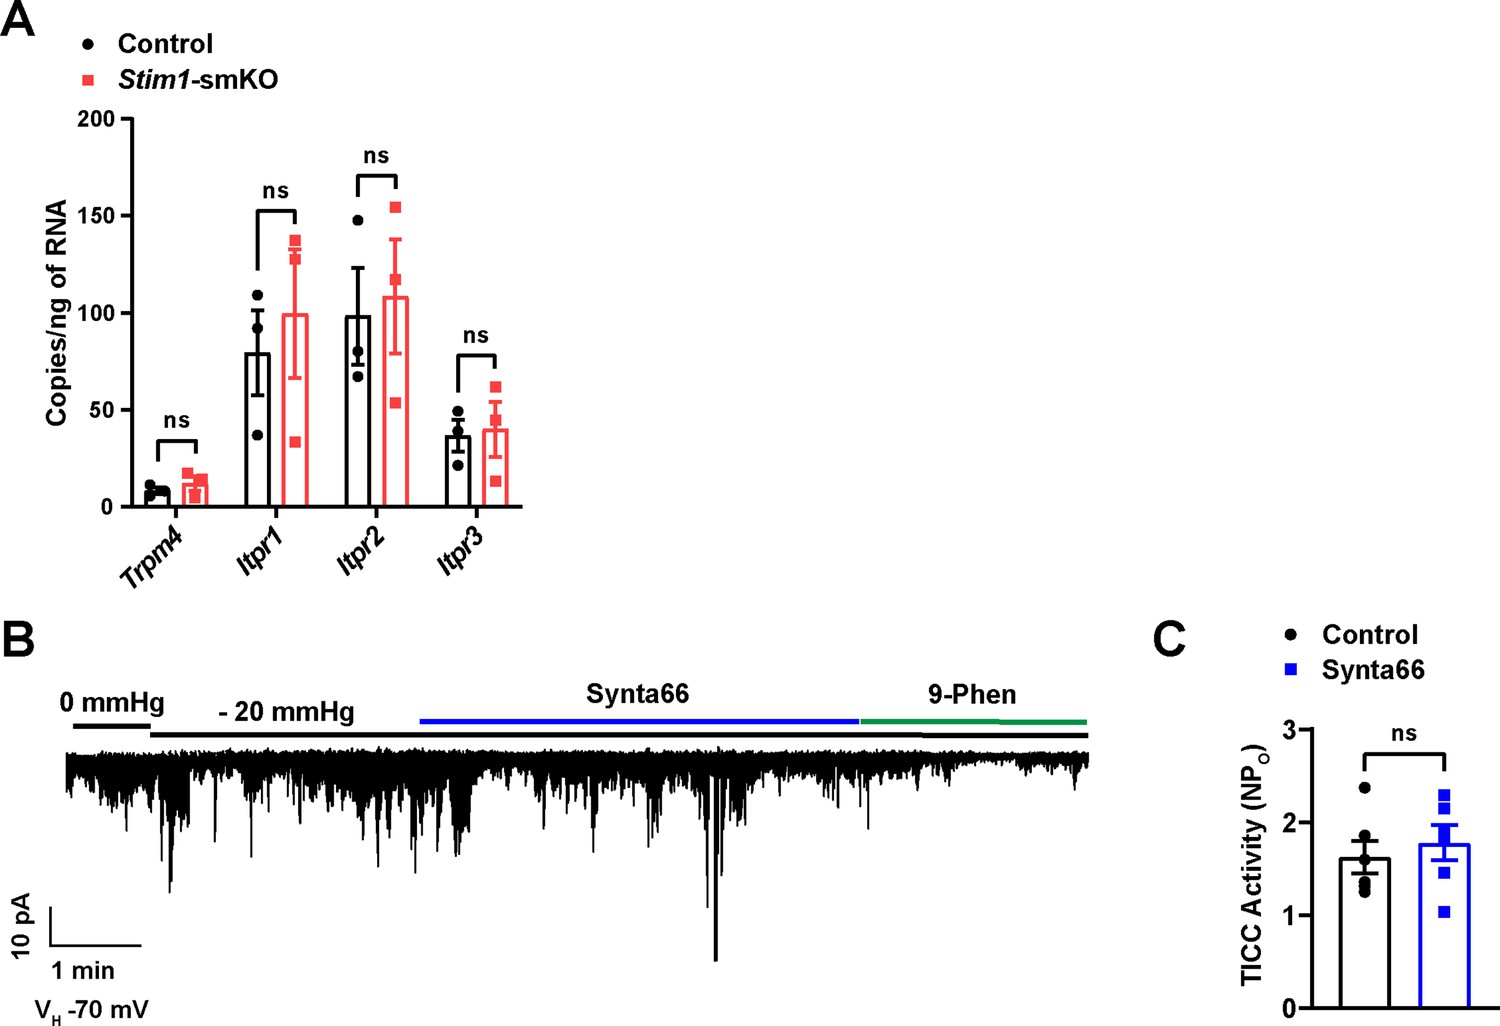
Orai1 blockade by Synta66 does not affect TICC activity in cerebral artery SMCs.
(A) mRNA expression levels of Trpm4 (TRPM4), Itpr1 (IP3R1), Itpr2 (IP3R2), and Itpr3 (IP3R3) in cerebral arteries from control and Stim1-smKO mice. Data are presented as means ± SEM (n = 3 mice in each group, unpaired t-test). ns, not significant. (B) Representative trace of transient inward cation currents (TICCs) evoked by application of negative pressure (–20 mmHg) through the patch pipette in vascular smooth muscle cells (VSMCs) from a control mouse voltage-clamped at –70 mV recorded by patch-clamping in the perforated-patch configuration. TRPM4 currents were blocked by bath application of 9-phenanthrol (9-phen; 30 μM). (C) Summary data showing TICC activity as TRPM4 channel open probability (NPo) in the absence (control) and presence of Synta66 (10 µM) (n = 6 cells from three animals for each group. unpaired t-test). ns, not significant.
-
Figure 7—figure supplement 2—source data 1
Individual data points and analysis summaries for datasets shown in Figure 7—figure supplement 2.
- https://cdn.elifesciences.org/articles/70278/elife-70278-fig7-figsupp2-data1-v2.xlsx
Figure 8 with 1 supplement
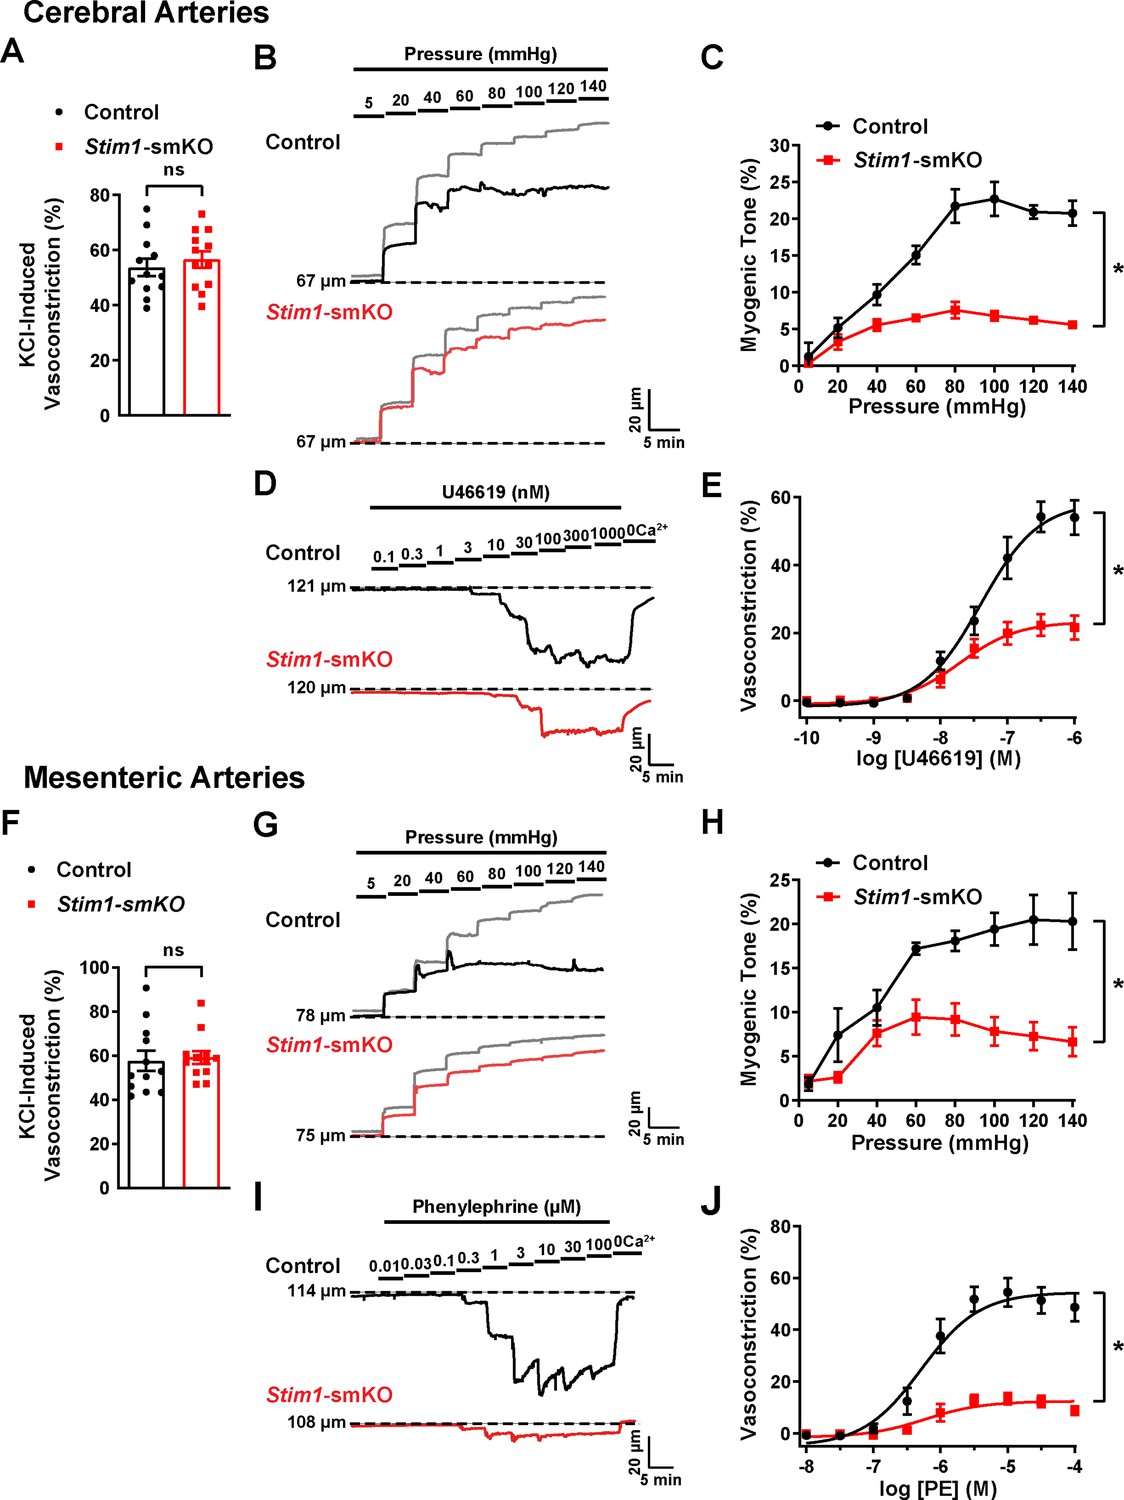
Resistance arteries from Stim1-smKO mice are dysfunctional.
(A) Summary data showing vasoconstriction of cerebral pial arteries isolated from control and Stim1-smKO mice in response to 60 mM KCl (n = 12 vessels from six mice for both groups, unpaired t-test). ns, not significant. (B) Representative traces showing changes in luminal diameter over a range of intraluminal pressures (5–140 mmHg) in cerebral pial arteries isolated from control (black trace) and Stim1-smKO (red) mice. Gray traces represent passive responses (Ca2+-free solution) to changes in intraluminal pressure for each artery. (C) Summary data showing myogenic reactivity as a function of intraluminal pressure (n = 6 vessels from three mice for each group; *p<0.05, two-way ANOVA). (D) Representative traces showing changes in luminal diameter in response to a range of concentrations (0.1–1,000 nM) of the vasoconstrictor agonist U46619 in cerebral arteries isolated from control (black trace) and Stim1-smKO (red trace) mice. (E) Summary data showing vasoconstriction as a function of U46619 concentration (n = 6 vessels from three mice for each group; *p<0.05, two-way ANOVA). (F) Summary data showing vasoconstriction of third-order mesenteric arteries isolated from control and Stim1-smKO mice in response to 60 mM KCl (n = 12 vessels from six mice for both groups, unpaired t-test). ns, not significant. (G) Representative traces showing changes in luminal diameter over a range of intraluminal pressures (5–140 mmHg) in third-order mesenteric arteries isolated from control (black trace) and Stim1-smKO (red) mice. Gray traces represent passive responses to changes in intraluminal pressure for each artery. (H) Summary data for myogenic reactivity as a function of intraluminal pressure (n = 6 vessels from three mice for each group, *p<0.05, two-way ANOVA). (I) Representative traces showing changes in luminal diameter in response to a range of concentrations (0.01–100 μM) of the vasoconstrictor agonist phenylephrine (PE) in third-order mesenteric arteries isolated from control (black trace) and Stim1-smKO (red trace) mice. (J) Summary data for vasoconstriction as a function of PE concentration, presented as means ± SEM (n = 6 vessels from three mice for each group; *p<0.05, two-way ANOVA).
-
Figure 8—source data 1
Individual data points and analysis summaries for datasets shown in Figure 8.
- https://cdn.elifesciences.org/articles/70278/elife-70278-fig8-data1-v2.xlsx
Figure 8—figure supplement 1
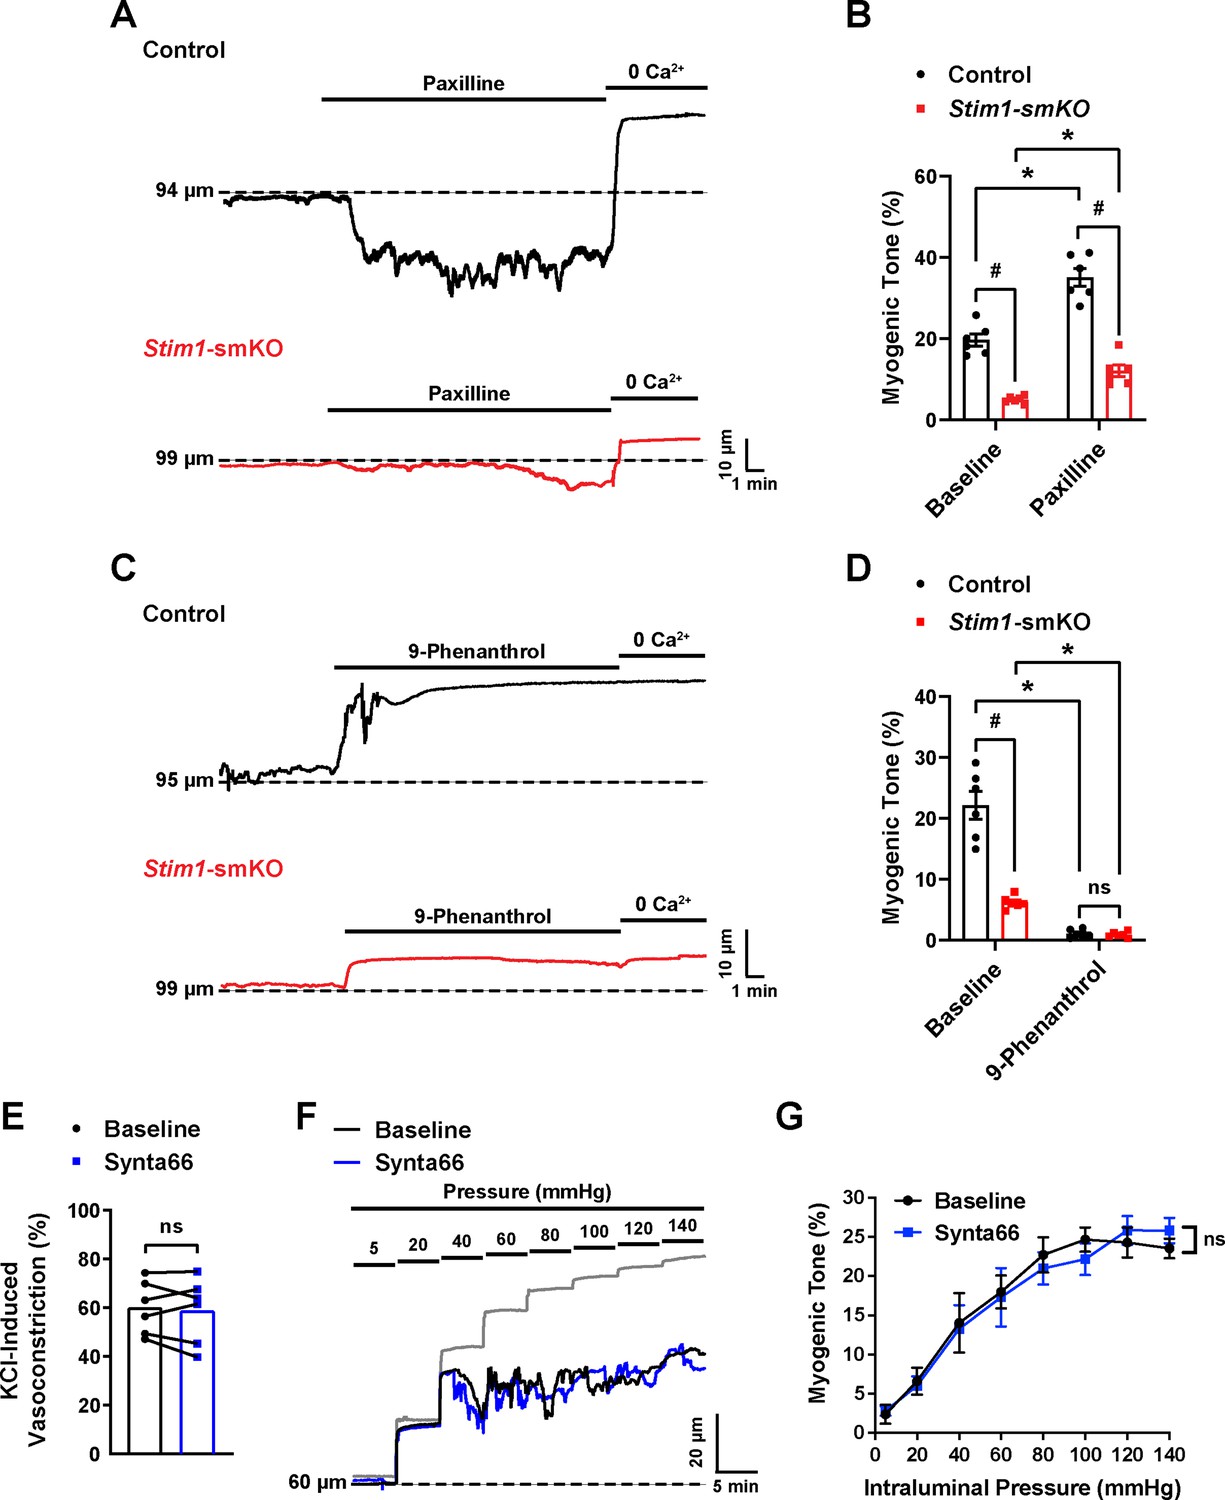
Effects of pharmacological inhibition of BK channel, TRPM4 channel and Orai1 channel on myogenic tone in isolated cerebral arteries.
(A, B) Representative traces (A) and summary data (B) showing the effects of the BK channel blocker paxilline (1 µM) on the myogenic tone (60 mmHg) of cerebral pial arteries isolated from control (black trace) and Stim1-smKO (red trace) mice with (n = 6 vessels from three mice, *p<0.05 between untreated and treated, #p<0.05 between the control and Stim1-smKO groups, two-way ANOVA). (C, D) Representative traces (C) and summary data (D) showing the effects of the TRPM4 channel blocker 9-phenanthrol (9-phen; 30 μM) on the myogenic tone of cerebral pial arteries isolated from control (black trace) and Stim1-smKO (red trace) mice (n = 6 vessels from three mice, *p<0.05 between untreated and treated, #p<0.05 between the control and Stim1-smKO groups, two-way ANOVA). ns, not significant. (E) Summary data showing vasoconstriction of cerebral pial arteries isolated from control mice in response to 60 mM KCl with or without (baseline) the selective Orai1 blocker Synta66 (10 μM) (n = 6 vessels from three mice per group, paired t-test). ns, not significant. (F) Representative traces showing changes in luminal diameter over a range of intraluminal pressures (5–140 mmHg) in isolated cerebral pial arteries before (black) and after (blue) treatment with Synta66 (10 µM). Gray trace represents passive response to changes in intraluminal pressure. (G) Summary data showing that Synta66 had no effect on myogenic tone (n = 12 vessels from six mice for both groups, two-way ANOVA). ns, not significant.
-
Figure 8—figure supplement 1—source data 1
Individual data points and analysis summaries for datasets shown in Figure 8—figure supplement 1.
- https://cdn.elifesciences.org/articles/70278/elife-70278-fig8-figsupp1-data1-v2.xlsx
Figure 9 with 1 supplement
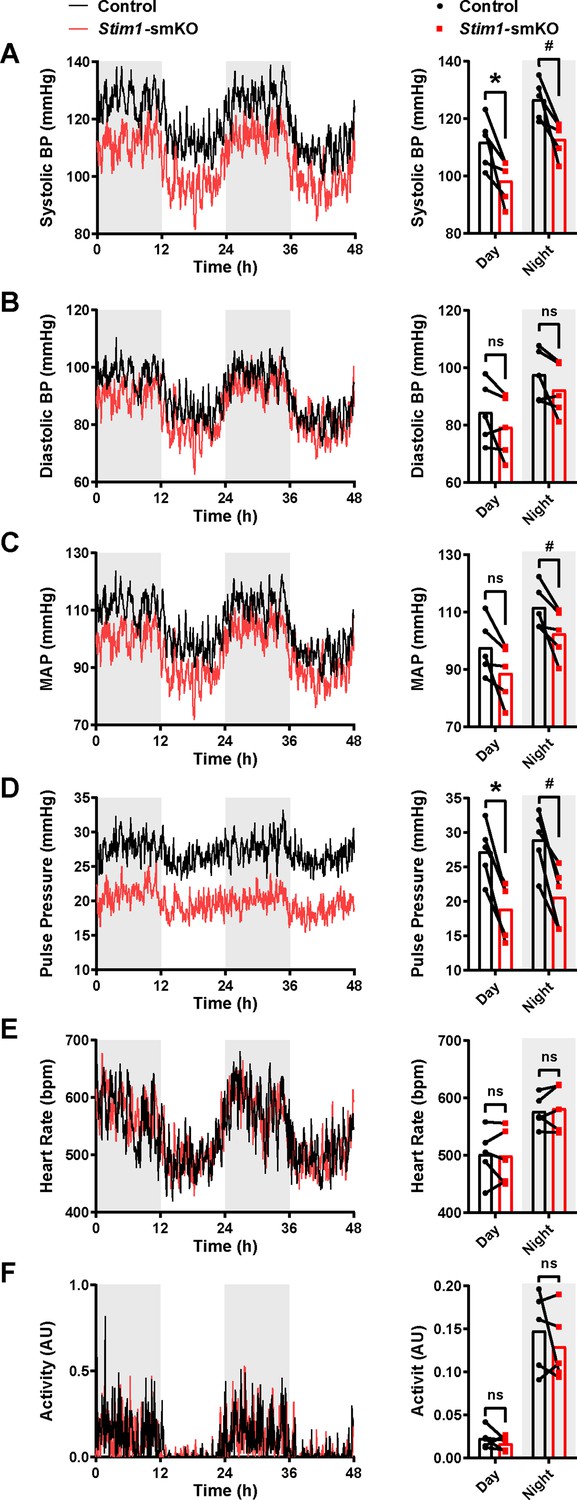
Stim1-smKO mice are hypotensive.
(A) Systolic blood pressure (BP) (mmHg) over 48 hr in conscious, radio telemeter-implanted Myh11CreERT2: Stim1fl/fl mice before (control) and after (Stim1-smKO) tamoxifen injection. Shaded regions depict night cycles (n = 5 for both groups; *p<0.05 vs. control day, #p<0.05 vs. control night, paired t-test). (B) Diastolic BP measurements for control and Stim1-smKO mice (n = 5 for both groups, paired t-test). ns, not significant. (C) Mean arterial pressure (MAP) for control and Stim1-smKO mice (n = 5 for both groups, #p<0.05 vs. control night, paired t-test). ns, not significant. (D) Pulse pressure for control and Stim1-smKO mice (n = 5 for both groups; *p<0.05 vs. control day, #p<0.05 vs. control night, paired t-test). (E) Heart rate (HR) for control and Stim1-smKO mice (n = 5 for both groups, paired t-test). ns, not significant. (F) Locomotor activity (arbitrary units [AU]) for control and Stim1-smKO mice (n = 5 for both groups, paired t-test). ns, not significant. 48 hr recordings are shown as means; bar graphs are shown as means ± SEM.
-
Figure 9—source data 1
Individual data points and analysis summaries for datasets shown in Figure 9.
- https://cdn.elifesciences.org/articles/70278/elife-70278-fig9-data1-v2.xlsx
Figure 9—figure supplement 1
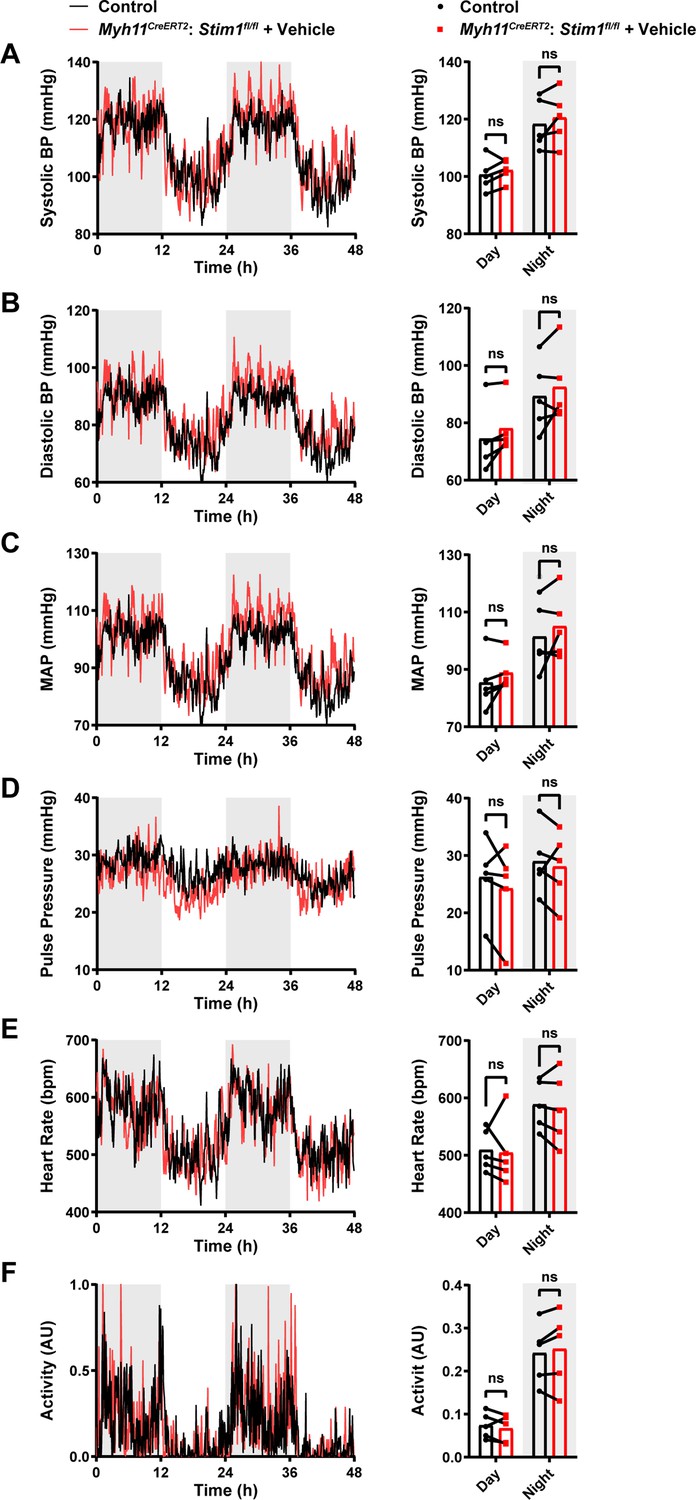
Blood pressure, heart rate and activity remain unaltered in Myh11CreERT2: Stim1fl/fl mice after vehicle injection.
(A) Systolic blood pressure (BP) (mmHg) over 48 hr in conscious, radio telemeter-implanted Myh11CreERT2: Stim1fl/fl mice before (control) and after vehicle injection. Shaded regions depict night cycles (n = 5 for both groups, paired t-test). (B) Diastolic BP measurements for Myh11CreERT2: Stim1fl/fl mice before and after vehicle injection (n = 5 for both groups, paired t-test). (C) Mean arterial pressure (MAP) for Myh11CreERT2: Stim1fl/fl mice before and after vehicle injection (n = 5 for both groups, paired t-test). (D) Pulse pressure for Myh11CreERT2: Stim1fl/fl mice before and after vehicle injection (n = 5 for both groups, paired t-test). (E) Heart rate (HR) for Myh11CreERT2: Stim1fl/fl mice before and after vehicle injection (n = 5 for both groups, paired t-test). (F) Locomotor activity (arbitrary units [AU]) for Myh11CreERT2: Stim1fl/fl mice before and after vehicle injection (n = 5 for both groups, paired t-test). ns, not significant. 48 hr recordings are shown as means; bar graphs are shown as means ± SEM.
-
Figure 9—figure supplement 1—source data 1
Individual data points and analysis summaries for datasets shown in Figure 9—figure supplement 1.
- https://cdn.elifesciences.org/articles/70278/elife-70278-fig9-figsupp1-data1-v2.xlsx
Videos
Video 1
Plasma membrane-sarcoplasmic reticulum (PM-SR) interactions in a cerebral artery smooth muscle cell (SMC) isolated from a control mouse.
Animated representation of a SIM image series reconstructed and rendered in 3D. The PM is shown in red and made transparent for better visualization; the SR is shown in green, and colocalized areas are shown in yellow.
Video 2
Plasma membrane-sarcoplasmic reticulum (PM-SR) interactions in a cerebral artery smooth muscle cell (SMC) isolated from a Stim1-smKO mouse.
Animated representation of a SIM image series reconstructed and rendered in 3D. The PM is shown in red and made transparent for better visualization; the SR is shown in green, and areas of colocalization are shown in yellow.
Video 3
Representative movie showing spontaneous Ca2+ sparks in a cerebral artery smooth muscle cell (SMC) isolated from a control mouse.
Video 4
Representative movie showing spontaneous Ca2+ sparks in a cerebral artery smooth muscle cell (SMC) isolated from a Stim1-smKO mouse.
Tables
Appendix 1—key resources table
| Reagent type (species) or resource | Designation | Source or reference | Identifiers | Additional information |
|---|---|---|---|---|
| Genetic reagent (Mus musculus) | C57BL/6J; wild type | Jackson Laboratory | Strain# 000664; RRID:IMSR_JAX:000664 | |
| Genetic reagent (M. musculus) | Stim1fl/fl | Jackson Laboratory | Strain# 023350; RRID:IMSR_JAX:023350 | |
| Genetic reagent (M. musculus) | Myh11Cre; Myh11Cre/ERT2 | Jackson Laboratory | Strain# 019079; RRID:IMSR_JAX:019079 | |
| Antibody | Anti-Stim1 (rabbit polyclonal) | Sigma-Aldrich | Cat# S6072; RRID:AB_1079008 | (1:1000) |
| Antibody | Anti-Stim1 (rabbit polyclonal) | Cell Signaling Technologies | Cat# 4916; RRID:AB_2271287 | (1:100) |
| Antibody | Anti-Stim1 (mouse monoclonal) | BD Biosciences | Cat# 610954; RRID:AB_398267 | (1:50) |
| Antibody | Anti-BKα1 (rabbit polyclonal) | Alomone Labs | Cat# APC-021; RRID:AB_2313725 | (1:100) |
| Antibody | Anti-RyR2 (mouse monoclonal) | Thermo Fisher Scientific | Cat# MA3-916; RRID:AB_2183054 | (1:50) |
| Antibody | Anti-TRPM4 (goat polyclonal) | https://Antibodies-online.com | Cat# ABIN572220; RRID:AB_10787216 | (1:400) |
| Antibody | Anti-IP3R (rabbit polyclonal) | Abcam | Cat# ab5804; RRID:AB_305124 | (1:200) |
| Antibody | Alexa Fluor 647-conjugated anti-mouse IgG (goat polyclonal) | Thermo Fisher Scientific | Cat# A-21236; RRID:AB_2535805 | (1:1000) |
| Antibody | Alexa Fluor 532- conjugated anti-rabbit IgG (goat polyclonal) | Thermo Fisher Scientific | Cat# A-11009; RRID:AB_2534076 | (1:1000) |
| Antibody | Alexa Fluor 647- conjugated anti-goat IgG (donkey polyclonal) | Abcam | Cat# ab150131; RRID:AB_2732857 | (1:1000) |
| Antibody | Alexa Fluor 568- conjugated anti-rabbit IgG (donkey polyclonal) | Thermo Fisher Scientific | Cat# A10042; RRID:AB_2534017 | (1:1000) |
| Other | ER-Tracker Green | Thermo Fisher Scientific | Cat# E34251 | (1:1000) |
| Other | Cell-Mask Deep Red | Thermo Fisher Scientific | Cat# C10046 | (1:1000) |
| Other | Fluo-4 AM | Thermo Fisher Scientific | Cat# F14201 | 1 µM |
| Other | Fura-2 AM | Thermo Fisher Scientific | Cat# F1221 | 4 µM |
| Chemical compound, drug | Tamoxifen | Sigma-Aldrich | Cat# T5648 | |
| Chemical compound, drug | Triton X-100 | Sigma-Aldrich | CAS# 9036-19-5 | |
| Chemical compound, drug | SEABLOCK | Thermo Fisher Scientific | Cat# 37527 | |
| Chemical compound, drug | Cysteamine hydrochloride | Sigma-Aldrich | CAS# 156-57-0 | |
| Chemical compound, drug | Twinsil | Picodent | Cat# 1300 5000 | |
| Chemical compound, drug | TRIzol | Thermo Fisher Scientific | Cat# 15596026 | |
| Chemical compound, drug | Synta66 | Sigma-Aldrich | Cat# SML1949 | |
| Chemical compound, drug | Paxilline | Sigma-Aldrich | Cat# P2928 | |
| Chemical compound, drug | 9-Phenanthrol | Sigma-Aldrich | Cat# 211281 | |
| Peptide, recombinant protein | Papain | Worthington Biochemical Corporation | Cat# LS003119 | |
| Peptide, recombinant protein | Collagenase type 2 | Worthington Biochemical Corporation | Cat# LS004202 | |
| Peptide, recombinant protein | Glucose oxidase | Sigma-Aldrich | Cat# G2133 | |
| Peptide, recombinant protein | Catalase | Sigma-Aldrich | Cat# C40 | |
| Commercial assay or kit | 5X RIPA buffer with Protease Inhibitor Cocktail | Cell Biolabs | Cat# AKR-190 | |
| Commercial assay or kit | BCA Protein Assay Kit | Thermo Fisher Scientific | Cat# 23225 | |
| Commercial assay or kit | 12–230 kDa Separation module | ProteinSimple | Cat# SM-W004 | |
| Commercial assay or kit | Anti-Rabbit Detection Module | ProteinSimple | Cat# DM-001 | |
| Commercial assay or kit | Total Protein Detection Module | ProteinSimple | Cat# DM-TP01 | |
| Commercial assay or kit | Direct-zol RNA microprep kit | Zymo Research | Cat# R2060 | |
| Commercial assay or kit | qScript cDNA Supermix | Quanta Biosciences | Cat# 95047 | |
| Commercial assay or kit | QX200 ddPCR EvaGreen Supermix | Bio-Rad | Cat# 186-4033 | |
| Software, algorithm | Compass for SW software | ProteinSimple | https://www.proteinsimple.com/compass/downloads | |
| Software, algorithm | Imaris software | Bitplane/Oxford Instruments | https://imaris.oxinst.com/packages; RRID:SCR_007370 | |
| Software, algorithm | Leica Application Suite X software | Leica | https://www.leica-microsystems.com/products/microscope-software/details/product/leica-las-x-ls/RRID:SCR_013673 | |
| Software, algorithm | ImageJ software | National Institutes of Health | https://imagej.net/;RRID:SCR_003070 | |
| Software, algorithm | pClamp software | Molecular Devices, LLC | http://www.moleculardevices.com/products/software/pclamp.html;RRID:SCR_011323 | |
| Software, algorithm | SparkAn custom software | Dr. Adrian Bonev and Dr. Mark Nelson; PMID:22095728 | N/A | Software used to analyze Ca2+ spark events kindly provided by Dr. Adrian Bonev and Dr. Mark Nelson from the University of Vermont |
| Software, algorithm | IonWizard software | IonOptix, LLC | https://www.ionoptix.com/products/software/ionwizard-core-and-analysis/ | |
| Software, algorithm | Ponemah software | Data Science International | https://www.datasci.com/products/software/ponemah;RRID:SCR_017107 | |
| Software, algorithm | GraphPad Prism Software | GraphPad Software, Inc | https://www.graphpad.com/;RRID:SCR_002798 |
Additional files
-
Transparent reporting form
- https://cdn.elifesciences.org/articles/70278/elife-70278-transrepform1-v2.pdf
-
Supplementary file 1
Percentage of overlapping clusters for BK:RyR2, RyR2:BK, TRPM4:IP3R, and IP3R:TRPM4 in control and Stim1-smKO cells.
- https://cdn.elifesciences.org/articles/70278/elife-70278-supp1-v2.docx
-
Supplementary file 2
Forward and reverse primer sequences used for ddPCR experiments.
- https://cdn.elifesciences.org/articles/70278/elife-70278-supp2-v2.docx
Download links
A two-part list of links to download the article, or parts of the article, in various formats.
Downloads (link to download the article as PDF)
Open citations (links to open the citations from this article in various online reference manager services)
Cite this article (links to download the citations from this article in formats compatible with various reference manager tools)
STIM1-dependent peripheral coupling governs the contractility of vascular smooth muscle cells
eLife 11:e70278.
https://doi.org/10.7554/eLife.70278


