Mendelian randomization suggests a bidirectional, causal relationship between physical inactivity and adiposity
- Novo Nordisk Foundation Center for Basic Metabolic Research, Faculty of Health and Medical Sciences, University of Copenhagen, Denmark
- Molecular Epidemiology, Department of Medical Sciences, and Science for Life Laboratory, Uppsala University, Sweden
- Department of Public Health, Section of Epidemiology, Faculty of Health and Medical Sciences, University of Copenhagen, Denmark
Figures
Figure 1
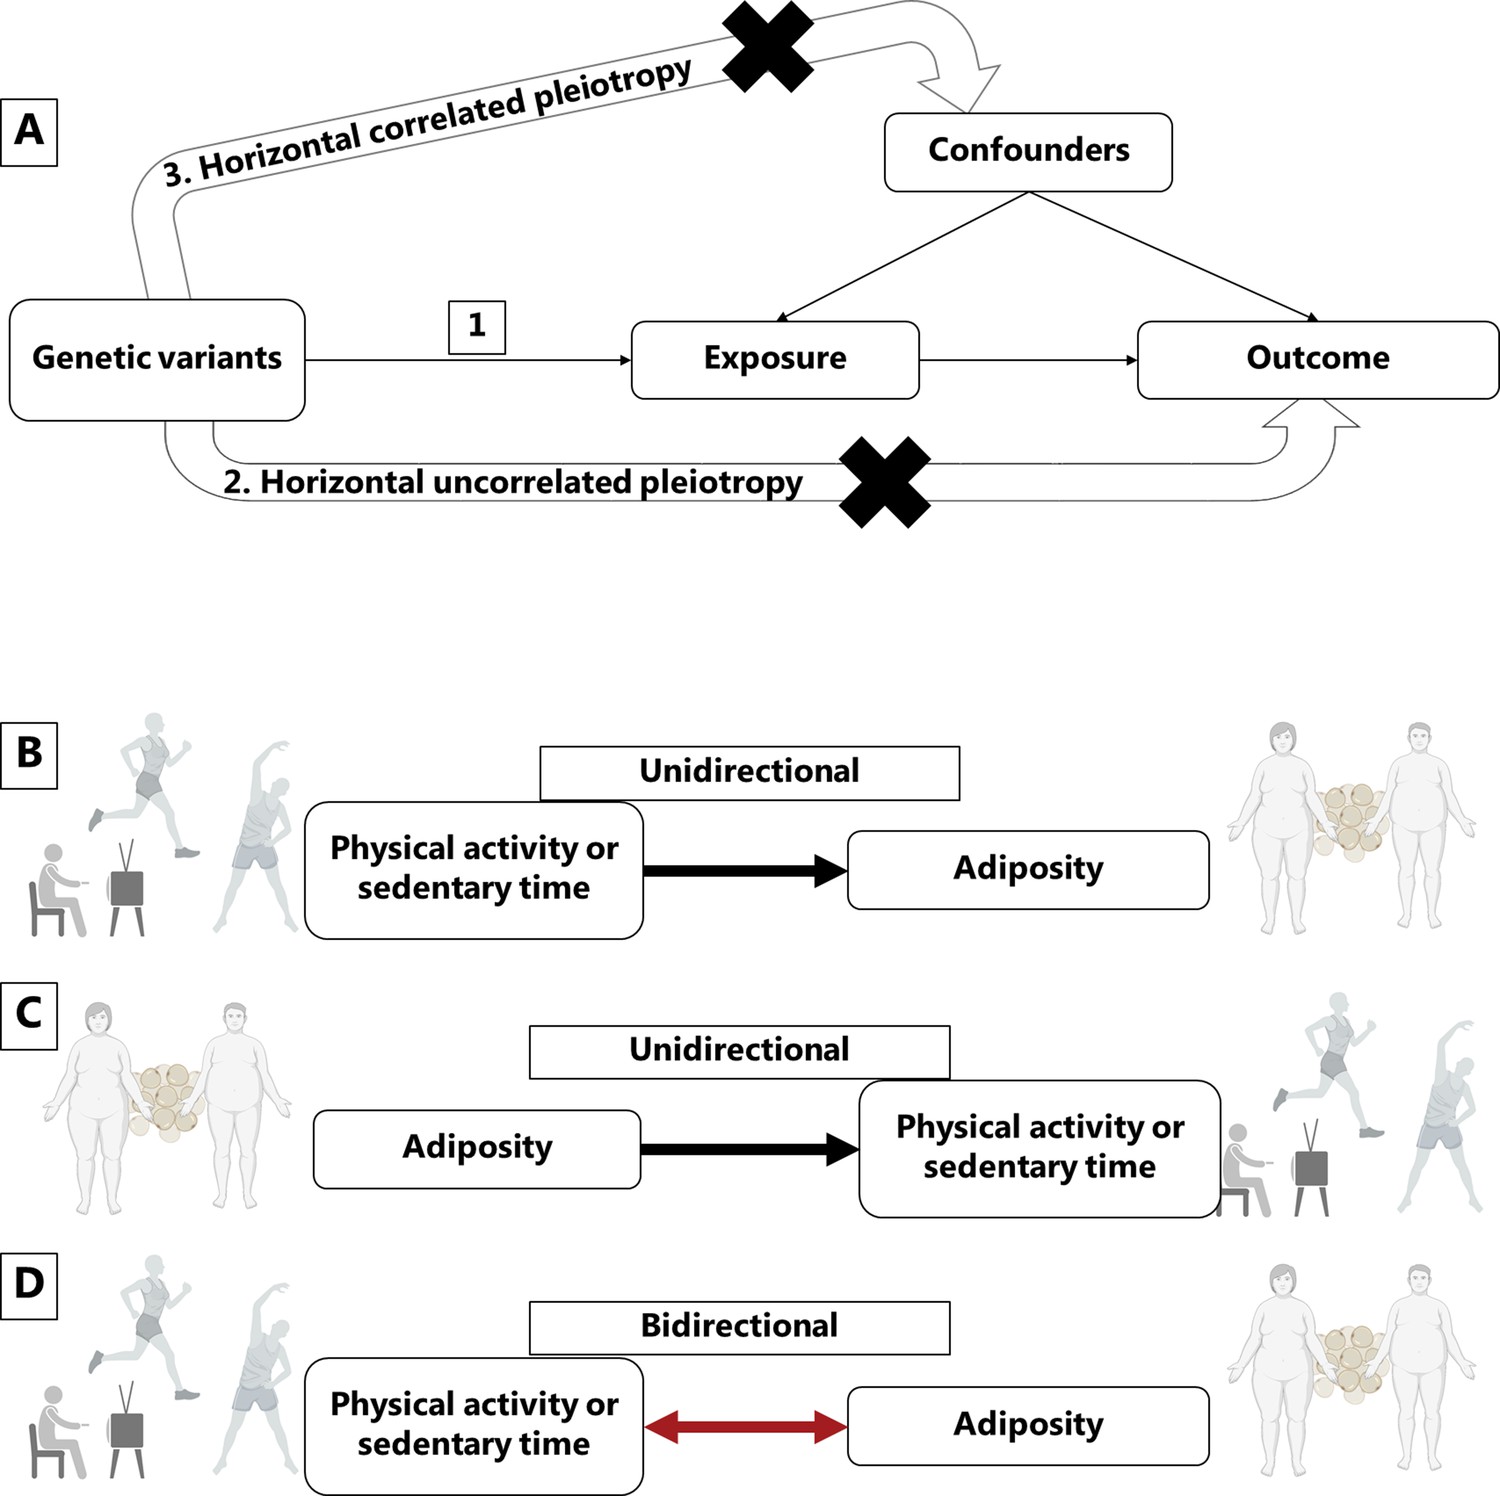
Mendelian randomization assumptions and directional associations between physical activity, sedentary time and adiposity.
Panel A shows Mendelian randomization assumptions when estimating the causal association between a given exposure and outcome: (1) The instruments are associated with the exposure, (2) the instruments do not cause the outcome independently from the exposure (horizontal uncorrelated pleiotropy), and (3) the effects of the exposure on the outcome are not influenced by any confounders (horizontal correlated pleiotropy). Panel B indicates a unidirectional causal effect of physical activity or sedentary time on adiposity, whereas panel C indicates a unidirectional causal effect of adiposity on physical activity or sedentary time. Panel D indicates a bidirectional causal relationship where physical activity or sedentary time has a causal effect on adiposity, but at the same time, adiposity has a causal effect on physical activity or sedentary time. Figure icons were created with BioRender.com.
Figure 2

Causal estimates for Mendelian randomization analyses using the CAUSE, inverse-variance-weighted (IVW), weighted median, and weighted mode methods.
Median causal estimates for Mendelian randomization analyses using the CAUSE method are shown in the left panel and mean causal estimates from the inverse variance weighted (IVW), weighted median (Wmedian) and weighted mode (Wmode) methods are shown in the right panel after outlier removal and accounting for horizontal pleiotropy. A diamond (♢) in the estimate for CAUSE indicates that the sharing model fit the data better than the causal model, that is that the association between the traits was more likely to be explained by horizontal correlated pleiotropy than causality. PA, physical activity; BMI, body mass index. Figure icons were created with BioRender.com.
Appendix 1—figure 1
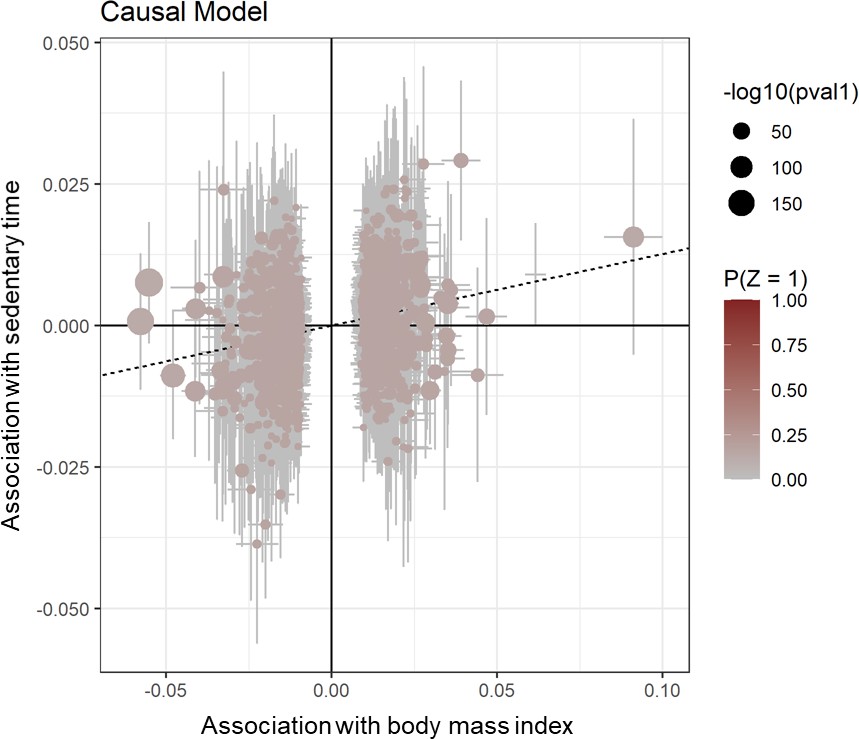
Scatter plot for CAUSE test statistics on the causal association between BMI and sedentary time.
Effect estimates for body mass index (x-axis) are plotted against estimates for sedentary time (y-axis). Error bars indicate 95% confidence intervals and the dotted line indicates the median causal effect of BMI on sedentary time.
Appendix 1—figure 2
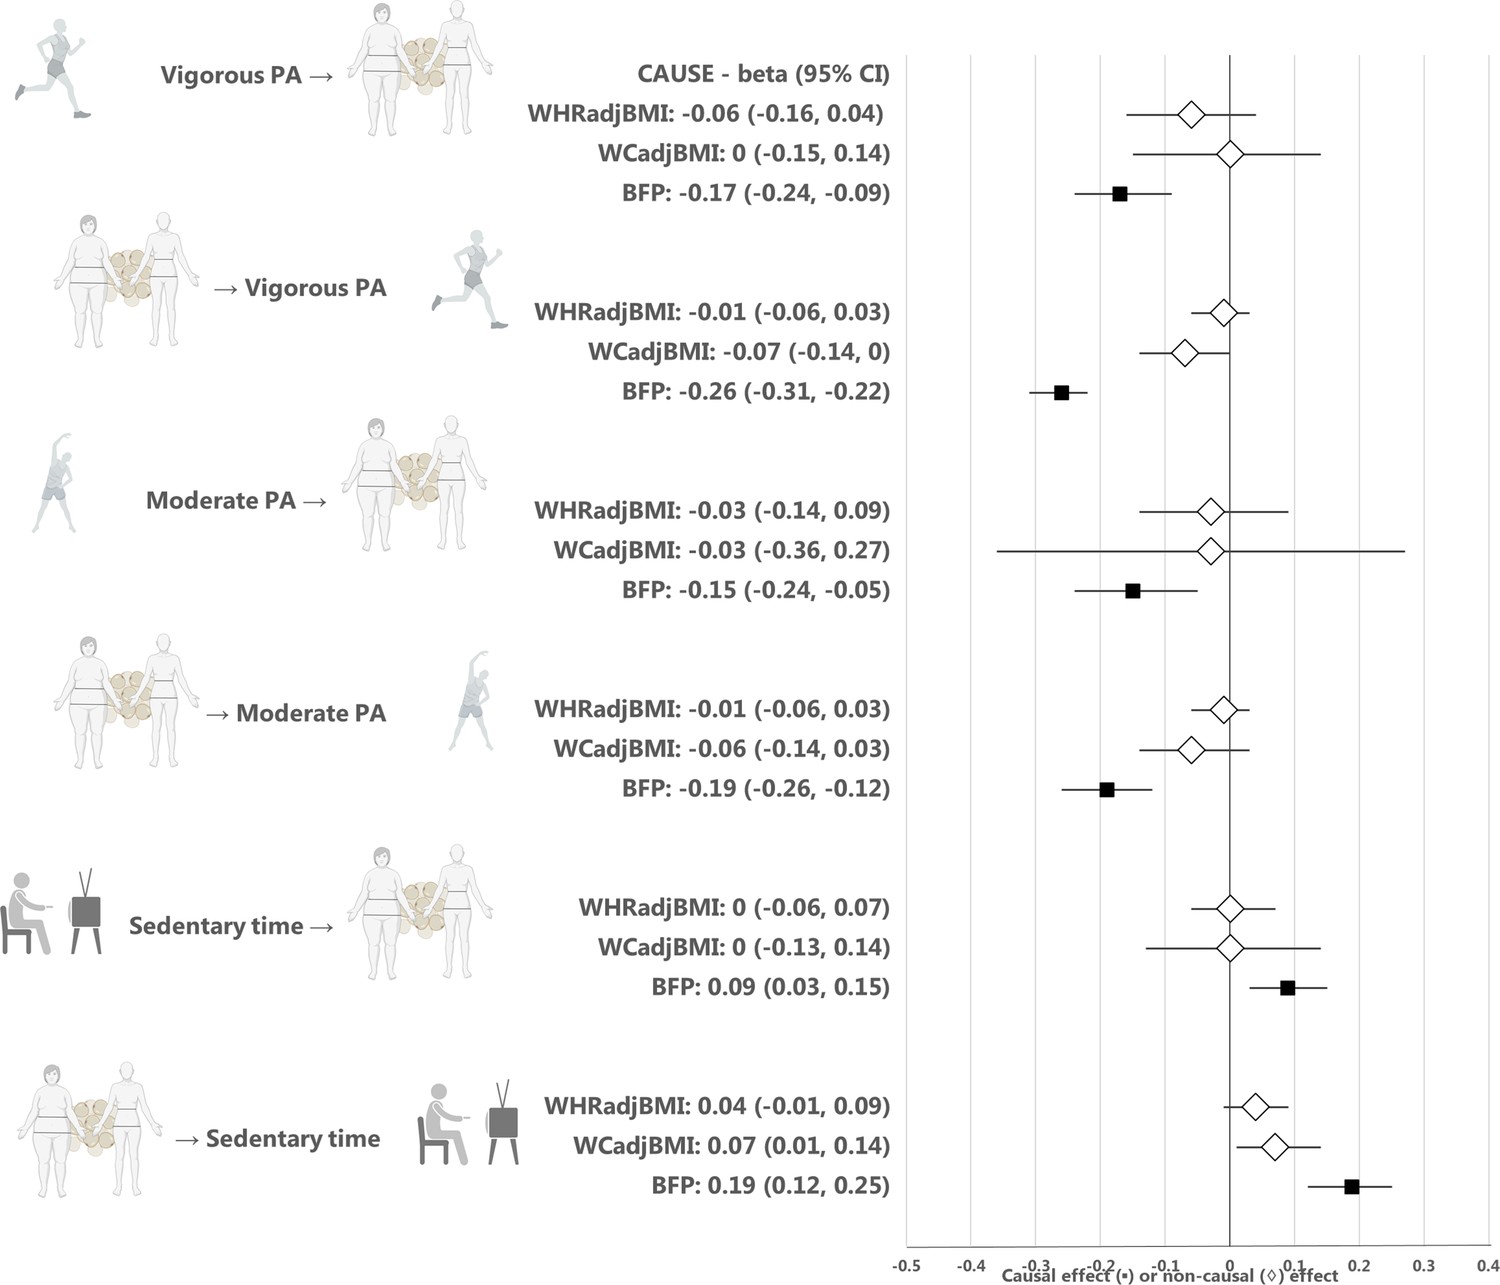
Estimates from the CAUSE method for the causal relationship between physical activity or sedentary time and waist-hip ratio, waist circumference, or body fat percentage.
Median causal estimates for Mendelian randomization analyses using the CAUSE method. A diamond (♢) in the estimate for CAUSE indicates that the sharing model fit the data better than the causal model, that is that the association between the traits was more likely to be explained by horizontal correlated pleiotropy than causality. PA, physical activity; WHRadjBMI, waist-to-hip ratio adjusted for body mass index; WCadjBMI, waist circumference adjusted for body mass index; BFP, body fat percentage. Figure icons were created with BioRender.com.
Appendix 1—figure 3
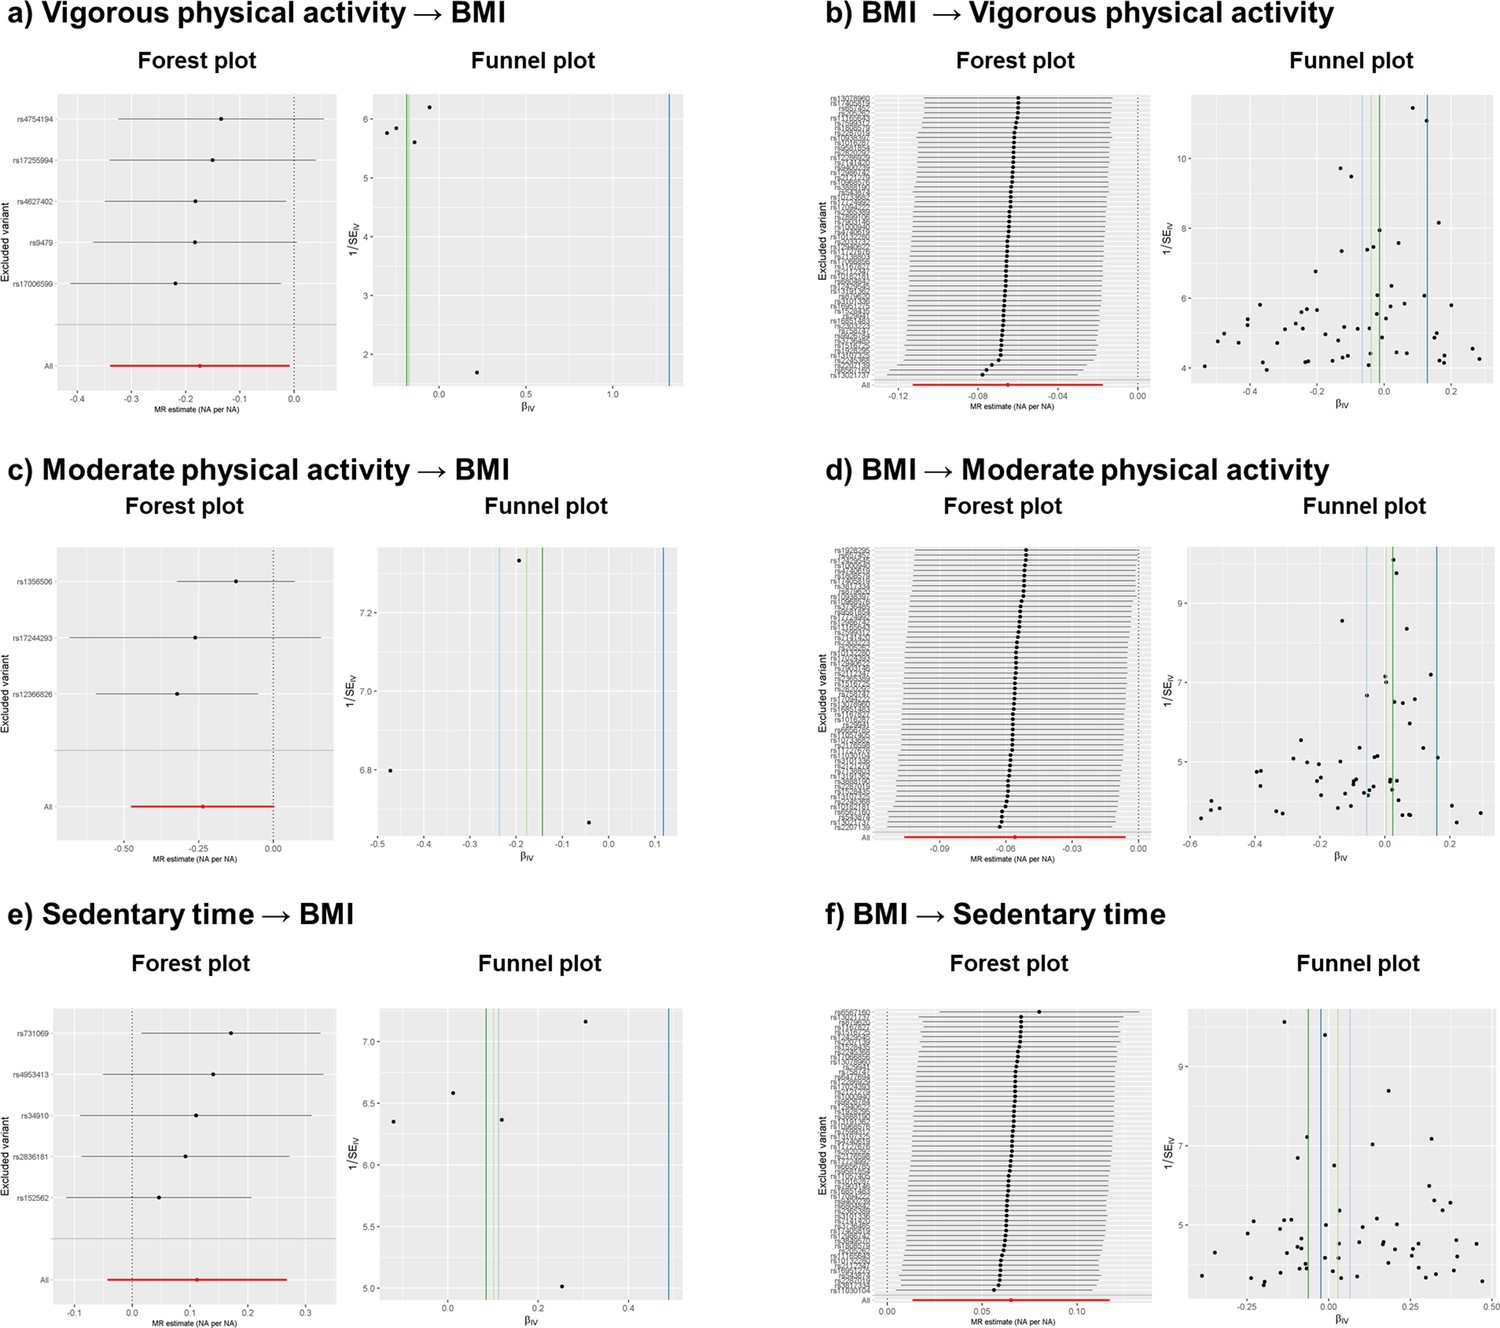
Leave-one-out forest and funnel sensitivity plots after outlier extraction.
Tables
Table 1
Results for Mendelian randomization analyses using the CAUSE method.
| Causal model better fit for the data | |||
|---|---|---|---|
| Direction | Median causal effect (95% CI) | Median q (CI) | P causal vs sharing |
| Vigorous PA→ BMI | –0.16 (-0.24,–0.08) | 0.19 (0, 0.86) | 3.8 × 10–04 |
| Moderate PA→ BMI | –0.18 (-0.3,–0.05) | 0.20 (0.01, 0.86) | 0.006 |
| Sedentary time → BMI | 0.11 (0.02, 0.20) | 0.19 (0, 0.86) | 0.02 |
| BMI → Sedentary time | 0.13 (0.08, 0.17) | 0.18 (0, 0.85) | 6.3 × 10⁻⁴ |
| Sharing model better fit for the data | |||
| Direction | Median shared effect (CI) | Median q (CI) | P causal vs sharing |
| BMI → Vigorous PA | –0.16 (-0.19,–0.14) | 0.90 (0.77, 0.98) | 0.35 |
| BMI → Moderate PA | –0.14 (-0.19,–0.11) | 0.77 (0.55, 0.95) | 0.31 |
-
BMI, Body mass index (BMI); SE, standard error; N SNPs, number of single-nucleotide polymorphism; P, P-value; PA, physical activity; IVW, inverse variance weighted; CI, 95% confidence interval.
-
The results display the data according to the goodness-of-fit for the causal or the sharing model. The median q value indicates the proportion of variants with correlated pleiotropy.
Table 2
Mendelian randomization results for inverse variance weighted, weighted median, weighted mode, and MR-Egger methods.
| Direction | Vigorous physical activity → BMI | Moderate physical activity → BMI | Sedentary time → BMI | |||||||||
|---|---|---|---|---|---|---|---|---|---|---|---|---|
| MR method | beta | SE | p-value | N SNPs | beta | SE | p-value | N SNPs | beta | SE | p-value | N SNPs |
| IVW | –0.17 | 0.08 | 0.04 | 5 | –0.24 | 0.12 | 0.05 | 3 | 0.11 | 0.08 | 0.16 | 5 |
| Weighted median | –0.18 | 0.10 | 0.08 | 5 | –0.18 | 0.12 | 0.13 | 3 | 0.10 | 0.10 | 0.29 | 5 |
| Weighted mode | –0.19 | 0.12 | 0.19 | 5 | –0.14 | 0.15 | 0.43 | 3 | 0.08 | 0.14 | 0.59 | 5 |
| MR-Egger | 1.33 | 2.21 | 0.59 | 5 | 0.12 | 0.45 | 0.84 | 3 | 0.49 | 0.36 | 0.26 | 5 |
| Direction | BMI → Vigorous physical activity | BMI → Moderate physical activity | BMI → Sedentary time | |||||||||
| IVW | –0.07 | 0.02 | 0.01 | 57 | –0.06 | 0.03 | 0.03 | 55 | 0.07 | 0.03 | 0.01 | 57 |
| Weighted mode | –0.01 | 0.06 | 0.83 | 57 | 0.02 | 0.06 | 0.68 | 55 | –0.06 | 0.08 | 0.46 | 57 |
| Weighted median | –0.04 | 0.03 | 0.27 | 57 | 0.003 | 0.04 | 0.93 | 55 | 0.03 | 0.04 | 0.48 | 57 |
| MR-Egger | 0.13 | 0.07 | 0.06 | 57 | 0.16 | 0.07 | 0.04 | 55 | –0.02 | 0.08 | 0.76 | 57 |
| BMI, Body mass index (BMI); SE, standard error; N SNPs, number of single nucleotide polymorphism; IVW, inverse variance weighted; CI, 95% confidence interval. | ||||||||||||
-
The results display the data according to the goodness-of-fit for the causal or the sharing model. The median q value indicates the proportion of variants with correlated pleiotropy. CI, confidence interval; PA, physical activity; BMI, body mass index; P, P-value.
Appendix 1—table 1
CAUSE expected log pointwise posterior density (ELPD) results for each combination of traits.
| Vigorous physical activity → BMI | BMI → vigorous physical activity | ||||||
|---|---|---|---|---|---|---|---|
| Model 1 | Model 2 | Delta_ELPD | SE_delta_ELPD | z | Delta_ELPD | SE_delta_ELPD | Z |
| Null | Sharing | –17.47 | 4.24 | –4.12 | –251.88 | 21.54 | –11.69 |
| Null | Causal | –18.98 | 4.68 | –4.05 | –252.22 | 21.65 | –11.65 |
| Sharing | Causal | –1.51 | 0.45 | –3.36 | –0.35 | 0.90 | –0.38 |
| Moderate physical activity → BMI | BMI → Moderate physical activity | ||||||
| Null | Sharing | –8.50 | 2.86 | –2.97 | –119.39 | 15.15 | –7.88 |
| Null | Causal | –9.83 | 3.39 | –2.90 | –119.77 | 15.34 | –7.81 |
| Sharing | Causal | –1.34 | 0.53 | –2.52 | –0.38 | 0.77 | –0.49 |
| Sedentary time → BMI | BMI → Sedentary time | ||||||
| Null | Sharing | –6.51 | 2.57 | –2.53 | –137.84 | 157.46 | –8.75 |
| Null | Causal | –7.67 | 3.14 | –2.44 | –138.89 | 15.88 | –8.75 |
| Sharing | Causal | –1.16 | 0.57 | –2.05 | –1.06 | 0.33 | –3.22 |
-
BMI, Body mass index; SE, standard error; NA, not applicable; CI, 95% confidence interval.
Appendix 1—table 2
CAUSE posterior probabilities and q values for the causal effect and the shared effect.
| Model | Causal effect (CI) | Shared effect (CI) | q (CI) | Sharing vs causal model p-value |
|---|---|---|---|---|
| Vigorous physical activity → BMI | ||||
| Sharing | NA | –0.18 (-0.25,–0.12) | 0.85 (0.57, 0.98) | 3.80E-04 |
| Causal | –0.16 (-0.24,–0.08) | 0 (-0.31, 0.31) | 0.19 (0.00, 0.86) | |
| Moderate physical activity → BMI | ||||
| Sharing | NA | –0.2 (-0.33,–0.11) | 0.75 (0.35, 0.96) | 5.80E-03 |
| Causal | –0.18 (-0.3,–0.05) | –0.01 (-0.44, 0.39) | 0.2 (0.01, 0.86) | |
| Sedentary time → BMI | ||||
| Sharing | NA | 0.13 (0.06, 0.23) | 0.69 (0.25, 0.95) | 2.00E-02 |
| Causal | 0.11 (0.02, 0.20) | 0 (-0.32, 0.32) | 0.19 (0, 0.86) | |
| BMI → Vigorous physical activity | ||||
| Sharing | NA | –0.16 (-0.19,–0.14) | 0.9 (0.77, 0.98) | 0.35 |
| Causal | –0.15 (-0.2,–0.08) | 0.01 (-0.18, 0.21) | 0.21 (0.01, 0.83) | |
| BMI → Moderate physical activity | ||||
| Sharing | NA | –0.14 (-0.19,–0.11) | 0.77 (0.55, 0.95) | 0.31 |
| Causal | –0.11 (-0.19,–0.03) | 0 (-0.28, 0.2) | 0.23 (0.01, 0.84) | |
| BMI → Sedentary time | ||||
| Sharing | NA | 0.14 (0.12, 0.17) | 0.9 (0.73, 0.98) | 6.30E-04 |
| Causal | 0.13 (0.08, 0.17) | 0 (-0.23, 0.26) | 0.18 (0.00, 0.85) | |
-
BMI, Body mass index; NA, not applicable; CI, 95% confidence interval.
Appendix 1—table 3
Approximation of the causal estimates in absolute units.
| Original causal estimates (weighted median) | Conversion of causal estimates | Converted causal estimates | ||||||
|---|---|---|---|---|---|---|---|---|
| Analysis | N SNPs | Beta | SE | p | Equation | SDexposure | SDoutcome | |
| Vigorous physical activity → BMI | 1,036 | –0·09 SD | 0·006 SD | 9.28E-57 | (Beta*SDoutcome)/ SDexposure / (0,01*24 hours) | NA | 4·807 kg/m2 | –0·48 kg/m2 per hour of moderate physical activity per day |
| Moderate physical activity → BMI | 914 | –0·05 SD | 0·005 SD | 1.21E-20 | (Beta*SDoutcome)/ SDexposure / (0,01*24 hours) | 3.76% | 4·807 kg/m2 | –0·27 kg/m2 per hour of moderate physical activity per day |
| Sedentary time → BMI | 1,036 | 0·06 SD | 0·005 SD | 6.33E-30 | (Beta*SDoutcome)/ SDexposure / (0,01*24 hours) | 7.38% | 4·807 kg/m2 | 0,14 kg/m2 per hour of sedentary time per day |
| BMI → Sedentary time | 11,849 | 0·16 SD | 0·009 SD | 2.87E-68 | (Beta*SDoutcome)/ SDexposure *(0·01*24 hours) | 4·807 kg/m2 | 7.38% | 3·54 min of sedentary time per kg/m2 per day |
| Original units of the traits:Moderate physical activity: Probability of moderate physical activity in a 30s-epoch frame (Doherty et al., 2018) Sedentary time: Probability of sedentary time in a 30s-epoch frame (Doherty et al., 2018) BMI: kg/m2 (Pulit et al., 2019) Note: For vigorous physical activity, SD exposure could not be found, thus we use the same as for moderate physical activity, i.e. 3·76% | ||||||||
-
SNP, single nucleotide polymorphism; BMI, SE, standard error; SD, standard deviation; Body mass index (BMI).
Appendix 1—table 4
Mendelian randomization results using the IVW, Egger, weighted median and weighted mode methods of for the causal effect of moderate or vigorous physical activity or sedentary time on BMI.
| Before outlier extraction | ||||||||||||
|---|---|---|---|---|---|---|---|---|---|---|---|---|
| Vigorous physical activity → BMI | Moderate physical activity → BMI | Sedentary time → BMI | ||||||||||
| MR method | SNP | beta | SE | p-value | SNP | beta | SE | p-value | SNP | beta | SE | p-value |
| Egger | 5 | 1.33 | 2.21 | 0.59 | 3 | 0.12 | 0.45 | 0.84 | 8 | 0.46 | 0.64 | 0.50 |
| Weighted median | 5 | –0.18 | 0.10 | 0.08 | 3 | –0.18 | 0.12 | 0.13 | 8 | 0.02 | 0.09 | 0.82 |
| IVW | 5 | –0.17 | 0.08 | 0.04 | 3 | –0.24 | 0.12 | 0.05 | 8 | 0.04 | 0.11 | 0.72 |
| Weighted mode | 5 | –0.19 | 0.12 | 0.19 | 3 | –0.14 | 0.15 | 0.43 | 8 | –0.05 | 0.18 | 0.78 |
| Sensitivity test | Estimate | p-value/CI | Estimate | p-value/CI | Estimate | p-value/CI | ||||||
| Q (p-value) | 1.65 | 0.8 | 3.6 | 0.17 | 23.08 | 1.70E-03 | ||||||
| I2 (CI) | 0.00% | (0,0%; 49,5%) | 44.30% | (0,0%; 83,4%) | 69.70% | (36,8%; 85,4%) | ||||||
| Q-Q' (p-value) | 0.46 | 0.5 | 1.75 | 0.19 | 1.96 | 0.16 | ||||||
| Egger intercept (p-value) | –0.04 | 0.29 | –0.01 | 0.19 | –0.01 | 0.75 | ||||||
| Rucker Test | IVW | IVW | IVW | |||||||||
| After outlier extraction | ||||||||||||
| Vigorous physical activity → BMI | Moderate physical activity → BMI | Sedentary time → BMI | ||||||||||
| MR method | SNP | beta | SE | p-value | SNP | beta | SE | p-value | SNP | beta | SE | p-value |
| Egger | NA | NA | NA | NA | NA | NA | NA | NA | 5 | 0.49 | 0.36 | 0.26 |
| Weighted median | NA | NA | NA | NA | NA | NA | NA | NA | 5 | 0.10 | 0.10 | 0.29 |
| IVW | NA | NA | NA | NA | NA | NA | NA | NA | 5 | 0.11 | 0.08 | 0.16 |
| Weighted mode | NA | NA | NA | NA | NA | NA | NA | NA | 5 | 0.08 | 0.14 | 0.59 |
| Sensitivity test | Estimate | p-value/CI | Estimate | p-value/CI | Estimate | p-value/CI | ||||||
| Q (p-value) | NA | NA | NA | NA | 4.7 | 0.32 | ||||||
| I2 (CI) | NA | NA | NA | NA | 15 | (0·0%; 82·3%) | ||||||
| Q-Q' (p-value) | NA | NA | NA | NA | 1.41 | 0.24 | ||||||
| Egger intercept (p-value) | NA | NA | NA | NA | –1.00E-02 | 0.24 | ||||||
| Rucker Test | NA | NA | IVW | |||||||||
-
BMI, Body mass index (BMI); MR, Mendelian randomization; SNP, single nucleotide polymorphism; SE, standard error; NA, not applicable; IVW, inverse variance weighted; CI, 95% confidence interval. NA: not applicable. Note: No outlier extraction was performed for moderate physical activity → BMI and vigorous physical activity → BMI directions, since Q test and I2 did not indicate heterogeneity.
Appendix 1—table 5
Mendelian randomization results using the IVW, Egger, weighted median and weighted mode methods of BMI on moderate PA, vigorous PA, or sedentary time.
| Before outlier extraction | ||||||||||||
|---|---|---|---|---|---|---|---|---|---|---|---|---|
| BMI → Vigorous physical activity | BMI → Moderate physical activity | BMI → Sedentary time | ||||||||||
| MR method | SNP | beta | SE | p-value | SNP | beta | SE | p-value | SNP | beta | SE | p-value |
| Egger | 64 | 0.09 | 0.08 | 0.22 | 65 | 0.17 | 0.08 | 0.04 | 65 | –0.10 | 0.09 | 0.28 |
| Weighted median | 64 | –0.04 | 0.03 | 0.21 | 65 | 0.004 | 0.04 | 0.92 | 65 | 0.03 | 0.04 | 0.44 |
| IVW | 64 | –0.08 | 0.03 | 0.005 | 65 | –0.05 | 0.03 | 0.09 | 65 | 0.07 | 0.03 | 0.02 |
| Weighted mode | 64 | –0.01 | 0.07 | 0.86 | 65 | 0.02 | 0.05 | 0.72 | 65 | –0.05 | 0.10 | 0.59 |
| Sensitivity test | Estimate | p-value/CI | Estimate | p-value/CI | Estimate | p-value/CI | ||||||
| Q (p-value) | 92.4 | 9.30E-03 | 83.73 | 0.05 | 97.5 | 4.40E-03 | ||||||
| I2 (CI) | 31.80% | 6·9%; 50·00% | 23.60% | (0·00%; 44·20%) | 34.40% | 10·80%; 51·70% | ||||||
| Q-Q' (p-value) | 8.36 | 3.80E-03 | 10.86 | 9.81E-04 | 6.59 | 1.00E-02 | ||||||
| Egger intercept (p-value) | –4.99E-03 | 9.90E-01 | –6.40E-03 | 9.81E-04 | 4.96E-03 | 2.00E-02 | ||||||
| Rucker test | Egger | Egger | Egger | |||||||||
| After outlier extraction | ||||||||||||
| BMI → Vigorous physical activity | BMI → Moderate physical activity | BMI → Sedentary time | ||||||||||
| MR method | SNP | beta | SE | p-value | SNP | beta | SE | p-value | SNP | beta | SE | p-value |
| Egger | 57 | 0.13 | 0.07 | 0.06 | 55 | 0.16 | 0.07 | 0.04 | 57 | –0.02 | 0.08 | 0.76 |
| Weighted median | 57 | –0.04 | 0.03 | 0.27 | 55 | 2.95E-03 | 0.04 | 0.93 | 57 | 0.03 | 0.04 | 0.48 |
| IVW | 57 | –0.07 | 0.02 | 0.01 | 55 | –0.06 | 0.03 | 0.03 | 57 | 0.07 | 0.03 | 0.01 |
| Weighted mode | 57 | –0.01 | 0.06 | 0.83 | 55 | 0.02 | 0.06 | 0.68 | 57 | –0.06 | 0.08 | 0.46 |
| Sensitivity test | Estimate | p-value/CI | Estimate | p-value/CI | Estimate | p-value/CI | ||||||
| Q (p-value) | 61.88 | 0.27 | 40.51 | 0.91 | 56.29 | 0.46 | ||||||
| I2 (CI) | 9.50% | 0·00%–35·10% | 0.00% | (0·0%; 8·9%) | 0.50% | 0·0%; 31·50% | ||||||
| Q-Q' (p-value) | 9.79 | 1.75E-03 | 9.6 | 1.94E-03 | 1.62 | 2.00E-01 | ||||||
| Egger intercept | –5.70E-03 | 1.75E-03 | –6.44E-03 | 9.15E-05 | 2.60E-03 | 2.00E-01 | ||||||
| Rucker test | IVW | IVW | IVW | |||||||||
-
BMI, Body mass index; MR, Mendelian randomization; SNP, single nucleotide polymorphism; SE, standard error; NA, not applicable; IVW, inverse variance weighted; CI, 95% confidence interval.
Appendix 1—table 6
CAUSE expected log pointwise posterior density (ELPD) results for central adiposity and fat percentage.
| Vigorous physical activity → BFP | BFP → vigorous physical activity | ||||||
|---|---|---|---|---|---|---|---|
| Model 1 | Model 2 | Delta_ELPD | SE_delta_ELPD | z | Delta_ELPD | SE_delta_ELPD | z |
| Null | Sharing | –23.55 | 4.67 | –5.04 | –360.48 | 24.46 | –14.74 |
| Null | Causal | –25.11 | 5.00 | –5.02 | –361.77 | 24.49 | –14.77 |
| Sharing | Causal | –1.56 | 0.33 | –4.68 | –1.30 | 0.17 | –7.77 |
| Moderate physical activity → BFP | BFP → Moderate physical activity | ||||||
| Null | Sharing | –8.71 | 2.60 | –3.34 | –170.46 | 17.46 | –9.76 |
| Null | Causal | –10.11 | 3.13 | –3.23 | –171.50 | 17.63 | –9.73 |
| Sharing | Causal | –1.40 | 0.53 | –2.65 | –1.03 | 0.54 | –1.90 |
| Sedentary time → BFP | BFP → Sedentary time | ||||||
| Null | Sharing | –9.74 | 3.30 | –2.95 | –143.04 | 15.86 | –9.02 |
| Null | Causal | –11.01 | 3.83 | –2.87 | –144.25 | 16.13 | –8.94 |
| Sharing | Causal | –1.27 | 0.54 | –2.38 | –1.21 | 0.36 | –3.41 |
| Vigorous physical activity → WCadjBMI | WCadjBMI → Vigorous physical activity | ||||||
| Delta_ELPD | SE_delta_ELPD | z | Delta_ELPD | SE_delta_ELPD | z | ||
| Null | Sharing | 0.57 | 0.07 | 7.71 | –6.37 | 3.13 | –2.03 |
| Null | Causal | 1.36 | 0.15 | 9.28 | –7.16 | 3.65 | –1.96 |
| Sharing | Causal | 0.79 | 0.07 | 10.60 | –0.79 | 0.54 | –1.46 |
| Moderate physical activity → WCadjBMI | WCadjBMI → Moderate physical activity | ||||||
| Null | Sharing | 0.50 | 0.56 | 0.89 | –4.83 | 2.96 | –1.63 |
| Null | Causal | 1.01 | 0.87 | 1.16 | –5.40 | 3.58 | –1.51 |
| Sharing | Causal | 0.51 | 0.36 | 1.44 | –0.56 | 0.65 | –0.87 |
| Sedentary time → WCadjBMI | WCadjBMI → Sedentary time | ||||||
| Null | Sharing | 0.55 | 0.07 | 7.56 | –7.59 | 3.34 | –2.27 |
| Null | Causal | 1.39 | 0.16 | 8.55 | –8.61 | 3.97 | –2.17 |
| Sharing | Causal | 0.83 | 0.09 | 9.21 | –1.02 | 0.65 | –1.56 |
| Vigorous physical activity → WHRadjBMI | WHRadjBMI → Vigorous physical activity | ||||||
| Delta_ELPD | SE_delta_ELPD | z | Delta_ELPD | SE_delta_ELPD | z | ||
| Null | Sharing | –0.91 | 1.19 | –0.77 | 0.06 | 0.84 | 0.07 |
| Null | Causal | –1.68 | 2.10 | –0.80 | 0.31 | 1.52 | 0.21 |
| Sharing | Causal | –0.77 | 0.91 | –0.85 | 0.26 | 0.68 | 0.37 |
| Moderate physical activity → WHRadjBMI | WHRadjBMI → Moderate physical activity | ||||||
| Null | Sharing | 0.48 | 0.16 | 3.00 | 0.22 | 0.77 | 0.28 |
| Null | Causal | 0.92 | 0.56 | 1.63 | 0.44 | 1.44 | 0.30 |
| Sharing | Causal | 0.44 | 0.41 | 1.09 | 0.22 | 0.67 | 0.32 |
| Sedentary time → WHRadjBMI | WHRadjBMI → Sedentary time | ||||||
| Null | Sharing | 0.57 | 0.11 | 5.29 | –6.72 | 3.44 | –1.95 |
| Null | Causal | 1.37 | 0.28 | 4.83 | –7.31 | 4.03 | –1.81 |
| Sharing | Causal | 0.80 | 0.18 | 4.48 | –0.59 | 0.61 | –0.97 |
-
BFP, body fat percentage; WCadjBMI, waist cirumference adjusted for body mass index; WHRadjBMI, waist-to-hip ratio adjusted for body mass index, SE, standard error; NA, not applicable; CI, 95% confidence interval.
Appendix 1—table 7
CAUSE posterior probabilities and q values for the causal and sharing models for central adiposity and body fat percentage.
| Model | Causal Effect (CI) | Shared effect (CI) | Q (CI) | Sharing vs causal model p-value |
|---|---|---|---|---|
| Vigorous physical activity → BFP | ||||
| Sharing | NA | –0.18 (-0.23,–0.13) | 0.89 (0.67, 0.98) | 1.4e-06 |
| Causal | –0.17 (-0.24,–0.09) | 0 (-0.28, 0.26) | 0.19 (0, 0.86) | |
| Moderate physical activity → BFP | ||||
| Sharing | NA | –0.17 (-0.26,–0.09) | 0.78 (0.39, 0.97) | 0.0041 |
| Causal | –0.15 (-0.24,–0.05) | 0 (-0.32, 0.31) | 0.2 (0, 0.86) | |
| Sedentary time → BFP | ||||
| Sharing | NA | 0.11 (0.06, 0.17) | 0.75 (0.37, 0.96) | 0.0088 |
| Causal | 0.09 (0.03, 0.15) | 0 (-0.26, 0.27) | 0.19 (0, 0.86) | |
| BFP → Vigorous physical activity | ||||
| Sharing | NA | –0.27 (-0.29,–0.25) | 0.97 (0.92, 1) | 3.9e-15 |
| Causal | –0.26 (-0.31,–0.22) | 0 (-0.26, 0.22) | 0.18 (0, 0.85) | |
| BFP → Moderate physical activity | ||||
| Sharing | NA | –0.21 (-0.25,–0.18) | 0.91 (0.77, 0.99) | 0.029 |
| Causal | –0.19 (-0.26,–0.12) | 0 (-0.3, 0.31) | 0.19 (0, 0.86) | |
| BFP → Sedentary time | ||||
| Sharing | NA | 0.2 (0.17, 0.24) | 0.91 (0.76, 0.99) | 0.00032 |
| Causal | 0.19 (0.12, 0.25) | 0 (-0.33, 0.31) | 0.18 (0, 0.86) | |
| Vigorous physical activity → WCadjBMI | ||||
| Sharing | NA | –0.01 (-0.62, 0.59) | 0.12 (0, 0.72) | 1 |
| Causal | 0 (-0.15, 0.14) | 0 (-0.55, 0.52) | 0.2 (0.01, 0.86) | |
| Moderate physical activity → WCadjBMI | ||||
| Sharing | NA | –0.14 (-0.98, 0.6) | 0.13 (0.01, 0.69) | 9.20E-01 |
| Causal | –0.03 (-0.36, 0.27) | –0.03 (-0.83, 0.7) | 0.26 (0.01, 0.84) | |
| Sedentary time → WCadjBMI | ||||
| Sharing | NA | 0.01 (-0.44, 0.57) | 0.12 (0, 0.71) | 1 |
| Causal | 0 (-0.13, 0.14) | 0.01 (-0.41, 0.52) | 0.21 (0.01, 0.85) | |
| WCadjBMI → Vigorous physical activity | ||||
| Sharing | NA | –0.1 (-0.21,–0.05) | 0.59 (0.19, 0.92) | 0.072 |
| Causal | –0.07 (-0.14, 0) | 0 (-0.31, 0.36) | 0.19 (0, 0.86) | |
| WCadjBMI → Moderate physical activity | ||||
| Sharing | NA | –0.11 (-0.27,–0.04) | 0.47 (0.11, 0.88) | 0.19 |
| Causal | –0.06 (-0.14, 0.03) | 0 (-0.34, 0.36) | 0.19 (0, 0.86) | |
| WCadjBMI → Sedentary time | ||||
| Sharing | NA | 0.1 (0.05, 0.2) | 0.63 (0.23, 0.93) | 0.059 |
| Causal | 0.07 (0.01, 0.14) | 0.01 (-0.3, 0.48) | 0.17 (0, 0.85) | |
| Vigorous physical activity → WHRadjBMI | ||||
| Sharing | NA | –0.1 (-0.39, 0.07) | 0.36 (0.01, 0.86) | 0.2 |
| Causal | –0.06 (-0.16, 0.04) | 0 (-0.37, 0.44) | 0.19 (0, 0.86) | |
| Moderate physical activity → WHRadjBMI | ||||
| Sharing | NA | –0.04 (-0.48, 0.39) | 0.15 (0, 0.76) | 8.60E-01 |
| Causal | –0.03 (-0.14, 0.09) | 0 (-0.41, 0.4) | 0.2 (0, 0.86) | |
| Sedentary time → WHRadjBMI | ||||
| Sharing | NA | 0.01 (-0.26, 0.34) | 0.12 (0, 0.72) | 1 |
| Causal | 0 (-0.06, 0.07) | 0 (-0.22, 0.28) | 0.2 (0, 0.86) | |
| WHRadjBMI → Vigorous physical activity | ||||
| Sharing | NA | –0.04 (-0.3, 0.12) | 0.16 (0, 0.76) | 0.65 |
| Causal | –0.01 (-0.06, 0.03) | 0 (-0.25, 0.21) | 0.18 (0, 0.85) | |
| WHRadjBMI → Moderate physical activity | ||||
| Sharing | NA | –0.04 (-0.31, 0.14) | 0.16 (0, 0.75) | 6.30E-01 |
| Causal | –0.01 (-0.06, 0.03) | 0 (-0.25, 0.22) | 0.18 (0, 0.85) | |
| WHRadjBMI → Sedentary time | ||||
| Sharing | NA | 0.07 (0.03, 0.18) | 0.49 (0.13, 0.89) | 0.17 |
| Causal | 0.04 (-0.01, 0.09) | 0 (-0.29, 0.4) | 0.17 (0, 0.83) | |
-
BFP, Body Fat Percentage; WCadjBMI, waist circumference adjusted for BMI; WHRadjBMI,waist-to-hip ratio adjusted for BMI; NA, not applicable; CI, 95% confidence interval.
Additional files
Download links
A two-part list of links to download the article, or parts of the article, in various formats.
Downloads (link to download the article as PDF)
Open citations (links to open the citations from this article in various online reference manager services)
Cite this article (links to download the citations from this article in formats compatible with various reference manager tools)
Mendelian randomization suggests a bidirectional, causal relationship between physical inactivity and adiposity
eLife 11:e70386.
https://doi.org/10.7554/eLife.70386


