A distributed residue network permits conformational binding specificity in a conserved family of actin remodelers
- Department of Biology, Massachusetts Institute of Technology, United States
- Department of Cellular and Molecular Medicine, University of Arizona Cancer Center, University of Arizona, United States
- Department of Biological Engineering and Koch Institue for Integrative Cancer Research, Massachusetts Institute of Technology, United States
Figures
Figure 1
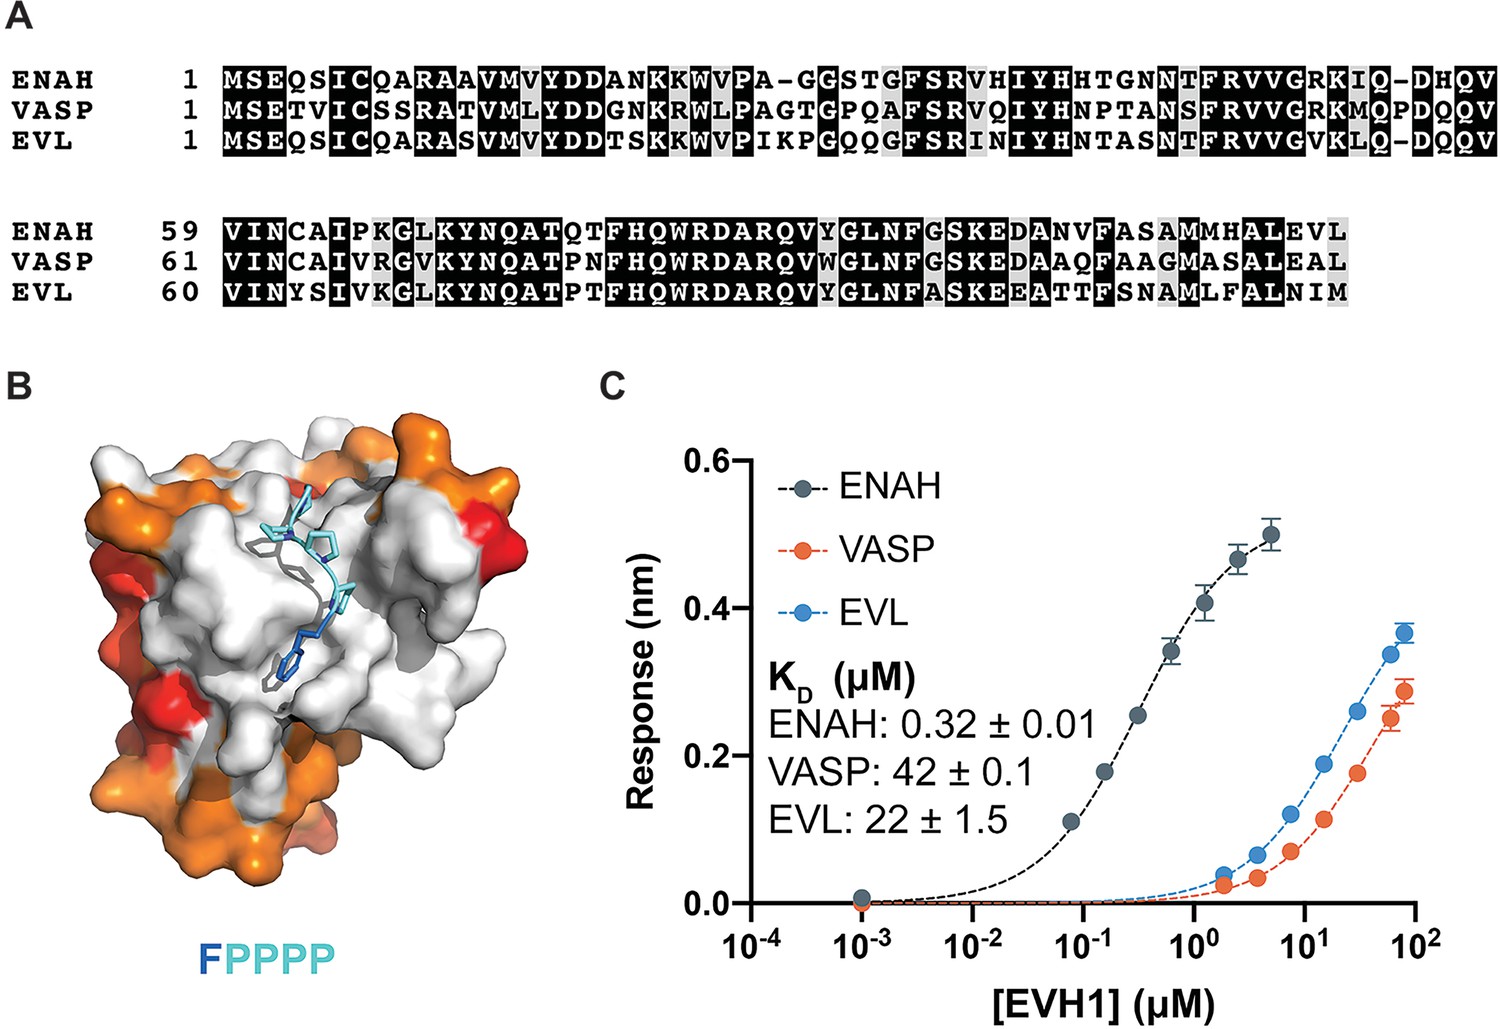
Ena/VASP family EVH1 domains are highly conserved but differ in their affinity for a peptide from photoreceptor cilium actin regulator (PCARE).
(A) Sequence alignment of the EVH1 domains of ENAH, VASP, and EVL. Black denotes residues that are 100 % conserved; residues in gray share similar physicochemical properties. (B) Surface representation of ENAH EVH1 bound to an FP4 peptide (PDB 1EVH) highlighting conservation among Ena/VASP paralogs. Residues shared between all three paralogs are white; residues shared by two paralogs are orange, residues that differ in each paralog are red. (C) Biolayer interferometry data and curves fit to determine the dissociation constants for peptide PCARE B binding to ENAH, EVL, or VASP EVH1 domains. Error reported as the standard deviation of two replicates.
-
Figure 1—source data 1
Raw data for Figure 1C.
- https://cdn.elifesciences.org/articles/70601/elife-70601-fig1-data1-v1.xlsx
Figure 2 with 2 supplements
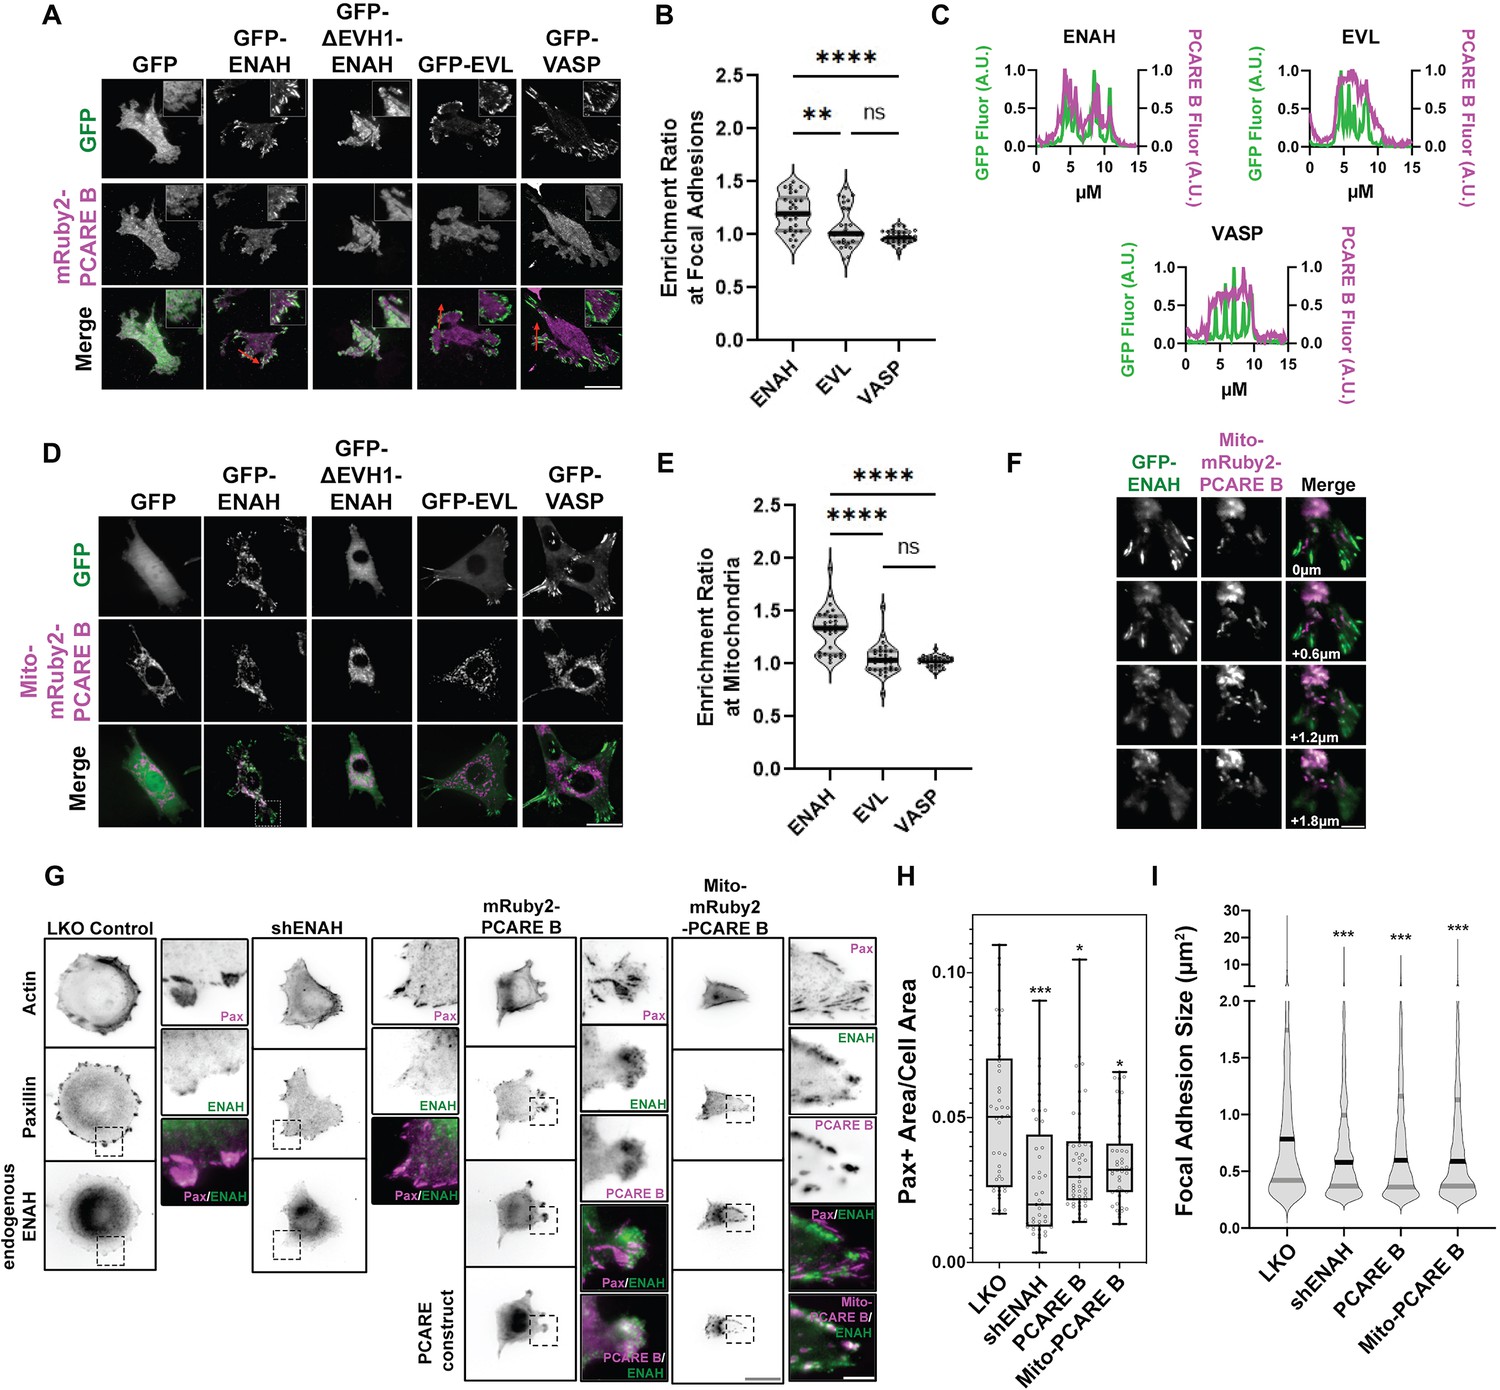
A photoreceptor cilium actin regulator (PCARE)-derived peptide selectively recruits ENAH in cells.
(A) Live MVD7shEVL cells expressing mRuby2-PCARE B with GFP, GFP-ENAH, GFP-dEVH1-ENAH, GFP-EVL, or GFP-VASP, imaged using total internal reflection fluorescence (TIRF) microscopy. Scale bar = 25 μm. (B) Enrichment ratio of mRuby2-PCARE B at GFP-positive focal adhesions over cytosolic signal under indicated overexpression conditions. n = 30 focal adhesions, N = 3 biological replicates. (C) Normalized fluorescence intensity of GFP signal (left axis) and mRuby2-PCARE B signal (right axis) along a line drawn through focal adhesions, indicated by the red arrow in (A). (D) Live MVD7shEVL cells expressing Mito-mRuby2-PCARE B with GFP, GFP-ENAH, GFP-dEVH1-ENAH, GFP-EVL, or GFP-VASP. Image is a maximum intensity projection of z-stack acquired using widefield fluorescence microscopy. Scale bar = 25 μm. (E) Enrichment ratio of GFP-tagged constructs to Mito-mRuby2-PCARE B-positive mitochondria over cytosolic signal under indicated overexpression conditions. n = 30 mitochondria, N = 3 biological replicates. (F) Magnified region of interest indicated by the box in (D), showing colocalization of Mito-mRuby2-PCARE B and GFP-ENAH at increasing depths in the cell. Scale bar = 5 μm. (G) Immunofluorescence labeling of MCF7 cells expressing nontargeting LKO control, ENAH-targeting shRNA, mRuby2-PCARE B, or Mito-mRuby2-PCARE B. Cells were fixed 8 hr after plating and immunolabeled for focal adhesion marker paxillin and endogenous ENAH, and additionally stained with phalloidin for F-actin. Box indicates positions of magnified regions of interest (ROI). Scale bar = 25 μm, magnified ROI scale bar = 5 μm. (H) Box-and-whisker plot of total paxillin-positive area per cell normalized to the total cell area, for indicated conditions. N = 3 biological replicates, n = 45–49 cells. (I) Violin plot of individual focal adhesion size (for adhesions greater than 0.25 μm2) for indicated conditions. The central black line indicates the median, peripheral gray lines indicate interquartile ranges. N = 3 biological replicates, n = 1452–2159 individual adhesions. In panels B, E, H, and I, * p ≤ 0.05, ** p ≤ 0.01, *** p ≤ 0.001, **** p ≤ 0.0001, Kruskal–Wallis test.
-
Figure 2—source data 1
Raw data for Figure 2B, C, E, H1.
- https://cdn.elifesciences.org/articles/70601/elife-70601-fig2-data1-v1.xlsx
Figure 2—figure supplement 1

Knockdown of EVL in MVD7 cells.
Relative expression of MVD7shEVL vs. MVD7ntEVL (nontargeting control) is 42.8 ± 1.8 % by quantitative PCR (qPCR), three biological replicates.
Figure 2—figure supplement 2
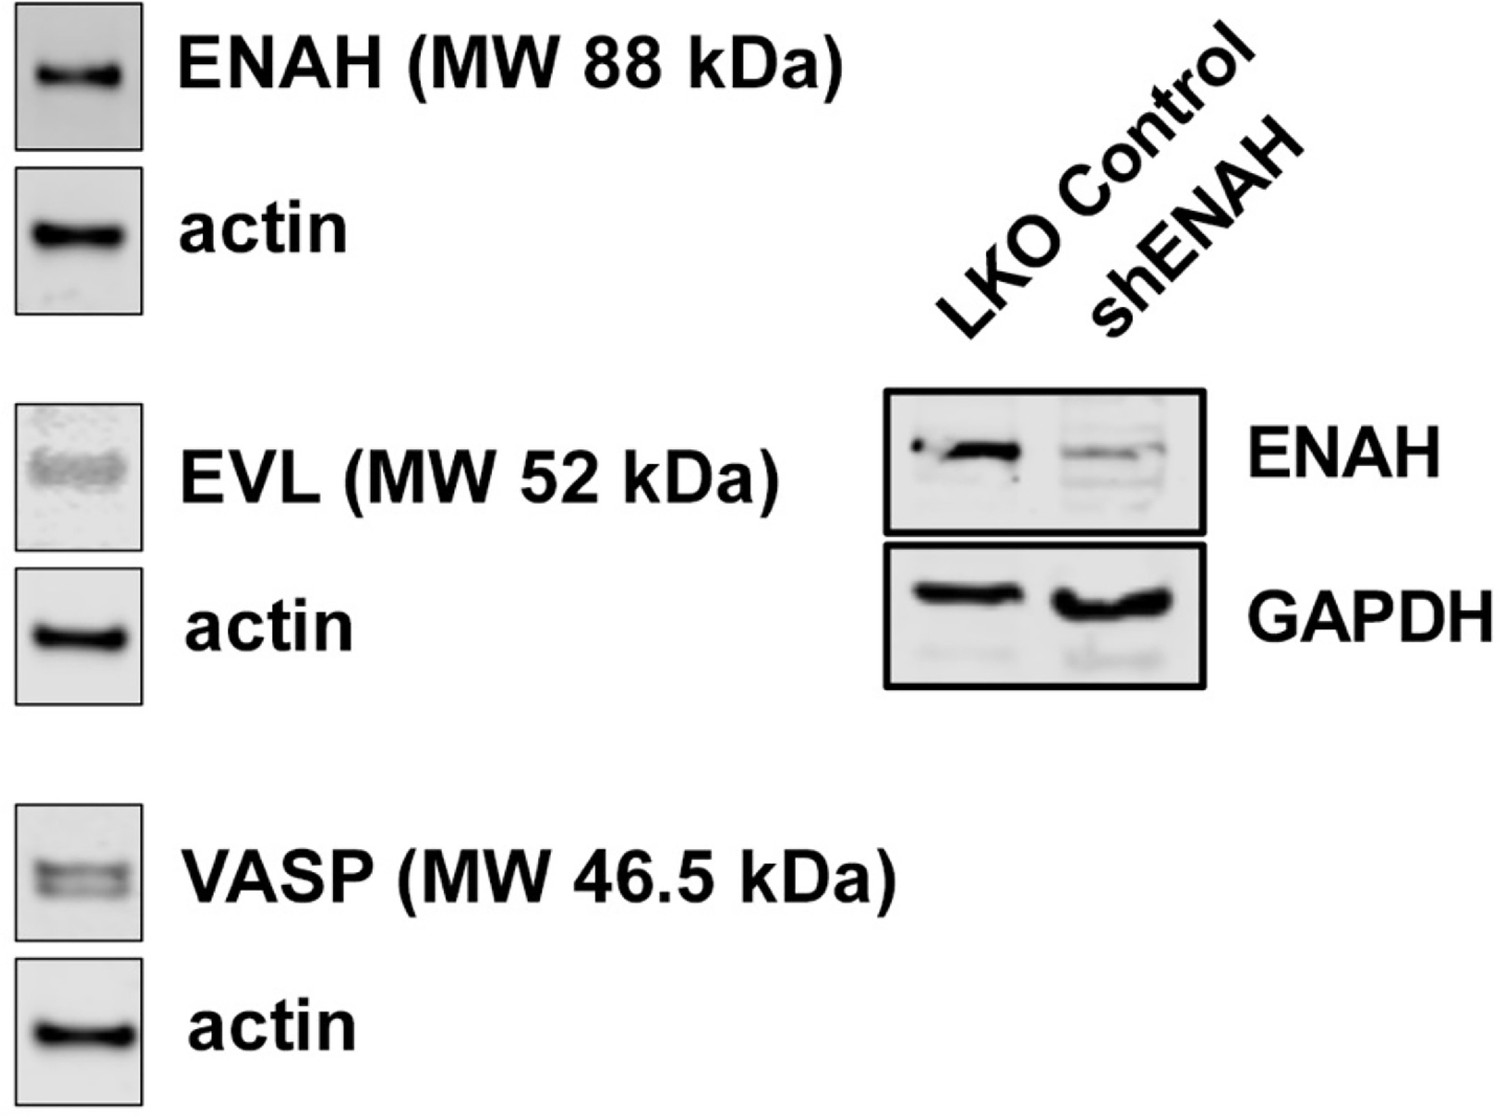
Expression of Ena/VASP proteins in MCF7 cells.
Representative western blot showing expression of ENAH, EVL, and VASP in MCF7 cells. At right, representative western blot showing the magnitude of knockdown using ENAH-targeted shRNA.
Figure 3
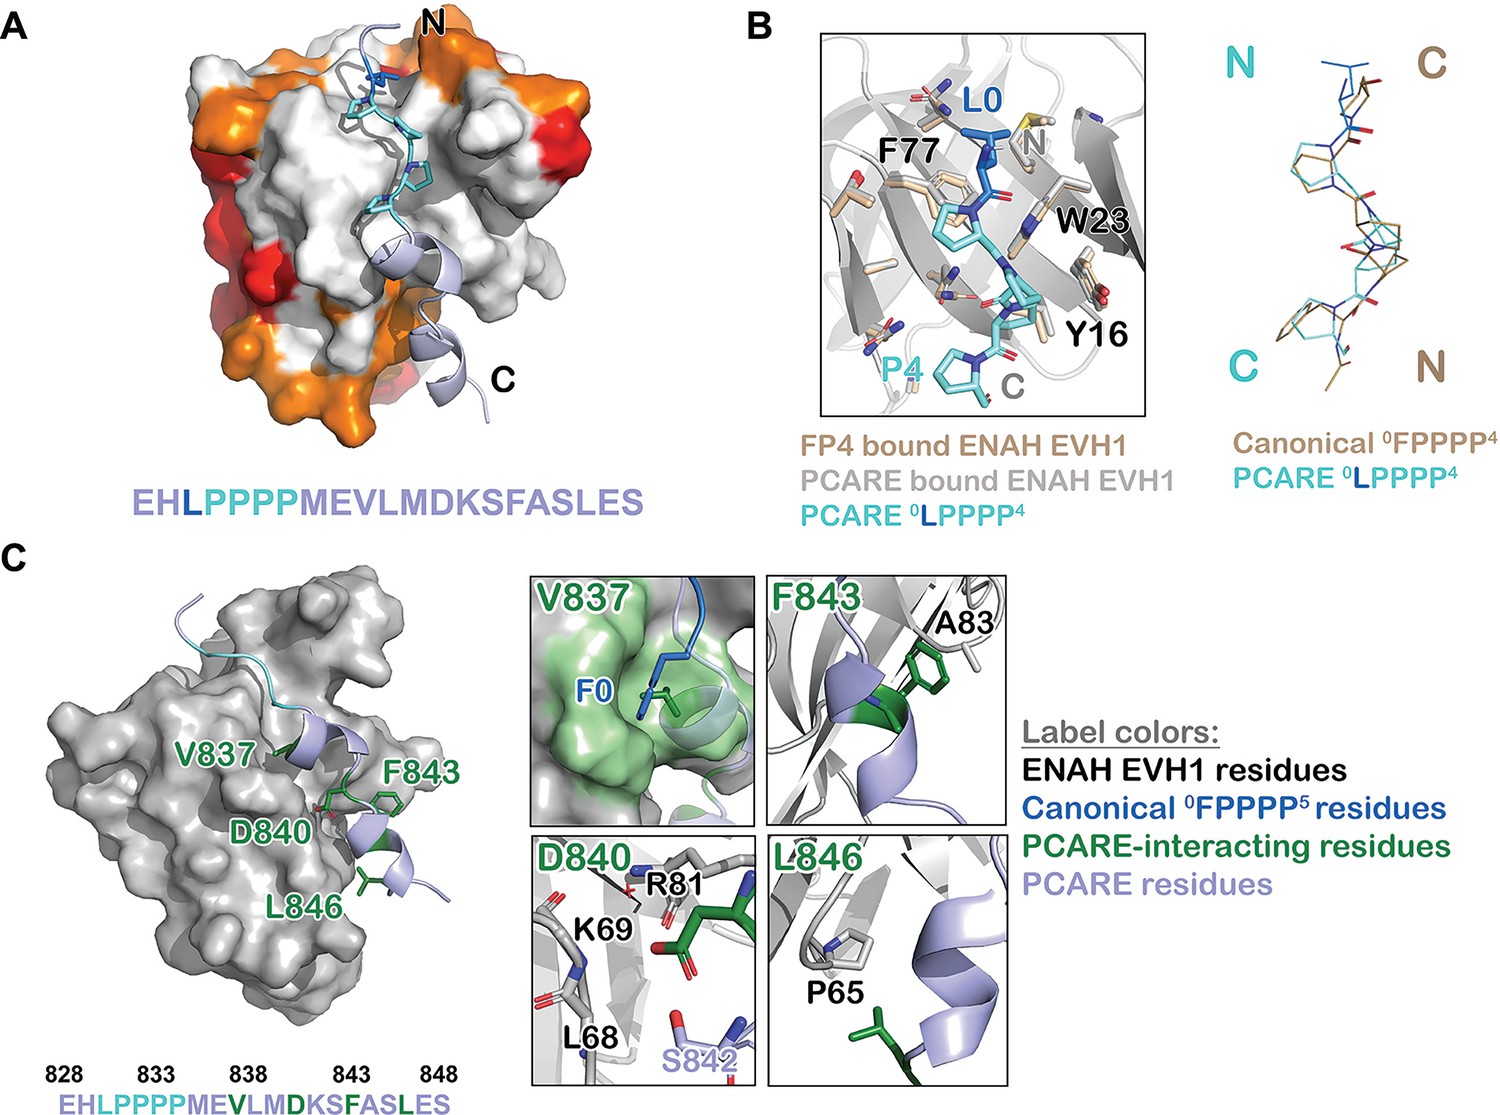
ENAH EVH1 binds to a peptide from photoreceptor cilium actin regulator (PCARE) differently than to the peptide FPPPP.
(A) Surface representation of ENAH EVH1 bound to a segment of PCARE, highlighting Ena/VASP EVH1 domain conservation using colors as in Figure 1. (B) View comparing the orientations of an FP4 peptide and the LP4 region of PCARE. Side chains of the ENAH EVH1 domain are shown as sticks using tan for the FP4 complex and gray for the PCARE complex. (C) Surface representation of ENAH EVH1 domain bound to the PCARE peptide. The LP4 residues are light blue and other EVH1-interacting residues are green; insets show details of the interactions. Note that the PCARE828–848 peptide is numbered as 133–153 in the PDB file.
Figure 4 with 1 supplement
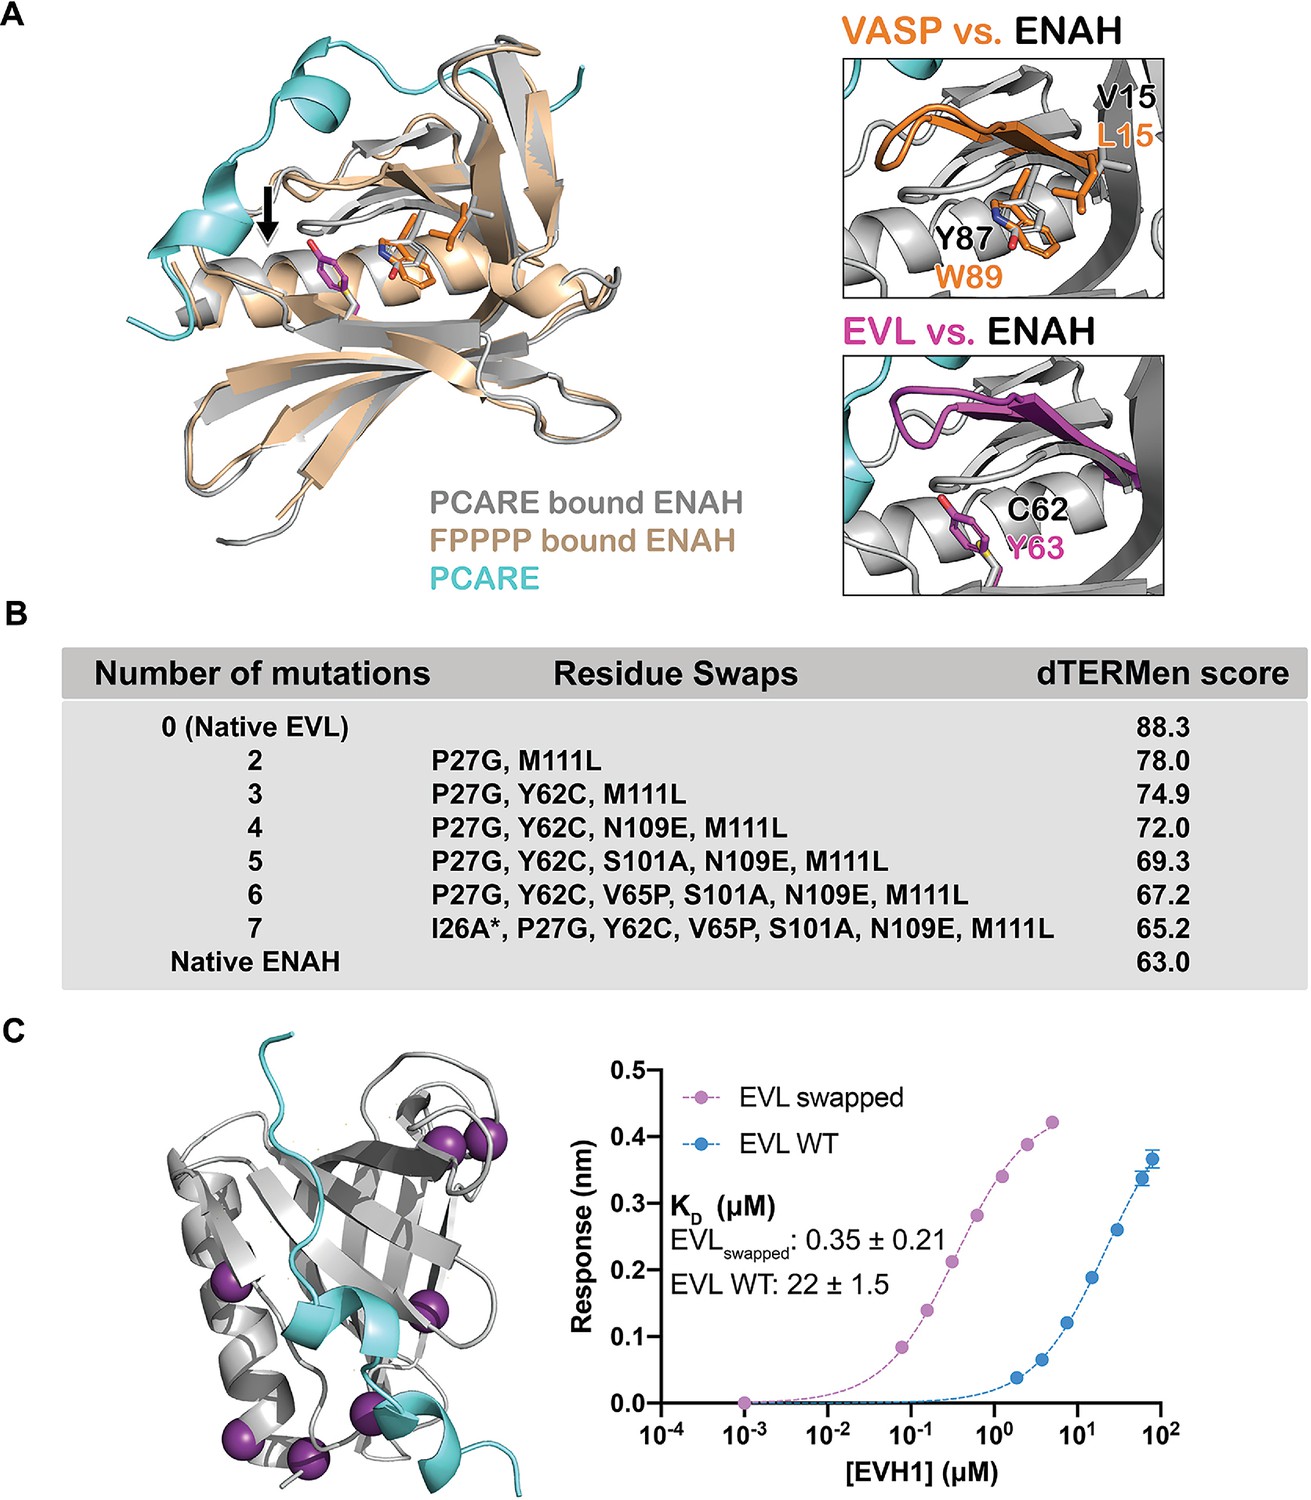
A peptide from photoreceptor cilium actin regulator (PCARE) achieves paralog selectivity by stabilizing an ENAH EVH1 domain-specific conformation.
(A) Superposition of ENAH EVH1 domains bound to PCARE or FP4 peptide (PDB 1EVH). The black arrow highlights a 3 Å shift in a loop that forms part of the binding pocket. Insets show residues that differ between ENAH and VASP or EVL near this loop. (B) Lowest dTERMen energy obtained when swapping 0–6 residues from ENAH into EVL, when modeled on the structure of ENAH EVH1 bound to PCARE. * indicates the mutation was added based on manual inspection. (C) ENAH EVH1 domain bound to a peptide from PCARE, with residues that were swapped into the EVL EVH1 domain to rescue affinity marked as purple spheres. On the right are binding curves for WT EVL EVH1 domain and EVLswapped EVH1 domain binding to PCARE B. Error reported as the standard deviation of two replicates.
-
Figure 4—source data 1
Raw data for Figure 4C.
- https://cdn.elifesciences.org/articles/70601/elife-70601-fig4-data1-v1.xlsx
Figure 4—figure supplement 1
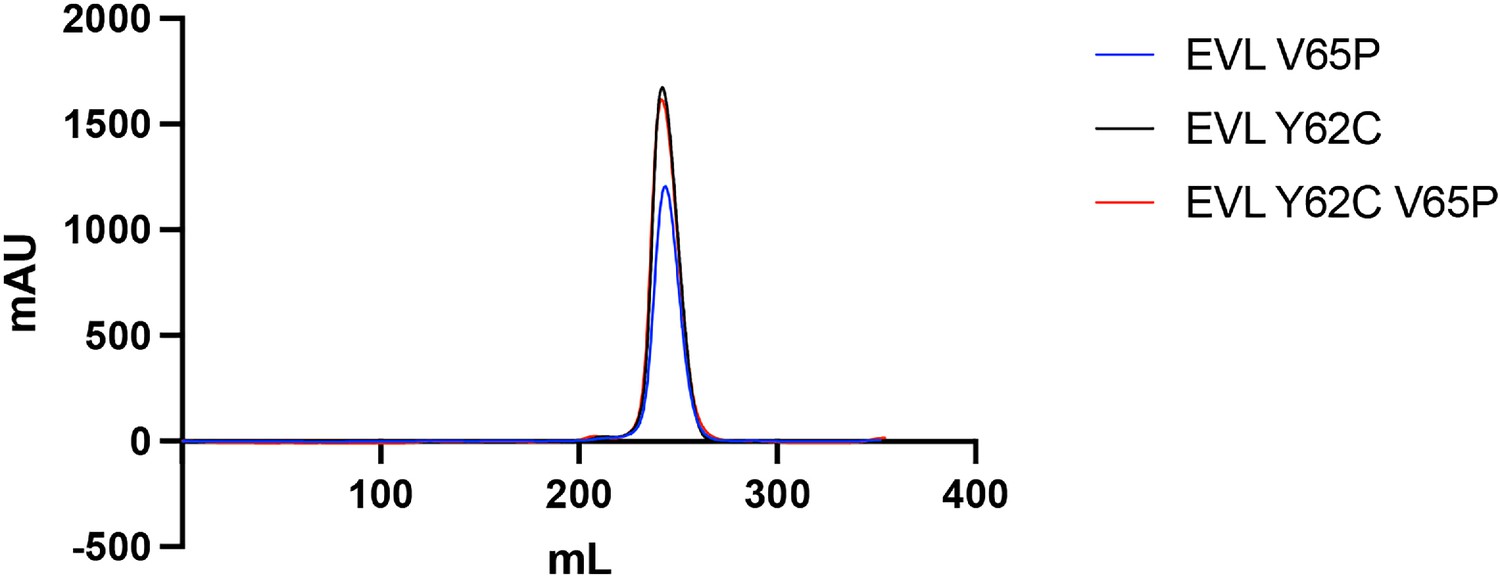
Fast protein liquid chromatography (FPLC) curves for EVL mutants.
EVL mutants run on a Superdex 75 column using fast protein liquid chromatography.
Figure 5 with 1 supplement
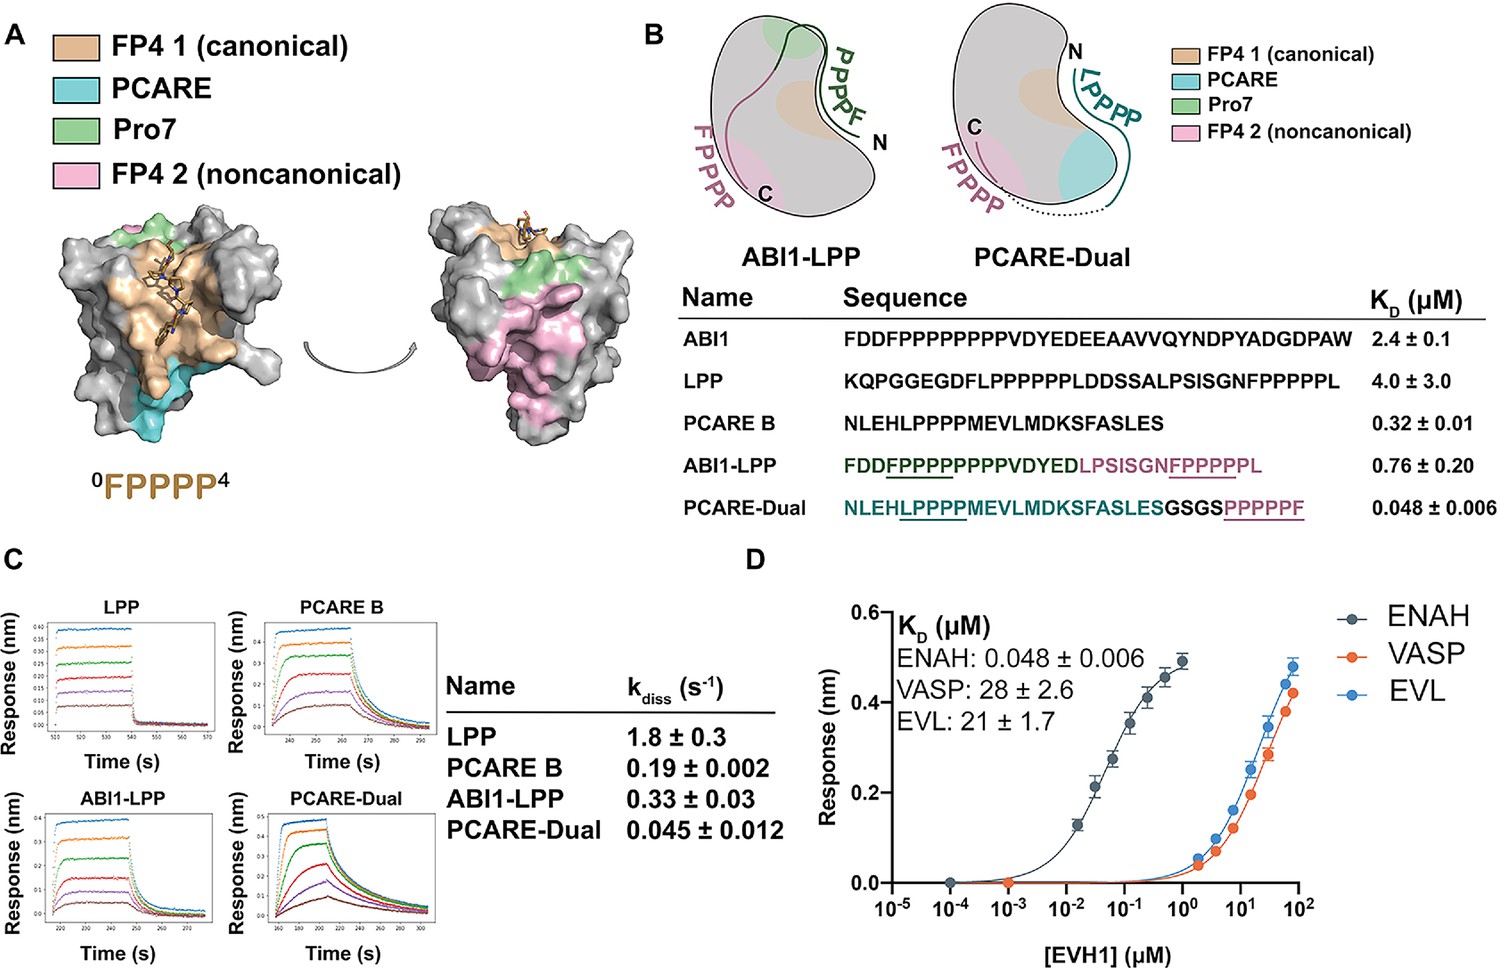
Engineered peptides bind to the ENAH EVH1 domain with high affinity and specificity.
(A) Surface representation of ENAH EVH1 with binding sites discussed in this study indicated. (B) Design scheme for high-affinity binders ABI1-LPP and PCARE-Dual. (C) Biolayer interferometry (BLI)-binding and dissociation curves. Blue, orange, green, red, purple, and brown curves denote EVH1 concentrations in descending order. LPP: 80, 36, 16, 7.0, 3.1, and 1.4 μM. PCARE B and ABI1-LPP: 2.5, 1.3, 0.63, 0.31, 0.16, and 0.078 μM. PCARE-Dual: 0.50, 0.25, 0.0625, 0.031, 0.016, and 0.0078 μM. Values reported as kdiss ± SD for two independent BLI replicates. (D) BLI-binding curves for PCARE-Dual binding to the EVH1 domains of ENAH, VASP, or EVL. Errors for (B) and (D) are reported as the standard deviation of two replicates.
-
Figure 5—source data 1
Raw data for Figure 5B, D, and Figure 1.
- https://cdn.elifesciences.org/articles/70601/elife-70601-fig5-data1-v1.xlsx
-
Figure 5—source data 2
Raw data for Figure 5C.
- https://cdn.elifesciences.org/articles/70601/elife-70601-fig5-data2-v1.xlsx
Figure 5—figure supplement 1
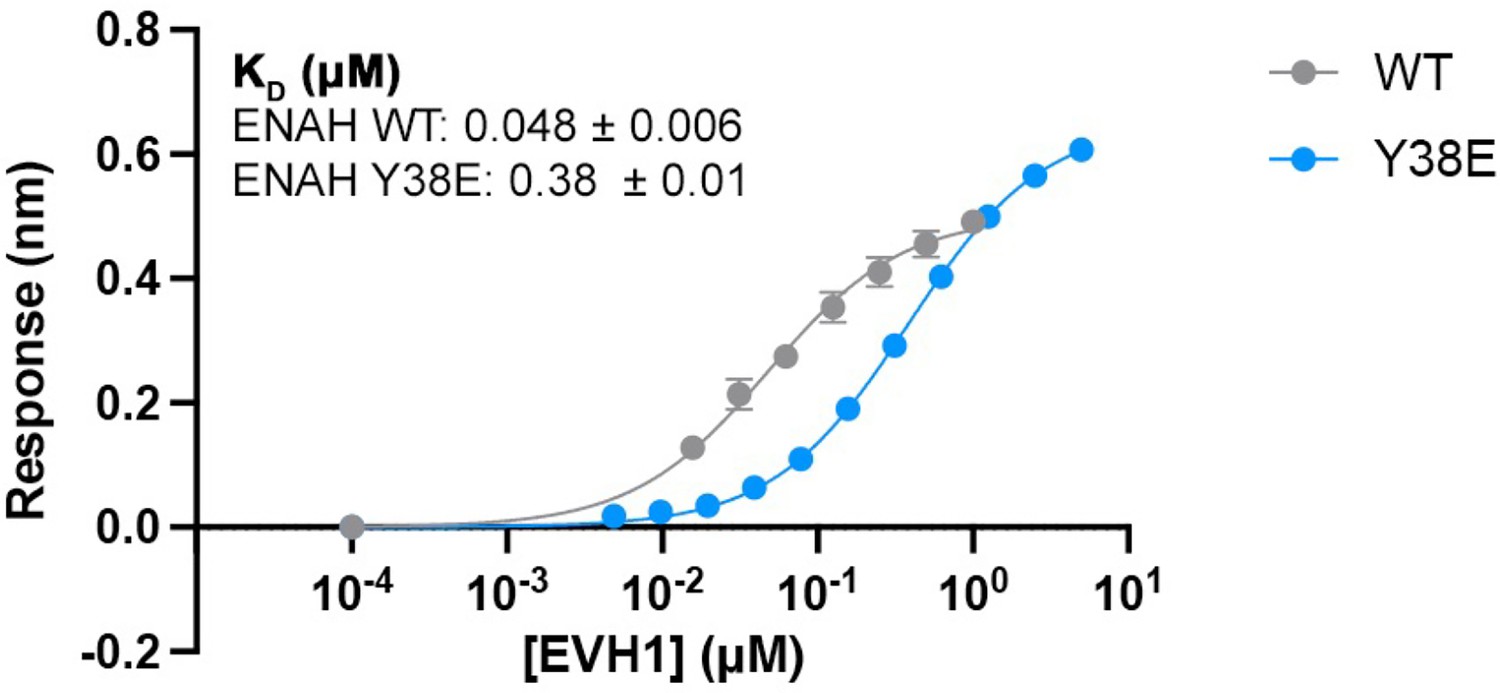
Affinity of PCARE-Dual for ENAH vs. ENAH Y38E.
Affinities determined by biolayer interferometry (BLI) as described in the methods and in Hwang et al., 2021. Errors reported are the standard deviation of two to three replicates.
Tables
Table 1
Affinity of EVL and ENAH EVH1 domain mutants for peptides ActA and PCARE B.
| ActA KD (μM)*, † | PCARE B KD (μM)* | |
|---|---|---|
| ENAH | 5.2 ± 0.2 | 0.32 ± 0.01 |
| EVL | 2.7 ± 0.3 | 22.3 ± 1.5 |
| EVL V65P | 2.4 ± 0.1 | 112.1 ± 9.6 |
| EVL Y62C | 7.1 ± 0.7 | 19.0 ± 2.8 |
| EVL Y62C V65P | 5.8 ± 1.0 | 2.2 ± 0.1 |
| ENAH P65D | 7.2 ± 0.5 | 32.0 ± 3.2 |
-
*
Affinities determined by biolayer interferometry (BLI) as described in the methods and in, Hwang et al., 2021.
-
†
The ActA peptide has sequence FNAPATSEPSSFEFPPPPTEDELEIIRETASSLDS (see methods for the exact construct tested).
-
Table 1—source data 1
Raw data for Table 1.
- https://cdn.elifesciences.org/articles/70601/elife-70601-table1-data1-v1.xlsx
Key resources table
| Reagent type (species) or resource | Designation | Source or reference | Identifiers | Additional information |
|---|---|---|---|---|
| Strain, strain background (Escherichia coli) | DH5a | NEB | Cat# 2987H | Chemically competent cells |
| Strain, strain background (Escherichia coli) | BL21(DE3) | Novagen | Cat# 71400 | Chemically competent cells |
| Cell line (Homo sapiens) | MCF7 | Joan Brugge, Harvard | ||
| Cell line (M. musculus) | MVD7 | Bear et al., 2000 | ||
| Cell line (Homo sapiens) | HEK293T | ATCC | ||
| Antibody | anti-ENAH (rabbit polyclonal) | Sigma | Cat# HPA028448 | (1:100) |
| Antibody | anti-Paxillin (mouse monoclonal) | BD Biosciences | Cat# 612405 | (1:200) |
| Antibody | Goat anti-mouse Alexa Fluor 488 (goat polyclonal) | Thermo Fisher | (1:1000) | |
| Antibody | Goat anti-mouse Alexa Fluor 647 (goat polyclonal) | Thermo Fisher | (1:1000) | |
| Antibody | Donkey anti-rabbit Alexa Fluor 405 (donkey polyclonal) | Abcam | (1:1000) | |
| Antibody | SureLight Allophycocyanin-anti-FLAG antibody (mouse monoclonal) | Perkin Elmer | Cat# AD0059F | (1:100) |
| Antibody | anti-actin (mouse monoclonal) | ProteinTech Group | (1:2500) | |
| Antibody | anti-GAPDH (mouse monoclonal) | Cell Signaling Technology | Cat# 5174S | (1:000) |
| Antibody | anti-EVL (rabbit polyclonal) | Sigma | Cat# HPA018849 | (1:1000) |
| Antibody | anti-VASP (rabbit monoclonal) | Cell Signaling Technology | Cat# 3132S | (1:1000) |
| Peptide, recombinant protein | Streptavidin, R-Phycoerythrin Conjugate (SAPE) | Thermo Fisher | Cat# S866 | (1:100) |
| Chemical compound, drug | Alexa Fluor 488-Phalloidin | Thermo Fisher | (1:40) | |
| Chemical compound, drug | Alexa Fluor 647-Phalloidin | Thermo Fisher | (1:40) | |
| Recombinant DNA reagent | pLKO.1-Enah shRNA (plasmid) | GE Dharmacon | ||
| Recombinant DNA reagent | pLKO.1-Evl shRNA (plasmid) | Sigma |
Additional files
-
Supplementary file 1
Protein sequences for A distributed residue network permits conformational binding specificity in a conserved family of actin remodelers.
- https://cdn.elifesciences.org/articles/70601/elife-70601-supp1-v1.pdf
-
Supplementary file 2
Refinement table for ENAH-PCARE crystal structure.
- https://cdn.elifesciences.org/articles/70601/elife-70601-supp2-v1.pdf
-
Transparent reporting form
- https://cdn.elifesciences.org/articles/70601/elife-70601-transrepform1-v1.docx
Download links
A two-part list of links to download the article, or parts of the article, in various formats.
Downloads (link to download the article as PDF)
Open citations (links to open the citations from this article in various online reference manager services)
Cite this article (links to download the citations from this article in formats compatible with various reference manager tools)
A distributed residue network permits conformational binding specificity in a conserved family of actin remodelers
eLife 10:e70601.
https://doi.org/10.7554/eLife.70601


