Native proline-rich motifs exploit sequence context to target actin-remodeling Ena/VASP protein ENAH
- Department of Biology, Massachusetts Institute of Technology, United States
- Department of Cellular & Molecular Medicine, University of Arizona, United States
- Department of Biological Engineering and Koch Institute for Integrative Cancer Research, Massachusetts Institute of Technology, United States
Figures
Figure 1 with 4 supplements
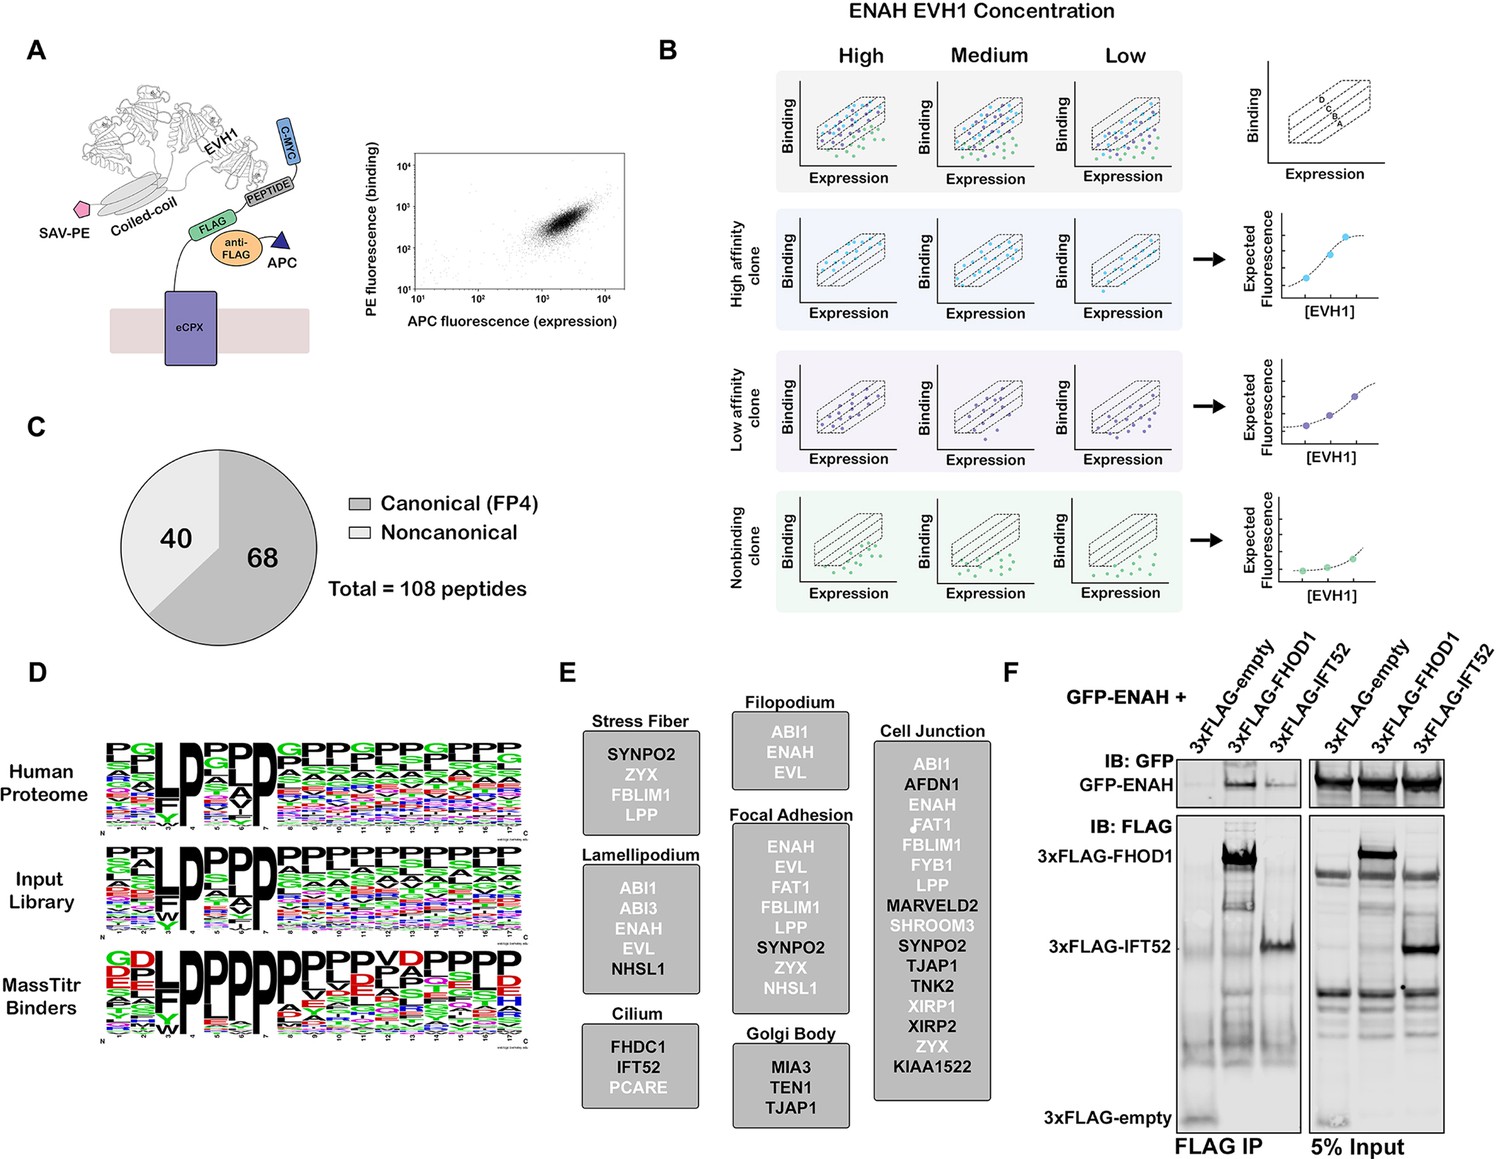
MassTitr screening identifies biologically relevant ENAH EVH1 ligands.
(A) At left, bacterial surface display schematic. Library peptides flanked by a FLAG tag and a c-Myc tag were expressed as fusions to the C-terminus of eCPX on the surface of E. coli. Cells were labeled with anti-FLAG-APC to quantify expression and then incubated with tetrameric ENAH EVH1 domain, which was detected by streptavidin conjugated to phycoerythrin (SAV-PE). At right, a FACS plot for surface-displayed ActA peptide binding to ENAH EVH1 tetramer (10 µM monomer concentration). (B) MassTitr schematic. The top row represents a library of three clones (blue, purple, and green) sorted into four gates at three concentrations of ENAH. The rows highlighted in blue, purple, and green illustrate reconstructions of the concentration-dependent binding of each clone based on deep sequencing. The experiment in this paper sorted a pre-enriched library of clones into four gates at eight concentrations. (C) Distribution of MassTitr hits after filtering; 68 peptides contained a canonical FP4 motif matching the regular expression [FWYL]PX[FWYLIAVP]P. (D) Frequency plot made from sequences that match the FP4 motif in the human proteome, the input library, and the MassTitr binders using Weblogo (Crooks et al., 2004). (E) Subcellular locations where at least two MassTitr hits that are predicted to be disordered and localized in the cytoplasm are annotated to reside. White text denotes previously reported Ena/VASP interactions. (F) IP and western blot showing interaction of ENAH with MassTitr hits FHOD1 and IFT52 in cells. GFP-tagged ENAH and FLAG-tagged candidate interactors were overexpressed in cells and resulting lysate was precipitated with anti-FLAG antibody and then blotted with anti-FLAG and anti-GFP.
Figure 1—figure supplement 1
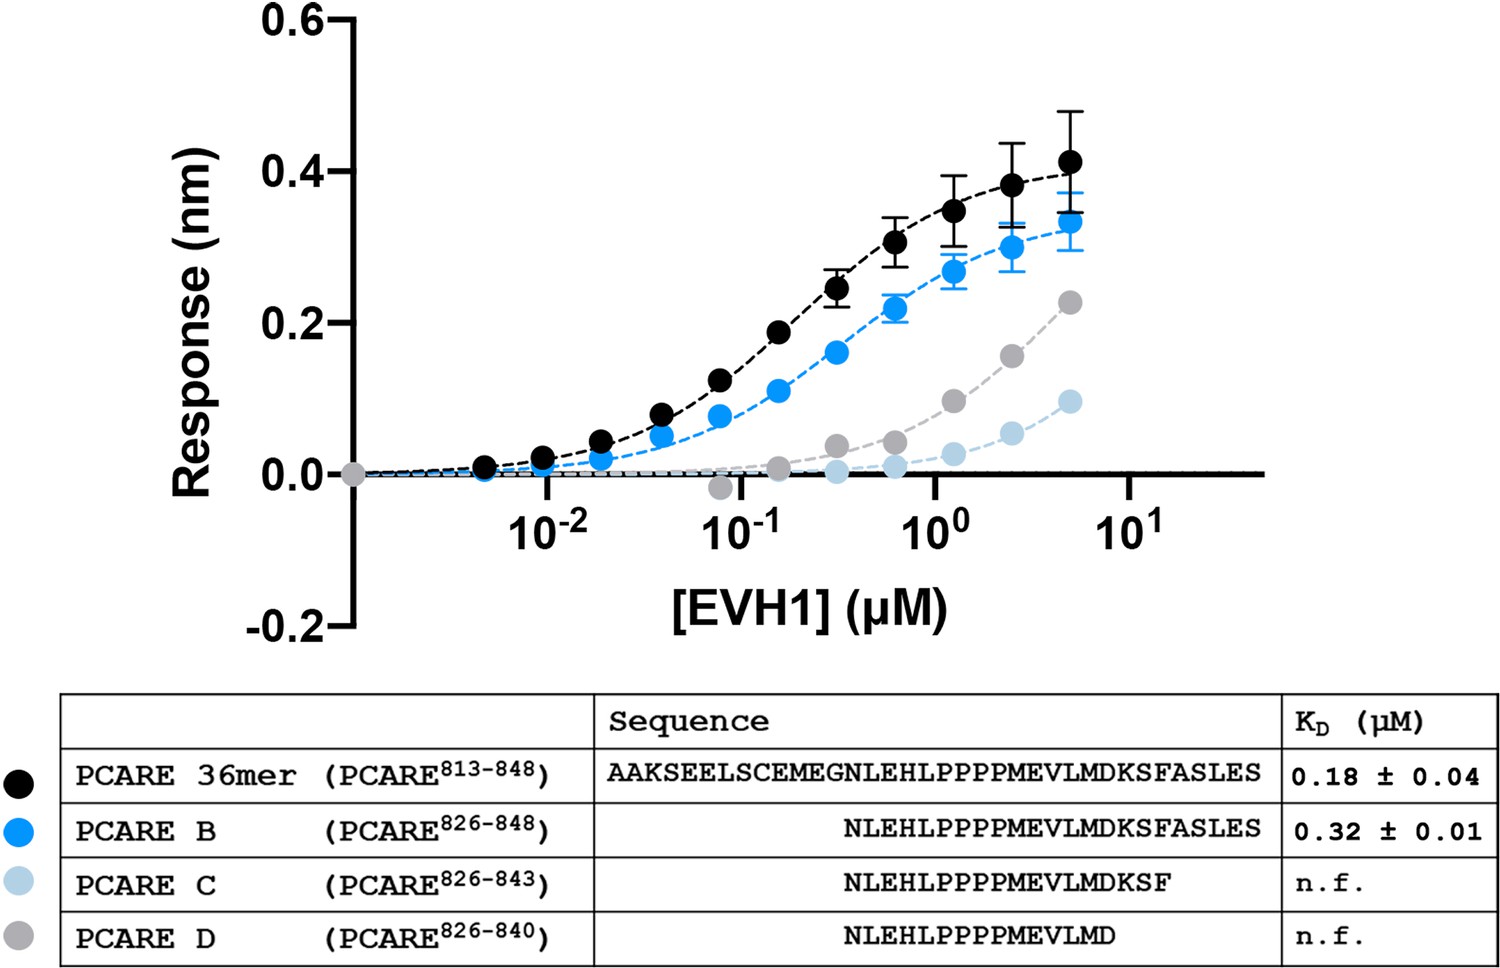
PCARE truncations.
BLI binding curves for truncations of the PCARE 36-mer binding to ENAH EVH1 domain monomer.
N.f. = could not be fit to give an accurate KD, given this concentration range. Errors reported as the standard deviation of two replicates for PCARE 36mer and PCARE B.
Figure 1—figure supplement 2
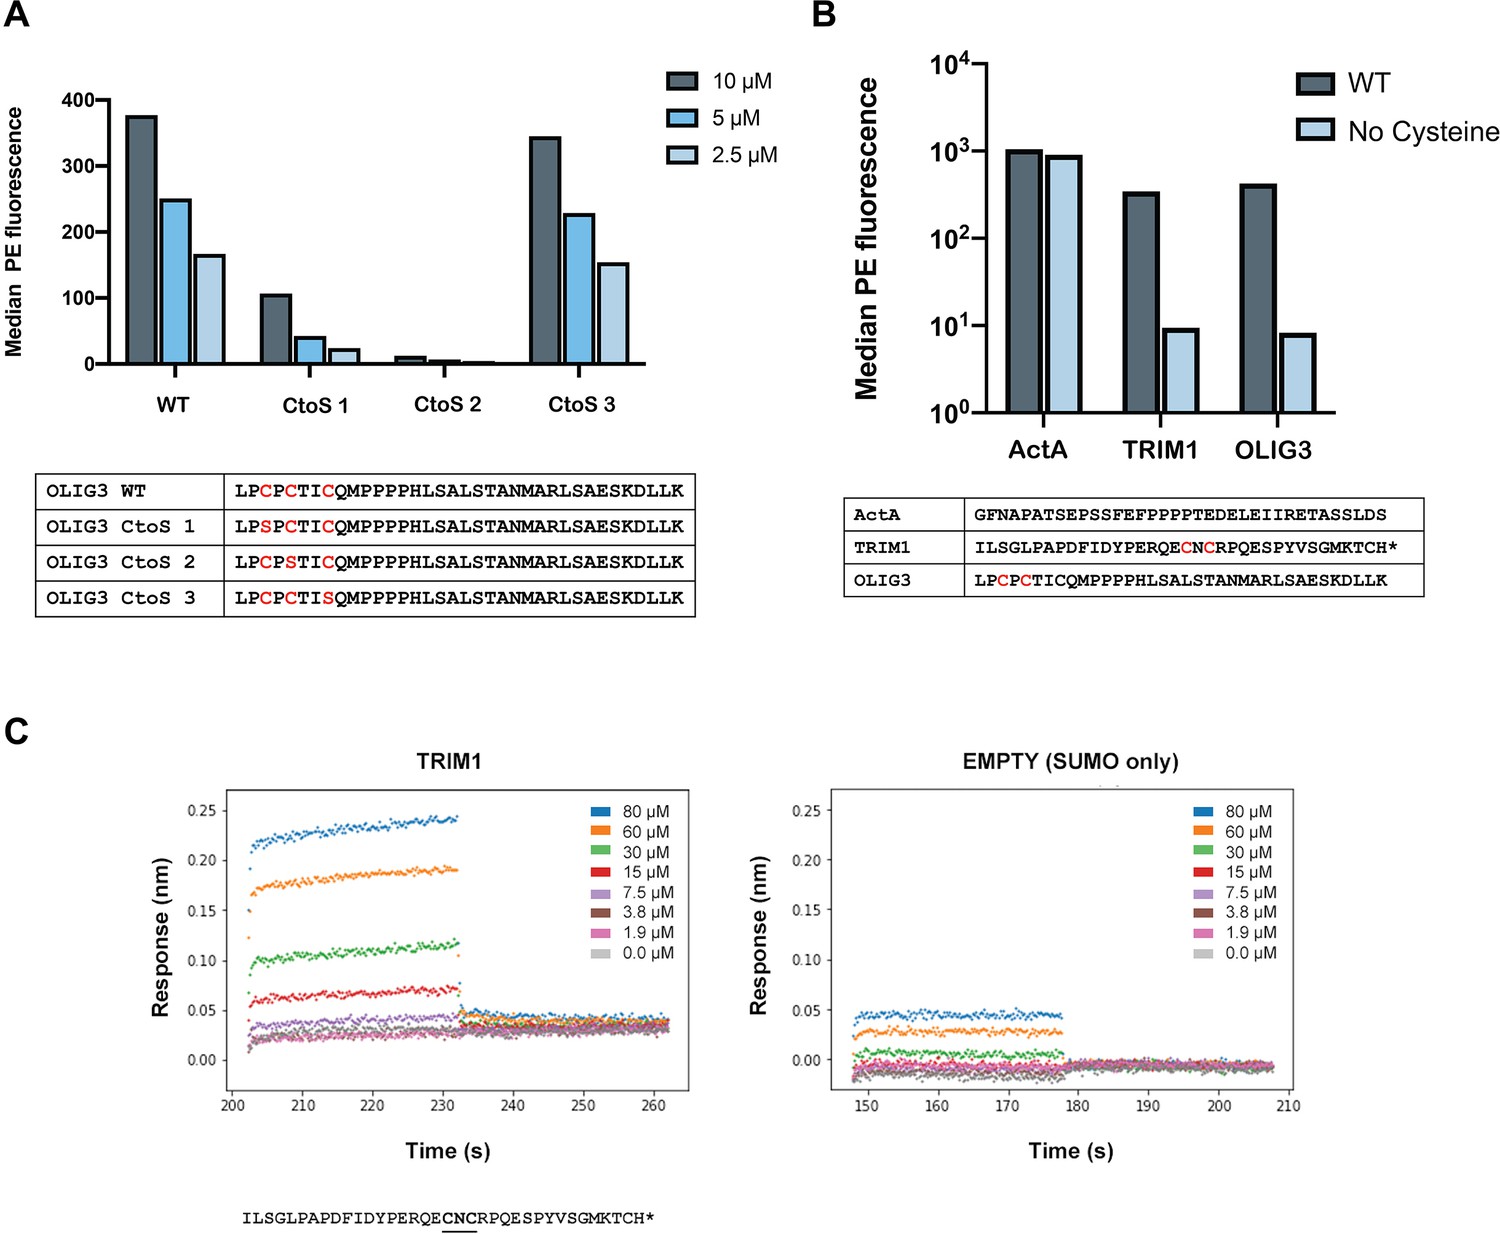
Peptides containing CXC motifs bind to ENAH EVH1 domain.
Thirty-five noncanonical (no FP4 motif) MassTitr hits contained CXC motifs. CXC motifs likely enhanced the binding affinity of weak peptides by forming disulfide bonds to the EVH1 domain in bacterial display. (A) The median fluorescence (PE) binding signal of representative CXC peptide OLIG3 mutants displayed on the surface of bacteria in the presence of either 10, 5, or 2.5 μM tetramerized ENAH (monomer concentrations given) and 2 mM DTT. (B) The median PE binding signal of ActA peptide, or CXC-motif containing peptides TRIM1 or OLIG3, displayed on the surface of bacteria in the presence of either ENAH tetramer or ENAH tetramer with no cysteines (5 μM monomer concentrations), and 2 mM DTT. (C) BLI plot for ENAH EVH1 monomer binding to a CXC-motif peptide from TRIM1 fused to SUMO (left) or to SUMO protein only (EMPTY, right). The TRIM1 binding curve did not saturate, so we did not fit a dissociation constant.
Figure 1—figure supplement 3
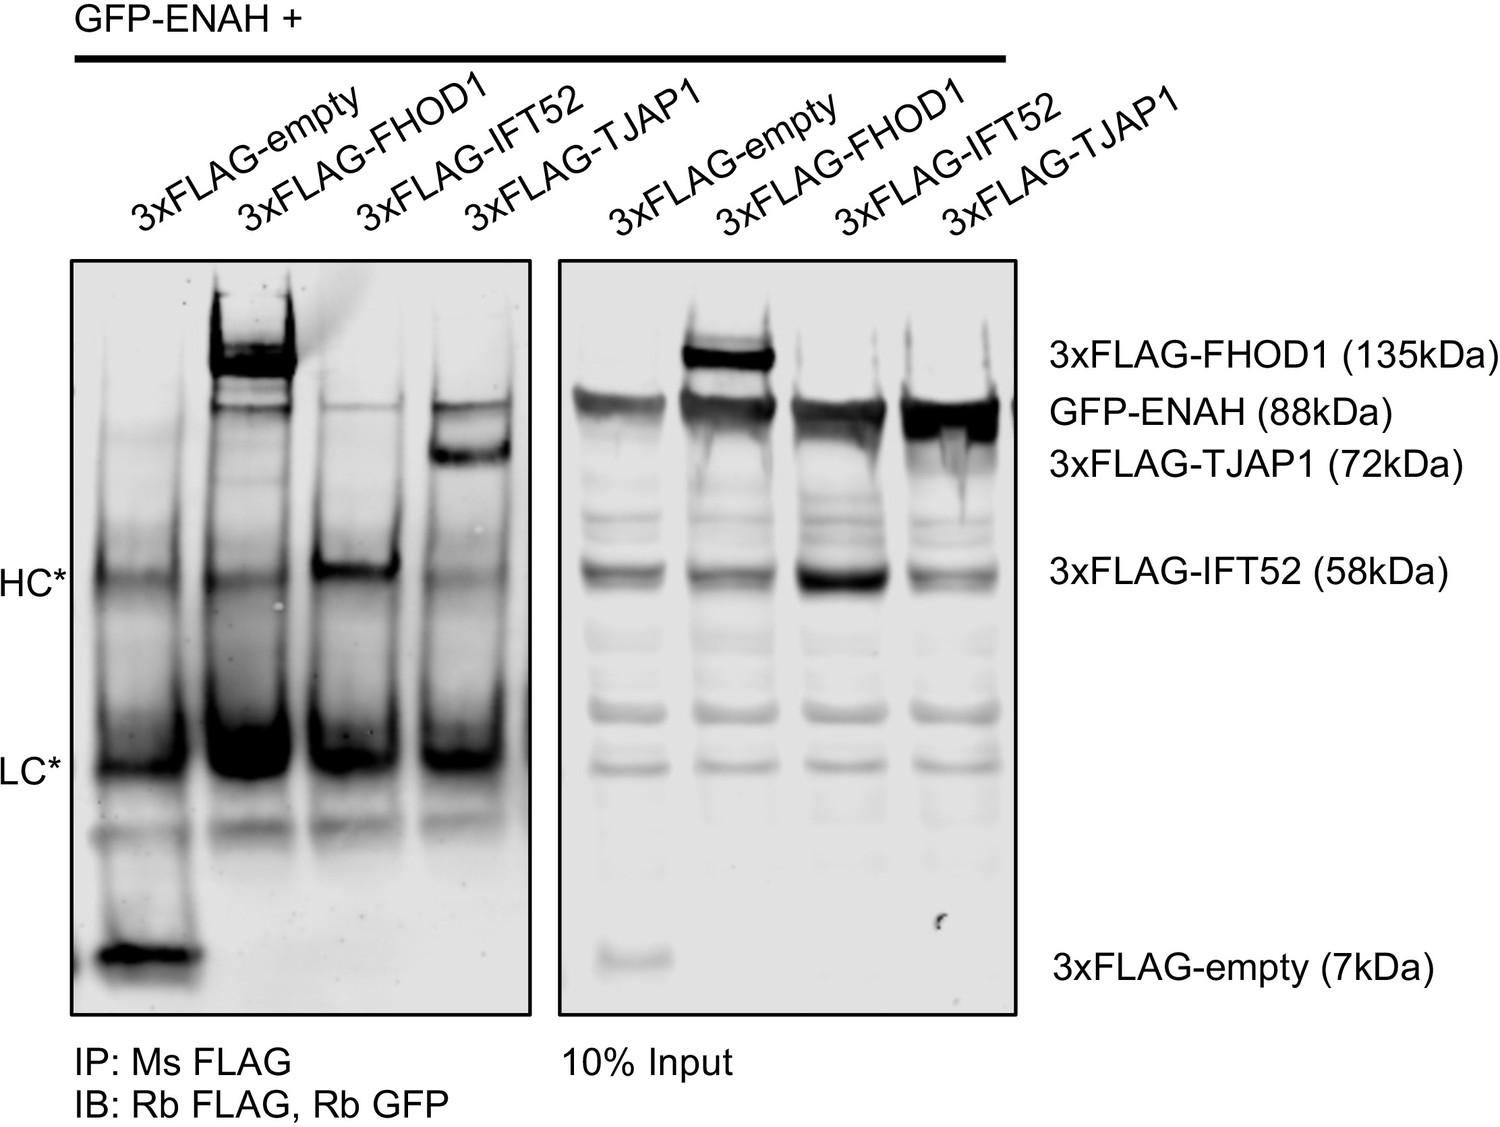
Full-length ENAH interacts with TJAP1 in cells.
Immunoprecipitation of MassTitr hits using anti-FLAG antibody, followed by a western blot probed with GFP and then FLAG tag. HC and LC denote heavy chain and light chain. Signal from the adjacent ENAH-GFP band bleeds into the anti-FLAG channel, precluding a clear visualization of FLAG-TJAP1 in the input, however the FLAG-TJAP1 and GFP-ENAH bands are distinct in the IP, confirming the interaction.
Figure 1—figure supplement 4

Gates used for MassTitr FACS sorting.
Gates drawn on FACS plot for T7-pep library pre-enriched with 20 μM ENAH tetramer binding to 30 μM ENAH tetramer (monomer concentrations are given).
Figure 2 with 1 supplement
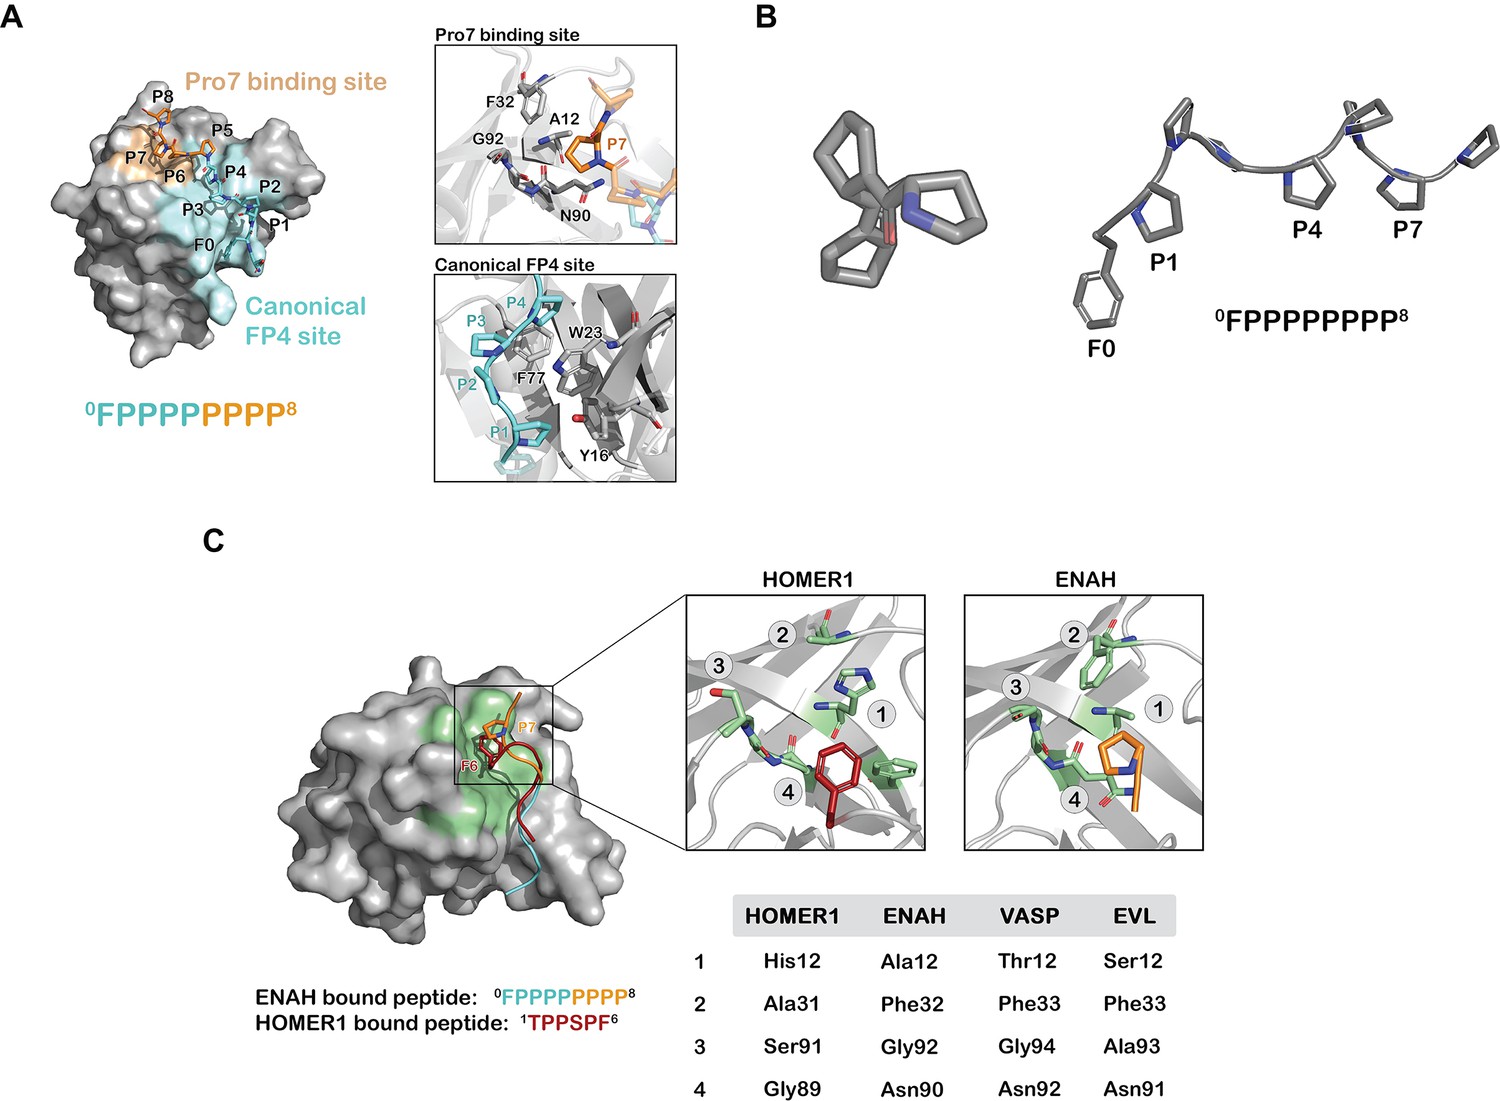
Prolines C-terminal to FP4 can engage a novel ENAH binding site.
(A) Surface representation of the ENAH EVH1 domain bound to FP8. The core FP4 motif is light blue, the P4 flank is orange; insets show details of the interactions. (B) Axial view of a polyproline type II helix highlighting three-fold symmetry (left); a side view shows P1, P4, and P7 facing the same side (right). (C) At left, surface representation of the HOMER1 EVH1 domain bound to TPPSPF (PDB 1DDV, peptide in red) aligned to the ENAH EVH1 domain bound to peptide FP8 (peptide in light blue/orange). The region corresponding to the Pro7 binding pocket in HOMER1 is colored in green. Inset: magnified views of the Pro7 binding pocket in ENAH and the analogous pocket in HOMER1. The table compares residues in this pocket for HOMER1, ENAH, VASP, and EVL.
Figure 2—figure supplement 1
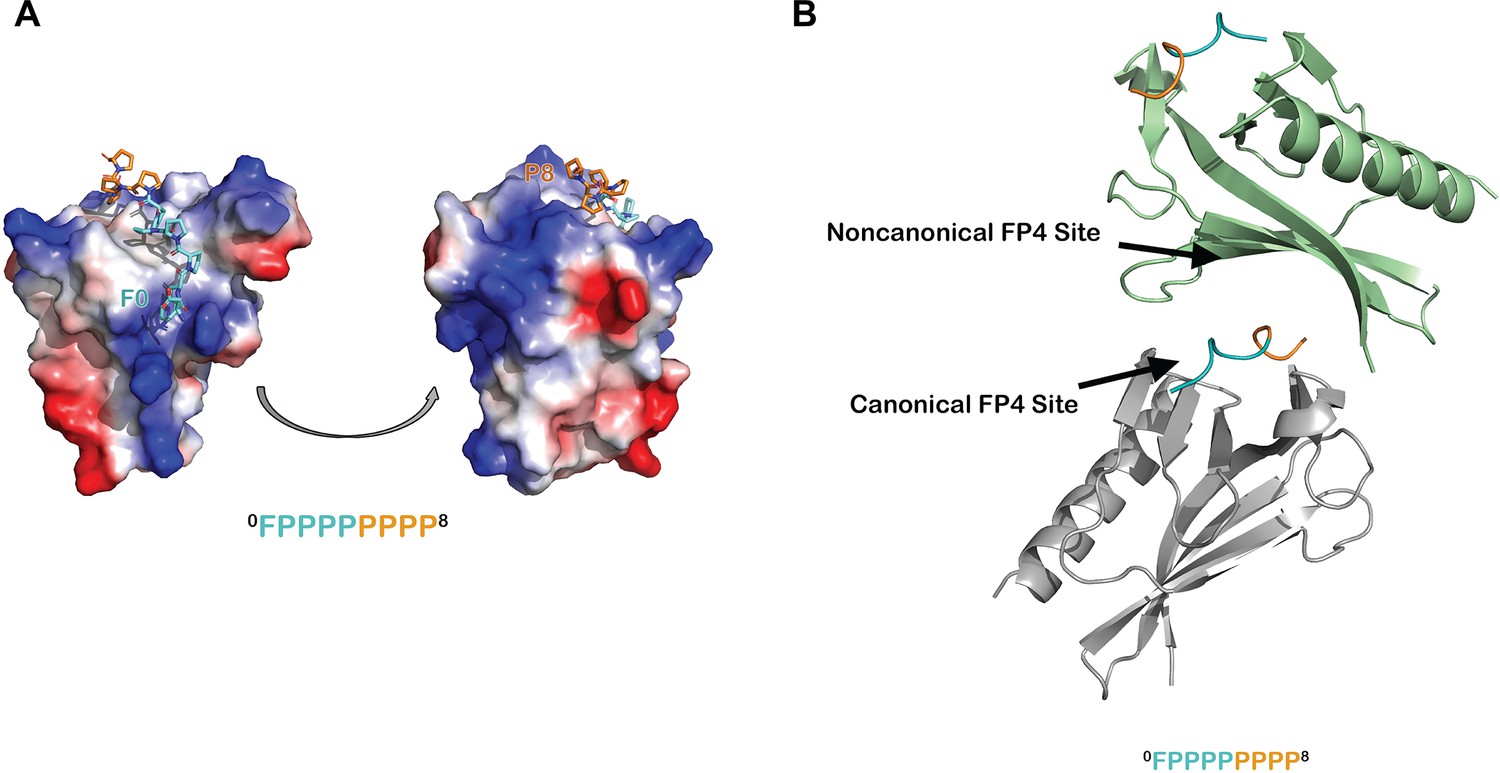
Additional analyses of the ENAH EVH1-ABI1 structure.
(A) Surface representation of the ENAH EVH1 domain, colored by electrostatic potential, bound to an FP8 peptide. The figure illustrates that the N- and C-terminal ends of the FP8 peptide are positioned near regions of positive charge on the EVH1 domain. (B) In the ENAH EVH1-ABI1 crystal lattice, part of the FP8 peptide bound to the canonical site of one EVH1 domain (gray) contacts the noncanonical site of an adjacent EVH1 domain (green). Although likely a packing artifact, this interaction mode rationalizes a possible model where two EVH1 domains can engage closely spaced FP4 motifs.
Figure 3 with 1 supplement
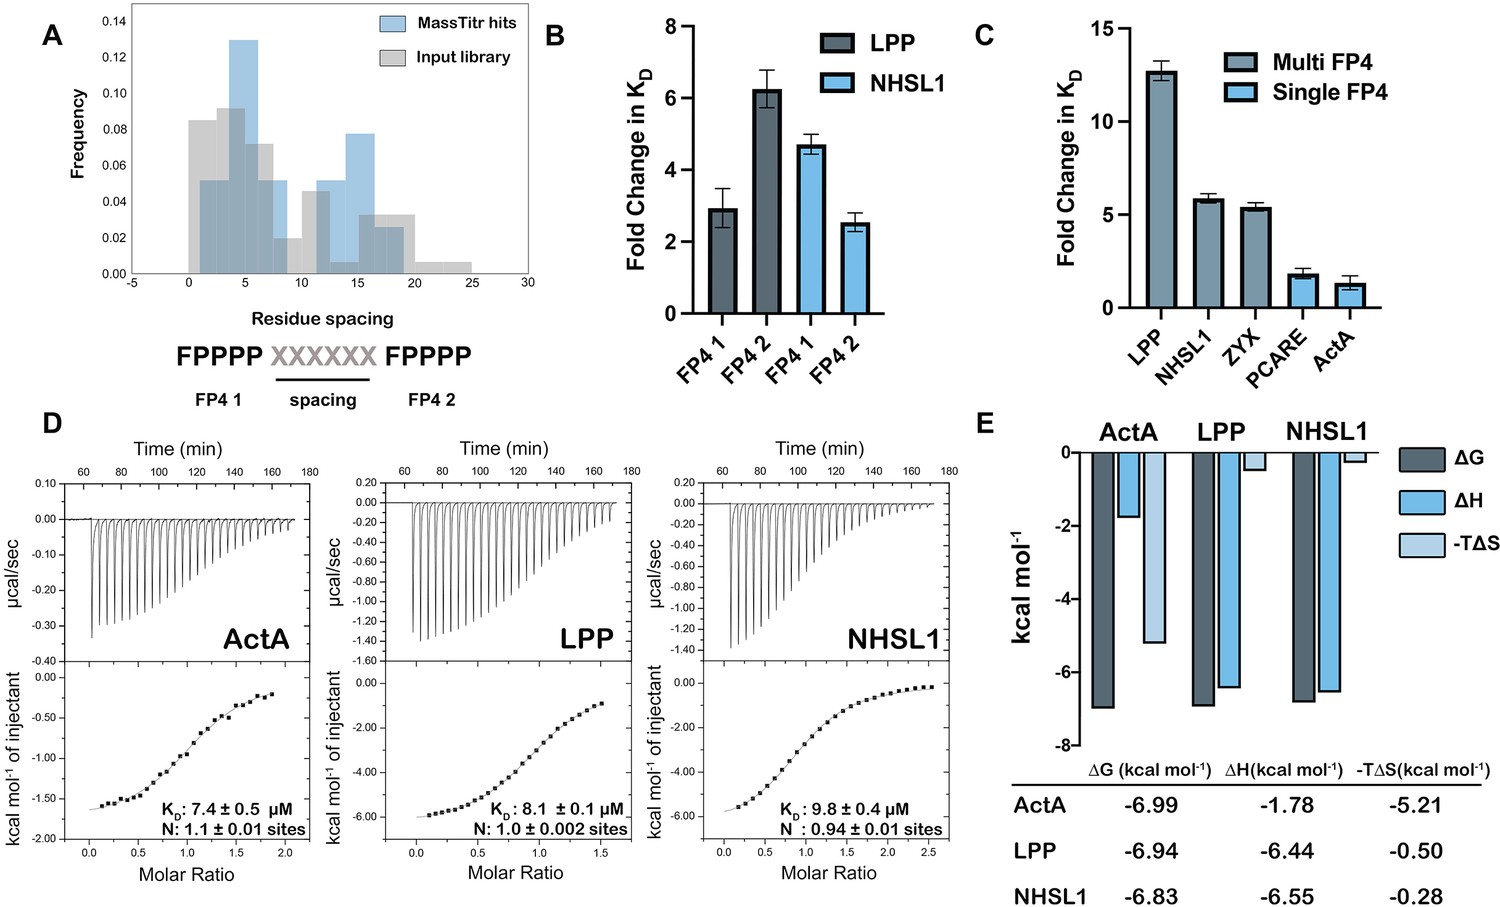
Multiple FP4 motifs enhance peptide binding affinity.
(A) Spacing of FP4 motifs in the input library and in high-confidence hits. (B) Fold change increase in KD for truncated single-motif peptide variants relative to higher affinity 36-mer dual-motif library peptides for LPP and NHSL1; see Table 1 for sequences. (C) Fold change increase in KD for 36-mer peptides binding to ENAH EVH1 R47A relative to tighter binding ENAH EVH1 WT. (D) ITC binding curves for 36-residue peptides from ActA, LPP, and NHSL1. (E) The entropic and enthalpic contributions to binding determined using data in panel D. Fold-change errors in (B) and (C) were calculated by propagating the error from two affinity measurements. Sequences for peptides referenced in this figure are given in Table 1 and Supplementary file 6.
-
Figure 3—source data 1
Raw data for Figure 3B and C.
- https://cdn.elifesciences.org/articles/70680/elife-70680-fig3-data1-v1.xlsx
Figure 3—figure supplement 1
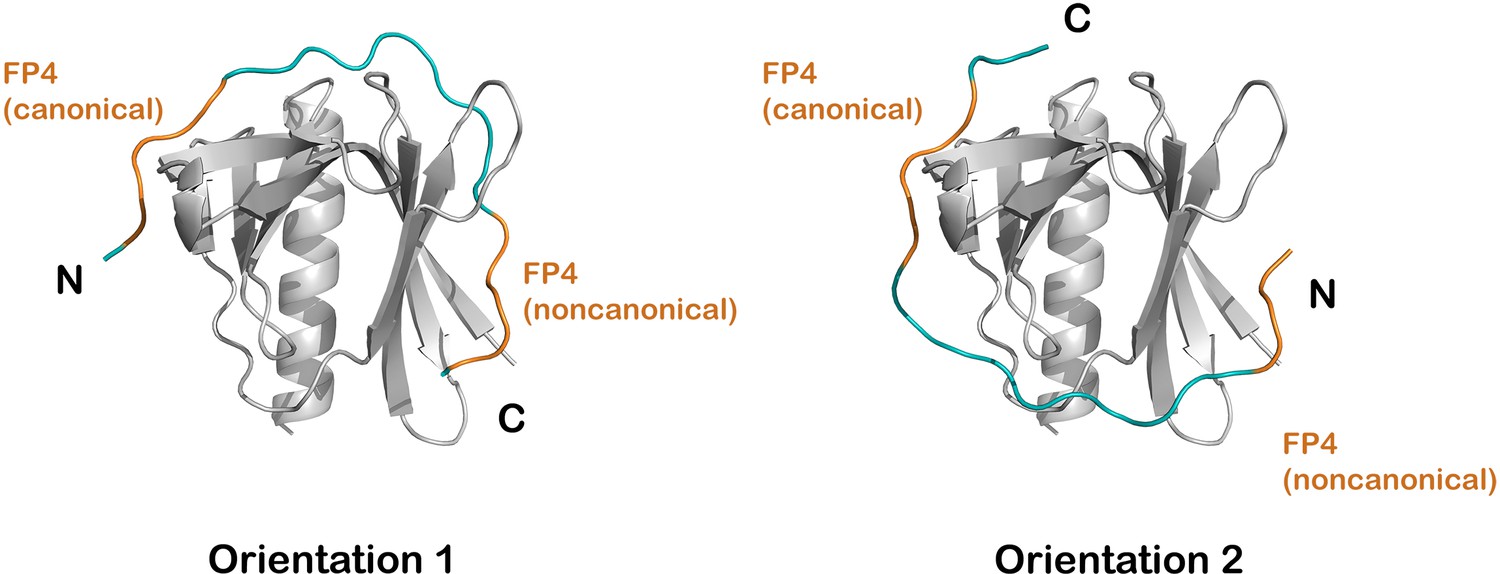
Modeling bivalent binding.
(A) Models of binding in which the two FP4 motifs are linked in one of two orientations. FP4 motifs, with sequence FPPPP, are colored in orange, and the minimum-length modeled linkers (10 residues in orientation 1 and 9 residues in orientation 2) are colored blue. The linker is designated as the sequence between the fourth proline of the first motif and the phenylalanine of the second motif.
Tables
Table 1
Affinities of dual FP4 motif peptides and their variants for ENAH EVH1 WT or ENAH EVH1 R47A obtained using biolayer interferometry.
| Nameb‡ | Sequence | WT KD (μM) | R47A KD (μM) |
|---|---|---|---|
| NHSL1* | ADRSPFLPPPPPVTDCSQGSPLPHSPVFPPPPPEAL | 9.7 ± 2.5 | 51.5 ± 10.0 |
| NHSL1 FP4 1* | ADRSPFLPPPPPVTDCSQGSPLPHSPV | 45.9 ± 5.5 | 93.0 ± 16.0 |
| NHSL1 FP4 2* | PVTDCSQGSPLPHSPVFPPPPPEAL | 24.9 ± 1.2 | 53.0 ± 4.1 |
| NHSL1 Duplicated* | ADRSPFLPPPPPVTDCSQGSPLPHSPVPVTDCSQGSPLPHSPVFPPPPPEAL | 18.6 ± 0.2 | 65.0 ± 7.0 |
| LPP* | KQPGGEGDFLPPPPPPLDDSSALPSISGNFPPPPPL | 4.7 ± 2.4 | 60.1 ± 6.7 |
| LPP FP4 1* | KQPGGEGDFLPPPPPPLDDSSALPSISGN | 13.9 ± 2.5 | 61.5 ± 0.6 |
| LPP FP4 2† | PPLDDSSALPSISGNFPPPPPL | 29.6 ± 2.3 | 67.2 ± 14.9 |
| LPP Duplicated* | KQPGGEGDFLPPPPPPLDDSSALPSISGNDDSSALPSISGNFPPPPPL | 7.9 ± 2.2 | 53.3 ± 2.5 |
-
*
Difference between WT and R47A KD value is significant with p < 0.01.
-
†
Difference between WT and R47A KD value is significant with p < 0.05.
-
‡
Errors are standard deviations over three replicates.
-
Table 1—source data 1
Raw data for Table 1.
- https://cdn.elifesciences.org/articles/70680/elife-70680-table1-data1-v1.xlsx
Key resources table
| Reagent type (species) or resource | Designation | Source or reference | Identifiers | Additional information |
|---|---|---|---|---|
| Strain, strain background (Escherichia coli) | DH5a | NEB | Cat# 2987 H | Chemically competent cells |
| strain, strain background (Escherichia coli) | BL21(DE3) | Novagen | Cat# 71,400 | Chemically competent cells |
| Peptide, recombinant protein | Streptavidin, R-Phycoerythrin Conjugate (SAPE) | Thermo Fisher | Cat# S866 | (1:100) |
| Antibody | SureLight Allophycocyanin-anti-FLAG antibody (mouse monoclonal) | Perkin Elmer | Cat# AD0059F | (1:100) |
| Antibody | Anti-FLAG (mouse monoclonal) | ProteinTech Group | Cat# 66008–3, RRID:AB_2749837 | (5 µg per mg of protein) |
| Antibody | Anti-FLAG (rabbit polyclonal) | ProteinTech Group | Cat# 66002–1, RRID:AB_11232216 | (1:1000) |
| Antibody | Anti-GFP(mouse monoclonal) | ProteinTech Group | Cat# 66002–1, RRID:AB_11182611 | (1:1000) |
| Antibody | Anti-Mouse IgG Alexa Fluor 680 (goat polyclonal) | ThermoFisher Scientific | Cat# A21057 | (1:20,000) |
| Antibody | Anti-Rabbit IgG Alexa Fluor 790 (goat polyclonal) | ThermoFisher Scientific | Cat# A11367 | (1:20,000) |
| Cell line (Homo-sapiens) | HEK293T | ATCC |
Additional files
-
Supplementary file 1
MassTitr hits and annotated ENAH interactors.
- https://cdn.elifesciences.org/articles/70680/elife-70680-supp1-v1.xlsx
-
Supplementary file 2
Dissociation constants for MassTitr peptides derived from human proteins binding to monomeric ENAH EVH1 domain.
- https://cdn.elifesciences.org/articles/70680/elife-70680-supp2-v1.docx
-
Supplementary file 3
Dissociation constants for ABI1-derived peptides binding to ENAH EVH1 domain.
- https://cdn.elifesciences.org/articles/70680/elife-70680-supp3-v1.docx
-
Supplementary file 4
Dissociation constants for peptides derived from human proteins binding to monomeric EVH1 domains from ENAH, VASP, and EVL.
- https://cdn.elifesciences.org/articles/70680/elife-70680-supp4-v1.docx
-
Supplementary file 5
Comparison of affinities of single- and dual-motif peptides for monomeric ENAH WT vs. ENAH R47A.
- https://cdn.elifesciences.org/articles/70680/elife-70680-supp5-v1.docx
-
Supplementary file 6
Protein constructs for Native proline-rich motifs exploit sequence context to target actin-remodeling Ena/VASP protein ENAH.
- https://cdn.elifesciences.org/articles/70680/elife-70680-supp6-v1.docx
-
Supplementary file 7
MassTitr sample preparation and key.
- https://cdn.elifesciences.org/articles/70680/elife-70680-supp7-v1.xlsx
-
Supplementary file 8
Refinement table for ENAH-ABI1 structure.
- https://cdn.elifesciences.org/articles/70680/elife-70680-supp8-v1.docx
-
Transparent reporting form
- https://cdn.elifesciences.org/articles/70680/elife-70680-transrepform1-v1.docx
-
Source data 1
Raw data for Supplementary file 2.
- https://cdn.elifesciences.org/articles/70680/elife-70680-supp9-v1.xlsx
-
Source data 2
Raw data for Supplementary file 3.
- https://cdn.elifesciences.org/articles/70680/elife-70680-supp10-v1.xlsx
-
Source data 3
Raw data for Supplementary file 4.
- https://cdn.elifesciences.org/articles/70680/elife-70680-supp11-v1.xlsx
Download links
A two-part list of links to download the article, or parts of the article, in various formats.
Downloads (link to download the article as PDF)
Open citations (links to open the citations from this article in various online reference manager services)
Cite this article (links to download the citations from this article in formats compatible with various reference manager tools)
Native proline-rich motifs exploit sequence context to target actin-remodeling Ena/VASP protein ENAH
eLife 11:e70680.
https://doi.org/10.7554/eLife.70680


