Reprogramming and redifferentiation of mucosal-associated invariant T cells reveal tumor inhibitory activity
- Host Defense Division, Research Center for Advanced Medical Science, Dokkyo Medical University, Japan
- Department of Dermatology, School of Medicine, Dokkyo Medical University, Japan
Figures
Figure 1 with 1 supplement
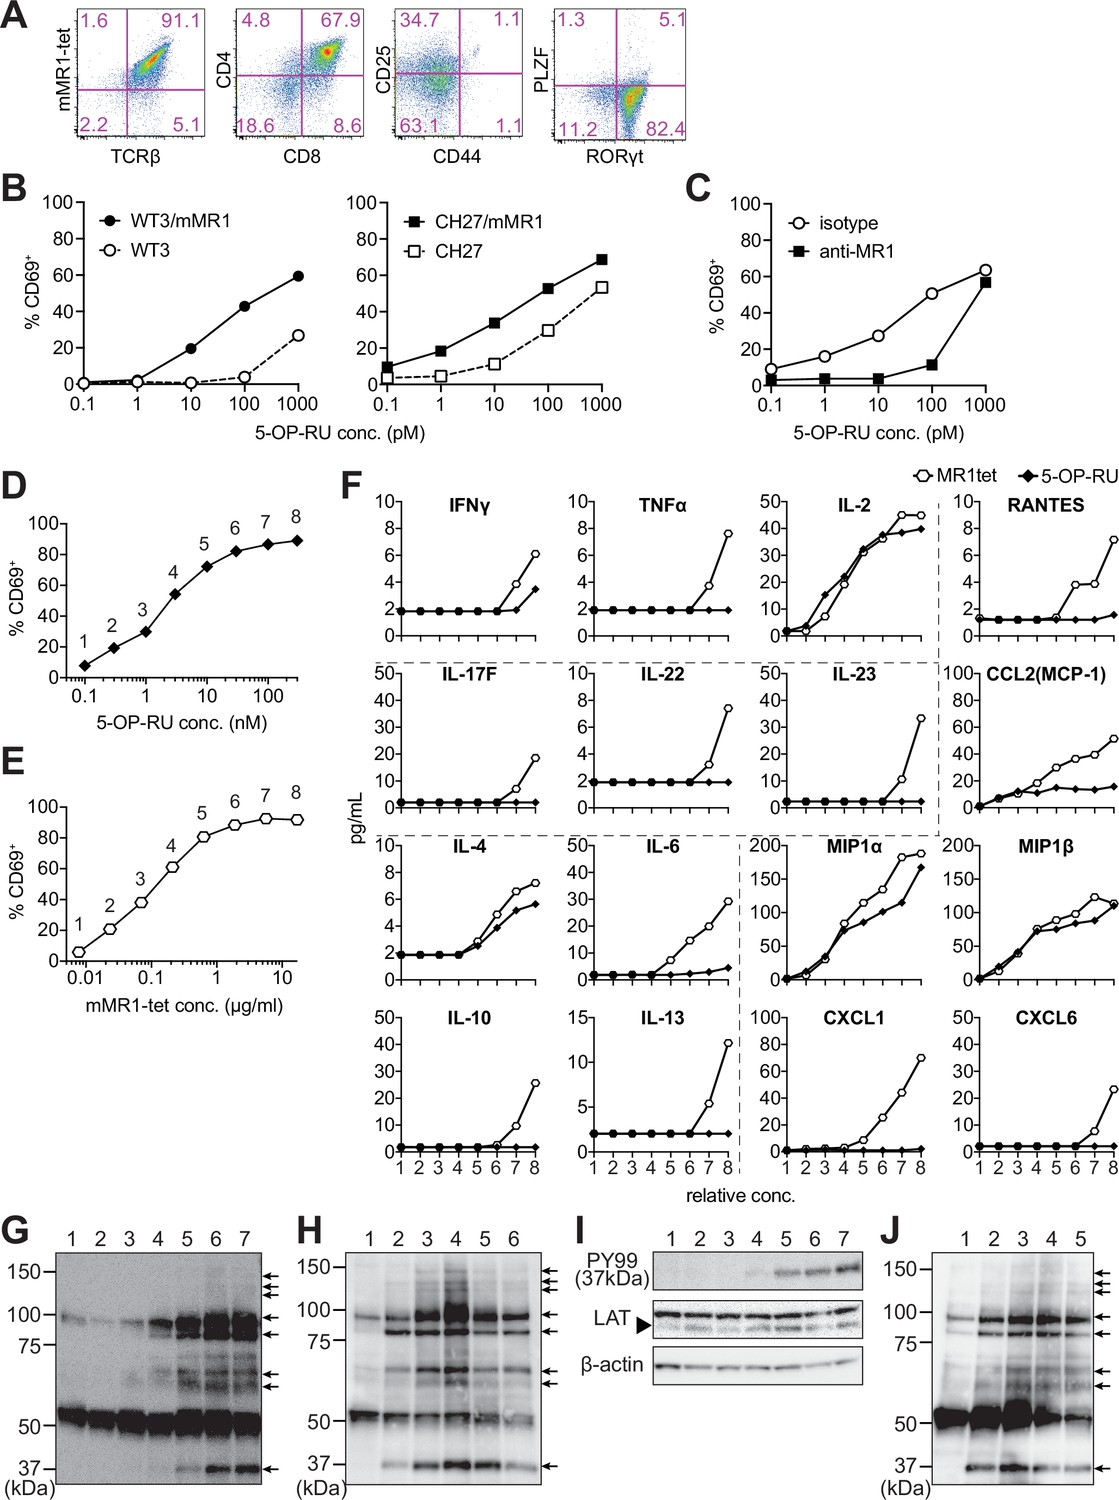
Characterization of m-reMAIT cells.
(A) Flow cytometric profiles of m-reMAIT cells. mMR1-tet staining and expression of T-cell receptor β (TCRβ), CD4, CD8, CD25, and CD44 and the transcription factors PLZF and RORγt in m-reMAIT cells on differentiation day 18. (B) 5-(2-oxopropylideneamino)-6-D-ribitylaminouracil (5-OP-RU) dose-dependent activation of m-reMAIT cells. The percentages of CD69+ cells among m-reMAIT cells challenged with the indicated concentration of 5-OP-RU in the presence of WT3 (◯), WT3/mMR1 (●), CH27 (□), and CH27/mMR1(■). (C) MR1-dependent activation of m-reMAIT cells. The percentage of CD69+ cells among m-reMAIT cells cultured with CH27/mMR1, challenged as in (B) in the presence of the anti-MR1 antibody (■) or the isotype control antibody (◯). (D) 5-OP-RU dose-dependent activation. The percentage of m-reMAIT cells expressing CD69 upon a challenge with various concentrations of 5-OP-RU. Representative data from two independent experiments are shown. (E) mMR1-tet dose-dependent activation. The percentage of m-reMAIT cells expressing CD69 upon a challenge with the indicated amounts of mMR1-tet. Representative data from two independent experiments are shown. (F) 5-OP-RU- and mMR1-tet-induced cytokines and chemokines. m-reMAIT cells were stimulated with various concentrations of 5-OP-RU (◯) or mMR1-tet (■) and the resultant cytokines and chemokines were quantified with LegendPlex. The concentrations at which each reagent induced a similar degree of activation (% CD69) are shown as relative concentrations (0.1–100 nM for 5-OP-RU and 0.01–10 μg/ml for mMR1-tet). The number on the X-axis corresponds to that in (D) and (E). (G) Tyrosine phosphorylation elicited with 5-OP-RU. A Western blot analysis with PY99 (anti-phosphotyrosine). Upon a challenge with different concentrations of 5-OP-RU for 30 min, the cell lysate from m-reMAIT cells was separated on SDS-PAGE (5 × 10⁵/lane), and subjected to Western blotting. Lane 1, 0; lane 2, 0.1; lane 3, 1.0; lane 4, 10; lane 5, 100; lane 6, 1000; and lane 7, 10,000 (nM). Phosphorylated proteins are indicated with arrows. (H) Time course of tyrosine phosphorylation. A Western blot analysis with PY99. The cell lysate from m-reMAIT cells challenged with 100 nM of 5-OP-RU for the indicated time was separated on SDS-PAGE (5 × 10⁵/lane) and subjected to Western blotting. Lane 1, 0; lane 2, 15; lane 3, 30; lane 4, 60; lane 5, 150; lane 6, 300 (min) . Arrows indicate phosphorylated proteins. (I) Linker for the activation of T cells (LAT) as a phosphorylated 37-kD protein. A Western blot analysis with PY99, anti-LAT, and anti-β-actin. The cell lysate prepared as described in (H) for 60 min was subjected to Western blotting. A blot with PY99 (upper panel), anti-LAT (middle panel), and anti-β-actin (lower panel). Phosphorylated LAT and LAT as well as β-actin are indicated (arrow). Lane 1, 0; lane 2, 0.1; lane 3, 1.0; lane 4, 10; lane 5, 100; lane 6, 1000; lane 7, 10,000 (nM). (J) Tyrosine phosphorylation induced by mMR1-tet. A Western blot analysis with PY99. The cell lysate from m-reMAIT cells challenged with the indicated amounts of unlabeled mMR1-tet for 60 min was subjected to Western blotting (5 × 10⁵/lane). Lane 1, 0; lane 2, 0.43; lane 3, 1.3; lane 4, 4.3; lane 5, 13 (μg/ml). Arrows indicate phosphorylated proteins. MAIT: mucosal-associated invariant T cell.
-
Figure 1—source data 1
Characterization of m-reMAIT cells.
The type of antigen-presenting cell (APC), reMAIT cells, and the concentration of 5-(2-oxopropylideneamino)-6-D-ribitylaminouracil (5-OP-RU) (nM) used for activation assays. Activation is shown as the percentage of CD69+ cells among reMAIT cells (B). The percentage of CD69+ MAIT cells challenged with 5-OP-RU in the presence of isotype control or anti-MR1 antibody (in the presence of CH27m as APC) (C). The percentage of CD69+ MAIT cells challenged with 5-OP-RU or mMR1-tet (D, E). Production of the cytokines and chemokines from m-reMAIT cells challenged with 5-OP-RU or mMR1-tet (F). MAIT: mucosal-associated invariant T cell.
- https://cdn.elifesciences.org/articles/70848/elife-70848-fig1-data1-v1.xlsx
-
Figure 1—source data 2
Original gel electrophoresis panels for Figure 1G–J.
- https://cdn.elifesciences.org/articles/70848/elife-70848-fig1-data2-v1.zip
Figure 1—figure supplement 1
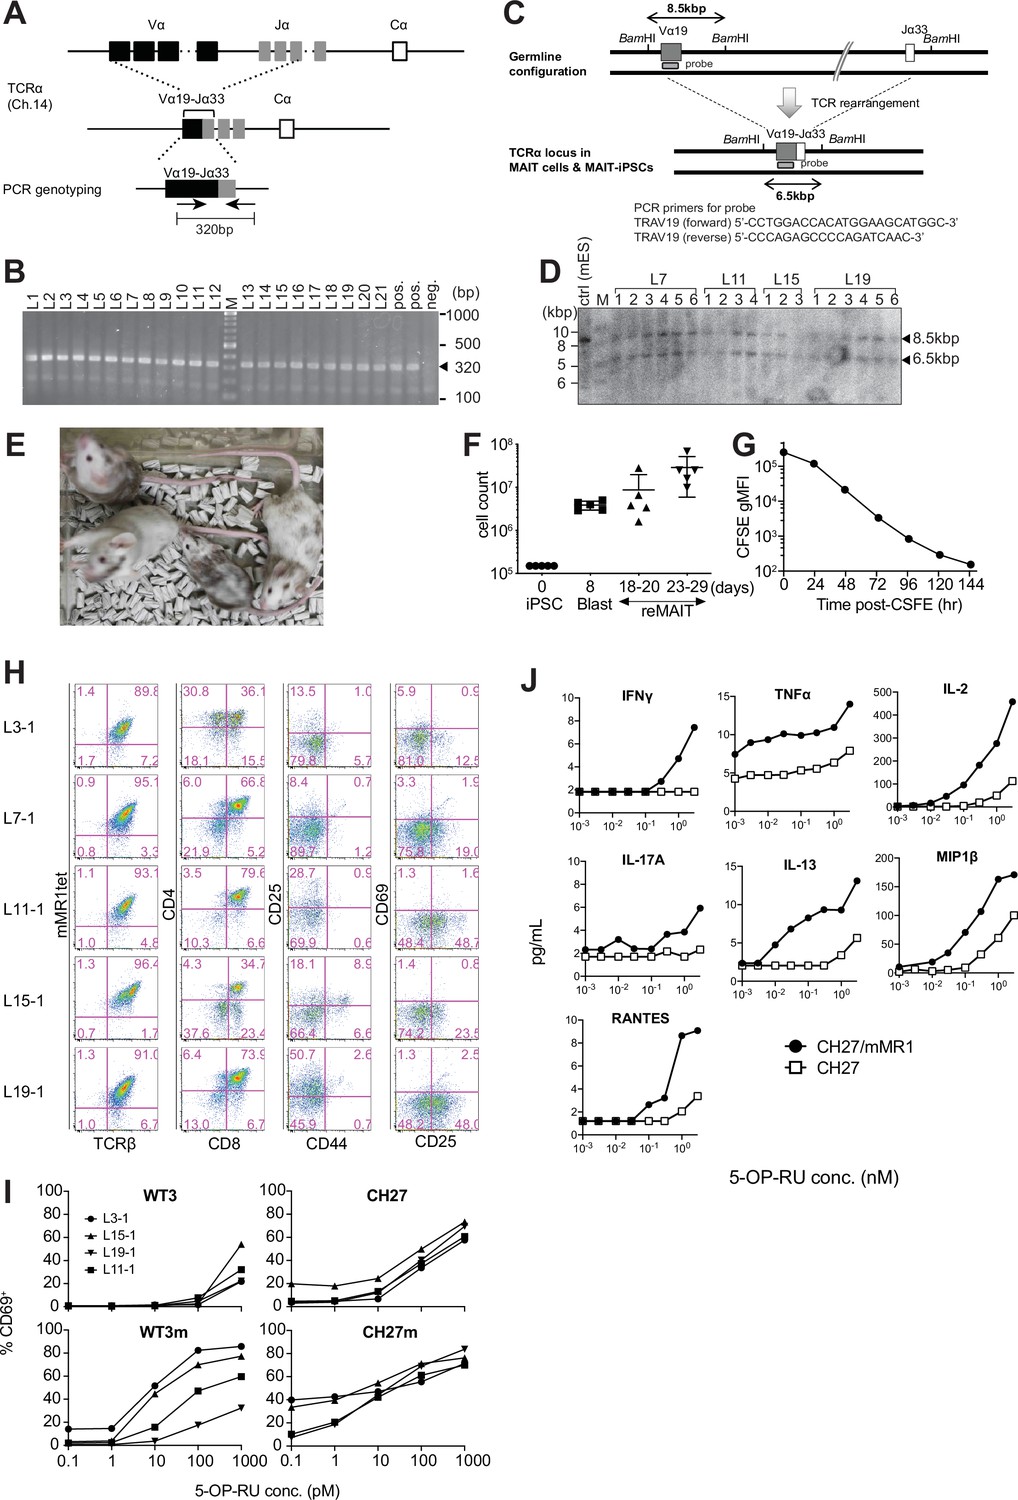
Characterization of induced pluripotent stem cells (iPSCs) from mucosal-associated invariant T (MAIT) cells and of m-reMAIT cells.
(A) Genomic configuration of TCRα loci in MAIT-iPSCs. TCRα loci in C57BL/6 (upper panel) and MAIT-iPSCs (middle panel). The primer set to detect rearranged Trav1-Traj33 (Vα19-Jα33) is shown with arrows (lower panel). (B) MAIT-iPSC detection by PCR. The results of PCR using the primer set shown in (A). Bands corresponding to rearranged Trav1-Traj33 are indicated by arrowheads. MAIT-iPSCs (L1–L21) before the limiting dilution, the positive control, and negative control (ES cells) are shown. M: molecular weight marker. (C) Southern blot probe detecting the rearranged TCRα locus. The genomic configuration of the TCRα locus before (upper panel) and after (lower panel) the Trav1-Traj33 rearrangement. The positions of the Southern blot probe as well as BamHI sites are shown together with the primer sequences for probe synthesis. (D) Southern blot analysis of MAIT-iPSCs. The bands corresponding to the germline configuration (~8.5 kb) and those after the rearrangement (~6.5 kb) are shown by arrowheads. In the analysis, genomic DNA from MAIT-iPSCs after limiting dilutions was used. Mouse ES cells (cntrl). M: DNA size marker; L7 clones; L7-1−L7-6; L11 clones; L11-1−L11-4; L15 clones; L15-1−L15-3; and L19 clones; L19-1−L19-6. (E) Chimeric mice generated from MAIT-iPSCs. Chimeric mice from MAIT-iPSCs (L7) are shown. Chimerism ranged between 10% and 90%. (F) Expansion of MAIT-iPSCs during differentiation. Cell numbers at the indicated differentiation stage of L7-1 from iPSCs are plotted. Blast: lymphocyte progenitor cells; reMAIT: m-reMAIT cells defined as TCRβ+mMR1-tet+. Data are shown as medians. Horizontal line: median; whiskers: minimum and maximum. (G) m-reMAIT cell doubling time during the logarithmic phase of expansion. The fluorescent intensity of CFSE-labeled m-reMAIT cells (L7-1) vs. the culture time is plotted to estimate the doubling time. (H) Flow cytometric profiles of m-reMAIT cells from different MAIT-iPSCs. mMR1-tet staining and the expression of TCRβ, CD4, CD8, CD25, CD69, and CD44 in m-reMAIT cells (from L3-1, L7-1, L11-1, L15-1, and L19-1 MAIT-iPSCs) on differentiation day 23. (I) 5-OP-RU dose-dependent activation of m-reMAIT cells. The percentage of CD69+ cells among m-reMAIT cells (from L3-1, L11-1, L15-1, and L19-1 MAIT-iPSCs) challenged with the indicated concentration of 5-OP-RU in the presence of antigen-presenting cells (APCs), such as WT3, WT3/mMR1, CH27, and CH27/mMR1, is shown. (J) 5-OP-RU dose-dependent production of cytokines and chemokines. The indicated cytokines and chemokines in the culture supernatant from m-reMAIT cells (L7-1) cultured in the presence of CH27 (□) or CH27/mMR1 (●), and challenged with varying concentrations of 5-OP-RU are quantified with LegendPlex. Data are representative of two independent experiments.
-
Figure 1—figure supplement 1—source data 1
Characterization of induced pluripotent stem cells (iPSCs) from mucosal-associated invariant T (MAIT) cells and of m-reMAIT cells.
- https://cdn.elifesciences.org/articles/70848/elife-70848-fig1-figsupp1-data1-v1.xlsx
-
Figure 1—figure supplement 1—source data 2
Gel electrophoresis for PCR products and Southern blot analysis to detect Trav1-Traj33 rearrangement.
- https://cdn.elifesciences.org/articles/70848/elife-70848-fig1-figsupp1-data2-v1.zip
Figure 2 with 5 supplements
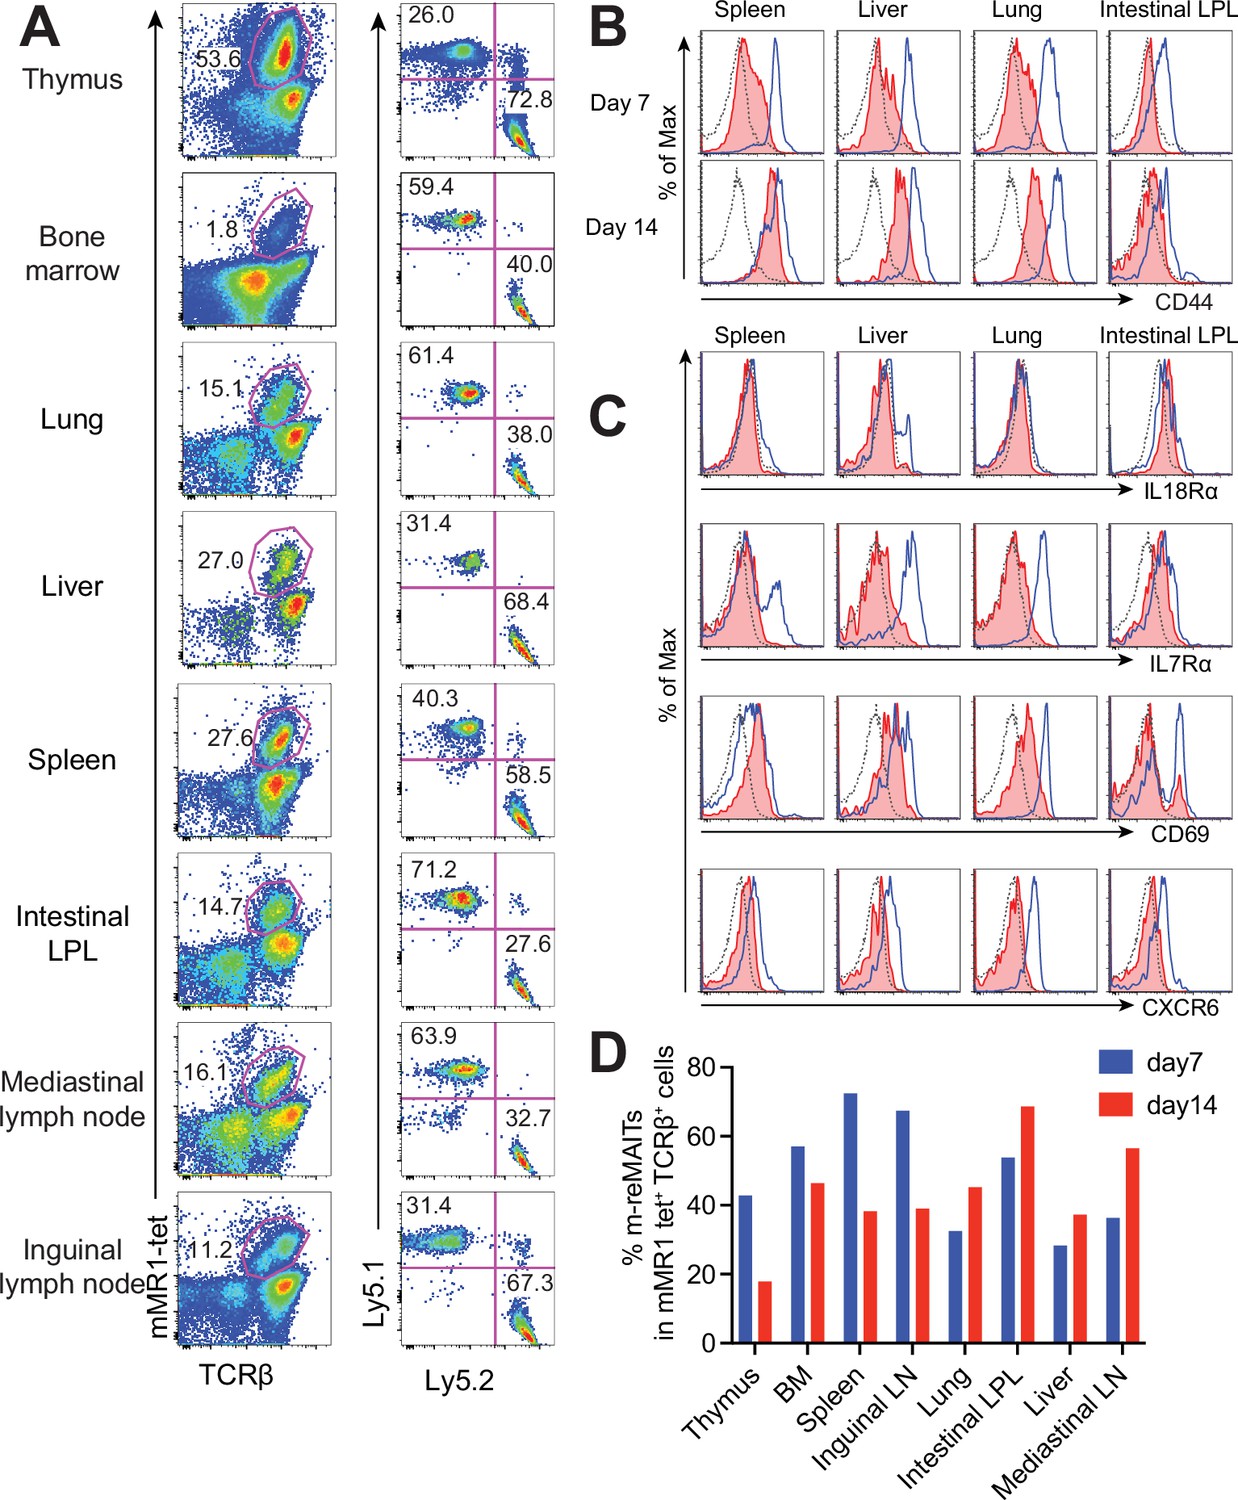
Behavior of m-reMAIT cells upon adoptive transfer.
(A) m-reMAIT cell migration into different organs. m-reMAIT cells (Ly5.2) were adoptively transferred into C57BL/6 (Ly5.1) mice via an intraperitoneal injection (1 × 10⁷ cells/mouse), and endogenous as well as exogenous TCRβ+mMR1-tet+ cells were enriched 7 days later with mMR1-tet (left panel) and subjected to analyses of the expression of Ly5.1 and Ly5.2 (right panel). The number in the panel shows the percentage of Ly5.1 (endogenous) and Ly5.2 (exogenous) TCRβ+mMR1-tet+ cells. Representative data from a pool of 3–4 mice per experiment are shown. (B) Time-dependent upregulation of CD44. CD44 expression in TCRβ+mMR1-tet+ cells from the indicated tissues 7 and 14 days after m-reMAIT cell adoptive transfer. Isotype control (dotted line), endogenous mucosal-associated invariant T (MAIT) cells (Ly5.1+TCRβ+mMR1-tet+ cells) (plain blue line), and exogenous m-reMAIT cells (Ly5.2+TCRβ+mMR1-tet+ cells) (shaded in red). Representative data from a pool of 3–4 mice per experiment are shown. (C) Expression of molecules relevant to MAIT cells. The expression of molecules in m-reMAIT cells from the indicated tissues 14 days after adoptive transfer. Isotype control (dotted line), endogenous MAIT cells (Ly5.1+TCRβ+mMR1-tet+ cells) (plain blue line), and exogenous m-reMAIT cells (Ly5.2+TCRβ+mMR1-tet+ cells) (shaded in red). Representative data from a pool of 3–4 mice per experiment are shown. (D) Frequency of m-reMAIT cells. The frequency of m-reMAIT cells (m-reMAITs) among mMR1-tet+TCRβ+ cells harvested on days 7 and 14 from the indicated organs is shown. Representative data from two experiments are indicated.
Figure 2—figure supplement 1
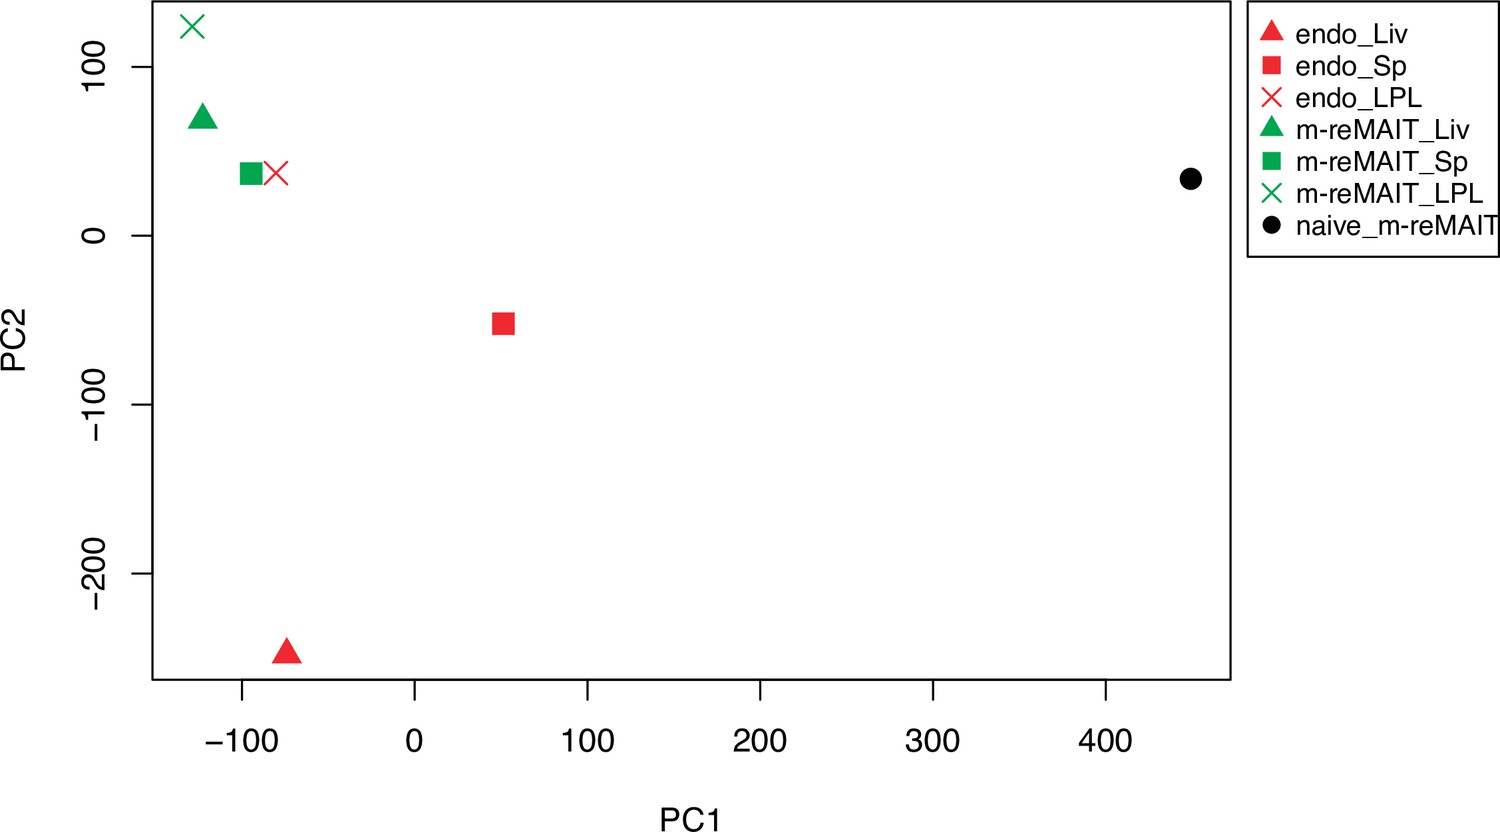
Principal component analysis (PCA).
PCA on the whole transcripts in naïve m-reMAIT cells (closed circle), in m-reMAIT cells from the spleen (green square), liver (green triangle), and LPL (green cross) upon adoptive transfer, and in endogenous mucosal-associated invariant T (MAIT) cells from the spleen (red square), liver (red triangle), and LPL (red cross).
Figure 2—figure supplement 2
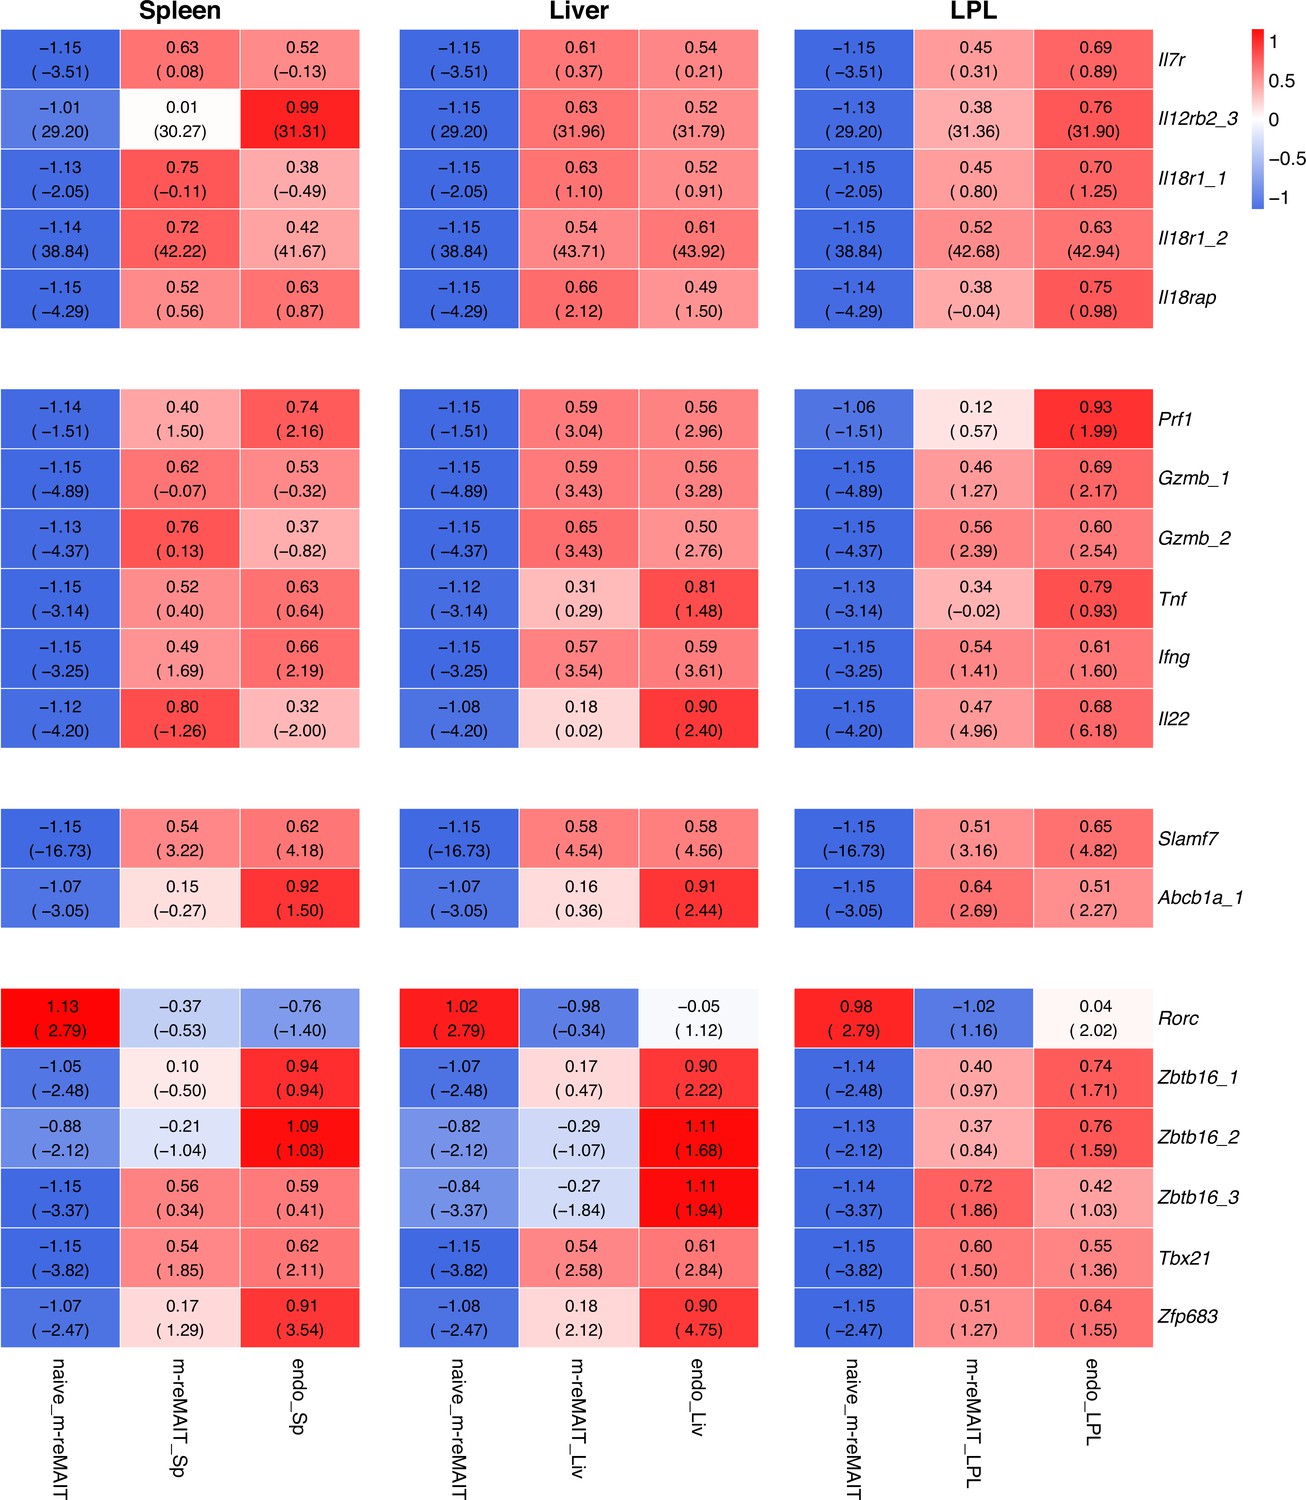
Representative transcripts relevant to mucosal-associated invariant T (MAIT) cell identity and function.
Heatmap showing the transcriptional evolution of genes relevant to MAIT cell identity and function in naïve m-reMAIT cells, m-reMAIT cells upon adoptive transfer and endogenous MAIT cells from the indicated organs. The numbers show the relative expression after scaling, and those in the brackets indicate expression level as defined log (FPKM).
-
Figure 2—figure supplement 2—source data 1
Expression of the genes relevant to mucosal-associated invariant T (MAIT) cell identity and function.
The numbers in the left columns show the expression level of the gene as defined log (FPKM), and those in the right columns indicate the scaled expression level. p-Value was calculated with TTC. The ratio between groups exhibiting the most different expression level among the three cell types is shown.
- https://cdn.elifesciences.org/articles/70848/elife-70848-fig2-figsupp2-data1-v1.xlsx
Figure 2—figure supplement 3
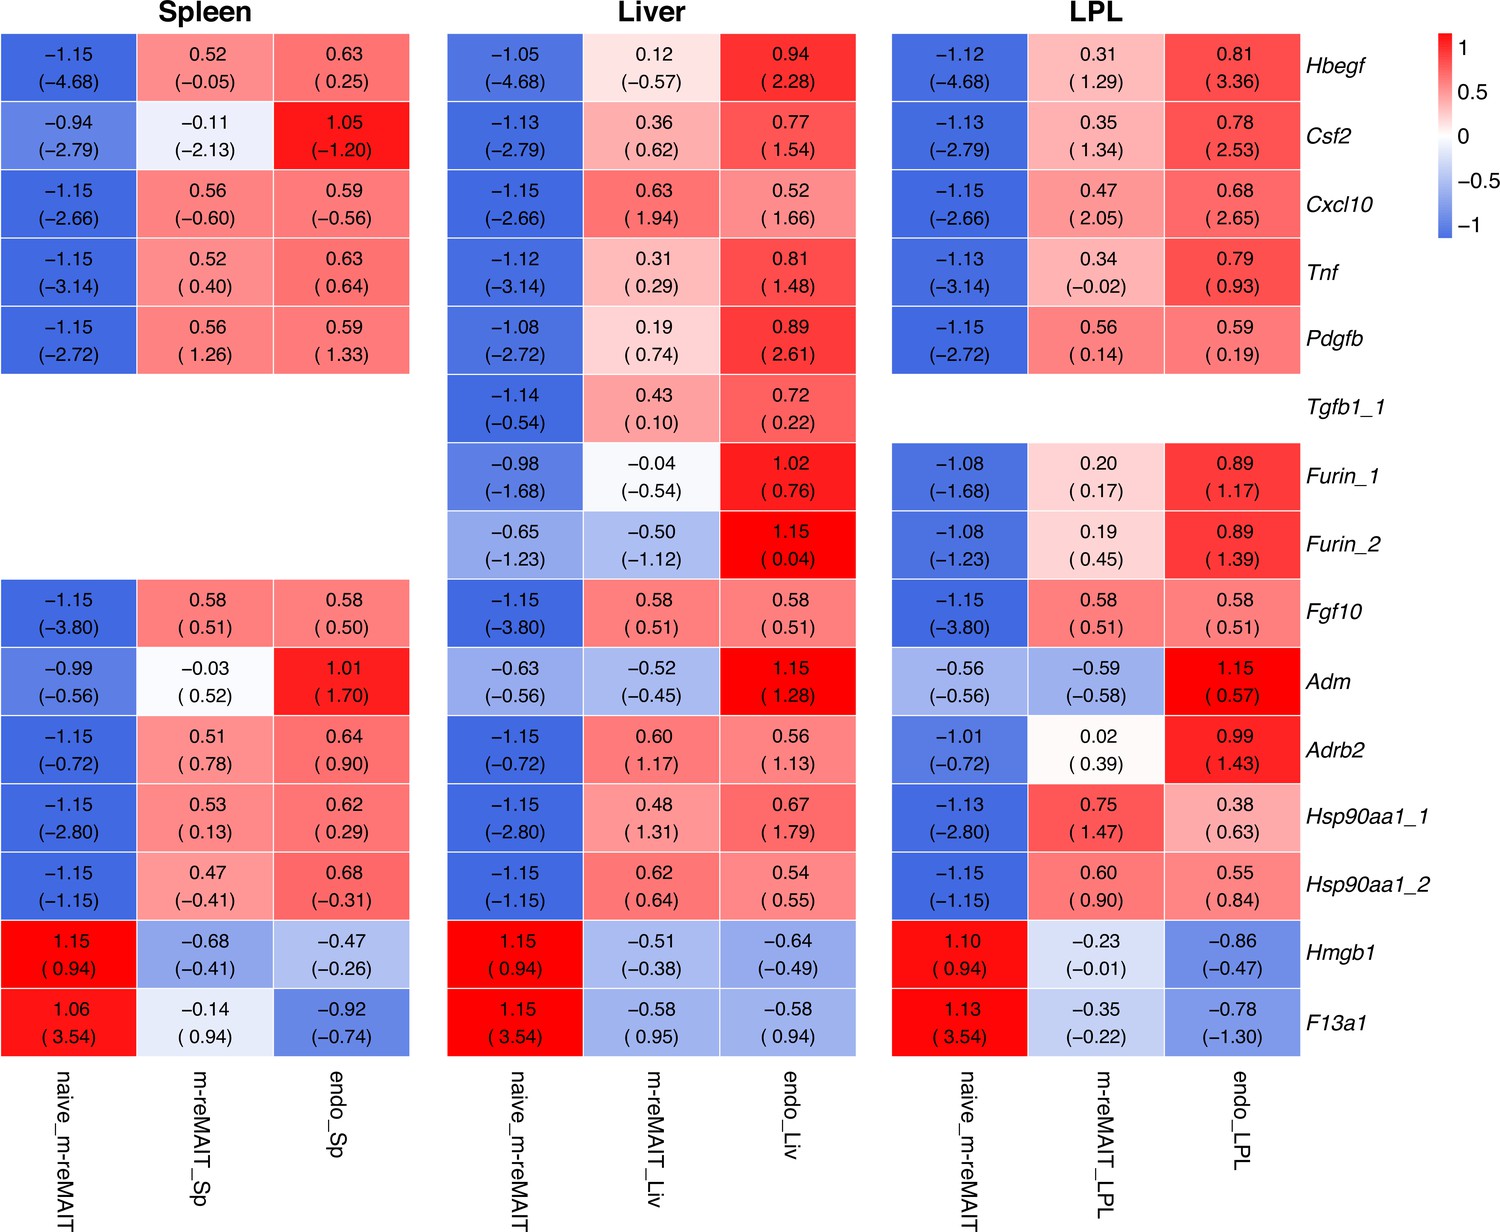
Transcripts relevant to tissue repairing.
Same as Figure 2—figure supplement 2 except that the transcripts relevant to tissue repairing are shown.
-
Figure 2—figure supplement 3—source data 1
Expression of the genes relevant to tissue repairing.
The numbers in the left columns show the expression level of the gene as defined log (FPKM), and those in the right columns indicate the scaled expression level. p-Value was calculated with TTC. The ratio between groups exhibiting the most different expression level among the three cell types is shown.
- https://cdn.elifesciences.org/articles/70848/elife-70848-fig2-figsupp3-data1-v1.xlsx
Figure 2—figure supplement 4
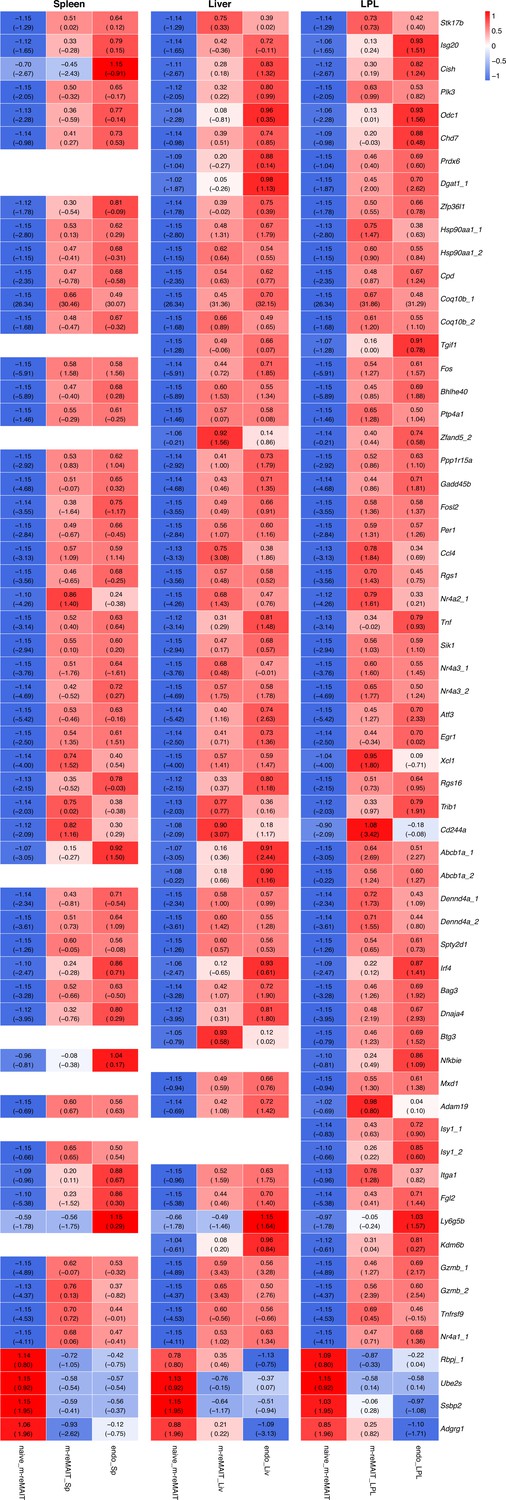
Transcripts relevant to tissue residency.
Same as Figure 2—figure supplement 2 except that the transcripts relevant to tissue residency are shown.
-
Figure 2—figure supplement 4—source data 1
Expression of the genes relevant to tissue residency.
The numbers in the left columns show the expression level of the gene as defined log (FPKM), and those in the right columns indicate the scaled expression level. p-Value was calculated with TTC. The ratio between groups exhibiting the most different expression level among the three cell types is shown.
- https://cdn.elifesciences.org/articles/70848/elife-70848-fig2-figsupp4-data1-v1.xlsx
Figure 2—figure supplement 5
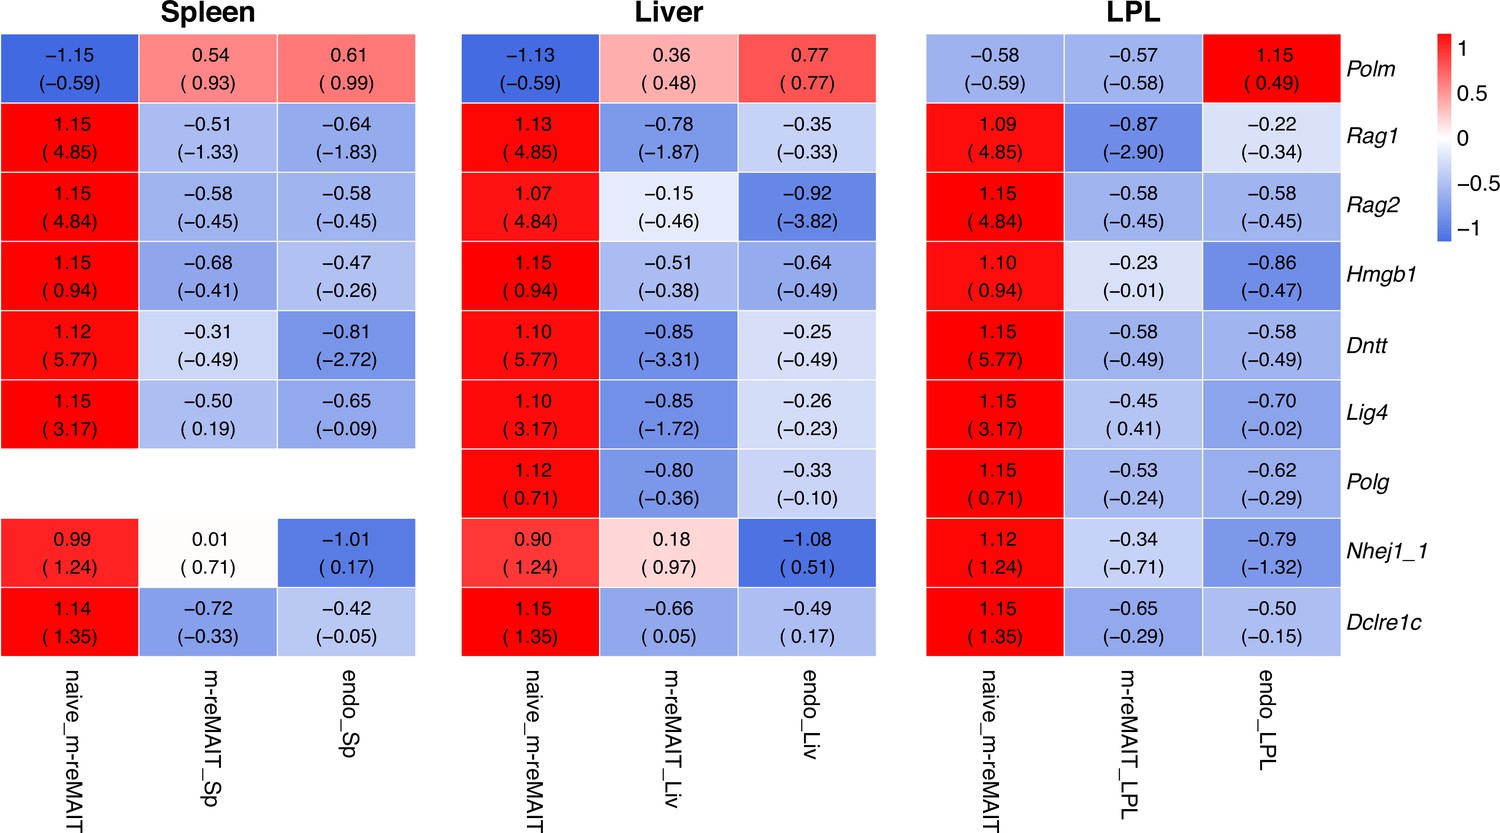
Transcripts relevant to V-D-J recombination.
Same as Figure 2—figure supplement 2 except that the transcripts relevant to V-D-J recombination are shown.
-
Figure 2—figure supplement 5—source data 1
Expression of the genes relevant to V-D-J recombination.
The numbers in the left columns show the expression level of the gene as defined log (FPKM), and those in the right columns indicate the scaled expression level. p-Value was calculated with TTC. The ratio between groups exhibiting the most different expression level among the three cell types is shown.
- https://cdn.elifesciences.org/articles/70848/elife-70848-fig2-figsupp5-data1-v1.xlsx
Figure 3 with 1 supplement
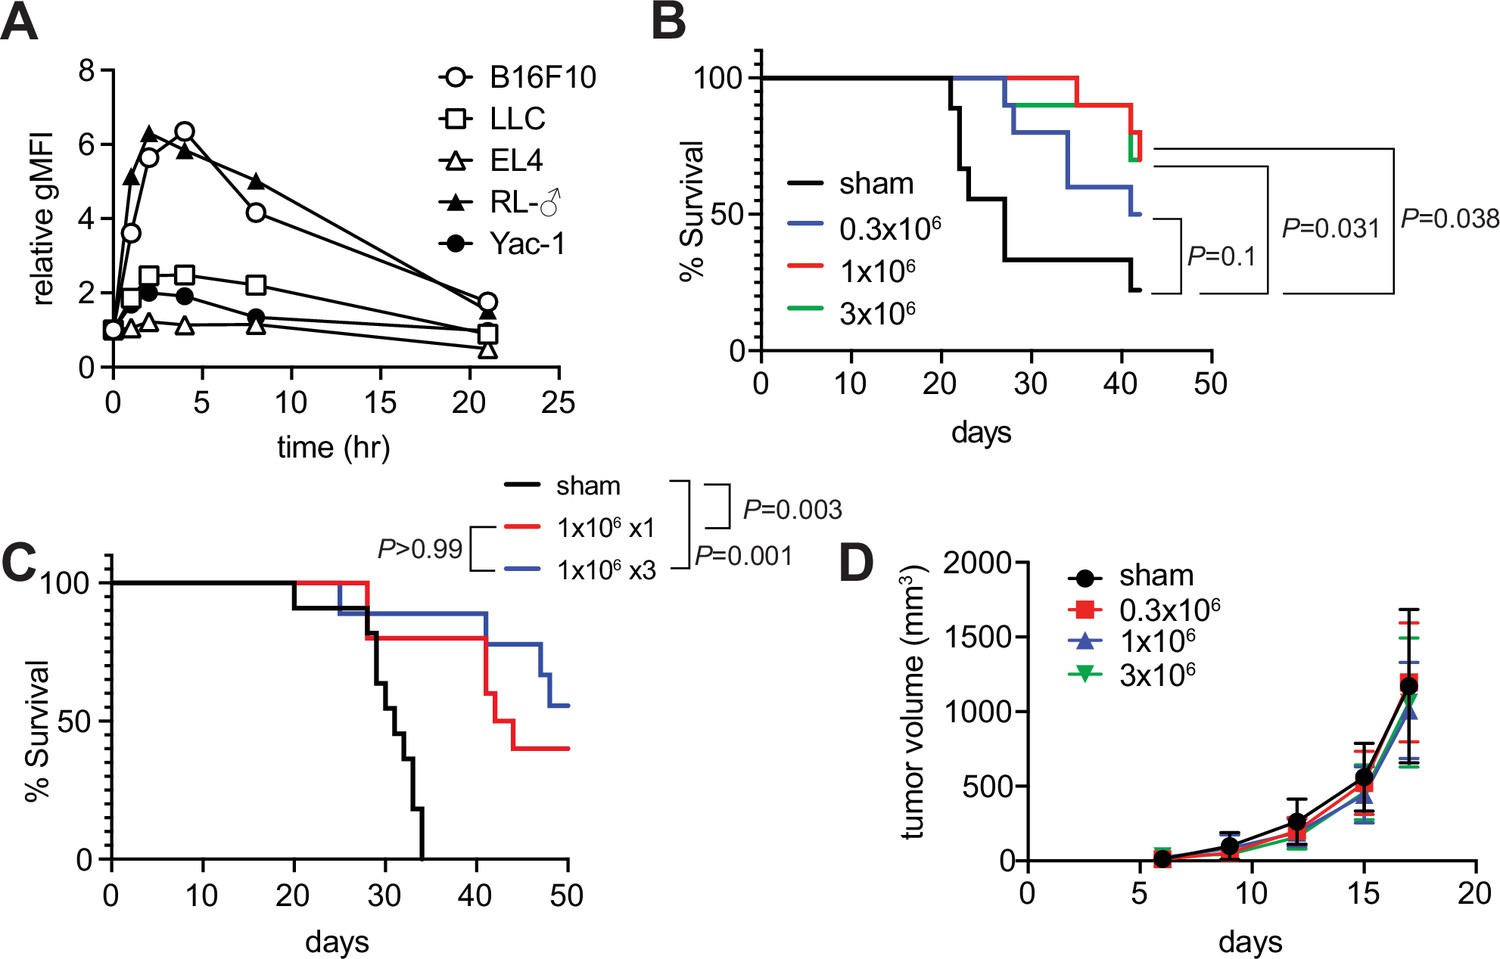
Tumor inhibitory activity of m-reMAIT cells.
(A) Time course of 5-(2-oxopropylideneamino)-6-D-ribitylaminouracil (5-OP-RU)-dependent MR1 expression. The indicated cancer cell lines were challenged with 5-OP-RU. MR1 expression levels on the cell surface at the indicated time point are shown as relative geometric mean fluorescent intensity (gMFI). Data are representative of three independent experiments. (B) m-reMAIT cell dose-dependent survival extension. C57BL/6 mice received the indicated amounts of m-reMAIT cells 6 days prior to the Lewis lung carcinoma (LLC) inoculation (3 × 10⁵ cells/mouse i.v.), and survival was monitored (n = 10–12/group). Data are representative of three independent experiments. p-Values between the indicated group are shown (the log-rank test). (C) Effects of the multiple transfers of m-reMAIT cells on survival. The survival of C57BL/6 mice that received m-reMAIT cells (1 × 10⁶ /mouse, i.p.) 6 days prior to the LLC inoculation (3 × 10⁵ cells/mouse, i.v.), and of mice that received LLC and two more consecutive transfers of m-reMAIT cells (1 × 10⁶/transfer/mouse) was monitored (n = 10–12/group). Sham-treated mice that only received LLC served as a control. Data are representative of two independent experiments. p-Values between the indicated groups are shown (the log-rank test). (D) Effects of m-reMAIT cells on in situ tumor growth. Growth curve of LLC. LLC (3 × 10⁵ /mouse) was subcutaneously inoculated into the right flank of C57BL/6 mice 6 days after the m-reMAIT cell transfer (i.p.). Tumor size was plotted with time. Sham treated (●), 0.3 × 10⁶ transferred (■), 1.0 × 10⁶ transferred (▲), and 3.0 × 10⁶ m-reMAIT cells transferred (▼). Data are shown as SEM (5–6 mice per group).
-
Figure 3—source data 1
Time-dependent MR1 expression in various cancer cell lines upon 5-(2-oxopropylideneamino)-6-D-ribitylaminouracil (5-OP-RU) challenge.
(A), m-reMAIT cell dose-dependent mouse survival (B). Effects of the multiple transfers of m-reMAIT cells on mouse survival (C). Effects of m-reMAIT cell dose on in situ tumor growth (D).
- https://cdn.elifesciences.org/articles/70848/elife-70848-fig3-data1-v1.xlsx
Figure 3—figure supplement 1
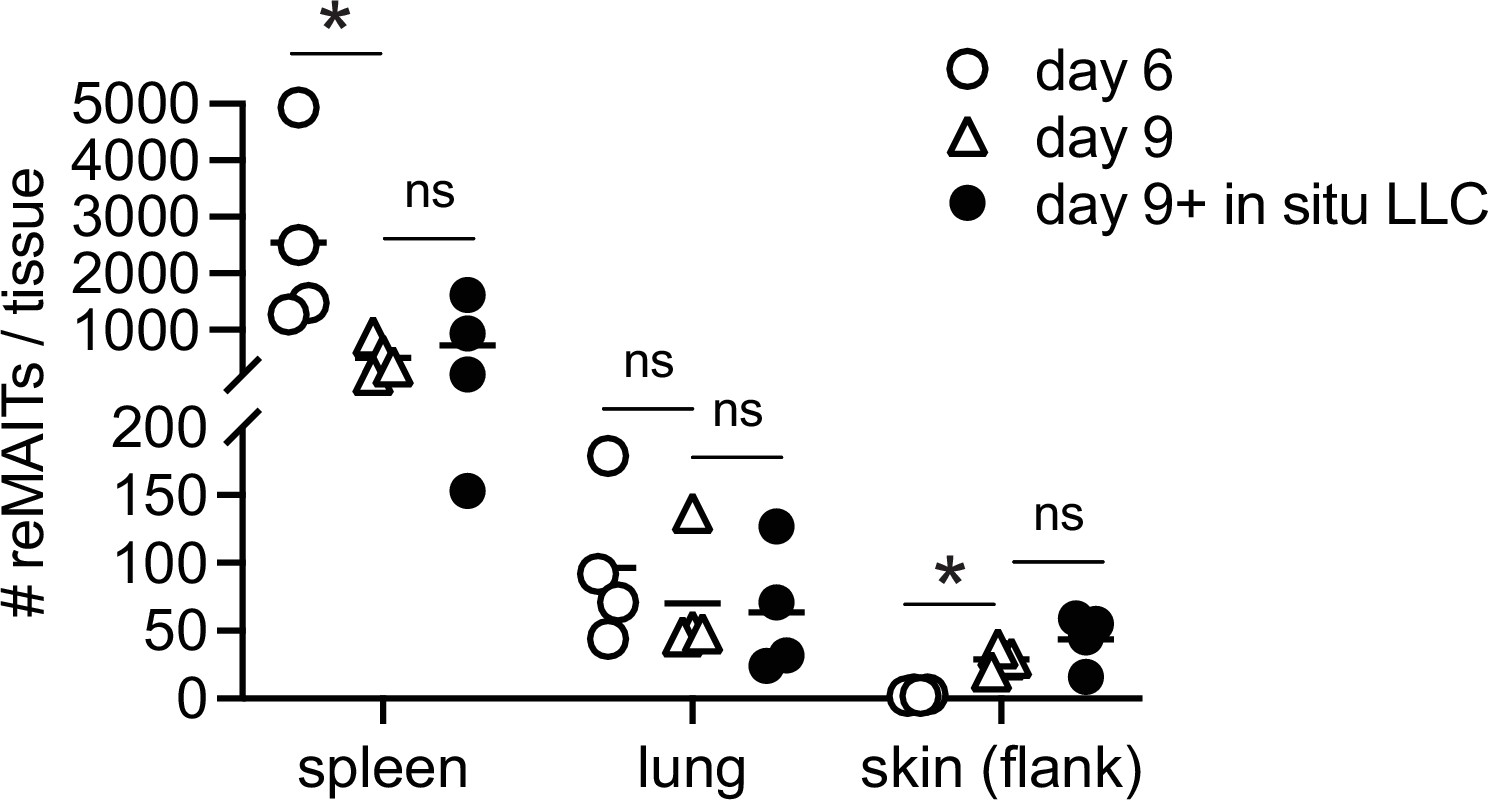
m-reMAIT cells in the skin.
The number of m-reMAIT cells from the indicated tissues upon adoptive transfer in the recipient is shown. Tissue samples were prepared at the indicated time point with or without subcutaneous Lewis lung carcinoma (LLC) injection (n = 3–4). MAIT: mucosal-associated invariant T cell.
-
Figure 3—figure supplement 1—source data 1
Delayed emergence of m-reMAIT cells in the skin upon adoptive transfer.
- https://cdn.elifesciences.org/articles/70848/elife-70848-fig3-figsupp1-data1-v1.xlsx
Figure 4
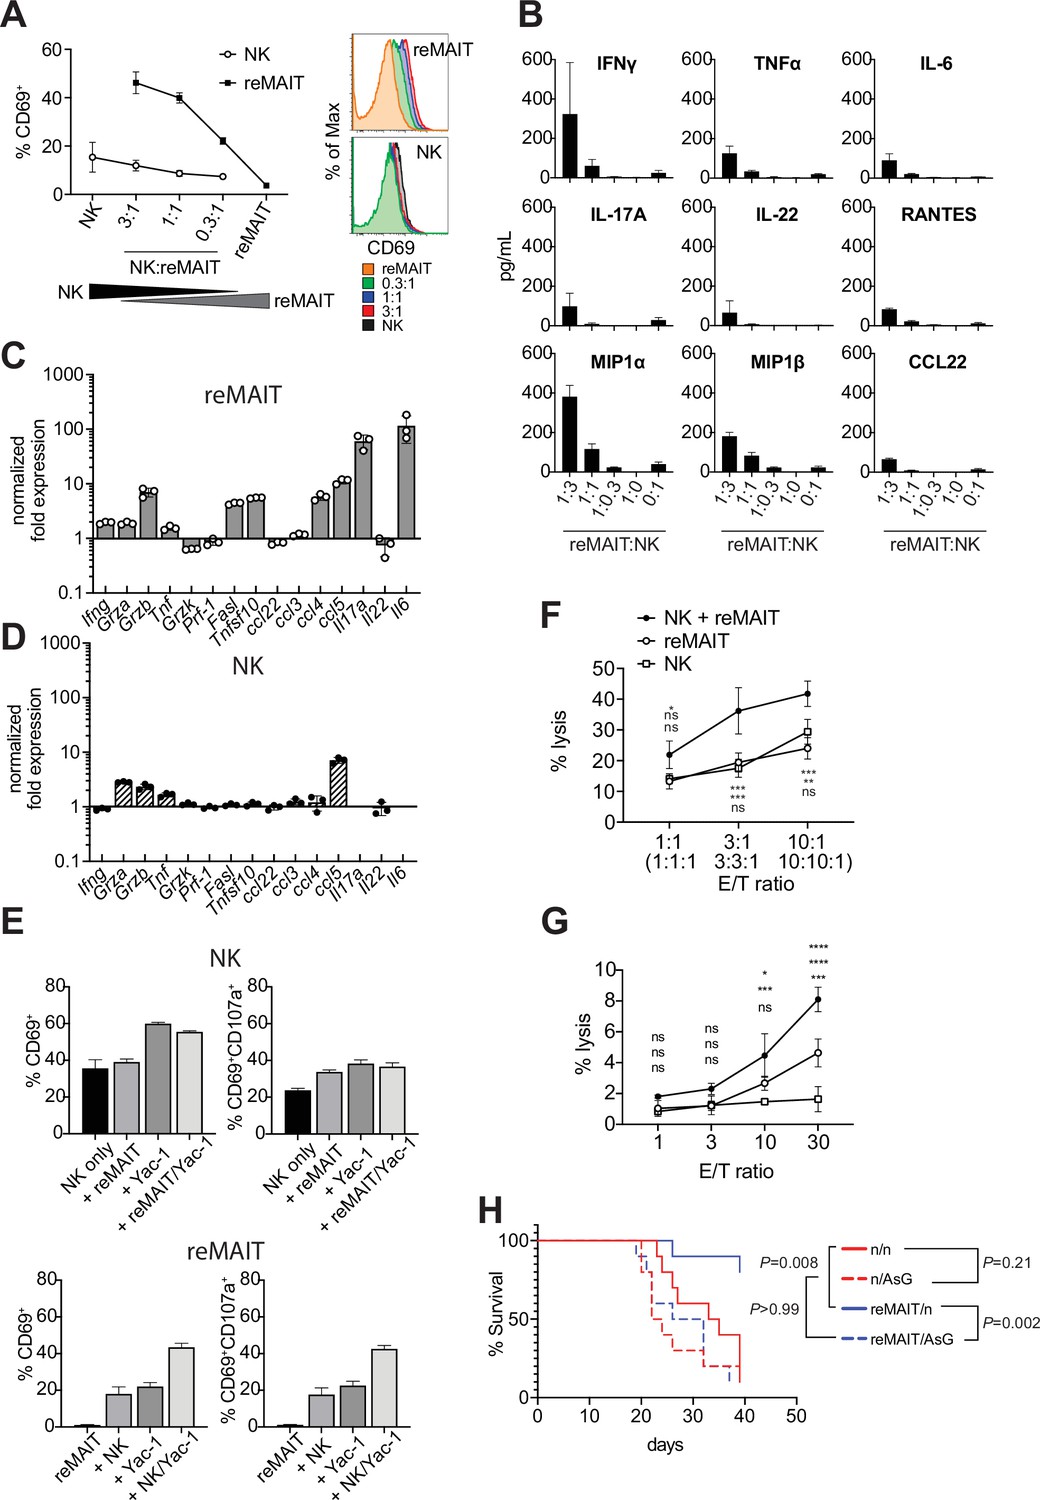
Antitumor activity of m-reMAIT cells bolstered by NK cells.
(A) Activation of m-reMAIT cells by NK cells. CD69 expression in m-reMAIT cells (reMAIT ●) and NK cells (NK ◯) upon incubation at the indicated ratio. The percentage of cells expressing CD69 (left panel) and the intensity of CD69 in each cell population (right panel) are shown. (B) Cytokines and chemokines upon a coculture. Cytokines and chemokines released upon a coculture of m-reMAIT cells and NK cells at the indicated ratio are shown (reMAIT:NK). Amounts were quantified with LegendPlex. Representative data from two independent experiments are shown. (C) Transcripts relevant to cytolytic activity in m-reMAIT cells. Ifng, Gzma, Gzmb, Tbf, Gzmk, Pfr1, Fasl, Tnfsf10, Il6, Il17a, Il22, Ccl3, Ccl4, Ccl5, and Ccl22 in m-reMAIT cells cultured with NK cells were quantified with qRT-PCR. m-reMAIT cells and NK cells were sort-purified after the coculture (purity >98%) or cultured individually. The expression of each transcript was normalized with Gapdh, and fold changes in the relative expression of the transcript in m-reMAIT cells cultured with NK cells relative to that in m-reMAIT cells cultured alone are shown. Data are representative of three independent experiments. (D) Transcripts relevant to cytolytic activity in NK cells. Fold changes in the relative expression of the indicated transcript as described in (C) in NK cells cultured with m-reMAIT cells relative to that in NK cells alone are shown. Representative data from three independent experiments are shown. (E) Activation and degranulation of NK cells and m-reMAIT cells. The expression of CD69, an activation marker, and CD107a, a marker for the exocytosis of cytolytic granules, was assessed under various culture conditions. The percentages of CD69+ cells and CD69+CD107a+ cells among NK cells alone (control), NK cells cocultured with m-reMAIT cells (+reMAIT), NK cells cultured with Yac-1 (+Yac-1), and NK cells cocultured with m-reMAIT cells and Yac-1 (+reMAIT/Yac-1) (upper panels). The percentages of CD69+ cells and CD69+CD107a+ cells among m-reMAIT cells alone (control), m-reMAIT cells cocultured with NK cells (+NK), m-reMAIT cells cocultured with Yac-1 (+Yac-1), and m-reMAIT cells cocultured with NK cells and Yac-1 (+NK/Yac-1) (lower panels). Data are representative of three independent experiments. (F) Cytolytic activity against Yac-1. Cytolytic activity of m-reMAIT cells (reMAIT ◯), NK cells (NK □), and NK cells plus m-reMAIT cells (NK+reMAIT ●). Cytolytic activities (% lysis) at different effector (NK cells, m-reMAIT cells, and NK cell+m-reMAIT cells)/Target (Yac-1) (E/T) ratios are shown. Representative data from three experiments are shown. The significance of differences between the groups at the indicated E/T ratio assessed with a two-way ANOVA is shown (*p<0.05, **p<0.01, ***p<0.005). From the top, NK+reMAIT vs. reMAIT, NK+reMAIT vs. NK, and reMAIT vs. NK. Data are representative of three independent experiments. (G) Cytolytic activity against Lewis lung carcinoma (LLC). The cytolytic activities of m-reMAIT cells (◯), NK cells (□), and m-reMAIT cells plus NK cells (●) against LLC at the indicated E/T ratio are shown as % lysis. The significance of differences between the groups is calculated as in (E). Data are representative of three independent experiments. (H) NK cell-dependent extension of survival. C57BL/6 mice were divided into two groups, one that received 1 × 10⁶ m-reMAIT cells (reMAIT) and another that was left untreated (n). Each group was further divided into two subgroups, one that received consecutive injections of anti-Asialo GM1 (AsG) (–1 and 16 days, 50 μg/mouse) after the LLC inoculation (3 × 10⁵ i.v.) and another that was left untreated (n). Survival was monitored thereafter. Representative data from two independent experiments are shown (n = 10–14/group). p-Values between the indicated groups are shown (the log-rank test).
-
Figure 4—source data 1
Antitumor activity of m-reMAIT cells bolstered by NK cells.
Activation of m-reMAIT cells by NK cells (A). Cytokines and chemokines produced upon a coculture (B). Transcripts relevant to cytolytic activity in m-reMAIT cells (C). Transcripts relevant to cytolytic activity in NK cells (D). Activation and degranulation of NK cells and m-reMAIT cells (E). Cytolytic activity against Yac-1 (F). Cytolytic activity against LLC (G). NK cell-dependent extension of survival (H).
- https://cdn.elifesciences.org/articles/70848/elife-70848-fig4-data1-v1.xlsx
Tables
Table 1
T-cell receptor β (TCRβ) repertoires of the mouse mucosal-associated invariant T (MAIT) cell-derived induced pluripotent stem cells (iPSCs).
| iPS clones | Congenic strain | Vβ | D | Jβ | V-D-J junction | CDR3 | |||||
|---|---|---|---|---|---|---|---|---|---|---|---|
| V region end | V-D junction | D region | D-J junction | J region start | Nucleotide sequence | Translation | |||||
| L3-1 | Ly5.2 | TRBV13-3*01 | TRBD1*01 | TRBJ2-3*01 | TGATG | CTA | GGGACAGGG | GTGCA | GCCAGCAGTGATGCTAGGGACAGGGGTGCAGAAACGCTGTAT | ASSDARDRGAETLY | |
| L7-1 | TRBV13-3*01 | TRBD1*01 | TRBJ1-2*01 | AGTGA | CAGGG | A | AAACT | GCCAGCAGTGACAGGGAAAACTCCGACTACACC | ASSDRENSDYT | ||
| L11-1 | TRBV19*01, *03 | TRBD2*01 | TRBJ2-3*01 | GCAGT | GGGACTGGGGGG | T | AGTGC | GCCAGCAGTGGACTGGGGGGTAGTGCAGAAACGCTGTAT | ASSGLGGSAETLY | ||
| L15-1 | TRBV13-3*01 | TRBD1*01 | TRBJ1-6*01 | AGCAG | CA | GACAGGG | CTATA | GCCAGCAGCAGACAGGGCTATAATTCGCCCCTCTAC | ASSRQGYNSPLY | ||
| L19-1 | TRBV19*01, *03 | TRBD2*01 | TRBJ2-3*01 | GCAGT | GGGACTGGGGGG | T | AGTGC | GCCAGCAGTGGACTGGGGGGTAGTGCAGAAACGCTGTAT | ASSGLGGSAETLY | ||
Appendix 1—key resources table
| Reagent type (species) or resource | Designation | Source or reference | Identifiers | Additional information |
|---|---|---|---|---|
| Strain, strain background (Mus musculus) | C57BL/6NJcl | Clea Japan | ||
| Strain, strain background (M. musculus) | C57BL/6-Ly5.1 | Riken Bioresource Center | RRID:IMSR_RBRC00144 | |
| Strain, strain background (Sendai virus) | Sendai virus KOSM302L | Dr. Mahito Nakanishi (TOKIWA-Bio Inc) | ||
| Cell line (M. musculus) | L3-1, L7-1 to -8, L11-1 to -4, L15-1 to -3, L19-1 to -6 | This study | Murine MAIT cell-derived iPSCs | |
| Cell line (M. musculus) | Mouse embryonic fibroblast (MEF) | Oriental Yeast | Cat# KBL9284600 | |
| Cell line (M. musculus) | OP9 -DLL1 cell | Dr. Hiroshi Kawamoto (Kyoto University) | ||
| Cell line (M. musculus) | B16F10 cell | Dr. Tsukasa Seya (Hokkaido University) | RRID:CVCL_0159 | |
| Cell line (M. musculus) | Lewis lung carcinoma (LLC) | Riken Bioresource Center | Cat# RCB0558; RRID:CVCL_4358 | |
| Cell line (M. musculus) | EL4 | Riken Bioresource Center | Cat# RCB1641; RRID:CVCL_0255 | |
| Cell line (M. musculus) | RL-♂1 (Gloria) | Riken Bioresource Center | Cat# RCB2784; RRID:CVCL_C832 | |
| Cell line (M. musculus) | Yac-1 | Riken Bioresource Center | Cat# RCB1165; RRID:CVCL_2244 | |
| Cell line (M. musculus) | CH27 | Dr. X. Wang (Washington University, MO) | ||
| Cell line (M. musculus) | CH27/mMR1 | Dr. X. Wang (Washington University, MO) | ||
| Cell line (M. musculus) | WT3 | Dr. X. Wang (Washington University, MO) | ||
| Cell line (M. musculus) | WT3/mMR1 | Dr. X. Wang (Washington University, MO) | ||
| Antibody | Anti-mouse CD4 (RM4-4), PerCP/Cy5.5 (rat monoclonal) | BioLegend | Cat# 116012; RRID:AB_2563023 | Flow cytometry (1:100 in 50 µl reaction) |
| Antibody | Anti-mouse CD8α (53–6.7), APC/Cy7 (rat monoclonal) | BioLegend | Cat# 100714; RRID:AB_312753 | Flow cytometry (1:100 in 50 µl reaction) |
| Antibody | Anti-mouse CD25 (PC61), APC (rat monoclonal) | BioLegend | Cat# 102012; RRID:AB_312861 | Flow cytometry (1:100 in 50 µl reaction) |
| Antibody | Anti-mouse CD25 (PC61), BV421 (rat monoclonal) | BioLegend | Cat# 102043; RRID:AB_2562611 | Flow cytometry (1:100 in 50 µl reaction) |
| Antibody | Anti-mouse CD25 (PC61), BV711 (rat monoclonal) | BD Biosciences | Cat# 740652; RRID:AB_2740341 | Flow cytometry (1:100 in 50 µl reaction) |
| Antibody | Anti-mouse CD25 (PC61), PE (rat monoclonal) | BioLegend | Cat# 102007; RRID:AB_312856 | Flow cytometry (1:100 in 50 µl reaction) |
| Antibody | Anti-mouse/human CD44 (IM7), FITC (rat monoclonal) | BioLegend | Cat# 103006; RRID:AB_312957 | Flow cytometry (1:100 in 50 µl reaction) |
| Antibody | Anti-mouse CD45.1 (Ly5.1) (A20), BV605 (mouse monoclonal) | BioLegend | Cat# 110738; RRID:AB_2562565 | Flow cytometry (1:100 in 50 µl reaction) |
| Antibody | Anti-mouse CD45.2 (Ly5.2) (104), PE (mouse monoclonal) | BioLegend | Cat# 109807; RRID:AB_313444 | Flow cytometry (1:100 in 50 µl reaction) |
| Antibody | Anti-mouse/human CD45R/B220 (RA3-6B2), BV421 (rat monoclonal) | BioLegend | Cat# 103239; RRID:AB_10933424 | Flow cytometry (1:100 in 50 µl reaction) |
| Antibody | Anti-mouse/human CD45R/B220 (RA3-6B2), PE (rat monoclonal) | BioLegend | Cat# 103207; RRID:AB_312992 | Flow cytometry (1:100 in 50 µl reaction) |
| Antibody | Anti-mouse CD49b (DX5), PE (rat monoclonal) | BioLegend | Cat# 108907; RRID:AB_313414 | Flow cytometry (1:100 in 50 µl reaction) |
| Antibody | Anti-mouse CD69 (H1.2F3), APC/Cy7 (Armenian hamster monoclonal) | BioLegend | Cat# 104525; RRID:AB_10683447 | Flow cytometry (1:100 in 50 µl reaction) |
| Antibody | Anti-mouse CD69 (H1.2F3), PE (Armenian hamster monoclonal) | BD Biosciences | Cat# 553237; RRID:AB_394726 | Flow cytometry (1:100 in 50 µl reaction) |
| Antibody | Anti-mouse CD69 (H1.2F3), PE/Cy7 (Armenian hamster monoclonal) | BioLegend | Cat# 104511; RRID:AB_493565 | Flow cytometry (1:100 in 50 µl reaction) |
| Antibody | Anti-mouse CD107a (1D4B), BV421 (rat monoclonal) | BioLegend | Cat# 121618; RRID:AB_2749905 | Flow cytometry (1:100 in 50 µl reaction) |
| Antibody | Anti-mouse CD127 (IL-7Rα) (A7R34), PerCP/Cy5.5 (rat monoclonal) | BioLegend | Cat# 135021; RRID:AB_1937274 | Flow cytometry (1:100 in 50 µl reaction) |
| Antibody | Anti-mouse CD186 (CXCR6) (SAO51D1), PE (rat monoclonal) | BioLegend | Cat# 151103; RRID:AB_2566545 | Flow cytometry (1:100 in 50 µl reaction) |
| Antibody | Anti-mouse CD218a (IL-18Rα) (P3TUNYA), eFluor450 (rat monoclonal) | Thermo Fisher Scientific | Cat# 48-5183-80; RRID:AB_2574068 | Flow cytometry (1:100 in 50 µl reaction) |
| Antibody | Anti-mouse CD218a (IL-18Rα) (REA947), PE (mouse monoclonal) | Miltenyi Biotech | Cat# 130-115-704; RRID:AB_2727158 | Flow cytometry (1:100 in 50 µl reaction) |
| Antibody | Anti-mouse F4/80 (BΜ8), BV421 (rat monoclonal) | BioLegend | Cat# 123131; RRID:AB_10901171 | Flow cytometry (1:100 in 50 µl reaction) |
| Antibody | Anti-mouse F4/80 (BΜ8), PE (rat monoclonal) | BioLegend | Cat# 123109; RRID:AB_893498 | Flow cytometry (1:100 in 50 µl reaction) |
| Antibody | Anti-human/mouse/rat MR1 (26.5), APC (mouse monoclonal) | BioLegend | Cat# 361107; RRID:AB_2563193 | Flow cytometry (1:100 in 50 µl reaction) |
| Antibody | Anti-mouse NK1.1 (PK136), BV510 (mouse monoclonal) | BD Biosciences | Cat# 563096; RRID:AB_2738002 | Flow cytometry (1:100 in 50 µl reaction) |
| Antibody | Anti-mouse NK1.1 (PK136), FITC (mouse monoclonal) | BioLegend | Cat# 108706; RRID:AB_313393 | Flow cytometry (1:100 in 50 µl reaction) |
| Antibody | Anti-mouse PLZF (9E12), PE (Armenian hamster monoclonal) | BioLegend | Cat# 145803; RRID:AB_2561966 | Flow cytometry (1:100 in 50 µl reaction) |
| Antibody | Anti-mouse RORγt (Q31-378), BV421 (mouse monoclonal) | BD Biosciences | Cat# 562894; RRID:AB_2687545 | Flow cytometry (1:100 in 50 µl reaction) |
| Antibody | Anti-mouse TCR Vβ6 (RR4-7), PE (mouse monoclonal) | BioLegend | Cat# 140003; RRID:AB_10640727 | Flow cytometry (1:100 in 50 µl reaction) |
| Antibody | Anti-mouse TCR Vβ8.1, 8.2 (MR5-2), PE (mouse monoclonal) | BioLegend | Cat# 140103; RRID:AB_10641144 | Flow cytometry (1:100 in 50 µl reaction) |
| Antibody | Anti-mouse TCRβ (H57-597), BV605 (Armenian hamster monoclonal) | BioLegend | Cat# 109241; RRID:AB_2629563 | Flow cytometry (1:100 in 50 µl reaction) |
| Antibody | Anti-mouse TCRβ (H57-597), PE/Cy7 (Armenian hamster monoclonal) | BioLegend | Cat# 109222; RRID:AB_893625 | Flow cytometry (1:100 in 50 µl reaction) |
| Antibody | Anti-human/mouse/rat MR1 (26.5), purified (mouse monoclonal) | BioLegend | Cat# 361110; RRID:AB_2801000 | Blocking assay (10 µg/ml) |
| Antibody | Mouse IgG2a, k isotype control (MOPC-173), purified (mouse monoclonal) | BioLegend | Cat# 400264; RRID:AB_11148947 | Blocking assay (10 µg/ml) |
| Antibody | Anti-human/mouse/rat β-actin (2F1-1), purified (mouse monoclonal) | BioLegend | Cat# 643802; RRID:AB_2223199 | Western blotting (1:2000 in 5 ml reaction) |
| Antibody | Anti-human/mouse LAT (11B.12), purified (mouse monoclonal) | Santa Cruz | Cat# sc-53550; RRID:AB_784283 | Western blotting (1:1000 in 5 ml reaction) |
| Antibody | Anti-phosphotyrosine (PY99), purified (mouse monoclonal) | Santa Cruz | Cat# sc-7020; RRID:AB_628123 | Western blotting (1:1000 in 5 ml reaction) |
| Antibody | Anti-mouse/rat Asialo GM1 (rabbit polyclonal) | FUJIFILM Wako | Cat# 014-09801 | In vivo NK depletion (50 µg/mouse) |
| Sequence-based reagent | ADV19 | This study | PCR primer (detection of rearranged TCRVα19-Jα33) | 5′-TCAACTGCACAT ACAGCACCTC-3′ |
| Sequence-based reagent | AJ33 | This study | PCR primer (detection of rearranged TCRVα19-Jα33) | 5′-CATGCATTATTCA GCCAGTGCCTTCT-3′ |
| Sequence-based reagent | TRAV19-F | This study | PCR primer (Southern blot probe synthesis) | 5′-CCTGGACCACATG GAAGCATGGC-3′ |
| Sequence-based reagent | TRAV19-R | This study | PCR primer (Southern blot probe synthesis) | 5′-CCCAGAGCC CCAGATCAAC-3′ |
| Sequence-based reagent | TRBV13 | This study | PCR primer (identification of TCRβ repertoire) | 5′-GTACTGGTAT CGGCAGGAC-3′ |
| Sequence-based reagent | TRBV19 | This study | PCR primer (identification of TCRβ repertoire) | 5′-GGTACCGAC AGGATTCAG-3′ |
| Sequence-based reagent | TRBC-Rev | This study | PCR primer (identification of TCRβ repertoire) | 5′-GGGTAGCCT TTTGTTTGTTTG-3′ |
| Sequence-based reagent | Gapdh-F | This study | PCR primer (semi-quantitative PCR) | 5′-CATCACTGCCAC CCAGAAGACTG-3′ |
| Sequence-based reagent | Gapdh-R | This study | PCR primer (semi-quantitative PCR) | 5′-ATGCCAGTGAGC TTCCCGTTCAG-3′ |
| Sequence-based reagent | Tnf-F | This study | PCR primer (semi-quantitative PCR) | 5′-CCACCACGC TCTTCTGTCTAC-3′ |
| Sequence-based reagent | Tnf-R | This study | PCR primer (semi-quantitative PCR) | 5′-AGGGTCTGG GCCATAGAACT-3′ |
| Sequence-based reagent | Ifng-F | This study | PCR primer (semi-quantitative PCR) | 5′-AAAGAGATAAT CTGGCTCTGC-3′ |
| Sequence-based reagent | Ifng-R | This study | PCR primer (semi-quantitative PCR) | 5′-GCTCTGAGAC AATGAACGCT-3′ |
| Sequence-based reagent | Grza-F | This study | PCR primer (semi-quantitative PCR) | 5′-GGTGGAAAG GACTCCTGCAA-3′ |
| Sequence-based reagent | Grza-R | This study | PCR primer (semi-quantitative PCR) | 5′-GCCTCGCAA AATACCATCACA-3′ |
| Sequence-based reagent | Grzb-F | This study | PCR primer (semi-quantitative PCR) | 5′-ACTCTTGACG CTGGGACCTA-3′ |
| Sequence-based reagent | Grzb-R | This study | PCR primer (semi-quantitative PCR) | 5'-AGTGGGGCT TGACTTCATGT-3′ |
| Sequence-based reagent | Grzk-F | This study | PCR primer (semi-quantitative PCR) | 5′-AAGCTTCGCACT GCTGCAGAACT-3′ |
| Sequence-based reagent | Grzk-R | This study | PCR primer (semi-quantitative PCR) | 5′-TAACAGATCTGG CTTGGTGGTTCC-3′ |
| Sequence-based reagent | Prf1-F | This study | PCR primer (semi-quantitative PCR) | 5'-CTCTCGAAGTG TTGGATACAG-3′ |
| Sequence-based reagent | Prf1-R | This study | PCR primer (semi-quantitative PCR) | 5'-GACACAAACGTG ATTCAAATCC-3' |
| Sequence-based reagent | Fasl-F | This study | PCR primer (semi-quantitative PCR) | 5′-GAAGGAACTGGC AGAACTCCGT-3′ |
| Sequence-based reagent | Fasl-R | This study | PCR primer (semi-quantitative PCR) | 5′-GCCACACTCCT CGGCTCTTTTT-3′ |
| Sequence-based reagent | Tnfsf10-F | This study | PCR primer (semi-quantitative PCR) | 5′-GGAAGACCTCAG AAAGTGGCAG-3′ |
| Sequence-based reagent | Tnfsf10-R | This study | PCR primer (semi-quantitative PCR) | 5′-TTTCCGAGAG GACTCCCAGGAT-3′ |
| Sequence-based reagent | Il6-F | This study | PCR primer (semi-quantitative PCR) | 5′-TACCACTTCACA AGTCGGAGGC-3′ |
| Sequence-based reagent | Il6-R | This study | PCR primer (semi-quantitative PCR) | 5′-CTGCAAGTGCAT CATCGTTGTTC-3′ |
| Sequence-based reagent | Il17a-F | This study | PCR primer (semi-quantitative PCR) | 5′-CAGACTACCTC AACCGTTCCAC-3′ |
| Sequence-based reagent | Il17a-R | This study | PCR primer (semi-quantitative PCR) | 5′-TCCAGCTTTCC CTCCGCATTGA-3′ |
| Sequence-based reagent | Il22-F | This study | PCR primer (semi-quantitative PCR) | 5′-GCTTGAGGTGT CCAACTTCCAG-3′ |
| Sequence-based reagent | Il22-R | This study | PCR primer (semi-quantitative PCR) | 5′-ACTCCTCGGAA CAGTTTCTCCC-3′ |
| Sequence-based reagent | Ccl5-F | This study | PCR primer (semi-quantitative PCR) | 5′-CCTGCTGCTTT GCCTACCTCTC-3′ |
| Sequence-based reagent | Ccl5-R | This study | PCR primer (semi-quantitative PCR) | 5′-ACACACTTGGC GGTTCCTTCGA-3′ |
| Sequence-based reagent | Ccl3-F | This study | PCR primer (semi-quantitative PCR) | 5′-ACTGCCTGCTGC TTCTCCTACA-3′ |
| Sequence-based reagent | Ccl3-R | This study | PCR primer (semi-quantitative PCR) | 5′-ATGACACCTGGC TGGGAGCAAA-3′ |
| Sequence-based reagent | Ccl4-F | This study | PCR primer (semi-quantitative PCR) | 5′-ACCCTCCCACT TCCTGCTGTTT-3′ |
| Sequence-based reagent | Ccl4-R | This study | PCR primer (semi-quantitative PCR) | 5′-CTGTCTGCCTC TTTTGGTCAGG-3′ |
| Sequence-based reagent | Ccl22-F | This study | PCR primer (semi-quantitative PCR) | 5′-GTGGAAGACAG TATCTGCTGCC-3′ |
| Sequence-based reagent | Ccl22-R | This study | PCR primer (semi-quantitative PCR) | 5′-AGGCTTGCGGC AGGATTTTGAG-3′ |
| Peptide, recombinant protein | Mouse MR1 5-OP-RU tetramer, APC-labeled | NIH Tetramer Core Facility | Flow cytometry (1:1,000 in 50 µl reaction) | |
| Peptide, recombinant protein | Mouse MR1 5-OP-RU tetramer, BV421-labeled | NIH Tetramer Core Facility | Flow cytometry (1:1,000 in 50 µl reaction) | |
| Peptide, recombinant protein | Mouse MR1 5-OP-RU tetramer, unlabeled | NIH Tetramer Core Facility | MAIT cell stimulation (1:100 to 1:100,000 in 100 µl reaction) | |
| Peptide, recombinant protein | Mouse MR1 6-FP tetramer, APC-labeled | NIH Tetramer Core Facility | Flow cytometry (1:1,000 in 50 µl reaction) | |
| Peptide, recombinant protein | Mouse MR1 6-FP tetramer, BV421-labeled | NIH Tetramer Core Facility | Flow cytometry (1:1,000 in 50 µl reaction) | |
| Peptide, recombinant protein | Mouse MR1 6-FP tetramer, unlabeled | NIH Tetramer Core Facility | MAIT cell stimulation (1:100 to 1:100,000 in 100 µl reaction) | |
| Commercial assay or kit | LEGENDPlex mouse Th cytokine panel | BioLegend | Cat# 740741 | |
| Commercial assay or kit | LEGENDPlex mouse cytokine panel 2 | BioLegend | Cat# 740134 | |
| Commercial assay or kit | LEGENDPlex mouse proinflammatory chemokine panel | BioLegend | Cat# 740451 | |
| Commercial assay or kit | MojoSort mouse NK cell isolation kit | BioLegend | Cat# 480050 | |
| Commercial assay or kit | Vybrant CFDA SE cell tracer kit | Thermo Fisher Scientific | Cat# V12883 | |
| Commercial assay or kit | Zombie Violet Flexible Viability kit | BioLegend | Cat# 423113 | |
| Chemical compound, drug | 5-Amino-4-D-ribitylaminouracil Dihydrochloride | Toronto Research Chemicals | Cat# A629245 | |
| Software, algorithm | FlowJo software v9 and v10 | BD Biosciences | RRID:SCR_008520 | |
| Software, algorithm | Prism 9 for macOS | GraphPad Software | RRID:SCR_002798 |
Additional files
Download links
A two-part list of links to download the article, or parts of the article, in various formats.
Downloads (link to download the article as PDF)
Open citations (links to open the citations from this article in various online reference manager services)
Cite this article (links to download the citations from this article in formats compatible with various reference manager tools)
Reprogramming and redifferentiation of mucosal-associated invariant T cells reveal tumor inhibitory activity
eLife 11:e70848.
https://doi.org/10.7554/eLife.70848


