Serum RNAs can predict lung cancer up to 10 years prior to diagnosis
- Department of Research, Cancer Registry of Norway, Norway
- Department of Epidemiology and Biostatistics, Imperial College London, United Kingdom
- Department of Oncology, Oslo University Hospital, Norway
- Institute for Cancer Research, Oslo University Hospital, Norway
- Institute of Clinical Medicine, University of Oslo, Norway
- Department of Medical Genetics, Oslo University Hospital and University of Oslo, Norway
- Centre for Fertility and Health, Norwegian Institute of Public Health, Norway
- Department of Informatics, University of Oslo, Norway
Figures
Figure 1

Consort diagram of the study and our model training and testing workflow.
(A) The sample selection is summarized by the flow chart. Non-smokers were excluded from model building. (B) We randomly created five different training and testing datasets for each group (e.g. standard, histology-specific, or prediagnostic models).
Figure 2 with 2 supplements
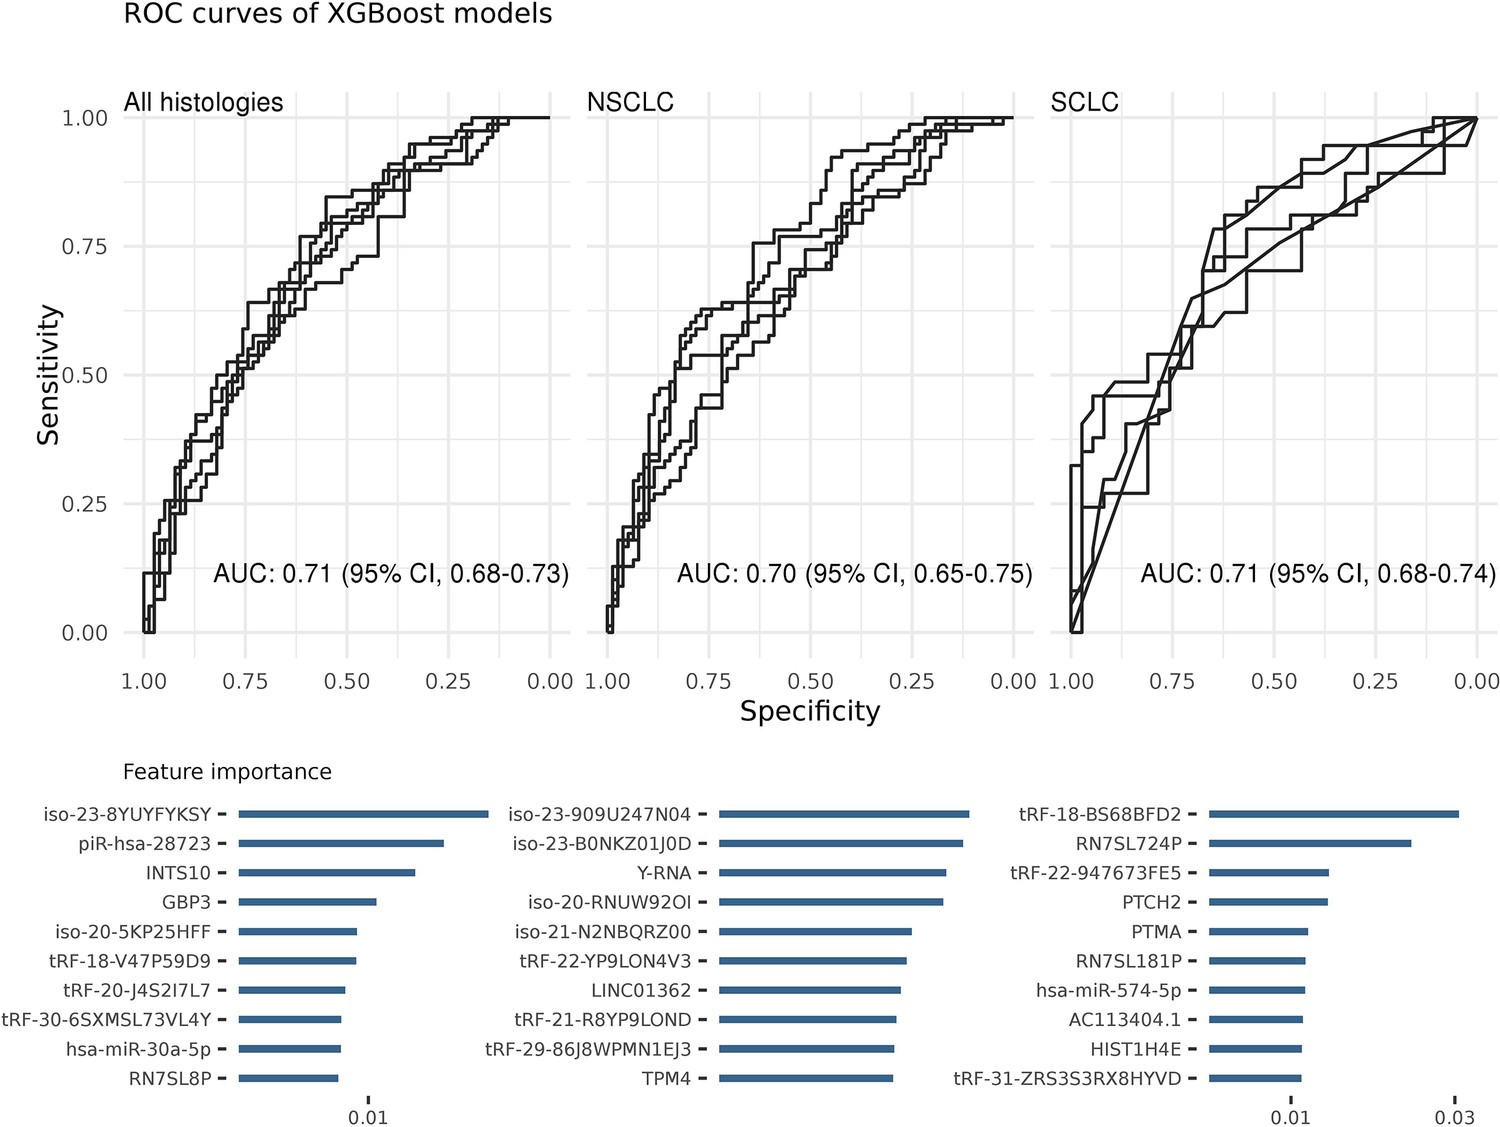
Each ROC curve is based on the prediction results of a randomly created testing dataset (in total five).
Area under the ROC curve (AUC) values show the average of these predictions. The most important features of the classifiers were sorted on their average feature importance and are shown in the lower panels. A detailed list of biomarkers with their feature importance is available in supplementary (Supplementary file 2). We did not perform any feature selection while training these models (see also Figure 2—source data 1).
-
Figure 2—source data 1
Source data of XGBoost ROC plots for Figure 2.
- https://cdn.elifesciences.org/articles/71035/elife-71035-fig2-data1-v2.xlsx
Figure 2—figure supplement 1
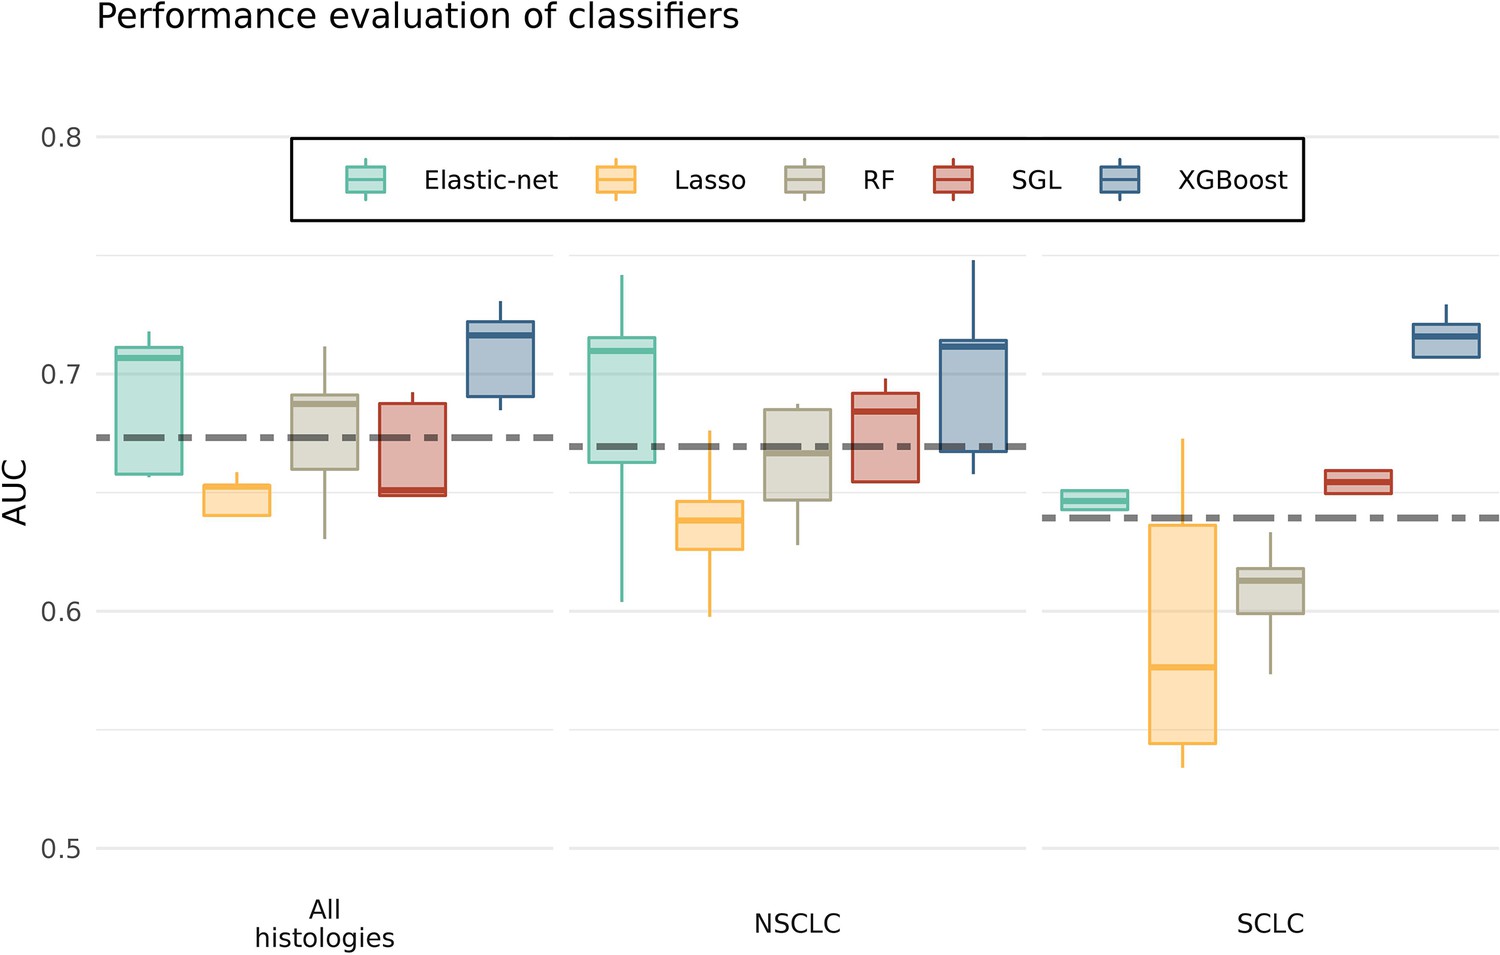
Each boxplot shows performances of an algorithm measured by area under the ROC curves (AUCs).
The analyses were done for all histologies and histology-specific (i.e. separately for non-small cell lung cancer [NSCLC] and small-cell LC [SCLC]), regardless of prediagnostic time. The dashed lines represent the combined average performances of all tested algorithms. XGBoost produced an above average prediction performance (Figure 2—figure supplement 1—source data 1).
-
Figure 2—figure supplement 1—source data 1
Source data of boxplots for Figure 2—figure supplement 1.
- https://cdn.elifesciences.org/articles/71035/elife-71035-fig2-figsupp1-data1-v2.xlsx
Figure 2—figure supplement 2
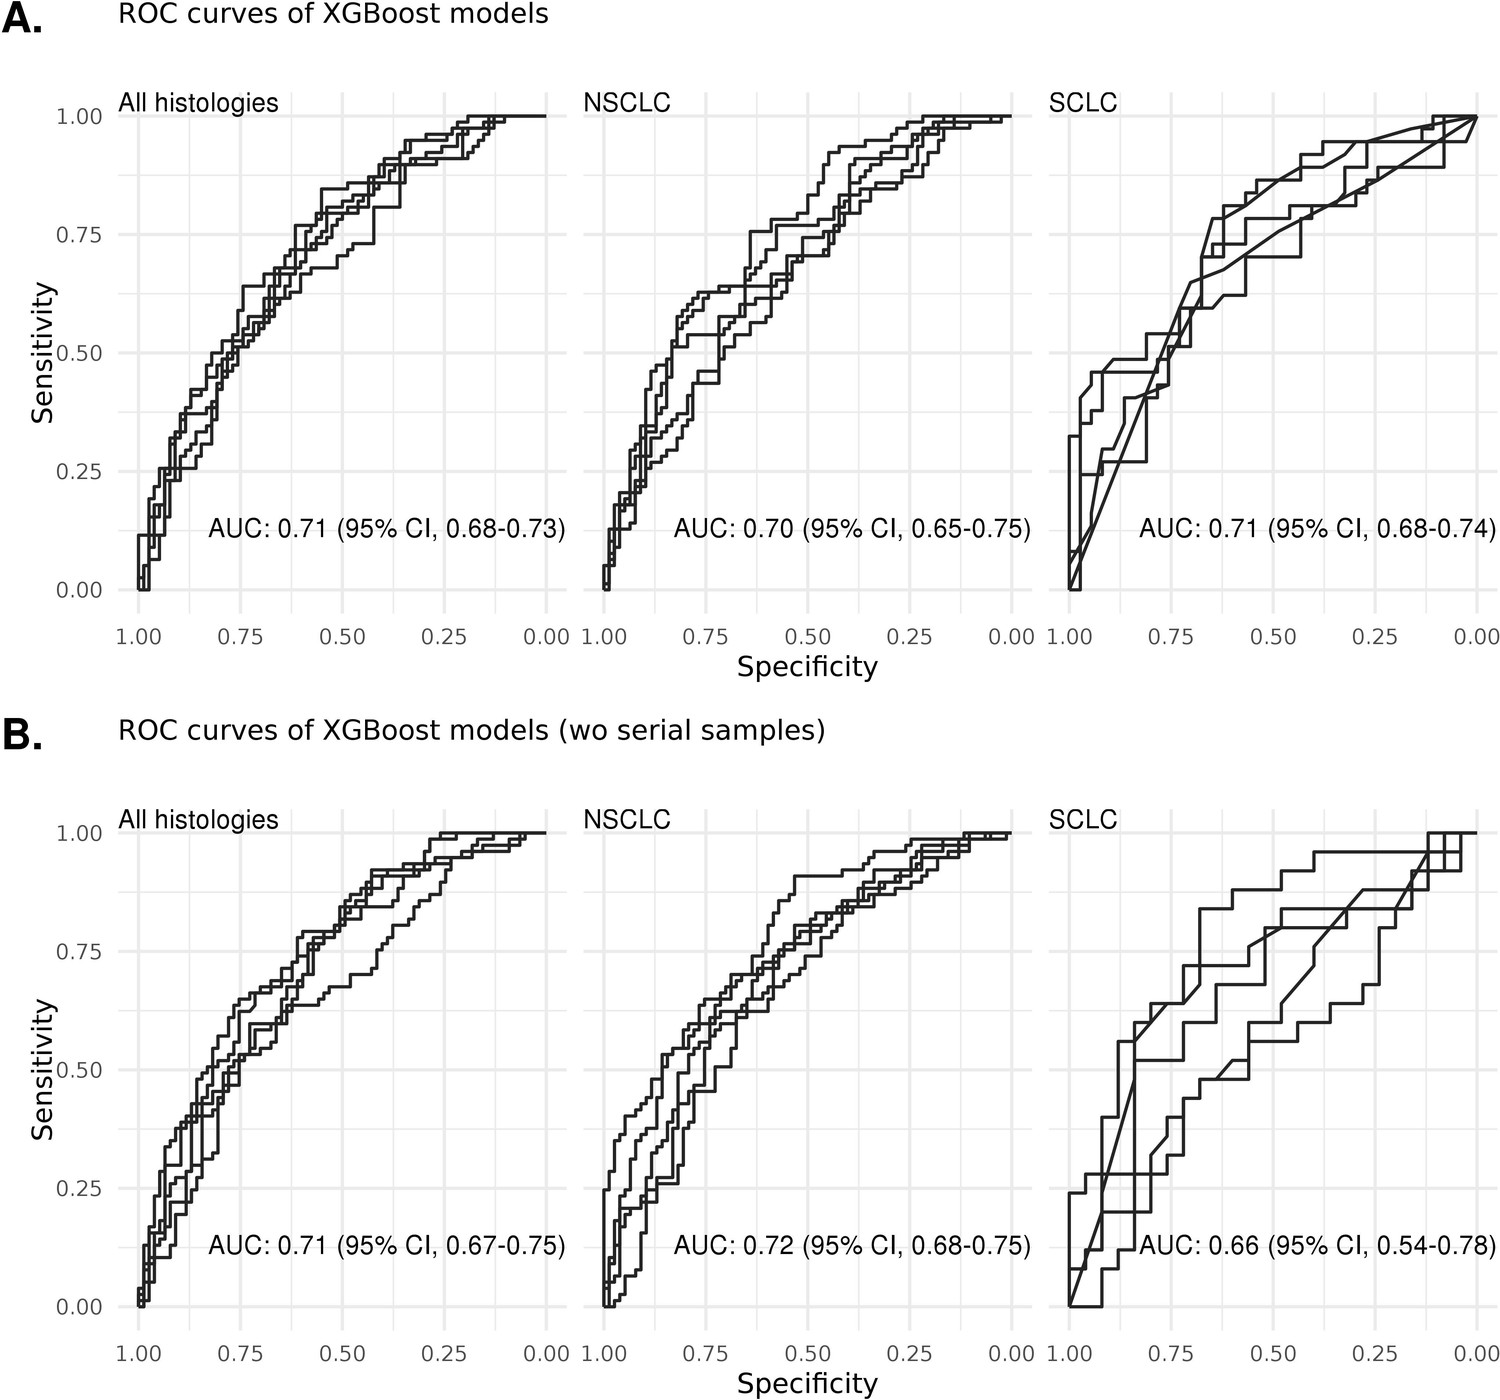
ROC curves of various types of models with/without serial samples.
(A) The performance of the XGBoost algorithm with all samples. (B) When one sample per individual was selected, the classification performance was comparable for all models (Figure 2—figure supplement 2—source data 1).
-
Figure 2—figure supplement 2—source data 1
Source data of ROC plots without multiple samples from same individuals (Figure 2—figure supplement 2).
- https://cdn.elifesciences.org/articles/71035/elife-71035-fig2-figsupp2-data1-v2.xlsx
Figure 3
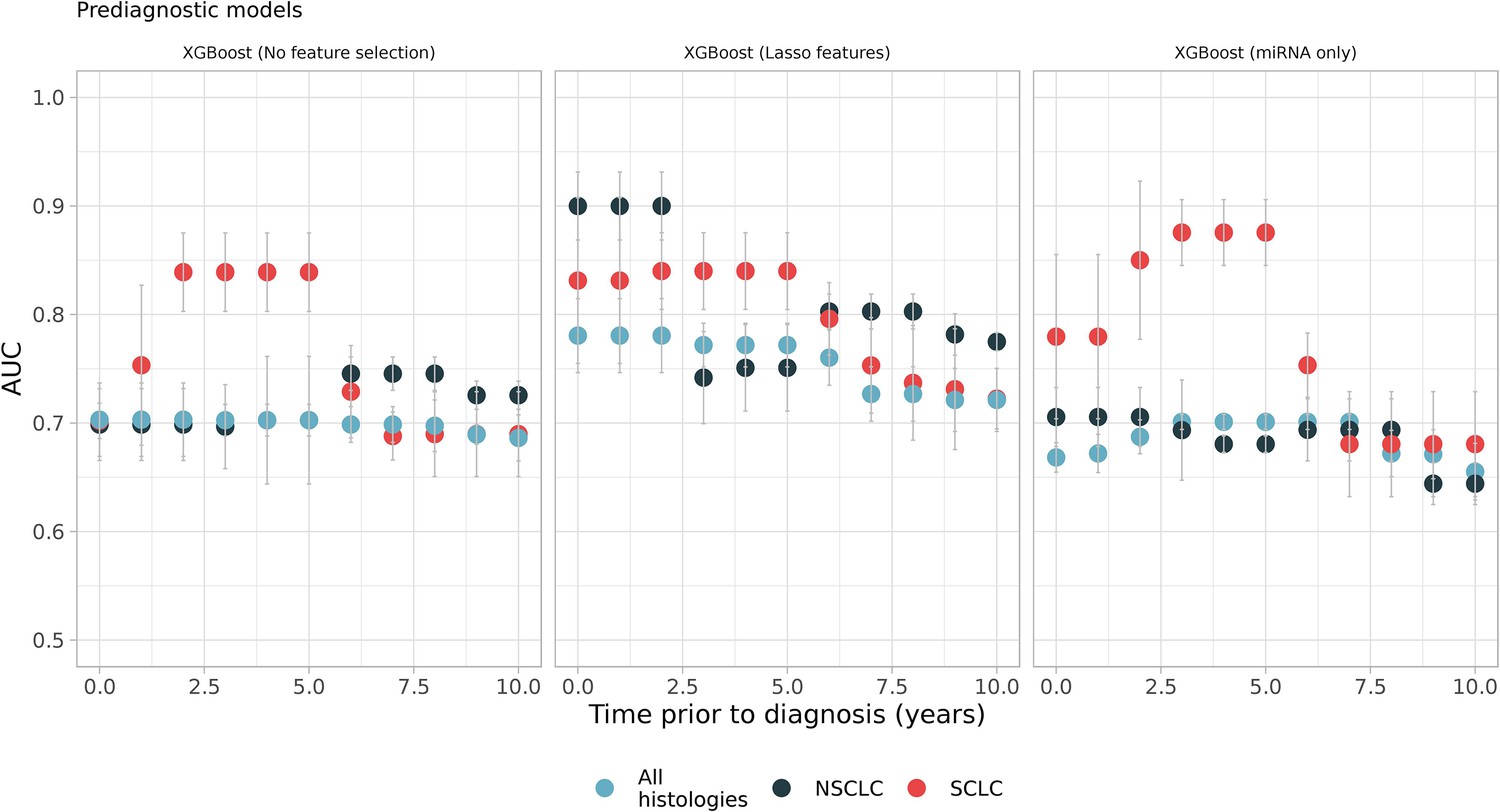
Sliding windows analysis showed better models which utilizes prediagnostic samples in specific time intervals such as small-cell lung cancer (SCLC) models, which were restricted to samples from 2 to 5 years prior to diagnosis (see the first and the second panel, red dots).
Each color represents different histologies: black and red only have non-small cell lung cancer (NSCLC) and SCLC samples respectively while blue has all histologies including others (Figure 3—source data 1).
-
Figure 3—source data 1
Source data of all the panels for Figure 3.
- https://cdn.elifesciences.org/articles/71035/elife-71035-fig3-data1-v2.xlsx
Figure 4
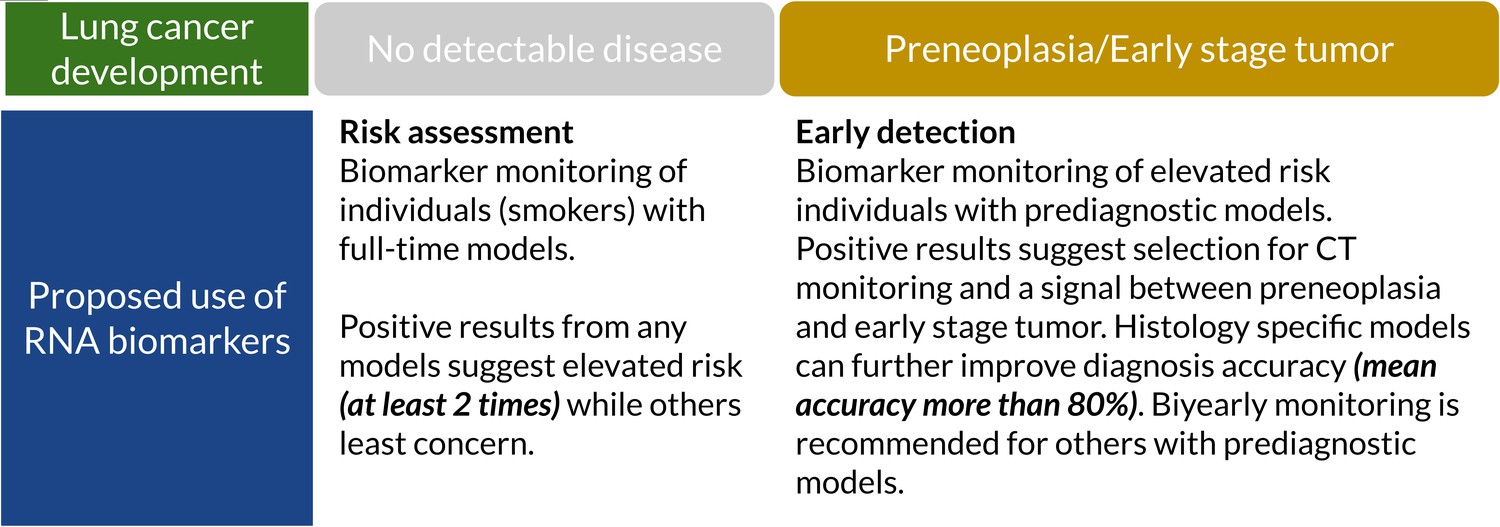
Suggested clinical uses of RNA biomarkers in lung cancer (LC) screening.
A positive test from full-time models shows elevated risk (at least two times). They can detect cancer-related RNA signals up to 10 years before diagnosis. Prediagnostic models have higher accuracy, sensitivity, and specificity which can potentially assist full-time models and improve specificity (Supplementary file 4).
-
Figure 4—source data 1
Suggested clinical uses of RNA biomarkers in lung cancer (LC) screening.
- https://cdn.elifesciences.org/articles/71035/elife-71035-fig4-data1-v2.docx
Tables
Table 1
Clinical and histological characteristics of samples used in modeling.
| Stage | |||||
|---|---|---|---|---|---|
| Early (localized) | Locally Advanced (regional) | Advanced (distant) | Unknown | Controls | |
| Histology | |||||
| NSCLC | 84 | 99 | 167 | 11 | - |
| SCLC | 9 | 35 | 76 | 4 | - |
| Others | 10 | 5 | 31 | 4 | - |
| Sex | |||||
| Male | 78 | 104 | 178 | 12 | 185 |
| Female | 25 | 35 | 96 | 7 | 78 |
| Age at donation, years | |||||
| Mean (SD) | 54.3 (7.33) | 54.9 (9.08) | 53.5 (8.25) | 51.8 (6.53) | 49.9 (10.9) |
| Age at diagnosis, years | |||||
| Mean (SD) | 59.8 (7.67) | 60.6 (8.89) | 59.4 (8.31) | 58.6 (6.05) | - |
| Prediagnostic sampling time, years | |||||
| Mean (SD) | 5.52 (2.81) | 5.63 (2.79) | 5.91 (2.66) | 6.75 (2.18) | - |
| Total samples | 103 | 139 | 274 | 19 | 263 |
| Individuals | 79 | 102 | 189 | 16 | 263 |
| Total individuals | 645 (smokers*) | ||||
-
*
See supplementary document for non-smokers (Supplementary file 1).
Table 2
Averages of area under the ROC curves (AUCs), accuracies (acc), sensitivities (sn), and specificities (sp) of the XGBoost algorithm models on test datasets when prediagnostic time was not included.
| Histologies of model | |||||||||
|---|---|---|---|---|---|---|---|---|---|
| All (including others) | NSCLC | SCLC | |||||||
| Features included: | AUC | Av. # of features* | Av. % of acc/sn/sp | AUC | Av. # of features | Av. % acc/sn/sp | AUC | Av. # of features | Av. % acc/sn/sp |
| All RNAs | 0.71 (95% CI, 0.68–0.73) | 301 | 69/73/62 | 0.70 (95% CI, 0.65–0.75) | 373 | 67/70/64 | 0.71 (95% CI, 0.68–0.74) | 213 | 70/69/71 |
| Lasso-selected features | 0.78 (95% CI, 0.74–0.82) | 149 | 73/75/71 | 0.78 (95% CI, 0.75–0.82) | 56 | 73/73/72 | 0.74 (95% CI, 0.69–0.80) | 58 | 72/61/83 |
| Univariate significant features | 0.70 (95% CI, 0.66–0.73) | 76 | 67/75/58 | 0.69 (95% CI, 0.64–0.73) | 51 | 67/71/64 | 0.70 (95% CI, 0.65–0.76) | 11 | 68/69/68 |
| miRNA only | 0.72 (95% CI, 0.68–0.76) | 168 | 69/76/61 | 0.73 (95% CI, 0.70–0.75) | 199 | 69/74/64 | 0.65 (95% CI, 0.62–0.69) | 20 | 67/74/60 |
| isomiR only | 0.70 (95% CI, 0.65–0.74) | 204 | 67/68/67 | 0.73 (95% CI, 0.69–0.77) | 215 | 71/75/66 | 0.65 (95% CI, 0.60–0.70) | 108 | 66/65/67 |
| tRF only | 0.69 (95% CI, 0.65–0.73) | 314 | 65/77/53 | 0.67 (95% CI, 0.65–0.69) | 314 | 66/64/67 | 0.68 (95% CI, 0.65–0.71) | 23 | 66/69/63 |
| MiscRNA only | 0.72 (95% CI, 0.69–0.74) | 83 | 69/73/65 | 0.68 (95% CI, 0.63–0.74) | 87 | 66/73/59 | 0.69 (95% CI, 0.64–0.75) | 76 | 70/78/61 |
-
*
Average number of non-zero features selected by the models. Note: Detailed information on all selected features are in Supplementary file 2.
Table 3
All selected features, performance, and relative risk (RR) of XGBoost models.
| Models | |||
|---|---|---|---|
| All* | NSCLC | SCLC | |
| Features | iso-20-5KP25HFFGBP3 hsa-miR-30a-5pINTS10LINC01362 piR-hsa-28723RNU1-8P iso-23-BQ8DQWM4ZCTD-3252C9.4DSTHBA2HIST2H2AC hsa-miR-99b-3pLATS1 piR-hsa-28391 piR-hsa-28394RN7SL181PRN7SL8PRNU2-27P iso-23-8YUYFYKSYTLN1 tRF-V47P59D9 tRF-86V8WPMN1EJ3 tRF-6SXMSL73VL4Y tRF-QKF1R3WE8RO8IS | LINC01362Y-RNA iso-23-B0NKZ01J0D iso-22-MKJIJLJ2Q iso-21-N2NBQRZ00GBP3 iso-20-RNUW92OIGNAS hsa-miR-30a-3pNHSL2 piR-hsa-28488RC3H2RN7SL181PRNU2-19PRNY4P27 iso-23–909 U247N04tRF-I89NJ4S2 tRF-9MV47P596VE tRF-86J8WPMN1EJ3 tRF-86V8WPMN1EJ3 tRF-Q1Q89P9L8422E | AC113404.1C6orf223HIST1H4E hsa-miR-30a-5p hsa-miR-574–5pODC1PTCH2PTMARN7SL181P tRF-22-947673FE5AKAP9MIGA1RAP1BRN7SL724PRUFY2 iso-23-X3749W540L tRF-BS68BFD2 tRF-R29P4P9L5HJVE tRF-ZRS3S3R × 8HYVD |
| Total features | 25 | 21 | 19 |
| Total test samples (total leave-out size) (non-smokers) | 640 (535) (263) | 465 (360) (262) | 444 (395) (256) |
| AUC on test (95% CI)(only smokers**) | 0.76 (0.68–0.83) | 0.78 (0.70–0.85) | 0.88 (0.83–0.94) |
| AUC on test (95% CI)(both smokers and non-smokers**) | 0.68 (0.63–0.72) | 0.68 (0.63–0.73) | 0.84 (0.79–0.9) |
| RR on test (95% CI)(only smokers**) | 2.37 (1.54–3.7) p = 1.15 × 10⁻⁷ | 2.36 (1.52–3.66) p = 2.83 × 10⁻⁶ | 2.48 (2.06–3) p = 3.32 × 10⁻⁹ |
| RR on test (95% CI)(both smokers and non-smokers**) | 1.84 (1.7–2.01) p = 1.25 × 10⁻⁶ | 1.52 (1.27–1.83) p = 2.67 × 10⁻⁵ | 2.04 (1.85–2.25) p = 8.8 × 10⁻⁸ |
-
*
Including other histologies. ** includes samples previously not used (leave-out samples).
Additional files
-
Supplementary file 1
Clinical and histological characteristics of non-smoker samples of leave-out dataset.
- https://cdn.elifesciences.org/articles/71035/elife-71035-supp1-v2.docx
-
Supplementary file 2
Detailed feature importance tables for all trained models.
- https://cdn.elifesciences.org/articles/71035/elife-71035-supp2-v2.xlsx
-
Supplementary file 3
Fixed-time model performance on different histologies.
- https://cdn.elifesciences.org/articles/71035/elife-71035-supp3-v2.docx
-
Supplementary file 4
Selected prediagnostic models, metrics, and their feature importance tables.
- https://cdn.elifesciences.org/articles/71035/elife-71035-supp4-v2.docx
-
Transparent reporting form
- https://cdn.elifesciences.org/articles/71035/elife-71035-transrepform1-v2.docx
Download links
A two-part list of links to download the article, or parts of the article, in various formats.
Downloads (link to download the article as PDF)
Open citations (links to open the citations from this article in various online reference manager services)
Cite this article (links to download the citations from this article in formats compatible with various reference manager tools)
Serum RNAs can predict lung cancer up to 10 years prior to diagnosis
eLife 11:e71035.
https://doi.org/10.7554/eLife.71035


