Efficacy of FFP3 respirators for prevention of SARS-CoV-2 infection in healthcare workers
- Cambridge University Hospitals NHS Foundation Trust, United Kingdom
- University of Cambridge Occupational Health and Safety Service, United Kingdom
- School of Clinical Medicine, United Kingdom
- Clinical Microbiology & Public Health Laboratory, Public Health England, United Kingdom
- MRC Biostatistics Unit, United Kingdom
- Department of Applied Mathematics and Theoretical Physics, United Kingdom
- MRC-University of Glasgow Centre for Virus Research, United Kingdom
- Department of Medicine, University of Cambridge, United Kingdom
- Cambridge Institute of Therapeutic Immunology and Infectious Disease (CITIID), Jeffrey Cheah Biomedical Centre, United Kingdom
- NHS Blood and Transplant, United Kingdom
- Cambridge Institute for Medical Research, United Kingdom
Figures
Figure 1 with 2 supplements
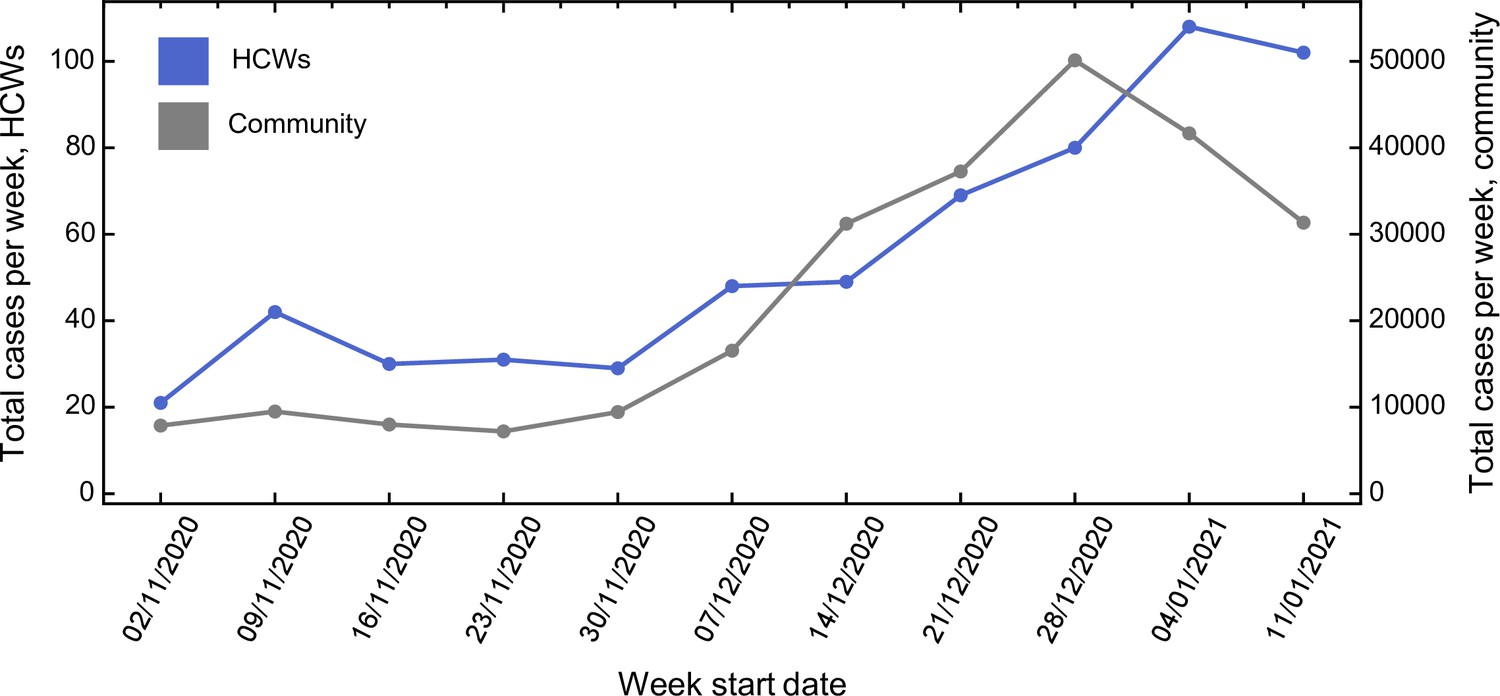
Comparison between total number of cases amongst healthcare workers (HCWs) and community incidence of severe acute respiratory syndrome coronavirus 2 (SARS-CoV-2).
Comparison between total number of cases amongst HCWs and community incidence of SARS-CoV-2. Community incidence is shown for the East of England, UK, derived from https://coronavirus.data.gov.uk/details/cases, with raw data shown in Figure 1—source data 1.
-
Figure 1—source data 1
Raw case numbers for the East of England region during the period of study.
- https://cdn.elifesciences.org/articles/71131/elife-71131-fig1-data1-v2.xlsx
Figure 1—figure supplement 1
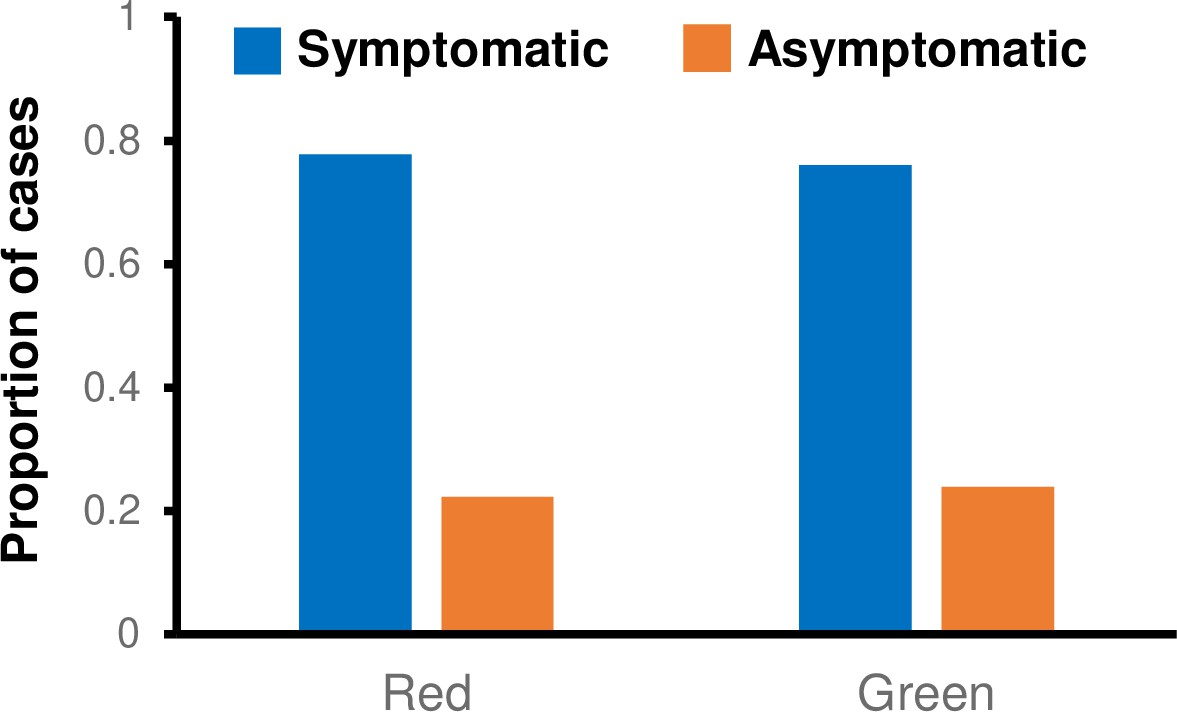
Proportion of cases ascertained by symptomatic testing and asymptomatic screening on green and red wards.
-
Figure 1—figure supplement 1—source data 1
Proportion of cases ascertained by symptomatic and asymptomatic screening on green and red wards.
- https://cdn.elifesciences.org/articles/71131/elife-71131-fig1-figsupp1-data1-v2.xlsx
Figure 1—figure supplement 2
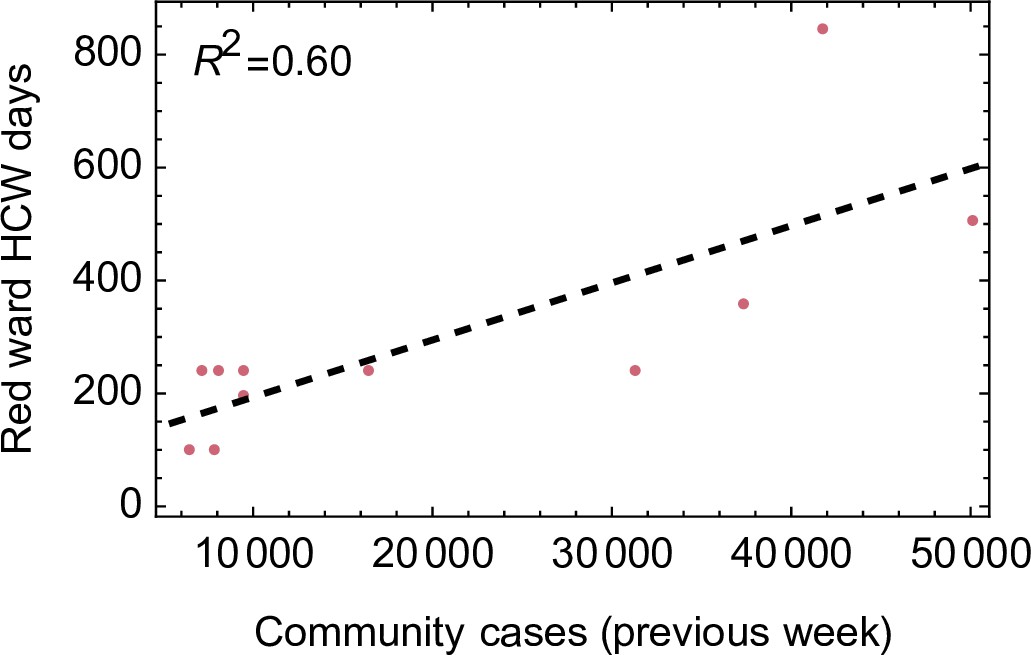
Relationship between number of healthcare worker (HCW) days per week worked on red wards and community incidence.
Figure 2 with 1 supplement
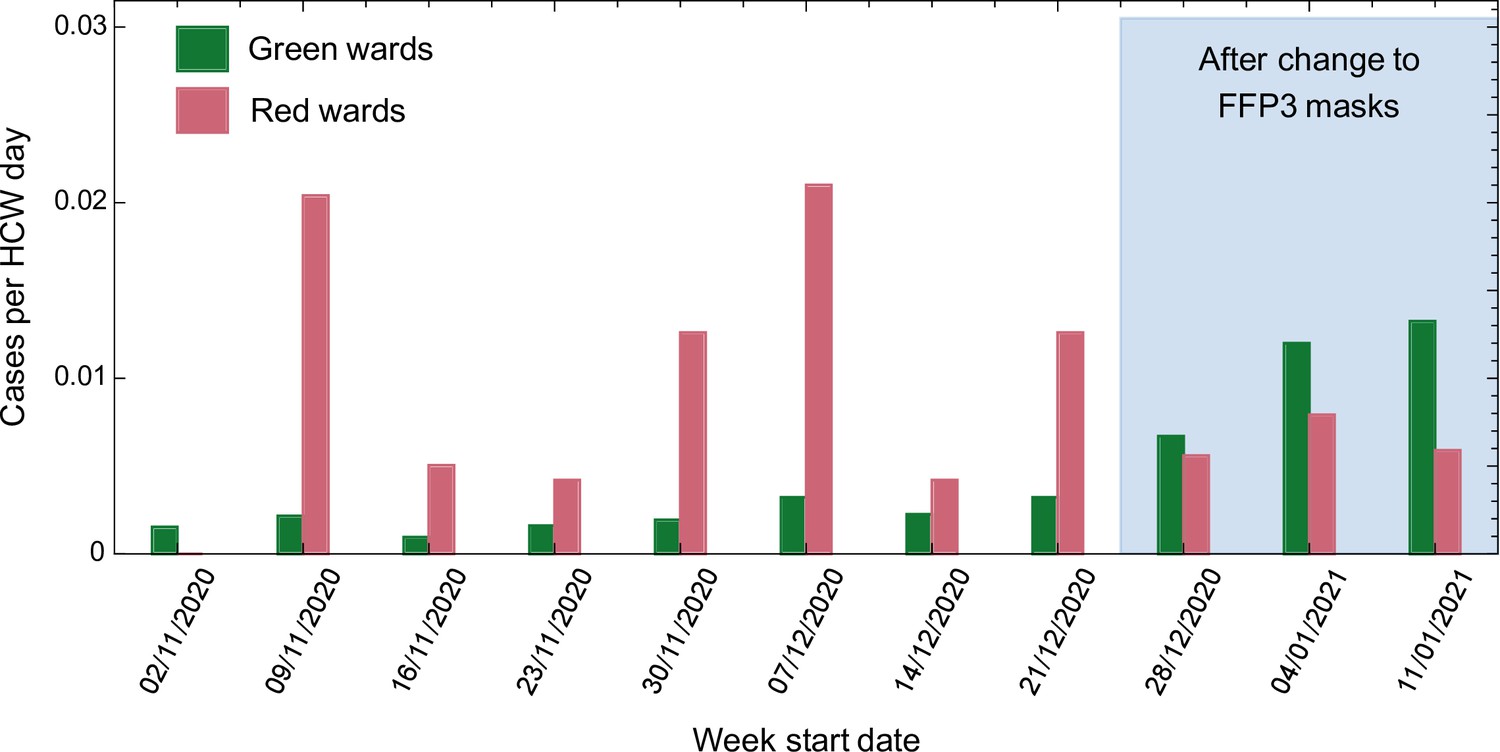
Weekly cases per healthcare worker (HCW) day amongst HCWs on red and green wards prior to and after the change in respiratory protective equipment (RPE).
Figure 2—figure supplement 1
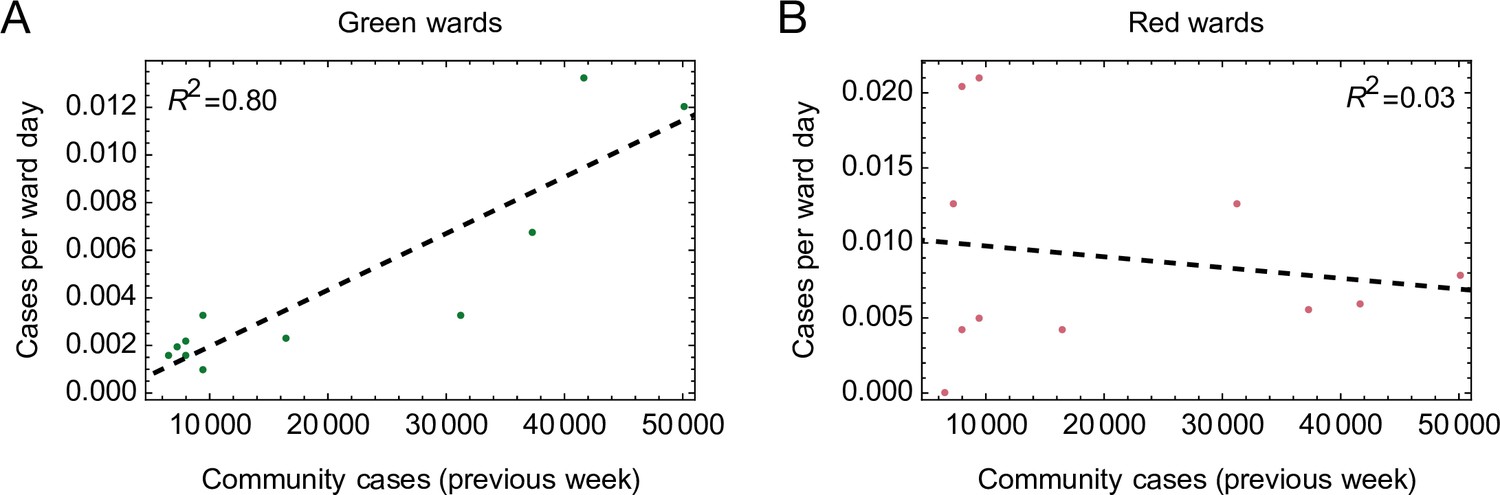
Relationships between cases per ward day and community incidence.
Cases per ward day amongst healthcare workers (HCWs) on green wards (A) were strongly correlated with the number of community cases identified the previous week (p value <2.1 × 10⁻³, Pearson correlation test), suggesting that infection in the community explains cases amongst HCWs on these wards. Conversely, cases per ward day amongst HCWs on red wards (B) did not correlate with the community incidence (p value >0.62, Pearson correlation test). R2 values shown in the figures are coefficients of determination arising from linear regression calculations performed using the Mathematica software package (version 12.3.1.0).
Figure 3 with 2 supplements
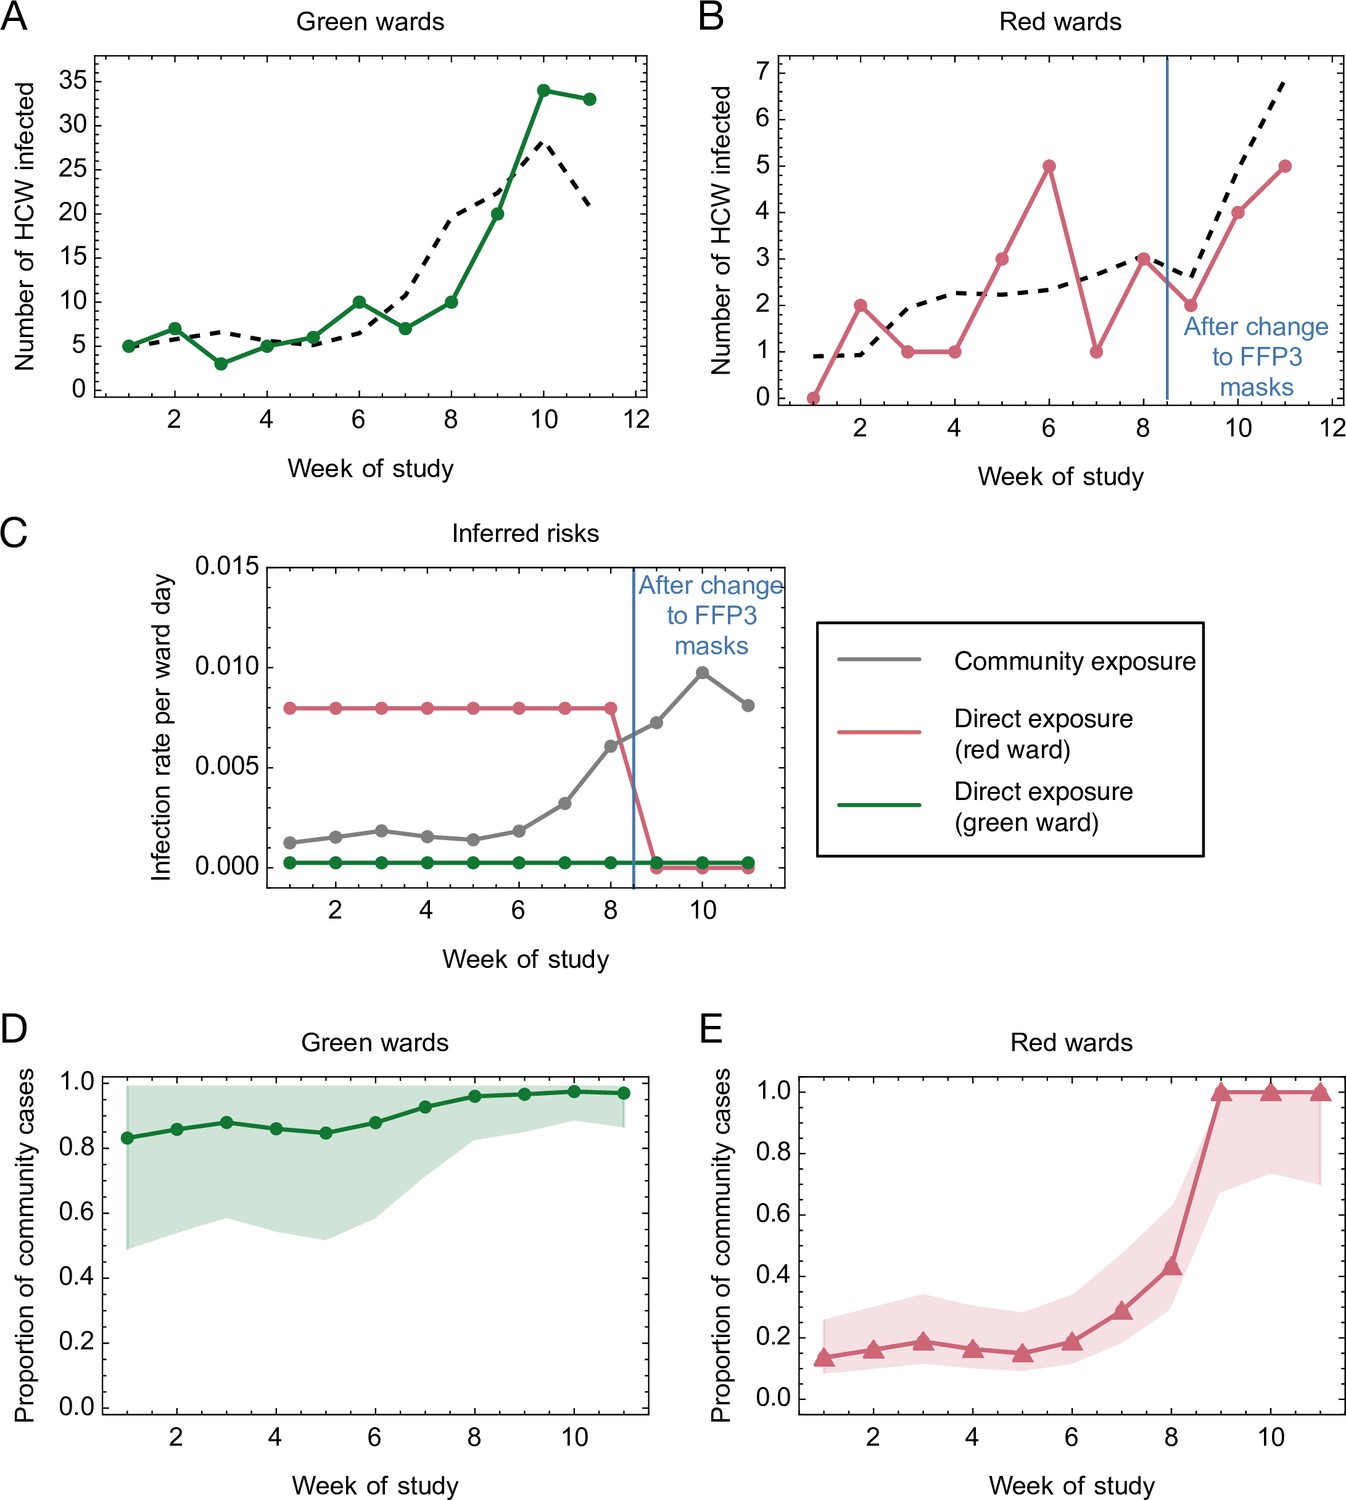
Mathematical modelling of the risks of infection for healthcare workers (HCWs) on red and green wards.
(A, B) Comparison of modelled and actual cases. The model (black dashed line) aimed to reproduce the risks of infection amongst HCWs per ward day (A) on green wards (green solid line) and (B) on red wards (red solid line). (C) Risks inferred from the model. HCWs were vulnerable to coronavirus disease 2019 (COVID-19) infection from exposure to individuals in the community, with this risk increasing with community incidence (grey line). HCWs working on green wards faced a consistent, low risk of infection from direct, ward-based exposure (green line). HCWs working on red wards initially faced a much higher risk of infection from direct, ward-based exposure, falling to a value close to that on green wards upon the introduction of filtering face piece 3 (FFP3) respirators. In this figure, risks are expressed per ward day; a risk of 0.01 indicates that a particular source of risk would be expected to cause one HCW to develop an infection every 100 days that the ward was in operation. (D, E) Proportion of community-acquired cases. Proportion of infections on (D) green and (E) red wards inferred to have arisen via exposure to individuals in the community (green line, green wards; red line, red wards; confidence intervals shaded).
-
Figure 3—source data 1
Mathematical modelling of the risks of infection for healthcare workers (HCWs) on red and green wards.
- https://cdn.elifesciences.org/articles/71131/elife-71131-fig3-data1-v2.xlsx
Figure 3—figure supplement 1

Effect of changing the attribution of positive cases to wards in which a contemporaneous designation change occurred (e.g. from green to red).
Cases were by default attributed to the type of ward on which each positive-testing healthcare worker (HCW) worked 5 days prior to reporting symptoms (if symptomatic) or testing positive (if asymptomatic). This analysis examines how maximum likelihood inferences (dots) and confidence intervals (lines) change upon varying the 5 day cutoff to between 3 and 7 days. A ratio of 0.4 corresponds to a 60 % reduction in HCW risk upon the introduction of filtering face piece 3 (FFP3) respirators.
-
Figure 3—figure supplement 1—source data 1
Effect of changing the attribution of positive cases to wards in which a contemporaneous designation change occurred.
- https://cdn.elifesciences.org/articles/71131/elife-71131-fig3-figsupp1-data1-v2.xlsx
Figure 3—figure supplement 2
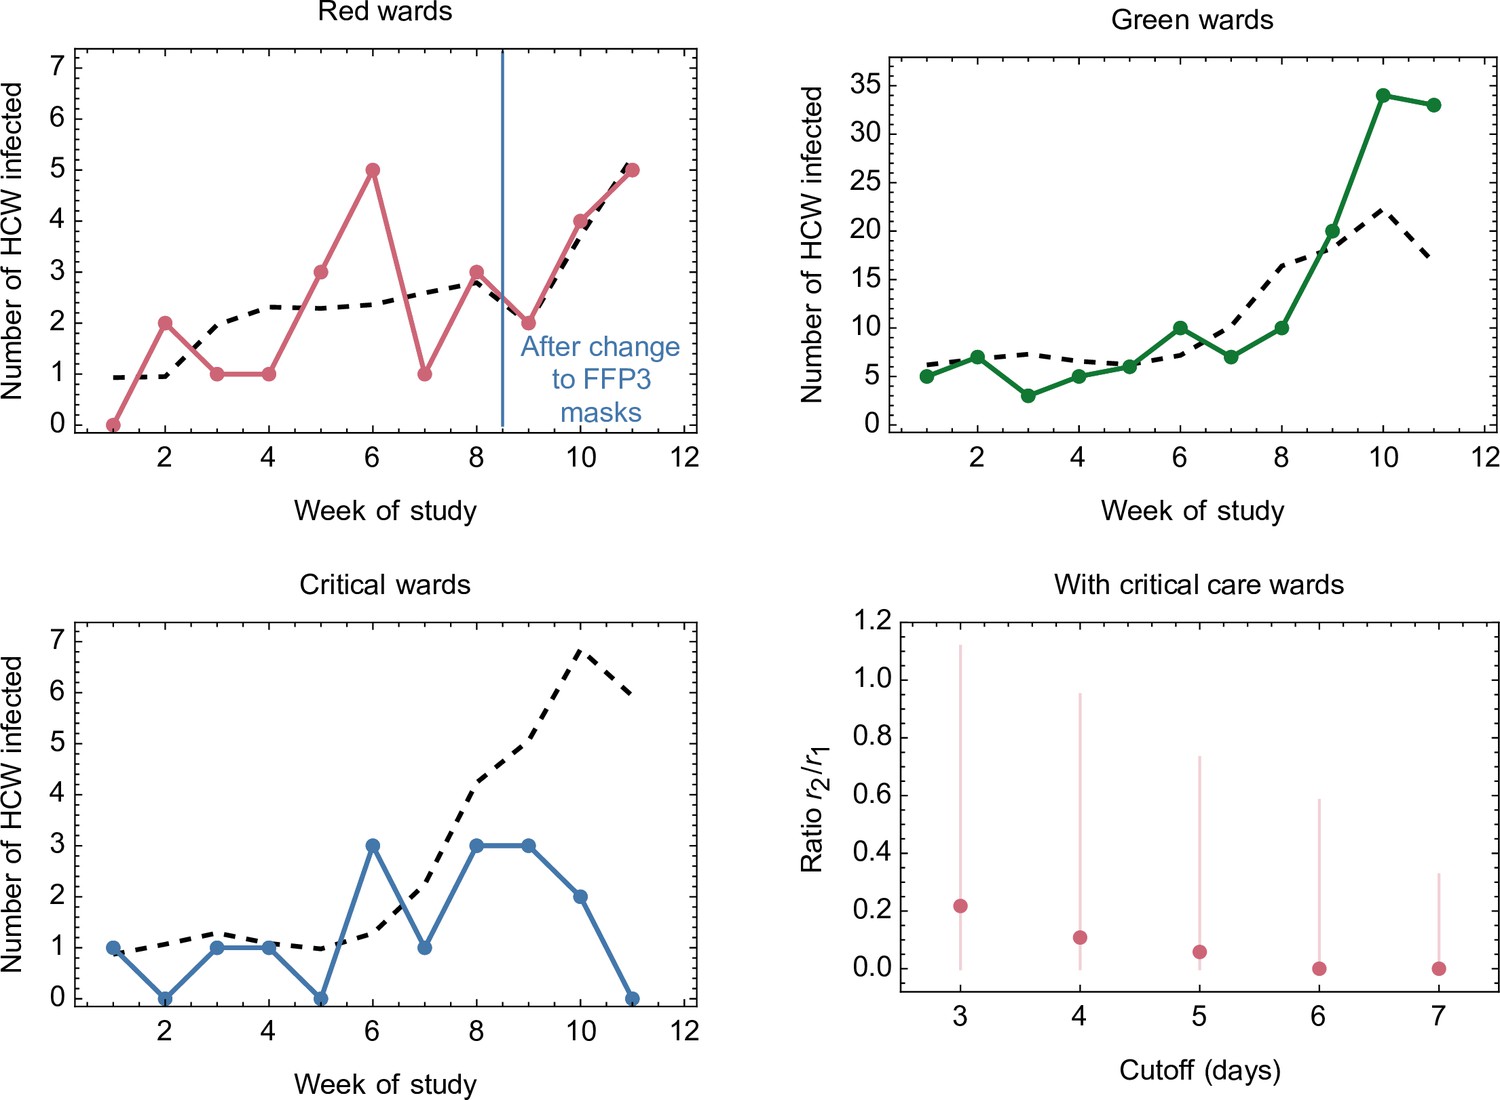
Comparison of modelled and actual cases when critical care wards were included in the dataset.
The model (black dashed line) aimed to reproduce the risks of infection amongst healthcare workers (HCWs) per ward day on green wards (green line), red wards (red solid line), and on critical care wards (blue line). Red dots show the maximum likelihood ratio between ward-specific risks to HCWs on red wards before and after the introduction of filtering face piece 3 (FFP3) respirators, with vertical lines indicating 95 % confidence intervals for this statistic. Our model fitted a rate of community-based infection, plus ward-type-specific rates of infection for red, green, and critical care wards.
-
Figure 3—figure supplement 2—source data 1
Comparison of modelled and actual cases when critical care wards were included in the dataset.
- https://cdn.elifesciences.org/articles/71131/elife-71131-fig3-figsupp2-data1-v2.xlsx
Tables
Table 1
Weekly numbers of cases amongst HCWs on red and green wards, and cases per HCW day weeks following the change in RPE are highlighted in grey.
Community incidence (total cases per week) is shown for the East of England, UK, with raw data shown in Figure 1—source data 1.
| Week | Week start | Red cases | Red HCW days | Red cases per 103 HCW days | Green cases | Green HCW days | Green cases per 103 HCW days | Excluded cases | Total | Community |
|---|---|---|---|---|---|---|---|---|---|---|
| 1 | 02/11/2020 | 0 | 98 | 0 | 5 | 3255 | 1.54 | 16 | 21 | 7876 |
| 2 | 09/11/2020 | 2 | 98 | 20.41 | 7 | 3241 | 2.16 | 33 | 42 | 9499 |
| 3 | 16/11/2020 | 1 | 198 | 5.05 | 3 | 3141 | 0.96 | 26 | 30 | 7998 |
| 4 | 23/11/2020 | 1 | 238 | 4.20 | 5 | 3101 | 1.61 | 24 | 31 | 7203 |
| 5 | 30/11/2020 | 3 | 238 | 12.61 | 6 | 3101 | 1.93 | 20 | 29 | 9441 |
| 6 | 07/12/2020 | 5 | 238 | 21.01 | 10 | 3101 | 3.22 | 33 | 48 | 16,535 |
| 7 | 14/12/2020 | 1 | 238 | 4.20 | 7 | 3101 | 2.26 | 41 | 49 | 31,219 |
| 8 | 21/12/2020 | 3 | 238 | 12.61 | 10 | 3101 | 3.22 | 56 | 69 | 37,259 |
| 9 | 28/12/2020 | 2 | 357 | 5.60 | 20 | 2982 | 6.71 | 58 | 80 | 50,110 |
| 10 | 04/01/2021 | 4 | 505 | 7.92 | 34 | 2834 | 12.00 | 70 | 108 | 41,663 |
| 11 | 11/01/2021 | 5 | 848 | 5.90 | 33 | 2491 | 13.25 | 63 | 102 | 31,341 |
-
HCW, healthcare worker; RPE, respiratory protective equipment.
Table 2
Statistics and parameter ratios inferred from the model.
| Statistic | Model parameter | Maximum likelihood estimate | Confidence interval |
|---|---|---|---|
| Force of community-based infection per community case | k | 1.95 × 10⁻⁷ | [1.49 × 10⁻⁷, 2.39 × 10⁻⁷] |
| Force of direct infection per HCW day (green ward) | g | 2.53 × 10⁻⁴ | [0, 1.10 × 10⁻³] |
| Force of direct infection per HCW day (red ward, pre-FFP3) | r1 | 7.97 × 10⁻³ | [3.65 × 10⁻³, 1.40 × 10⁻²] |
| Force of direct infection per ward day (red ward, post-FFP3) | r2 | 6.84 × 10⁻¹⁰ | [0, 3.38 × 10⁻³] |
| Relative direct risk on red wards post- versus pre-FFP3 | r2/r1 | 0.00 | [0, 0.478] |
| Relative direct risk on red ward versus green ward pre-FFP3 | r1/g | 31.47 | [5.92, ∞) |
| Relative direct risk on red ward versus green ward post-FFP3 | r2/g | 0.00 | [0, ∞) |
-
FFP3, filtering face piece 3; HCW, healthcare worker.
Additional files
-
Transparent reporting form
- https://cdn.elifesciences.org/articles/71131/elife-71131-transrepform1-v2.docx
-
Supplementary file 1
Additional data tables.
- https://cdn.elifesciences.org/articles/71131/elife-71131-supp1-v2.docx
Download links
A two-part list of links to download the article, or parts of the article, in various formats.
Downloads (link to download the article as PDF)
Open citations (links to open the citations from this article in various online reference manager services)
Cite this article (links to download the citations from this article in formats compatible with various reference manager tools)
Efficacy of FFP3 respirators for prevention of SARS-CoV-2 infection in healthcare workers
eLife 10:e71131.
https://doi.org/10.7554/eLife.71131


