Total parasite biomass but not peripheral parasitaemia is associated with endothelial and haematological perturbations in Plasmodium vivax patients
- Laboratory of Tropical Diseases – Prof. Luiz Jacintho da Silva, Department of Genetics, Evolution, Microbiology and Immunology, Institute of Biology, University of Campinas, Brazil
- Wellcome Centre for Integrative Parasitology, Institute of Infection, Immunity & Inflammation, University of Glasgow, United Kingdom
- Post-Graduation in Medical Pathophysiology, School of Medical Sciences, University of Campinas, Brazil
- School of Pharmaceutical Sciences, University of São Paulo, Brazil
- Hospital Israelita Albert Einstein, Brazil
- Department of Clinical Pathology, School of Medical Sciences, University of Campinas, Brazil
- Institute Leônidas & Maria Deane, Fiocruz, Brazil
- Tropical Medicine Foundation Dr. Heitor Vieira Dourado, Brazil
Figures
Figure 1 with 1 supplement
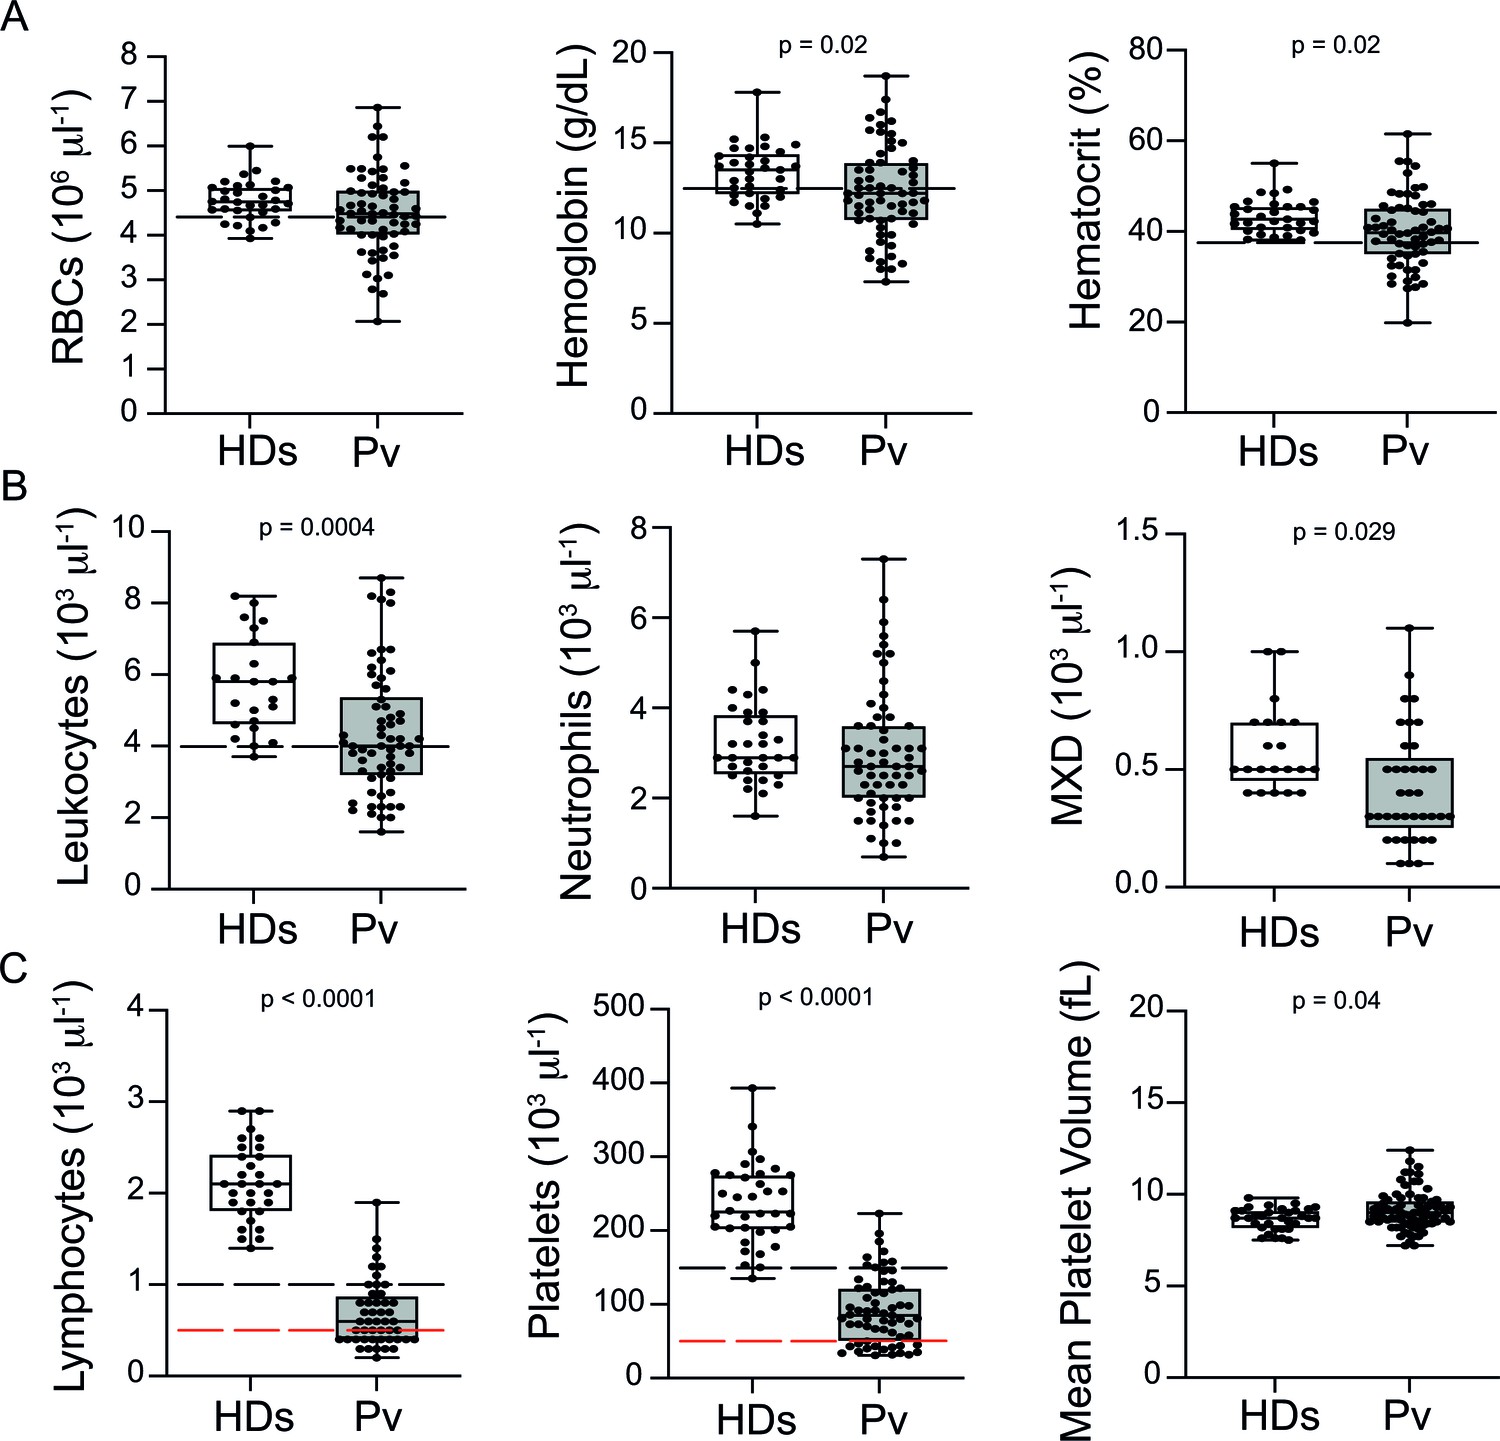
Clinical data of P. vivax patients (Pv) and healthy donors (HDs).
(A) Red blood cell parameters. Shown are red blood cell counts, haemoglobin levels, and haematocrit. (B) Other blood cell parameters. Shown are numbers of leukocytes, neutrophils, and monocytes, basophils, and eosinophils (MXD). (C) Number of lymphocytes, platelets, and mean platelet volume (MPV). Parameters are depicted as box plots showing each individual value and the median with maximum and minimum values. Dashed lines in black mark the minimum threshold for normal reference values, while lines in red mark threshold for severe lymphopenia and thrombocytopenia, respectively. Two-tailed Student’s t-test was used to compare variables with normally distributed data, and Mann–Whitney test was used to compare variables with non-normal distributions; p-value is indicated above the graph when p<0.05. HDs: healthy donors (controls, n = 34); Pv: P. vivax-infected patients (n = 79).
Figure 1—figure supplement 1
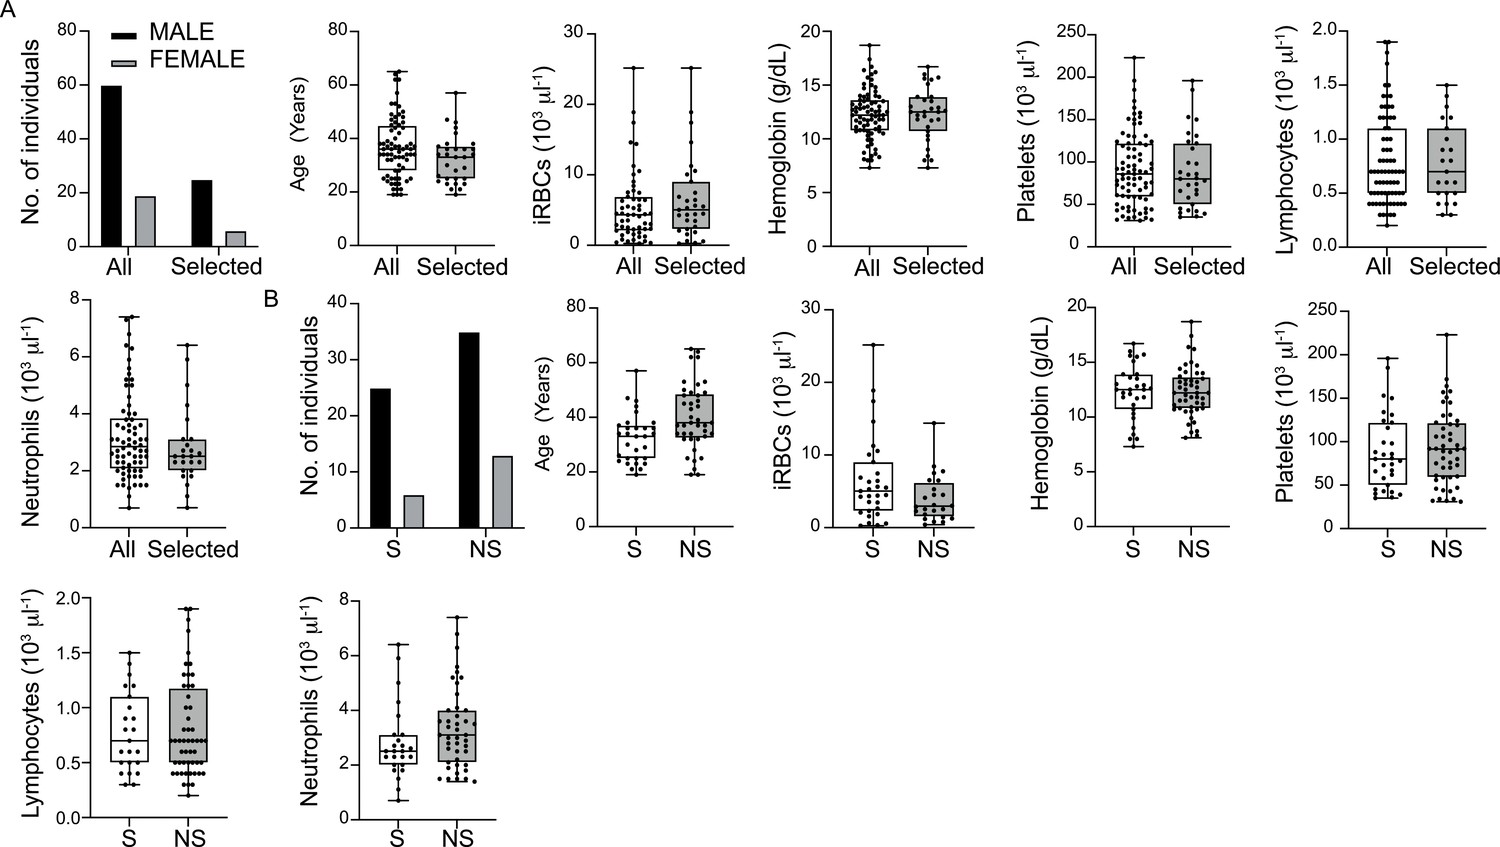
Demographic and clinical features of all P. vivax-infected patients compared with selected 31 patients for multiplex bead-based assay and downstream analysis.
(A) Gender, age, and haematological parameters compared between all 79 P. vivax-infected patients (All) and those 31 selected for downstream molecular analysis. (B) Comparison of gender, age, and haematological parameters between 31 selected (S) P. vivax-infected patients with the remaining 48 non-selected (NS) patients. Parameters are depicted as box plots showing each individual value and the median with maximum and minimum values.
Figure 2 with 2 supplements
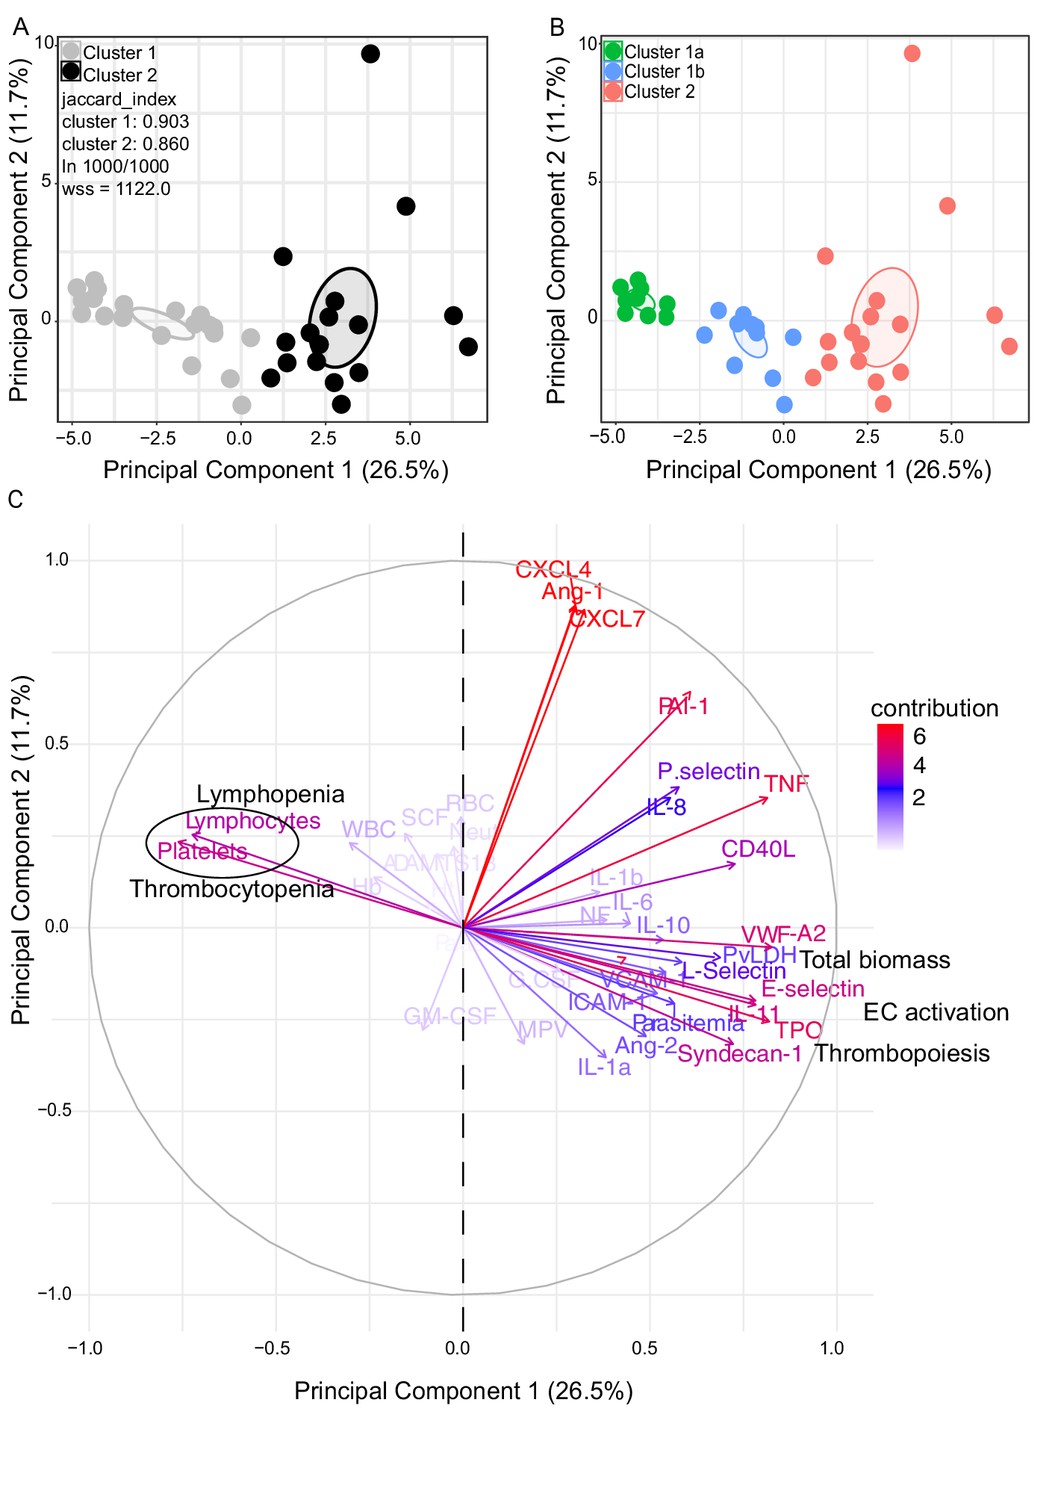
Characterization of heterogeneity in symptomatic P. vivax patients defines clusters of individuals.
(A, B) Clustering of patients and healthy controls. After z-score normalization, principal component analysis (PCA) was performed for data dimensionality reduction. K-means clustering using k = 2 followed by bootstrapping (1000 times) in a PCA plot was performed and produced the most stable clusters regardless of the starting point (ln 1000/1000): cluster 1 = 23 individuals comprising 9 healthy donors and 14 P. vivax patients and cluster 2 comprising 17 P. vivax patients. The jaccard_index measures cluster similarity across bootstrap samples (jaccard_index ranges from 0 to 1, an index <0.6 hints at a weak, unreliable cluster while >0.85 means generally reliable). As indicated in the PCA plot, k = 2 gives stable clusters for all configurations (jaccard_index 0.9 and 0.86) and withinss (wss) = 1122. Open ovals represent 95% confidence interval ellipses around group mean points. PCA was performed for data dimensionality reduction, in parallel with K-means clustering (k) followed by bootstrapping (1000 times). Open ovals represent 95% confidence interval ellipses around group mean points. (B) The resulting clusters represent healthy controls (1a) and patients (1b, 2). (C) Contribution of variables to clustering. In the circular plot, the correlation between each input variable and principal components is used as coordinates (loading score). Plots show how covariables determine patient distribution in the PCA plot.
-
Figure 2—source data 1
Correlation (loading score) of variables to principal components.
- https://cdn.elifesciences.org/articles/71351/elife-71351-fig2-data1-v2.xlsx
Figure 2—figure supplement 1

Principal component analysis metrics.
(A, B) Analysis of eigenvalues (measure of the amount of variation retained by each principal component [PC]) and the percentage of explained variances retained by the PCs demonstrated that the first 10 PCs accounted for the variance of the data. (C) However, most of the variables were highly represented in the first two PCs (Dim 1 and Dim 2), which were therefore retained for further analysis.
Figure 2—figure supplement 2
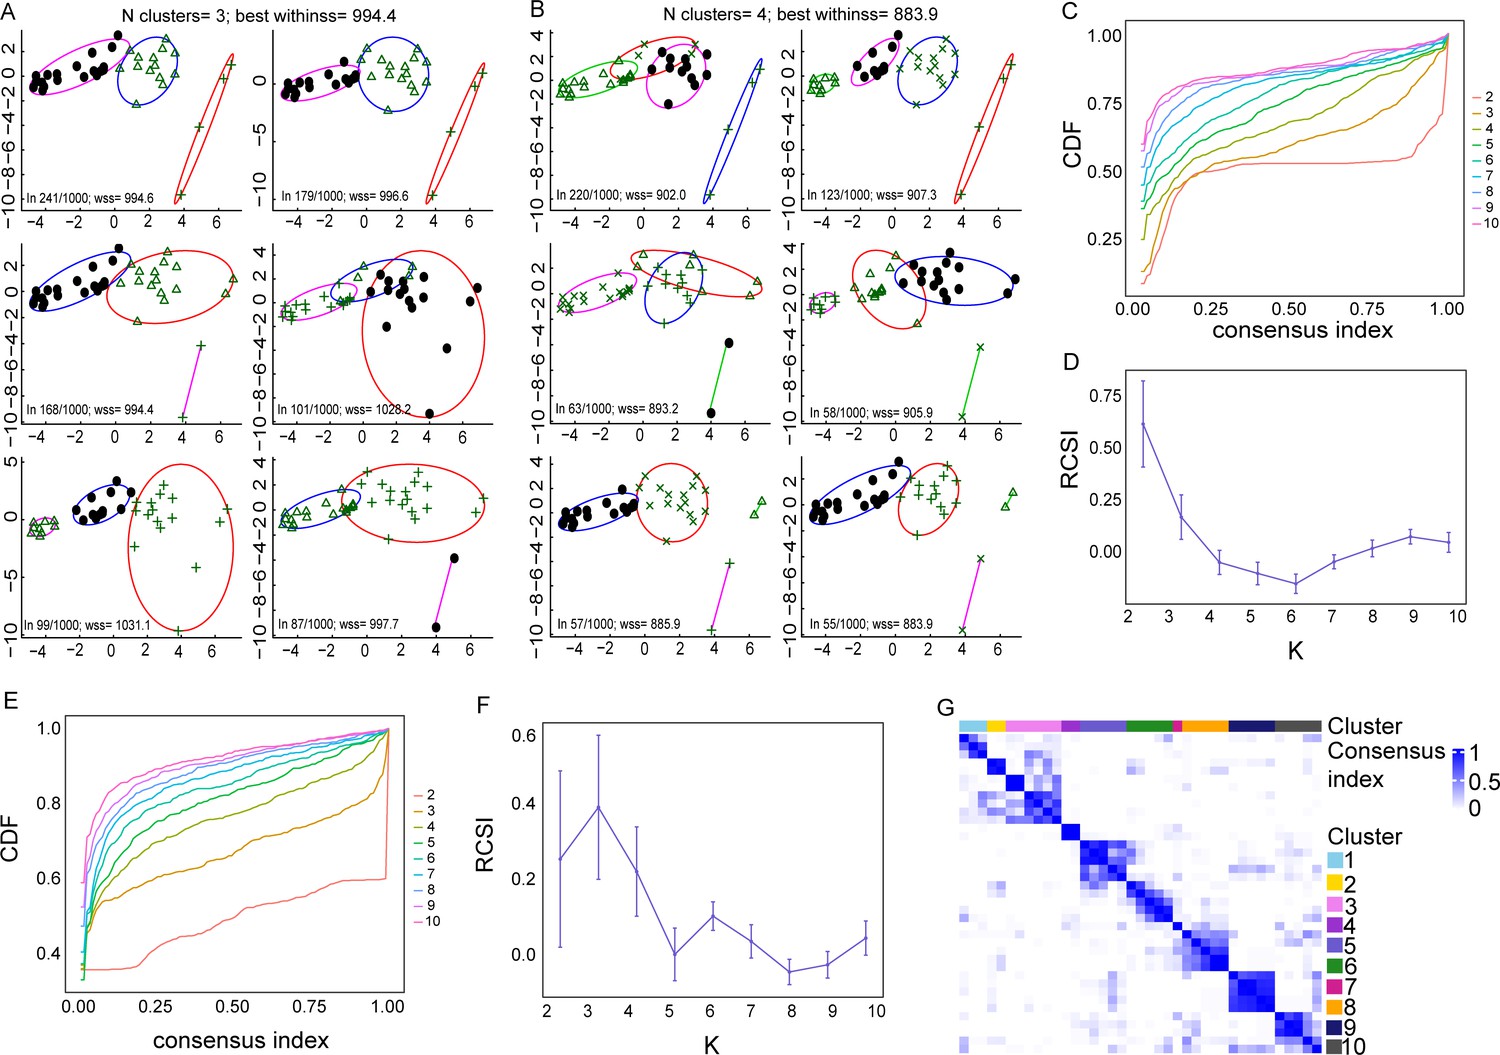
Methods determining the number of clusters best representing the data.
(A, B) Principal component analysis (PCA) plots indicating different K-means cluster configurations, using k = 3 and k = 4 clusters, respectively, after performing bootstrapping. With k = 3, different starting points give different clusters. The two most common clusters (top row) are very similar, and they are obtained in 241 and 179 starts out of 1000, respectively. However, the clustering that best represents the data when k = 3 is the third one found in 168/1000 starting points as its withinss (wss) metric is lower (highlighted in red). Indeed, this configuration is more equivalent to those clustering configurations when k = 2. (B) Clusters seem more stable when k = 4. Accordingly, the best clustering appears to be the ones represented in the bottom row, which contains two main groups and two small groups with just two patients. (C, D) The second method used was the Monte Carlo reference-based consensus clustering (M3C), which also indicated that k = 2 is the optimal number of clusters, as indicated in (C) the flat line in the CDF plot and (D) in the highest relative cluster stability index (RCSI) plot. (E–G) Using spectral clusters, instead of elliptical K-means clusters, M3C analysis indicates that k = 3 gives the optimal number of clusters, as indicated in the (E) CDF plot, (F) RCSI plot, and (G) the NXN consensus matrix, where each element represents the fraction of times two samples clustered together.
-
Figure 2—figure supplement 2—source data 1
Measurements of K-means cluster stability, using k = 2, k = 3, and k = 4 clusters, via bootstrapping.
The metrics of interest is jaccard_index which measures the cluster similarity across bootstrap samples. Jaccard_index ranges from 0 to 1, an index < 0.6 hints at a weak, unreliable cluster while > 0.85 means generally reliable.
- https://cdn.elifesciences.org/articles/71351/elife-71351-fig2-figsupp2-data1-v2.xls
Figure 3
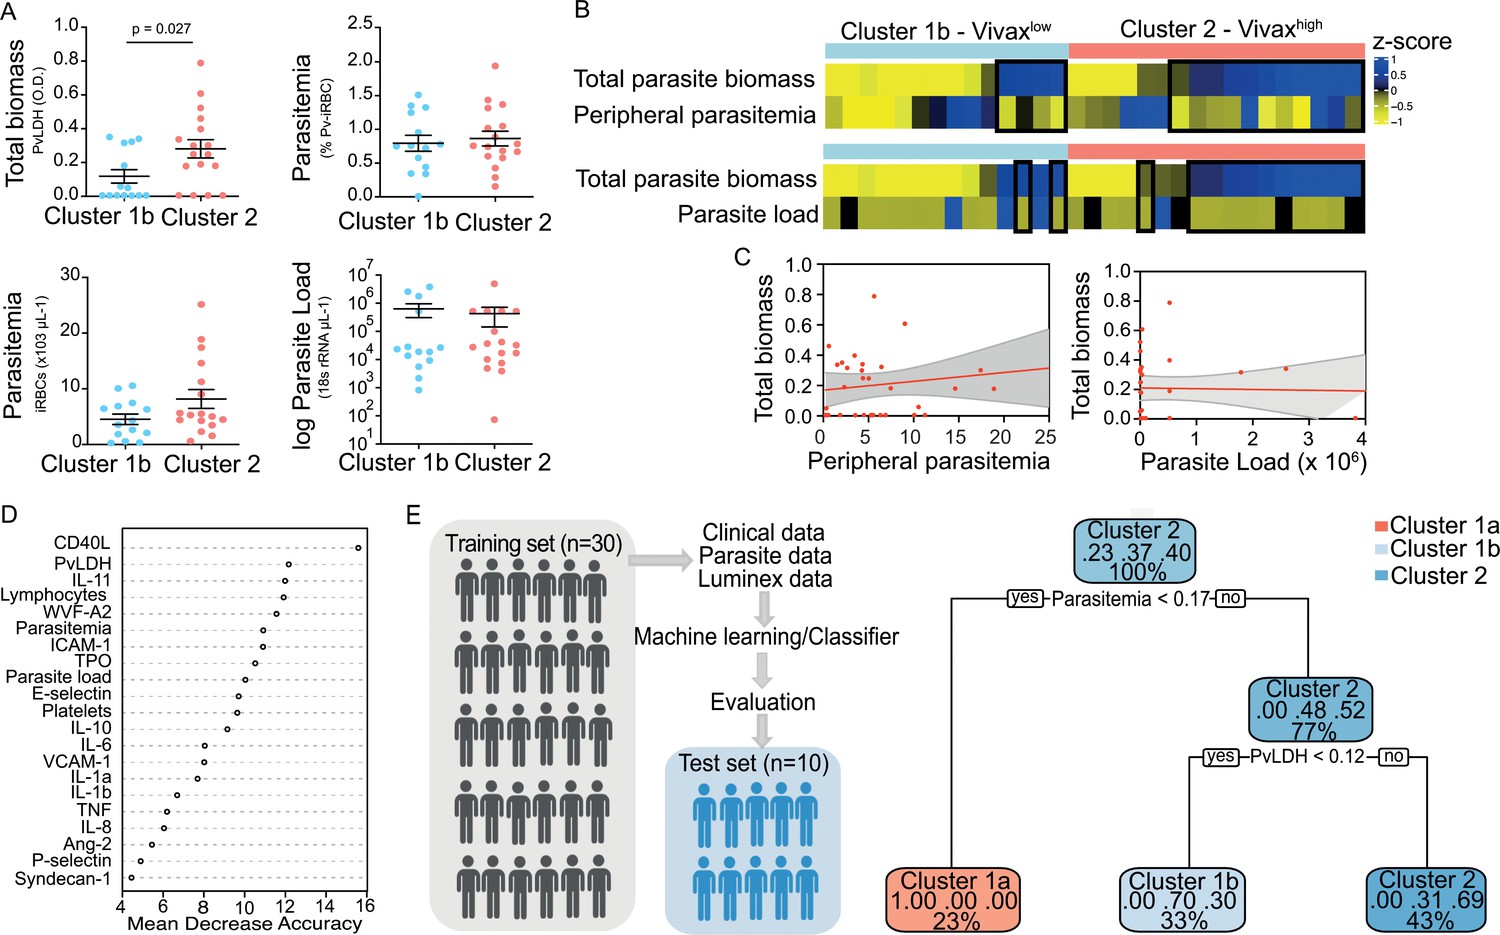
Unsupervised clustering analysis reveals two P. vivax patient subgroups that differ in parasite biomass.
(A) Parasite parameters vs. patient clusters. Comparison of the two patient clusters (clusters 1b and 2) across parasite parameters reveals significant differences with total parasite biomass (P. vivax lactate dehydrogenase [PvLDH]) but not peripheral parasitaemia or parasite load (copies of 18S rRNA/μL of blood). (B) Parasite biomass vs. parasitaemia across clusters. Heatmap represents z-scores of PvLDH with peripheral parasitaemia or parasite load, respectively. Black boxes highlight patients with relatively lower peripheral parasitaemia compared to PvLDH levels, indicating the underestimation of total parasite biomass based on peripheral parasitaemia values. (C) Correlation between parasite biomass and parasitaemia. Scatter plot showing lack of correlation between PvLDH and peripheral parasitaemia or parasite load, respectively. Regression line in red, with 95% confidence interval shown in shaded grey. (D, E) Predicting parasite clusters. (D) Top parameters prioritized by random forest analysis ranked by the mean decrease in accuracy. (E) Best-fit decision trees and random forest machine learning models corroborate PvLDH value as the most important parasite signature in segregating patients into clusters 1b and 2. Cut-off values of the attribute that best divided groups were placed in the root of the tree according to the parameter value. The total of classified registers for each class and the percentage of observations used at that node are given in each terminal node.
Figure 4 with 1 supplement
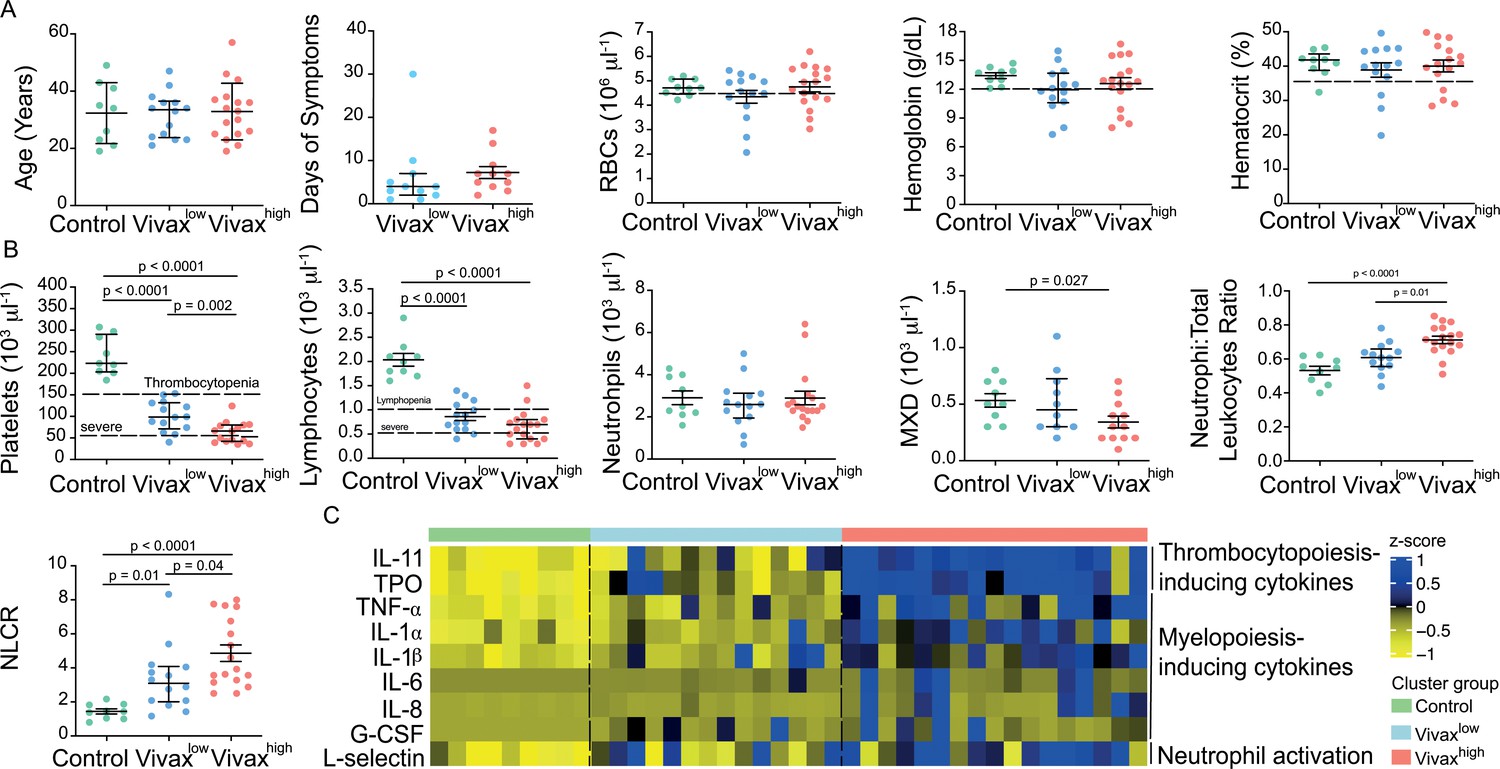
More severe haematological alterations in Vivaxhigh compared to Vivaxlow patients.
(A) Patient data and haematological parameters. Comparison of patient age, average days of symptoms when samples were collected, haemoglobin levels, haematocrit, or RBC counts across patient clusters (Control: n = 9; Vivaxlow : n = 14; Vivaxhigh: n = 17). Data are depicted as plots showing individual values and the median (black lines) and the interquartile range. (B) Blood cell counts. Comparison of differential haematological counts across clusters. Shown are numbers of platelets, lymphocytes, neutrophils, and monocytes, basophils, and eosinophils (MXD), neutrophil to total leukocyte ratio, and neutrophil to lymphocyte ratio (NLCR). Top dashed lines mark the minimal threshold for normal reference values, while bottom dashed lines mark the threshold for severe lymphopenia and thrombocytopenia, respectively. Parameters are depicted as plots showing individual values and the median (black lines) and the interquartile range. One-way analysis of variance with Bonferroni-corrected multiple comparisons test was performed. p-Value is indicated above the graph when reached significance of p<0.05. (C) Cytokine response and neutrophil activation across clusters. Heatmap represents z-scores obtained by centering values of Luminex data. Shown are thrombopoiesis-inducing cytokines, myelopoiesis-inducing cytokines, and neutrophil activation markers. Biomarker concentrations were normalized (scale function in R), and the average scaled value is showed in blue and yellow scales. Blue shading represents the highest average scaled value, and yellow shading represents the lowest average scaled value. Each column (i.e. individual) in the heatmap is matched with colour-coded cluster assignment: Cluster Control – green bar; Cluster Vivaxlow – blue bar; and Cluster Vivaxhigh – red bar.
Figure 4—figure supplement 1
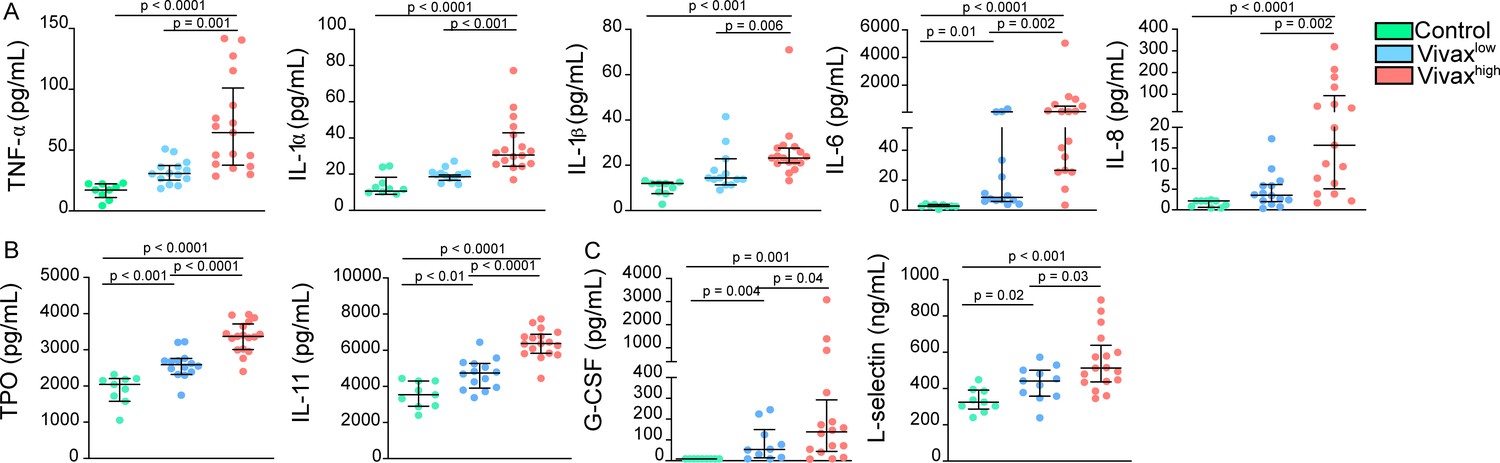
Increase of thrombopoiesis- and myelopoiesis-inducing cytokines in the plasma of Vivaxhigh patients.
(A) Levels of myelopoiesis-inducing cytokines, (B) thrombopoiesis-inducing cytokines thrombopoietin (TPO) and IL-11, and (C) neutrophil activation markers in the acute-phase patients’ plasma samples of our cross-sectional cohort in Manaus, Brazil, were determined by multiplex bead-based assay (Luminex): Control (healthy donors, n = 9), Vivaxlow patients (n = 14), and Vivaxhigh patients (n = 17). Biomarkers’ concentration is depicted as scatter plots showing individual data points and the median (black lines) and the interquartile range. One-way analysis of variance with Bonferroni-corrected multiple comparisons test was performed. p-Value is indicated above the graph when reached p<0.05.
Figure 5 with 2 supplements
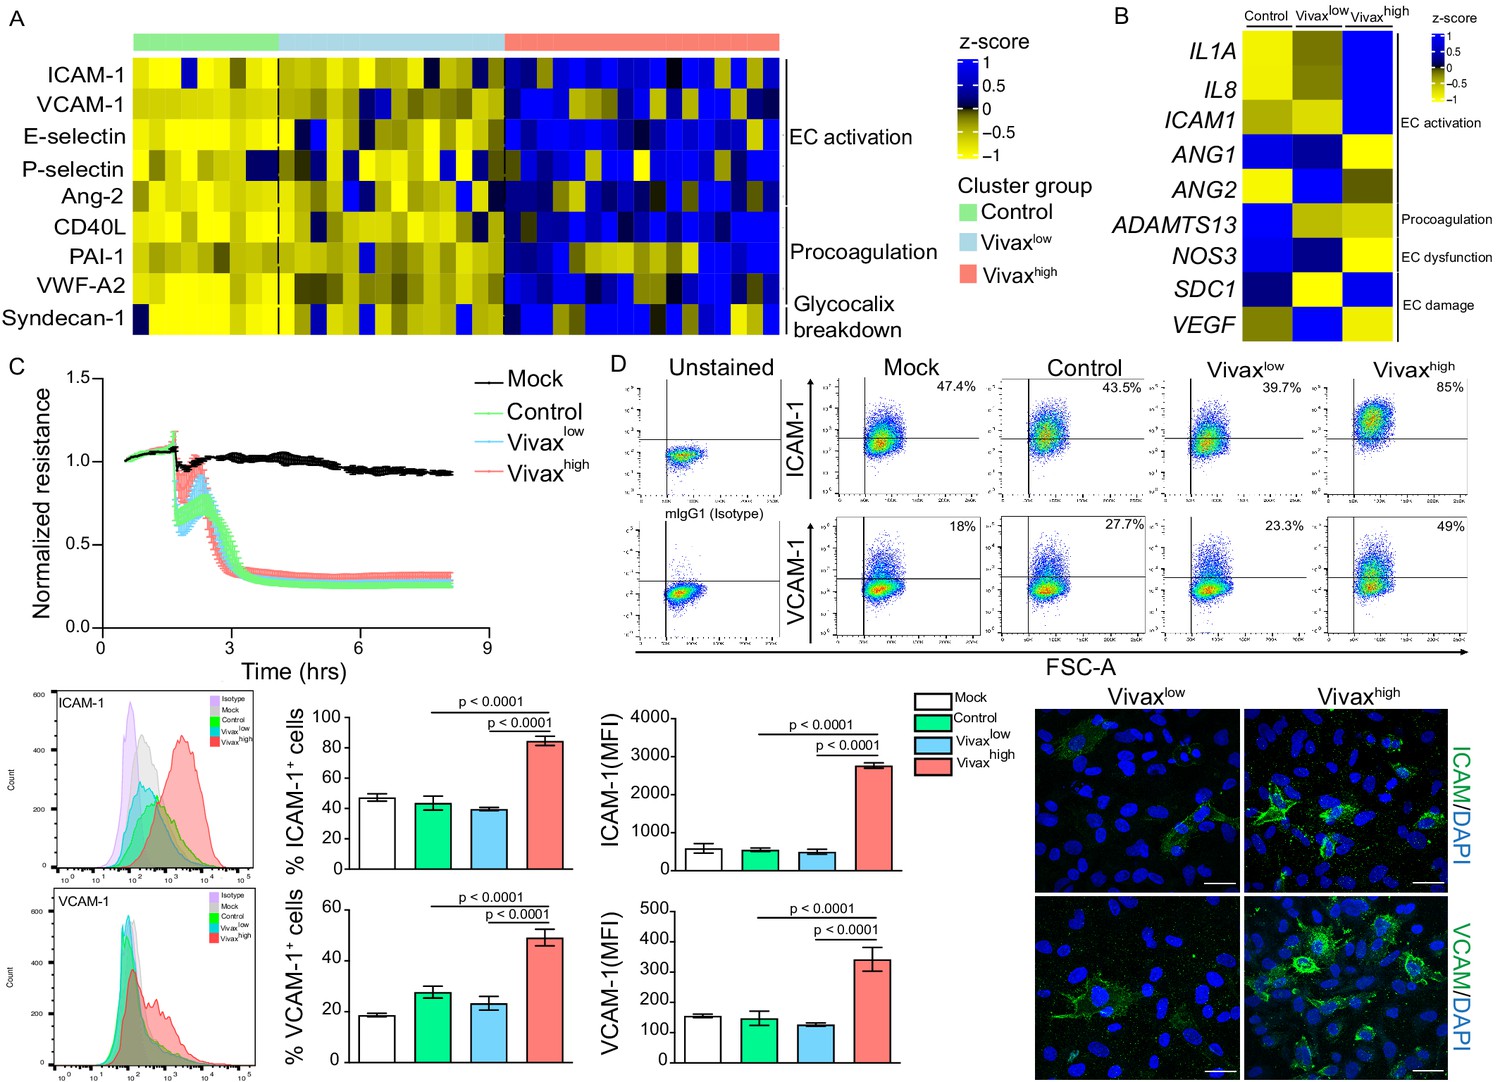
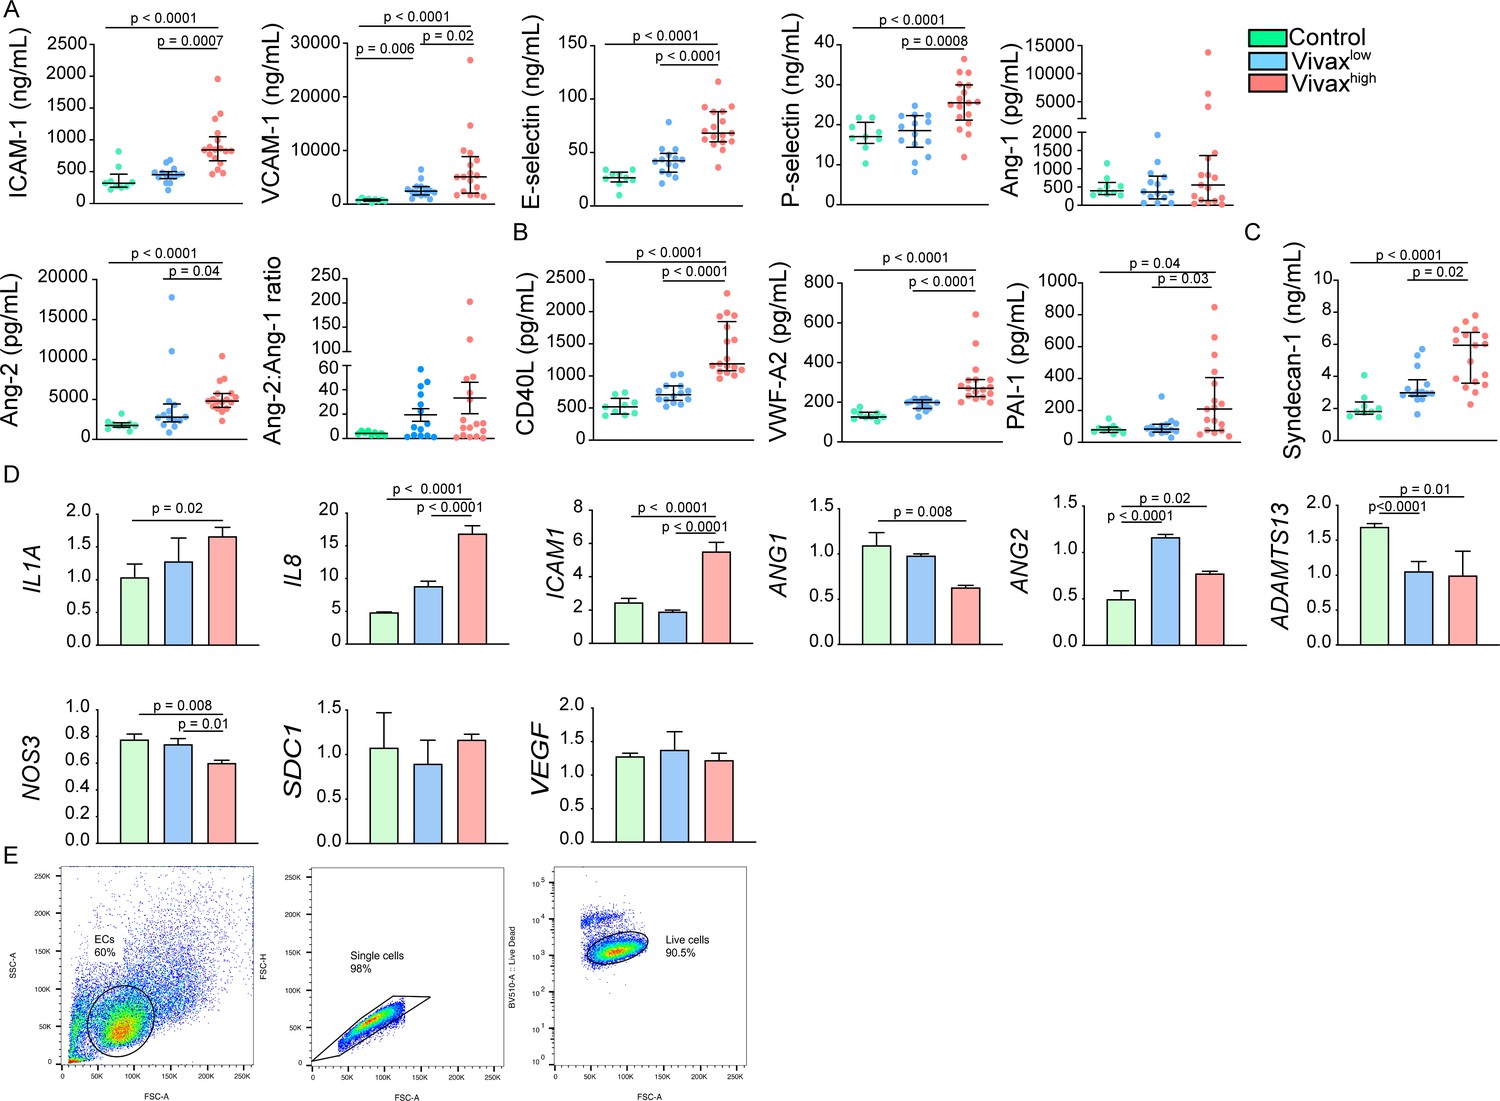
Elevated circulating markers of endothelial cell (EC) activation and damage in Vivaxhigh compared to Vivaxlow patients.
(A) Endothelial changes across clusters: Luminex. Heatmap represents z-scores obtained by centering values of Luminex data. Shown are markers of EC activation, procoagulation, and glycocalyx damage. Each column (each individual) in the heatmap is matched with colour-coded cluster assignment: Cluster Control – green bar; Cluster Vivaxlow – blue bar; and Cluster Vivaxhigh – red bar. (B) Endothelial changes across clusters: qRT-PCR. Transcriptional response of human umbilical vein endothelial cells (HUVECs) incubated for 6 hr with 30% v/v pooled plasma from different clusters. Heatmap reflects relative mRNA expression intensity (average scaled value) after results were normalized to GAPDH housekeeping gene expression and untreated condition (mock). Data shown represent the mean of three independent experiments. For each experiment, two technical replicates were performed for each condition. (C) Endothelial changes across clusters: impedance changes. Endothelial monolayer integrity was measured during 20% v/v of pooled plasma incubation. Each line represents the mean ± SD of normalized resistance of HUVECs measured by electric cell-substrate impedance sensing (ECIS) at 4000 Hz. Data shown are representative of three independent experiments. For each experiment, two technical replicates were performed for each condition. (D) Endothelial changes across clusters: imaging and flow cytometry. HUVECs were incubated for 18 hr with 30% v/v of pooled plasma of individuals in the different clusters or left untreated (mock). Percentage of cells expressing EC activation markers (adhesion molecules) ICAM and VCAM as well as quantification of protein expression was determined by flow cytometry and immunofluorescence analysis (scale bar = 33 μM). Isotype antibodies were used as control to define positive populations. Significance was calculated for comparisons between conditions at the corresponding time point . One-way analysis of variance statistical test with Tukey’s corrected multiple comparisons test was performed. p-Value is indicated above the graph when p<0.05. Data shown are representative mean ± SEM of three independent experiments.
Figure 5—figure supplement 1
Increase of markers of endothelial cell (EC) activation, damage (glycocalyx breakdown), and procoagulation in the plasma of Vivaxhigh patients.
(A) Levels of EC activation markers, (B) procoagulant phenotype, and (C) EC damage (glycocalyx breakdown) in the acute-phase patients’ plasma samples of our cross-sectional cohort in Manaus, Brazil, were determined by multiplex bead-based assay (Luminex): Control (healthy donors, n = 9), Vivaxlow patients (n = 14), and Vivaxhigh patients (n = 17), as indicated in the legend (top-right corner). Biomarkers’ concentration is depicted as scatter plots showing individual data points and the median (black lines) and the interquartile range. One-way analysis of variance with Bonferroni-corrected multiple comparisons test was performed. p-Value is indicated above the graph when reached significance of p<0.05. (D) Quantitative mRNA expression was determined by qRT-PCR in RNA extracted from human umbilical vein endothelial cells (HUVECs) incubated for 6 hr with 30% v/v pooled plasma of individuals in the different clusters, as indicated in the legend (top-right corner). Graphs depict relative expression after results were normalized to GAPDH housekeeping gene expression. The data shown are mean ± SEM representative of three independent experiments. Significance was calculated for comparisons between conditions at the corresponding time point using one-way analyies of variance with Tukey’s corrected multiple comparisons test. p-Value is indicated above the graph when reached significance of p<0.05. (E) Schematics of HUVECs gating strategy used for flow cytometry analysis. EC gate was defined based on the cells’ forward scatter (FSC) and side scatter (SSC). Further, gated single cells on FSC-A vs. FSC-H scatter plot and selected live cells based on Fixable Viability Dye eFluor 506 staining.
Figure 5—figure supplement 2
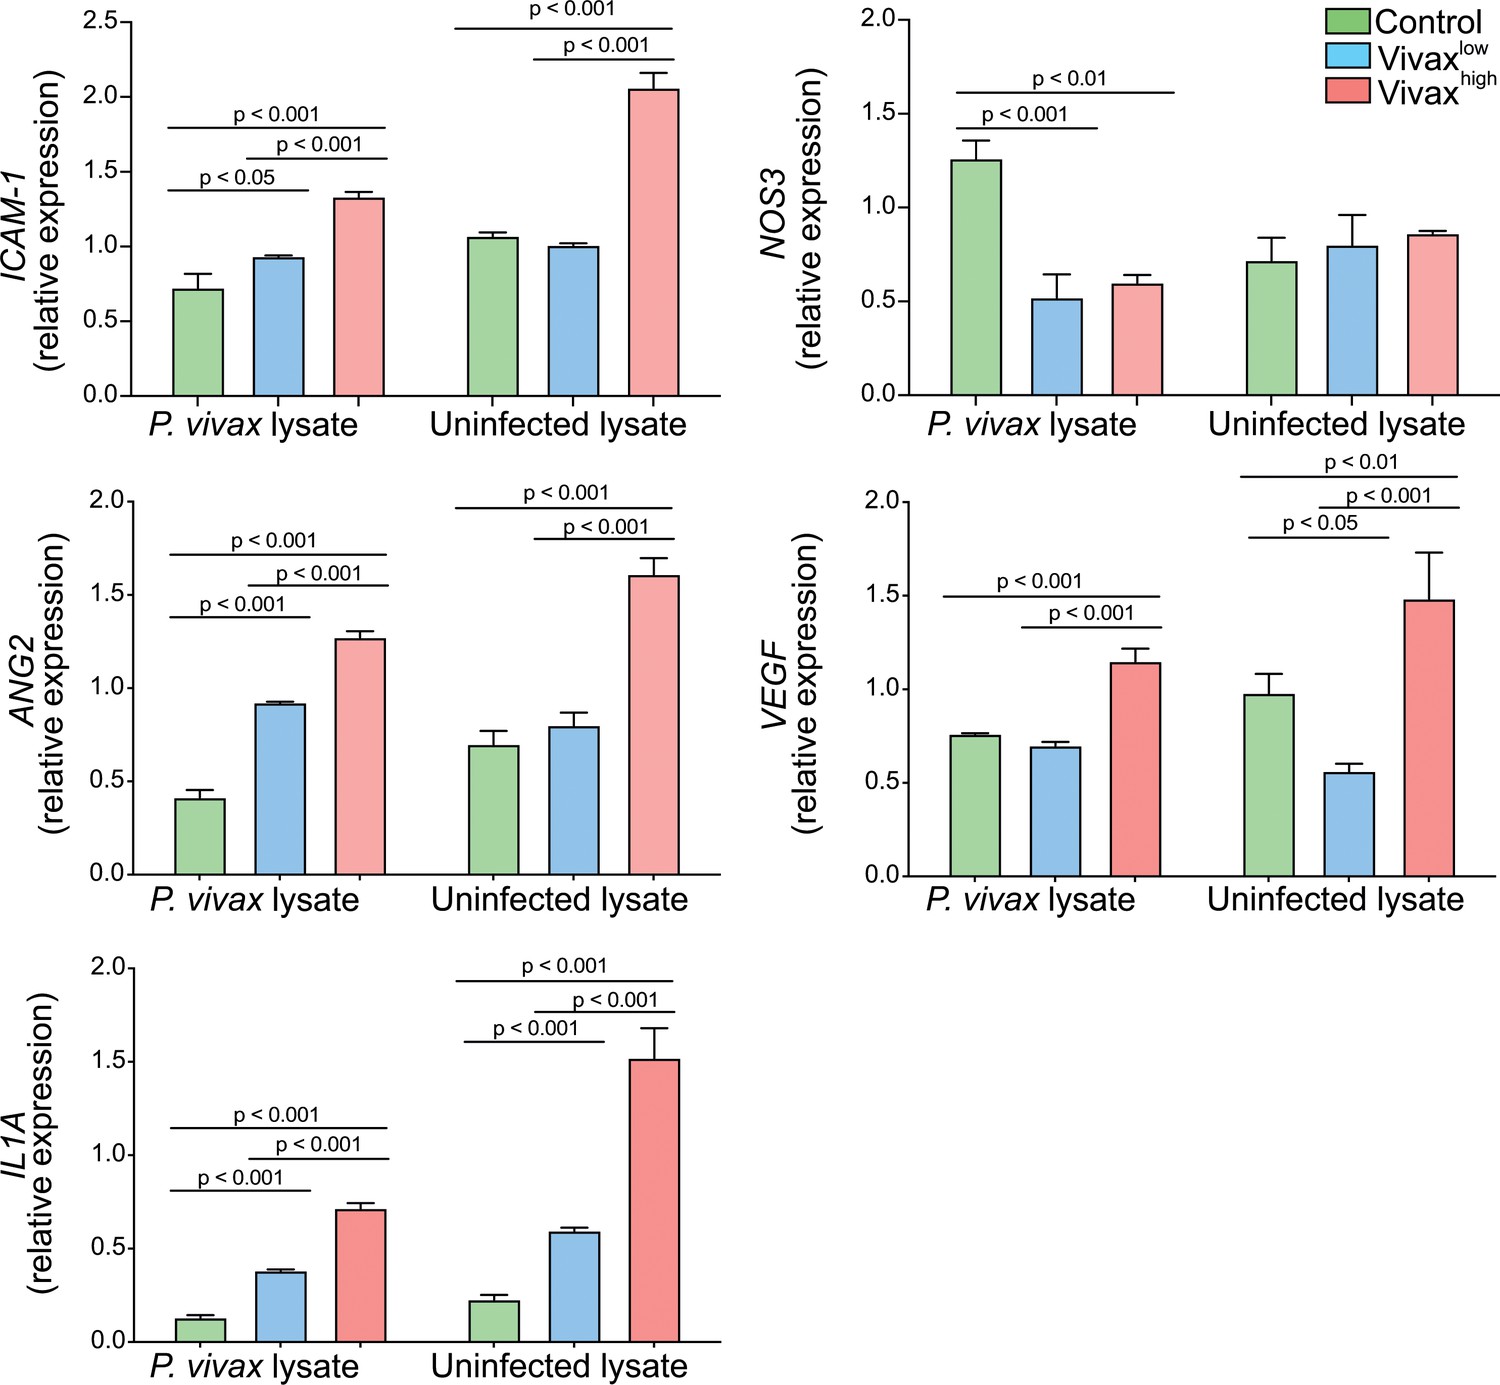
Haemolysis potentiates Vivaxhigh-induced endothelial cell (EC) activation.
In order to mimic the environment associated with commencement of antimalarial treatment, such as content released from haemolysis of RBCs and dead parasites by-products, human umbilical vein endothelial cells (HUVECS) were stimulated with either P. vivax-infected (schizont enriched) or uninfected RBCs lysates in 30% v/v pooled plasma of individuals in the different clusters. For the parasite lysates, batch pellets of P. vivax infected RBCs (iRBCs) enriched of schizonts, isolated from blood of P. vivax-infected patients using Percoll gradient centrifugation, and healthy donor RBCs were stored at −80°C without any cryopreservative agent. Pellets were twice freeze-thawed for use as whole lysates. Total RNA was extracted 6 hr after treatment and relative mRNA expression determined by real-time quantitative PCR. Graphs depict relative expression after results were normalized to GAPDH housekeeping gene expression. The data shown are mean ± SEM representative of three independent experiments. Significance was calculated for comparisons between conditions at the corresponding time point using one-way analysis of variance with Tukey’s corrected multiple comparisons test. p-Value is indicated above the graph when reached significance of p<0.05. Haemolysis of either P. vivax-infected or uninfected RBCs potentiates the effect of Vivaxhigh pooled plasma in inducing transcriptional upregulation of EC activation markers. Different from the stimulation only with plasma, in the presence of haemolysis, we also observed upregulation of Ang-2 and VEGF, and downregulation of NOS3, markers associated with perturbation of the vascular integrity and function.
Figure 6 with 3 supplements

Network analysis and clustering of parasite and host signatures indicate parasite-induced changes in deep tissues.
(A) Network analysis. Networks of the Pearson’s correlations (absolute coefficient above 0.5 and p-value<0.05) between parasite biomass (P. vivax lactate dehydrogenase [PvLDH]) and host signatures in healthy donors (left graph) and in P. vivax-infected patients (right graph), using a force-directed layout. The symbols of the nodes represent biological functions: triangle represents markers of platelet activation and thrombopoiesis-inducing cytokines; V shape represents haematological parameters (neutrophil, lymphocyte, and platelet counts); circles represent endothelial cell activation markers; squares represent myelopoiesis-inducing cytokines and neutrophil activation markers. The colours in the nodes represent the fold change in relation to control levels. Because healthy donors do not have parasitaemia, PvLDH node is represented in black. Each connecting line (edge) represents a significant interaction detected by the network analysis using R. Correlation strength is represented by edge colour transparency and width. Positive correlations are represented by red edges, and negatives correlations are represented by blue edges. (B, C) Correlation matrix and heatmap. (B) Representative image of Pearson’s correlation matrix calculated for all P. vivax patients. Only correlations with p-value<0.01 are shown, and hierarchical clustering was applied. Red circles highlight positive correlations in the functional modules depicted in (A), and blue circles highlight negative correlations in the functional modules also depicted in (A). (C) Heatmap showing p-values of the correlations between different parasite parameters, parasite biomass (PvLDH), and peripheral parasitaemia and host signatures (haematological and Luminex parameters). (D) Decision tree model. Best-fit classification tree model generated with the C4.5 algorithm showing Syndecan-1, IL-6, and platelet counts are the dominant variables capable of predicting total parasite biomass in P. vivax patients. Cut-off values of the attribute that best divided groups were placed in the root of the tree according to the parameter value (pg/mL for soluble markers or number of cells × 1000/μL of blood for platelet counts). The total of classified registers for each class is given in parentheses for each terminal node with the k-fold cross-validation (k-fold CV) accuracy indicated.
Figure 6—figure supplement 1

Representative images of Pearson’s correlation matrix calculated separately for each P. vivax patient cluster.
(A) Vivaxlow patients (n = 14). (B) Vivaxhigh patients (n = 17). A reduced complexity model was established by focusing on informative interactions between P. vivax and host signatures determined by Pearson’s correlation coefficients. Only correlations with associated p-value<0.01 are shown, and hierarchical clustering was applied.
Figure 6—figure supplement 2
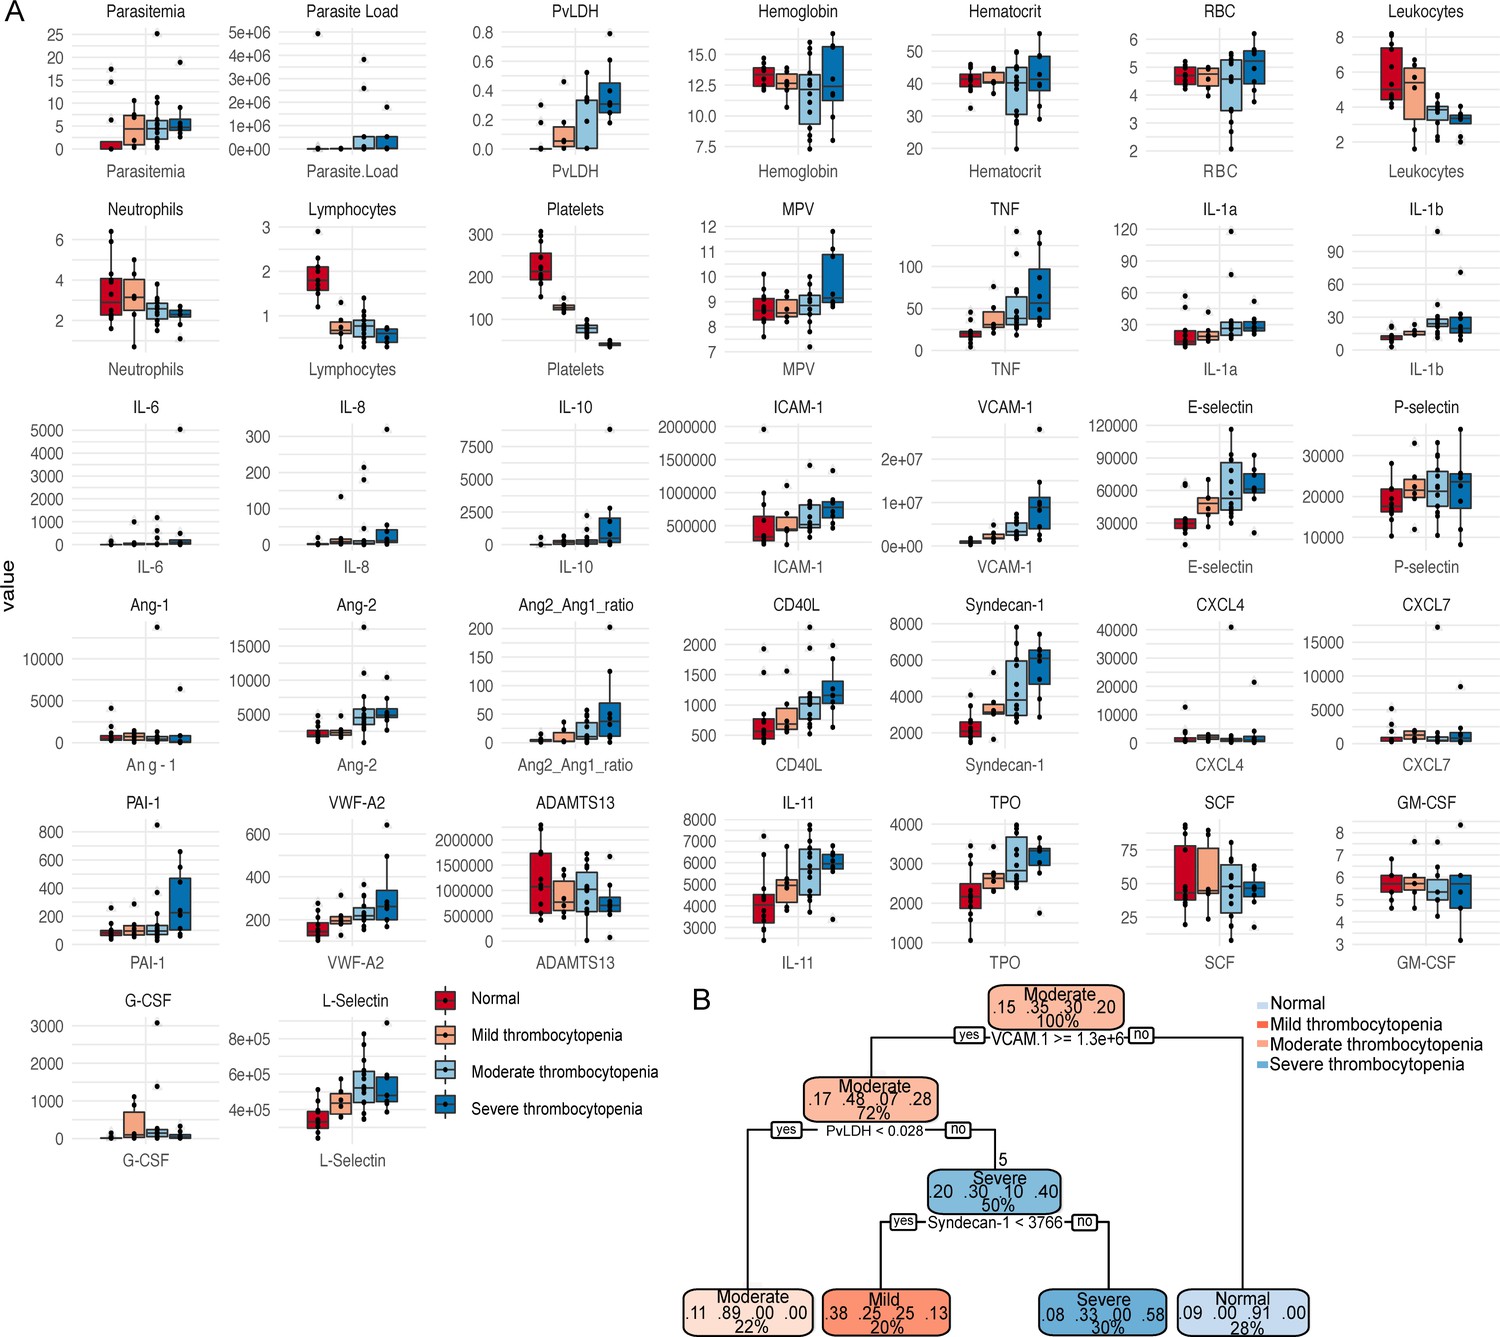
Validation of patients’ clusters and correlations when segregating patients based on thrombocytopenia severity.
Box plots showing (A) parasite parameters, clinical parameters, and biomarkers measured on plasma samples were generated segregating patients based on levels of thrombocytopenia severity (normal, mild, moderate, and severe) colour-coded. (B) Recursive partitioning classification tree model generated with the rpart function in R showing the high value of VCAM-1, P. vivax lactate dehydrogenase (PvLDH), and Syndecan-1 to predict thrombocytopenia severity in P. vivax patients. Cut-off values of the attribute that best divided groups were placed in the root of the tree according to the parameter value (pg/mL for soluble markers or O.D. for PvLDH).
Figure 6—figure supplement 3
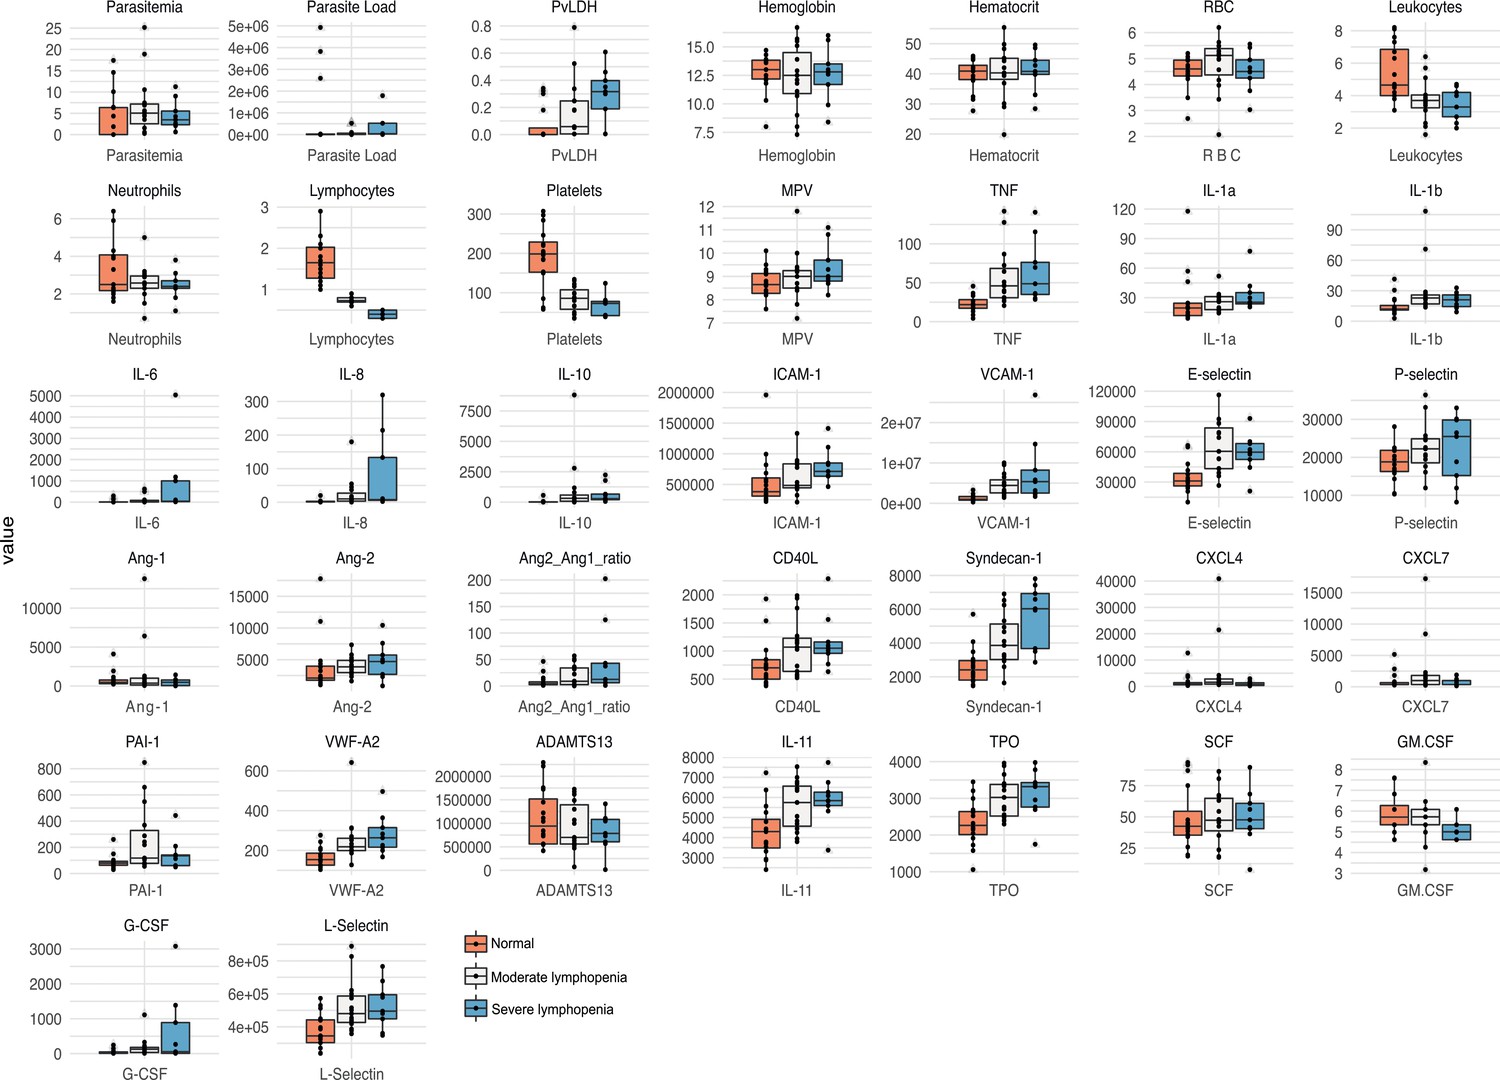
Validation of patients’ clusters and correlations when segregating patients based on lymphopenia severity.
Box plots showing parasite parameters, clinical parameters, and biomarkers measured on plasma samples were generated segregating patients based on levels of lymphopenia severity (normal, moderate, and severe) colour-coded.
Tables
Table 1
Demographic, parasite, and multiplexed microbead-based immunoassay (Luminex) data obtained from the plasma of a representative subset of 31 P. vivax patients and 9 healthy donors (controls).
| Parameters | Healthy donors (n = 36) | Symptomatic Pv patients (n = 79) | p-Value(Pv vs. control) |
|---|---|---|---|
| Median [IQ 25–75] | Median [IQ 25–75] | ||
| Age | 32 (23–49) | 36 (28–45) | 0.06 |
| Parasitaemia (103/mL) | - | 4.29 [1.86–6.62] | |
| Parasitaemia (%) | - | 0.76 [0.57–1.25] | |
| Parasite load (copies 18S RNA/mL) | - | 26,642 [9253-522,297] | |
| PvLDH (O.D.) | - | 0.18 [0.005–0.34] | |
| Plasma biomarkers | Healthy donors (n = 9) | Symptomatic Pv patients (n = 31) | p-Value(Pv vs. control) |
| TNF-α (pg/mL) | 17.2 [11.0–22.3] | 38.4 [30.0–69.6] | <0.0001 |
| IL-1α (pg/mL) | 11.9 [10.0–19.5] | 25.4 [19.8–33.5] | 0.0004 |
| IL-1β (pg/mL) | 12.0 [8.0–12.8] | 21.4 [14.5–27.6] | <0.0001 |
| IL-6 (pg/mL) | 3.0 [2.5–3.7] | 33.4 [7.6–133.1] | <0.0001 |
| IL-8 (pg/mL) | 2.2 [0.6–2.4] | 6.4 [2.7–19.9] | 0.0005 |
| IL-10 (pg/mL) | –* | 314 [169–562] | – |
| G-CSF (pg/mL) | 9.485 [9.485–9.485] | 101.5 [33.49–239.6] | <0.0001 |
| L-selectin (ng/mL) | 326 [287–391] | 481 [386–579] | 0.0019 |
| ICAM-1 (ng/mL) | 323 [260–464] | 634 [456–849] | 0.0026 |
| VCAM-1 (ng/mL) | 819 [623–959] | 2875 [1753–5108] | <0.0001 |
| E-Selectin (ng/mL) | 26.4 [22.5–33.7] | 56.7 [41.5–74.1] | 0.0001 |
| P-selectin (ng/mL) | 17.0 [15.4–20.6] | 22.2 [17.6–25.7] | 0.0621 |
| Angiopoietin-1 (ng/mL) | 0.4 [0.3–0.6] | 0.5 [0.2–0.9] | 0.8874 |
| Angiopoietin-2 (ng/mL) | 1.8 [1.5–2.1] | 4.3 [2.7–5.3] | 0.0003 |
| Ang-2:Ang-1 ratio | 4.2 [2.7–5.6] | 12.14 [2.7–40.2] | 0.03 |
| VWF-A2 (pg/mL) | 126 [120–150] | 218 [199–277] | <0.0001 |
| ADAMTS13 (ng/mL) | 1110 [483–1740] | 776 [572–1328] | 0.5485 |
| PAI-1 (pg/mL) | 78.9 [62.4–96.4] | 112 [69.3–242] | 0.1541 |
| CD40L (ng/mL) | 0.5 [0.4–0.7] | 1.0 [0.7–1.3] | 0.0001 |
| Syndecan-1 (ng/mL) | 1.8 [1.6–2.4] | 3.7 [2.9–6.0] | 0.0003 |
| IL-11 (ng/mL) | 3.5 [2.9–4.3] | 5.7 [4.7–6.4] | <0.0001 |
| TPO (ng/mL) | 2.0 [1.7–2.2] | 3.0 [2.6–3.4] | <0.0001 |
| CXCL4 (ng/mL) | 0.8 [0.6–1.2] | 1.4 [0.7–2.8] | 0.1236 |
| CXCL7 (ng/mL) | 0.4 [0.4–0.5] | 0.73 [0.4–1.7] | 0.1958 |
| SCF (pg/mL) | 47.61 [37.34–89.34] | 45.68 [36.22–61.39] | 0.1594 |
-
PvLDH: P. vivax lactate dehydrogenase.
-
* = under detection limit.
Key resources table
| Reagent type (species) or resource | Designation | Source or reference | Identifiers | Additional information |
|---|---|---|---|---|
| Biological sample (Homo sapiens) | Human umbilical vein endothelial cells (HUVEC) | Hematology Center, University of Campinas, Campinas, SP, Brazil | Primary cells isolated from the umbilical vein | |
| Antibody | ICAM-1 (mouse monoclonal) | Abcam | Cat. #ab2213;RRID:AB_302892 | Antibody clone MEM-111IF (1:100) |
| Antibody | VCAM-1 (mouse monoclonal) | Abcam | Cat. #ab212937;RRID:AB_2892824 | Antibody clone 1.4C3IF (1:500)FC (1:100) |
| Antibody | IgG1 isotype control (mouse monoclonal) | Dako | Cat. #X0931;RRID:AB_2892825 | IF (1:10) |
| Antibody | ICAM-1 (mouse monoclonal) | BioLegend | Cat. #322714;RRID:AB_535986 | Antibody clone HCD54FC (1:100) |
| Antibody | pLDH Vivax-specific (mouse monoclonal) | Vista Diagnostics International LLC, WA | Cat. #3h8;RRID:AB_2892826 | Antibody clone 3h8ELISA (1 μg/mL) |
| Antibody | pLDH detection antibody (goat monoclonal) | Vista Diagnostics International LLC, WA | Cat. #6c9;RRID:AB_2892827 | Antibody clone 6c9ELISA (1:4000) |
| Sequence-based reagent | qRT-PCR Oligonucleotides | This study | See Supplementary file 2 | |
| Commercial assay or kit | Customized multiplex suspension detection system | R&D Systems | ||
| Commercial assay or kit | Accutase Cell Detachment Solution | BioLegend | Cat. #423201 | |
| Chemical compound, drug | Fixable Viability Dye eFluor 506 | ThermoFisher | Cat. #65-0866-14 | |
| Software, algorithm | FlowJo software (v10) | Ashland, OR | https://www.flowjo.com | |
| Software, algorithm | RStudio software (v1.4.1106) | RStudio, Boston, MA | https://www.rstudio.com | |
| Software, algorithm | Cytoscape software (v3.8.1) | NIGMS, Bethesda, MD | https://cytoscape.org | |
| Software, algorithm | GraphPad Prism 9 (v9.1.1 (223)) | GraphPad Software, San Diego, CA | graphpad.com | |
| Software, algorithm | ImageJ software | NIH, Bethesda, MD | imagej.nih.gov |
Additional files
-
Supplementary file 1
Topological analysis of the network graphs of healthy donors and P. vivax patients.
- https://cdn.elifesciences.org/articles/71351/elife-71351-supp1-v2.docx
-
Supplementary file 2
Oligonucleotides sequences used in the qRT-PCRs.
- https://cdn.elifesciences.org/articles/71351/elife-71351-supp2-v2.docx
-
Transparent reporting form
- https://cdn.elifesciences.org/articles/71351/elife-71351-transrepform1-v2.docx
Download links
A two-part list of links to download the article, or parts of the article, in various formats.
Downloads (link to download the article as PDF)
Open citations (links to open the citations from this article in various online reference manager services)
Cite this article (links to download the citations from this article in formats compatible with various reference manager tools)
Total parasite biomass but not peripheral parasitaemia is associated with endothelial and haematological perturbations in Plasmodium vivax patients
eLife 10:e71351.
https://doi.org/10.7554/eLife.71351


