Risk of heart disease following treatment for breast cancer – results from a population-based cohort study
- Department of Epidemiology and Health Statistics, School of Public Health, Fujian Medical University, China
- Department of Medical Epidemiology and Biostatistics, Karolinska Institutet, Sweden
- Centre for Epidemiology and Evidence-Based Practice, Faculty of Medicine, University of Malaya, Malaysia
- Clinical Epidemiology and Biostatistics, School of Medical Sciences, Örebro University, Sweden
- Department of Oncology-Pathology, Karolinska Institutet, Sweden
- Health and Medical University, Germany
- Breast Cancer Center, Karolinska University Hospital, Sweden
- Karolinska Comprehensive Cancer Center, Sweden
- Department of Pediatrics, Örebro University Hospital, Sweden
- Department of Oncology, Södersjukhuset, Sweden
Figures
Figure 1
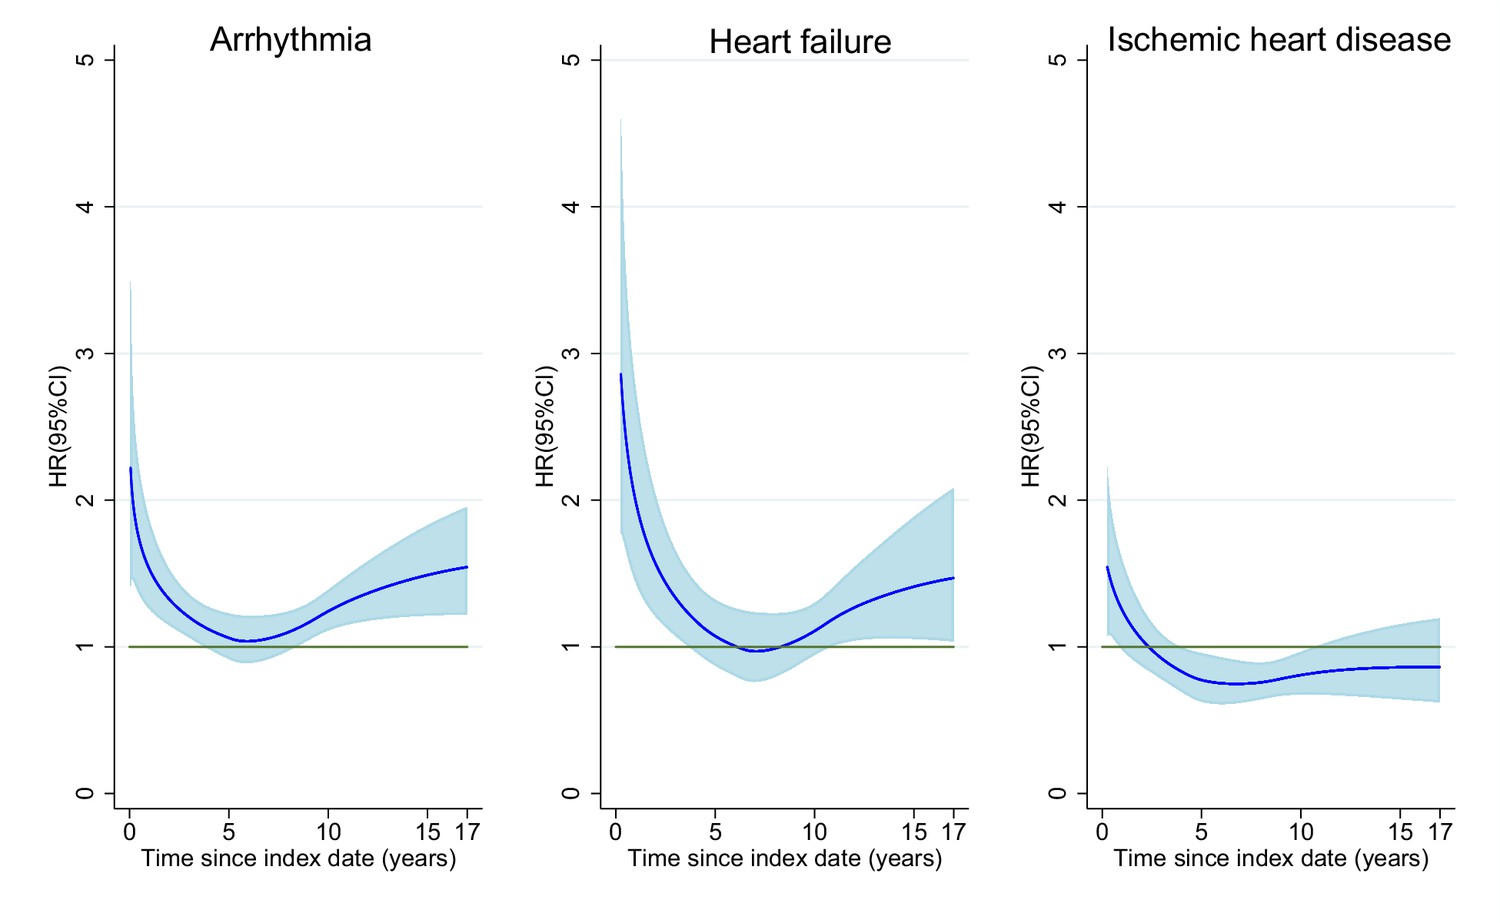
Time-dependent hazard ratio of heart diseases in breast cancer patients compared to age-matched women.
In all models, time since index date was the underlying time scale and a restricted cubic spline with four internal and two boundary knots (five degrees of freedom) placed at quintiles of the event times was used for the baseline hazard. Time-dependent effects were modelled by adding interaction terms with time using a second spline with three degrees of freedom.
-
Figure 1—source data 1
Summary data for Figure 1.
- https://cdn.elifesciences.org/articles/71562/elife-71562-fig1-data1-v2.xlsx
Appendix 1—figure 1
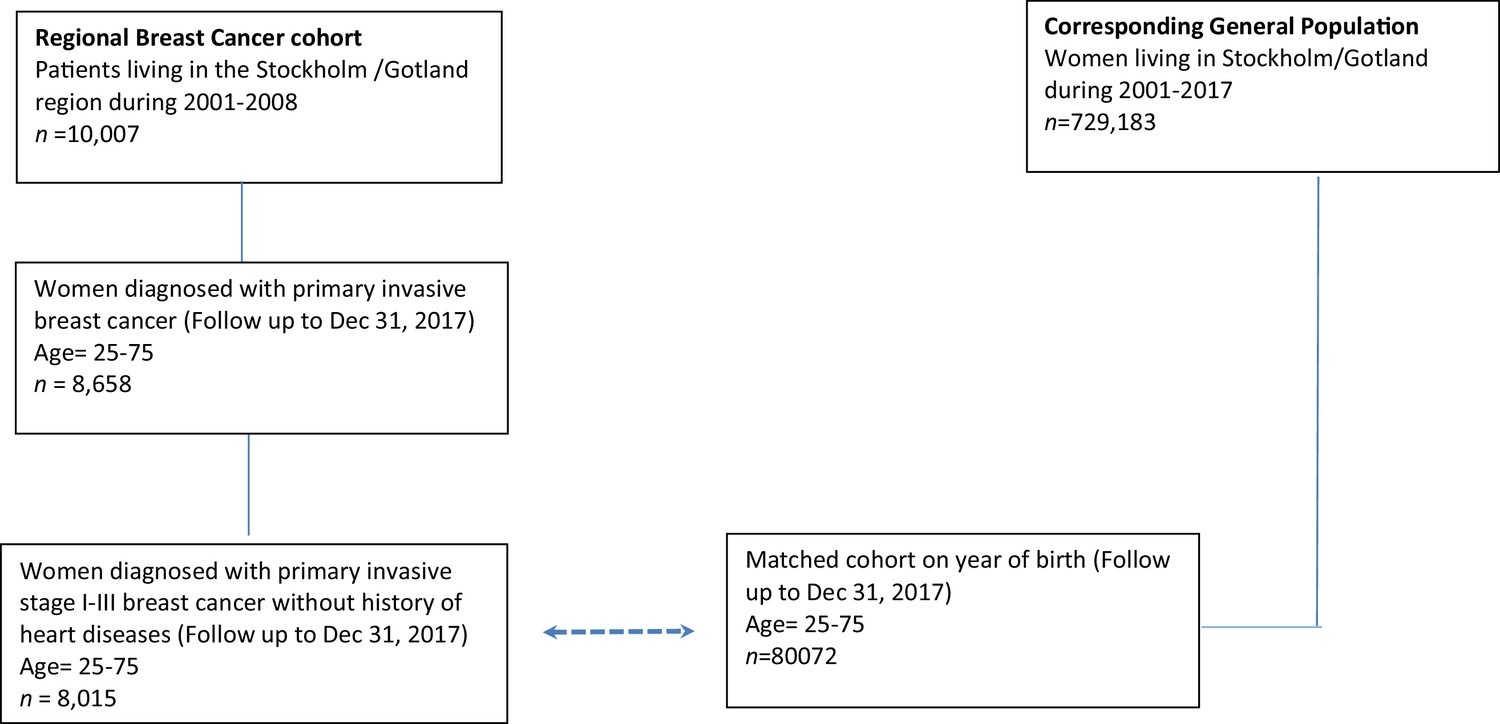
Flowchart of the data.
Appendix 3—figure 1
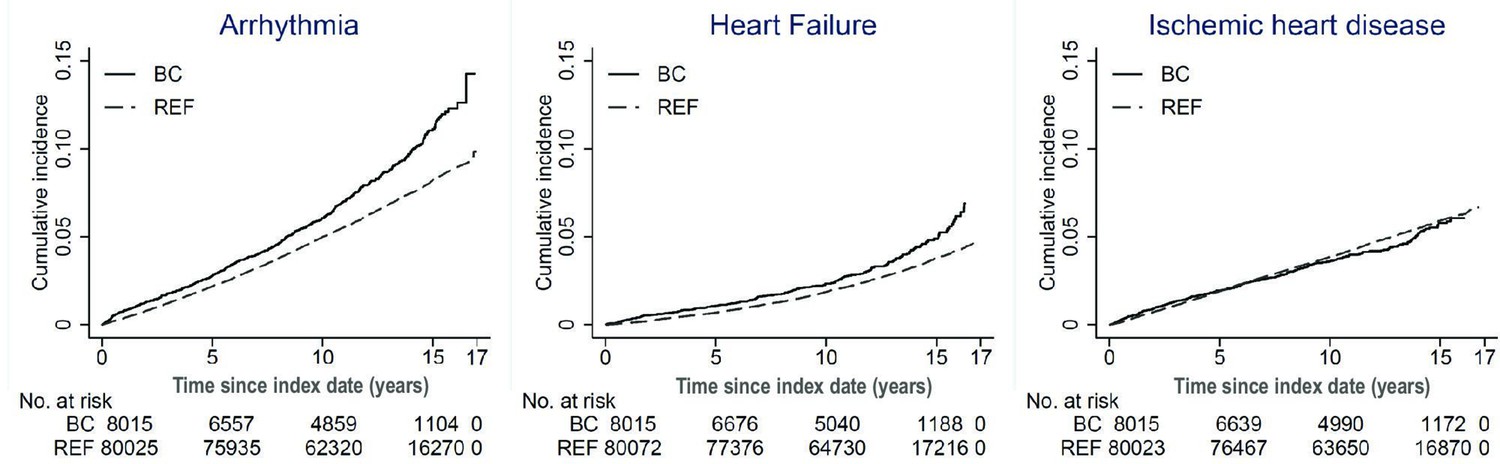
Cumulative incidence of heart disease in breast cancer patients and matched women.
Aalen-Johansen estimates of the cumulative risk of heart disease by time since index date, in breast cancer patients and matched women from the general population. BC: breast cancer; REF: reference women in the matched controls from the general population; No.: number.
Tables
Table 1
Descriptive characteristics of the study population.
| Characteristics | Overall (N = 8015) |
|---|---|
| Year of diagnosis % (N) | |
| 2001–2002 | 25.6 (2072) |
| 2003–2004 | 24.4 (1952) |
| 2005–2006 | 25.8 (2064) |
| 2007–2008 | 24.0 (1927) |
| Age at diagnosis % (N) | |
| <50 years | 23.0 (1842) |
| 50–65 years | 51.3 (4111) |
| >65 years | 25.7 (2062) |
| Menopausal status % (N) | |
| Premenopausal | 30.4 (2289) |
| Postmenopausal | 69.6 (5251) |
| Missing (N) | 475 |
| Stage % (N) | |
| Stage I | 48.2 (3690) |
| Stage II | 39.4 (3014) |
| Stage III | 12.4 (948) |
| Missing (N) | 363 |
| Tumor size % (N) | |
| ≤2 cm | 25.7 (2000) |
| 2–5 cm | 44.0 (3418) |
| > 5 cm | 30.3 (2351) |
| Missing (N) | 246 |
| Comorbidity % (N) | |
| None | 90.1 (7222) |
| 1 | 5.5 (439) |
| ≥2 | 4.4 (354) |
| History of hypertension | |
| No | 94.6 (7579) |
| Yes | 5.4 (436) |
| History of chronic pulmonary disease or tobacco abuse | |
| No | 96.6 (7746) |
| Yes | 3.4 (269) |
| Surgery % (N) | |
| No | 1.0 (79) |
| Yes, breast-conserving | 60.7 (4852) |
| Yes, mastectomy | 38.3 (3058) |
| Missing (N) | 26 |
| Radiotherapy % (N) | |
| No | 22.5 (1774) |
| Yes, left-sided | 37.5 (2962) |
| Yes, right-sided | 39.1 (3088) |
| Yes, both-sided | 0.85 (67) |
| Missing (N) | 124 |
| Chemotherapy % (N) | |
| No | 58.5 (4604) |
| Yes | 41.5 (3262) |
| Missing (N) | 149 |
| Hormone therapy % (N) | |
| No | 18.10 (1424) |
| Yes, tamoxifen | 53.0 (4247) |
| Yes, aromatase inhibitors | 19.3 (1550) |
| Yes, type unknown | 8.1 (645) |
| Missing (N) | 149 |
| Trastuzumab therapy % (N) * | |
| No | 87.3 (2180) |
| Yes | 12.7 (316) |
| Missing (N) | 1497 |
-
*
Missingness on individual variables is less than 5%, except for menopausal status (5.9%, N = 488). Treatment-specific analysis of trastuzumab was restricted to patients diagnosed between 2005 and 2008 (missingness = 37.5%, N = 1497).
Table 2
Hazard ratios for heart diseases in breast cancer patients compared to the matched cohort.
| Arrhythmia | Heart failure | Ischemic heart disease | ||||
|---|---|---|---|---|---|---|
| No. | HR (95% CI) | No. | HR (95% CI) | No. | HR (95% CI) | |
| Time since diagnosis | ||||||
| <1 year | 64 | 2.14 (1.63–2.81) | 22 | 2.71 (1.70–4.33) | 38 | 1.45 (1.03–2.04) |
| 1–2 years | 34 | 1.08 (0.76–1.53) | 19 | 2.07 (1.27–3.37) | 34 | 1.12 (0.79–1.61) |
| 2–5 years | 107 | 1.07 (0.88–1.30) | 38 | 1.14 (0.82–1.59) | 72 | 0.84 (0.66–1.07) |
| 5–10 years | 204 | 1.13 (0.98–1.30) | 78 | 1.02 (0.81–1.29) | 104 | 0.82 (0.67–1.00) |
| 10–17 years | 161 | 1.42 (1.21–1.67) | 86 | 1.28 (1.03–1.59) | 59 | 0.79 (0.61–1.03) |
-
Abbreviations: No. = number of cases. HR = hazard ratio. CI = confidence interval. The HRs are estimated using flexible parametric model and conditioned on matching criteria (year of birth). In all models, time since index date was the underlying time scale and a restricted cubic spline with four internal and two boundary knots (five degrees of freedom) placed at quintiles of the event times was used for the baseline hazard. All analyses were stratified by time since index date. Statistically significant results with p-value<0.05 are bolded.
Table 3
Hazard ratios for heart diseases in breast cancer patients by different adjuvant therapies.
| Total No. | HR (95% CI) for arrhythmia | HR (95% CI) for heart failure | HR (95% CI) for ischemic heart disease | |||||||
|---|---|---|---|---|---|---|---|---|---|---|
| Treatment variables | N | Model 1 | Model 2 | N | Model 1 | Model 2 | N | Model 1 | Model 2 | |
| Radiotherapy | ||||||||||
| Right-sided | 2948 | 216 | REF (1.00) | REF (1.00) | 80 | REF (1.00) | REF (1.00) | 99 | REF (1.00) | REF (1.00) |
| Left-sided | 3075 | 213 | 0.93 (0.77–1.13) | 0.93 (0.77–1.13) | 87 | 1.03 (0.76–1.40) | 1.07 (0.79–1.45) | 119 | 1.14 (0.87–1.49) | 1.16 (0.89–1.51) |
| Both-sided | 67 | 4 | 0.65 (0.24–1.76) | 0.63 (0.23–1.70) | 4 | 1.81 (0.66–4.95) | 1.75 (0.63–4.85) | 3 | 1.08 (0.34–3.40) | 0.98 (0.31–3.11) |
| Chemotherapy | ||||||||||
| No. | 4604 | 376 | REF (1.00) | REF (1.00) | 133 | REF (1.00) | REF (1.00) | 207 | REF (1.00) | REF (1.00) |
| Anthracyclines-based | 1426 | 83 | 1.18 (0.97–1.45) | 1.08 (0.84–1.39) | 51 | 2.30 (1.70–3.10) | 1.74 (1.20–2.52) | 44 | 1.31 (0.99–1.72) | 1.29 (0.92–1.81) |
| Anthracyclines + taxanes | 286 | 10 | 1.15 (0.63–2.10) | 1.01 (0.53–1.92) | 13 | 4.71 (2.57–8.63) | 3.09 (1.55–6.14) | 6 | 1.36 (0.63–2.93) | 1.29 (0.57–2.95) |
| CMF | 96 | 6 | 1.08 (0.55–2.14) | 1.04 (0.51–2.12) | 3 | 1.21 (0.36–4.00) | 0.90 (0.27–3.04) | 2 | 1.11 (0.49–2.51) | 1.04 (0.46–2.36) |
| Hormone therapy | ||||||||||
| No. | 1424 | 89 | REF (1.00) | REF (1.00) | 49 | REF (1.00) | REF (1.00) | 43 | REF (1.00) | REF (1.00) |
| Tamoxifen | 4247 | 298 | 0.91 (0.72–1.15) | 0.95 (0.74–1.23) | 99 | 0.57 (0.41–0.79) | 0.84 (0.58–1.20) | 142 | 0.91 (0.65–1.27) | 1.03 (0.71–1.48) |
| Aromatase inhibitors | 1550 | 119 | 1.02 (0.77–1.35) | 0.99 (0.74–1.32) | 61 | 1.05 (0.71–1.56) | 1.08 (0.72–1.61) | 85 | 1.53 (1.05–2.24) | 1.52 (1.03–2.26) |
| Trastuzumab* | ||||||||||
| No. | 2137 | 126 | REF (1.00) | REF (1.00) | 38 | REF (1.00) | REF (1.00) | 60 | REF (1.00) | REF (1.00) |
| Yes | 304 | 17 | 1.15 (0.70–1.92) | 1.50 (0.79–2.83) | 13 | 3.05 (1.62–5.76) | 2.34 (1.05–5.22) | 12 | 1.75 (0.94–3.27) | 1.83 (0.85–3.96) |
-
Total No. refers to the total number of patients. N events refers to the number of observed cases. HR = hazard ratio; CI = confidence interval; CMF = cyclophosphamide, methotrexate, and fluorouracil; REF: reference women in the matched controls from the general population. Hazard ratios are estimated from Cox proportional hazards models with time since diagnosis as underlying time scale. Hazard ratios for model 1 are adjusted for age and calendar period. Hazard ratios for model 2 are multivariable adjusted including age at diagnosis, year of diagnosis, menopausal status, Charlson comorbidity index, clinical stage, tumor size, type of surgery, history of hypertension, chronic pulmonary disease and tobacco abuse, and all treatment variables listed in the table.
-
*
Treatment-specific analysis of trastuzumab was restricted to patients diagnosed between 2005 and 2008.
Appendix 2—table 1
ICD codes used in the analyses.
| Disease codes | ICD-10 | ICD-9 |
|---|---|---|
| Arrhythmia | I47, I48, I49 | 427 |
| Atrial fibrillation | I48 | 427D |
| Tachycardia and other cardiac arrhythmias | I47, I49 | 427A–C, 427E–J |
| Heart failure | I50 | 428A, 428B, 428X |
| Ischemic heart disease | I20–I25 | 410–414 |
| Myocardial infarction | I21, I22 | 410 |
| Angina pectoris | I20 | 411B, 413, 414A |
| Hypertension | I10–I15 | 401–405 |
| Tobacco abuse and Chronic Pulmonary Disease | J40–J47, J60–J67, F17, I278, I279, J684, J701, J703 | 490–496,500–505, 416W, 416X, 506E, 508B, 508W, 305B |
-
ICD = International Classification of Diseases.
Appendix 2—table 2
Cumulative incidence estimates of heart diseases in breast cancer patients and age matched controls.
| Cumulative incidence, % (95% CI) | ||||||
|---|---|---|---|---|---|---|
| 6 months | 1 year | 2 years | 5 years | 10 years | 15 years | |
| Arrhythmia | ||||||
| Breast cancer | 0.49 (0.35–0.66) | 0.81 (0.63–1.02) | 1.25 (1.02–1.52) | 2.77 (2.41–3.16) | 6.04 (5.49–6.63) | 11.03 (10.04–12.08) |
| Matched control | 0.20 (0.17–0.23) | 0.38 (0.34–0.42) | 0.79 (0.73–0.85) | 2.18 (2.08–2.29) | 4.98 (4.83–5.13) | 8.21 (7.99–8.45) |
| Heart failure | ||||||
| Breast cancer | 0.09 (0.04–0.18) | 0.28 (0.18–0.42) | 0.53 (0.38–0.71) | 1.06 (0.85–1.32) | 2.32 (1.98–2.70) | 4.80 (4.13–5.54) |
| Matched control | 0.05 (0.03–0.06) | 0.10 (0.08–0.13) | 0.22 (0.19–0.26) | 0.68 (0.63–0.74) | 1.87 (1.77–1.96) | 3.78 (3.62–3.95) |
| Ischemic heart disease | ||||||
| Breast cancer | 0.26 (0.17–0.40) | 0.48 (0.35–0.65) | 0.92 (0.73–1.16) | 1.93 (1.64–2.27) | 3.59 (3.17–4.05) | 5.68 (4.98–6.44) |
| Matched control | 0.13 (0.11–0.16) | 0.33 (0.29–0.37) | 0.72 (0.67–0.78) | 1.91 (1.81–2.00) | 3.85 (3.72–3.99) | 5.90 (5.71–6.09) |
-
Abbreviations: CI = confidence interval. Cumulative incidence estimates of heart diseases in all breast cancer patients (N = 8015) at different time-points following the index date ( = date of diagnosis in breast cancer patients). Cumulative incidence estimates are obtained from Aalen-Johansen estimation.
Appendix 2—table 3
Hazard ratios for heart diseases by different adjuvant therapies and time since diagnosis.
| HR (95% CI) for arrhythmia | HR (95% CI) for heart failure | HR (95% CI) for ischemic heart disease | ||||
|---|---|---|---|---|---|---|
| Treatment variables | <10 years | >10 years | <10 years | >10 years | <10 years | >10 years |
| Radiotherapy | ||||||
| Right-sided | REF (1.00) | REF (1.00) | REF (1.00) | REF (1.00) | REF (1.00) | REF (1.00) |
| Left-sided | 0.99 (0.79–1.24) | 0.80 (0.57–1.14) | 1.13 (0.77–1.66) | 0.94 (0.56–1.56) | 1.13 (0.84–1.53) | 1.29 (0.70–2.37) |
| Both-sided | 0.26 (0.04–1.90) | 1.01 (0.30–3.36) | 1.49 (0.36–6.24) | 2.37 (0.54–10.41) | 0.84 (0.20–3.43) | 1.64 (0.21–12.89) |
| Chemotherapy | ||||||
| No | REF (1.00) | REF (1.00) | REF (1.00) | REF (1.00) | REF (1.00) | REF (1.00) |
| Anthracyclines-based | 1.08 (0.81–1.46) | 1.07 (0.65–1.76) | 1.75 (1.11–2.76) | 1.66 (0.86–3.19) | 1.27 (0.87–1.85) | 1.36 (0.60–3.09) |
| Anthracyclines + taxanes | 1.02 (0.51–2.01) | 0.87 (0.13–5.77) | 3.72 (1.72–8.03) | 0.00 (0.00–0.00) | 1.38 (0.60–3.18) | 0.00 (0.00–0.00) |
| CMF | 1.24 (0.59–2.61) | 0.74 (0.18–3.15) | 1.16 (0.33–4.05) | 0.00 (0.00–0.00) | 0.97 (0.33–2.84) | 1.17 (0.16–8.41) |
| Hormone therapy | ||||||
| No | REF (1.00) | REF (1.00) | REF (1.00) | REF (1.00) | REF (1.00) | REF (1.00) |
| Tamoxifen | 0.91 (0.67–1.23) | 1.08 (0.67–1.73) | 0.76 (0.49–1.20) | 0.98 (0.52–1.84) | 0.93 (0.62–1.39) | 1.50 (0.64–3.53) |
| Aromatase inhibitors | 0.97 (0.70–1.36) | 1.05 (0.56–1.95) | 0.93 (0.58–1.49) | 1.47 (0.66–3.27) | 1.47 (0.96–2.24) | 1.31 (0.43–4.01) |
| Trastuzumab * | ||||||
| No | REF (1.00) | REF (1.00) | REF (1.00) | REF (1.00) | REF (1.00) | REF (1.00) |
| Yes | 1.56 (0.82–2.97) | 0.00 (0.00–0.00) | 2.60 (1.14–5.89) | 0.00 (0.00–0.00) | 1.71 (0.76–3.87) | 6.95 (0.56–85.58) |
-
HR = hazard ratio; CI = confidence interval. Hazard ratios are estimated from Cox proportional hazards models with time since diagnosis as underlying time scale. Hazard ratios are multivariable adjusted including age at diagnosis, year of diagnosis, menopausal status, Charlson comorbidity index, clinical stage, type of surgery, hypertension, chronic pulmonary disease and tobacco abuse, and all treatment variables listed in the table. * Treatment-specific analysis of trastuzumab was restricted to patients diagnosed between 2005 and 2008.
Additional files
-
Transparent reporting form
- https://cdn.elifesciences.org/articles/71562/elife-71562-transrepform1-v2.docx
-
Source code 1
STATA script for the analyses.
- https://cdn.elifesciences.org/articles/71562/elife-71562-code1-v2.zip
Download links
A two-part list of links to download the article, or parts of the article, in various formats.
Downloads (link to download the article as PDF)
Open citations (links to open the citations from this article in various online reference manager services)
Cite this article (links to download the citations from this article in formats compatible with various reference manager tools)
Risk of heart disease following treatment for breast cancer – results from a population-based cohort study
eLife 11:e71562.
https://doi.org/10.7554/eLife.71562


