Transmission networks of SARS-CoV-2 in Coastal Kenya during the first two waves: A retrospective genomic study
- Kenya Medical Research Institute (KEMRI)-Wellcome Trust Research Programme, Kenya
- Pwani University, Kenya
- Spatial Epidemiology Lab (SpELL), Université Libre de Bruxelles, Belgium
- Department of Microbiology, Immunology and Transplantation, Rega Institute, Laboratory for Clinical and Epidemiological Virology, KU Leuven, University of Leuven, Belgium
- Ministry of Health, Kenya
- Nuffield Department of Medicine, University of Oxford, United Kingdom
- Medical Research Centre (MRC)/ Uganda Virus Research Institute, Uganda
- MRC-University of Glasgow Centre for Virus Research, United Kingdom
- University of Warwick, United Kingdom
Figures
Figure 1

The severe acute respiratory syndrome coronavirus 2 (SARS-CoV-2) epidemic in Kenya and government response.
(A) The reported daily new cases in Kenya from March 2020 to February 2021 shown as 7-day-rolling average demonstrating the first two national SARS-CoV-2 waves of infections. (B) The total reported daily cases for Coastal Kenya counties during the study period shown as 7-day-rolling average per million people. (C) The Kenya government COVID-19 intervention level during the study period as summarized by the Oxford Stringency Index (SI) (Hale et al., 2021).
-
Figure 1—source data 1
Number of daily new cases of severe acute respiratory syndrome coronavirus 2 (SARS-CoV-2) in Kenya up to February 26, 2021, and the corresponding 7-day-rolling average.
- https://cdn.elifesciences.org/articles/71703/elife-71703-fig1-data1-v2.csv
-
Figure 1—source data 2
Number of daily positive tests per million people for the Coastal Kenya region (all six counties combined).
- https://cdn.elifesciences.org/articles/71703/elife-71703-fig1-data2-v2.csv
-
Figure 1—source data 3
Kenya government Coronavirus Disease 2019 (COVID-19) restrictions stringency index during the study period.
- https://cdn.elifesciences.org/articles/71703/elife-71703-fig1-data3-v2.csv
Figure 2 with 1 supplement
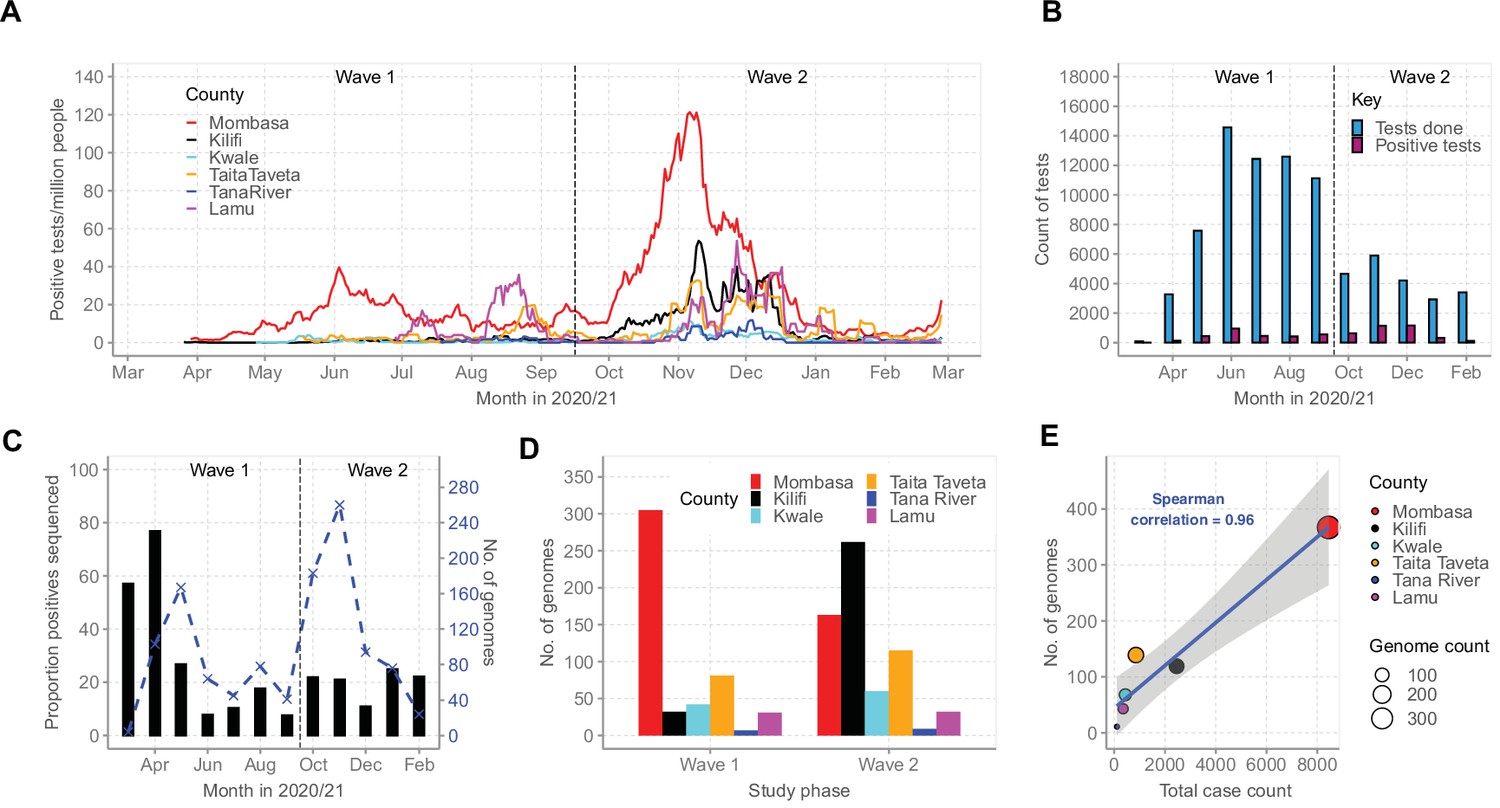
Severe acute respiratory syndrome coronavirus 2 (SARS-CoV-2) cases on the Kenyan Coast.
(A) The epidemic curves for each of the six Coastal Kenya counties derived from the daily positive case numbers, 7-day-rolling average, as reported by the Ministry of Health. (B) The monthly count of SARS-CoV-2 RT-PCR tests undertaken at the KEMRI-Wellcome Trust Research Programme (KWTRP) and those positive during the study period. (C) The monthly proportion (black bars, primary y-axis) and number (dashed blue line, secondary y-axis) of samples sequenced from total SARS-CoV-2 positives detected at KWTRP. (D) County distribution of the sequenced 1139 samples by wave number. (E) Linear regression fit of the number of Ministry of Health-reported Coronavirus Disease 2019 (COVID-19) cases in the six Coastal Kenya counties as of February 26, 2021, against the number of SARS-CoV-2 genome sequences obtained at KWTRP during the period.
-
Figure 2—source data 1
Number of daily positive tests per million people for each of the six Coastal Kenya counties.
- https://cdn.elifesciences.org/articles/71703/elife-71703-fig2-data1-v2.csv
-
Figure 2—source data 2
Total monthly severe acute respiratory syndrome coronavirus 2 (SARS-CoV-2) tests at KEMRI-Wellcome Trust Research Programme (KWTRP) and identified positives.
- https://cdn.elifesciences.org/articles/71703/elife-71703-fig2-data2-v2.csv
-
Figure 2—source data 3
Monthly proportion of positive samples whole genome sequenced from the positive tests at KEMRI-Wellcome Trust Research Programme (KWTRP).
- https://cdn.elifesciences.org/articles/71703/elife-71703-fig2-data3-v2.csv
-
Figure 2—source data 4
Number of genomes available across the six coastal counties during the two national waves of infections.
- https://cdn.elifesciences.org/articles/71703/elife-71703-fig2-data4-v2.csv
-
Figure 2—source data 5
Total case count and number genomes available from the six coastal counties.
- https://cdn.elifesciences.org/articles/71703/elife-71703-fig2-data5-v2.csv
Figure 2—figure supplement 1
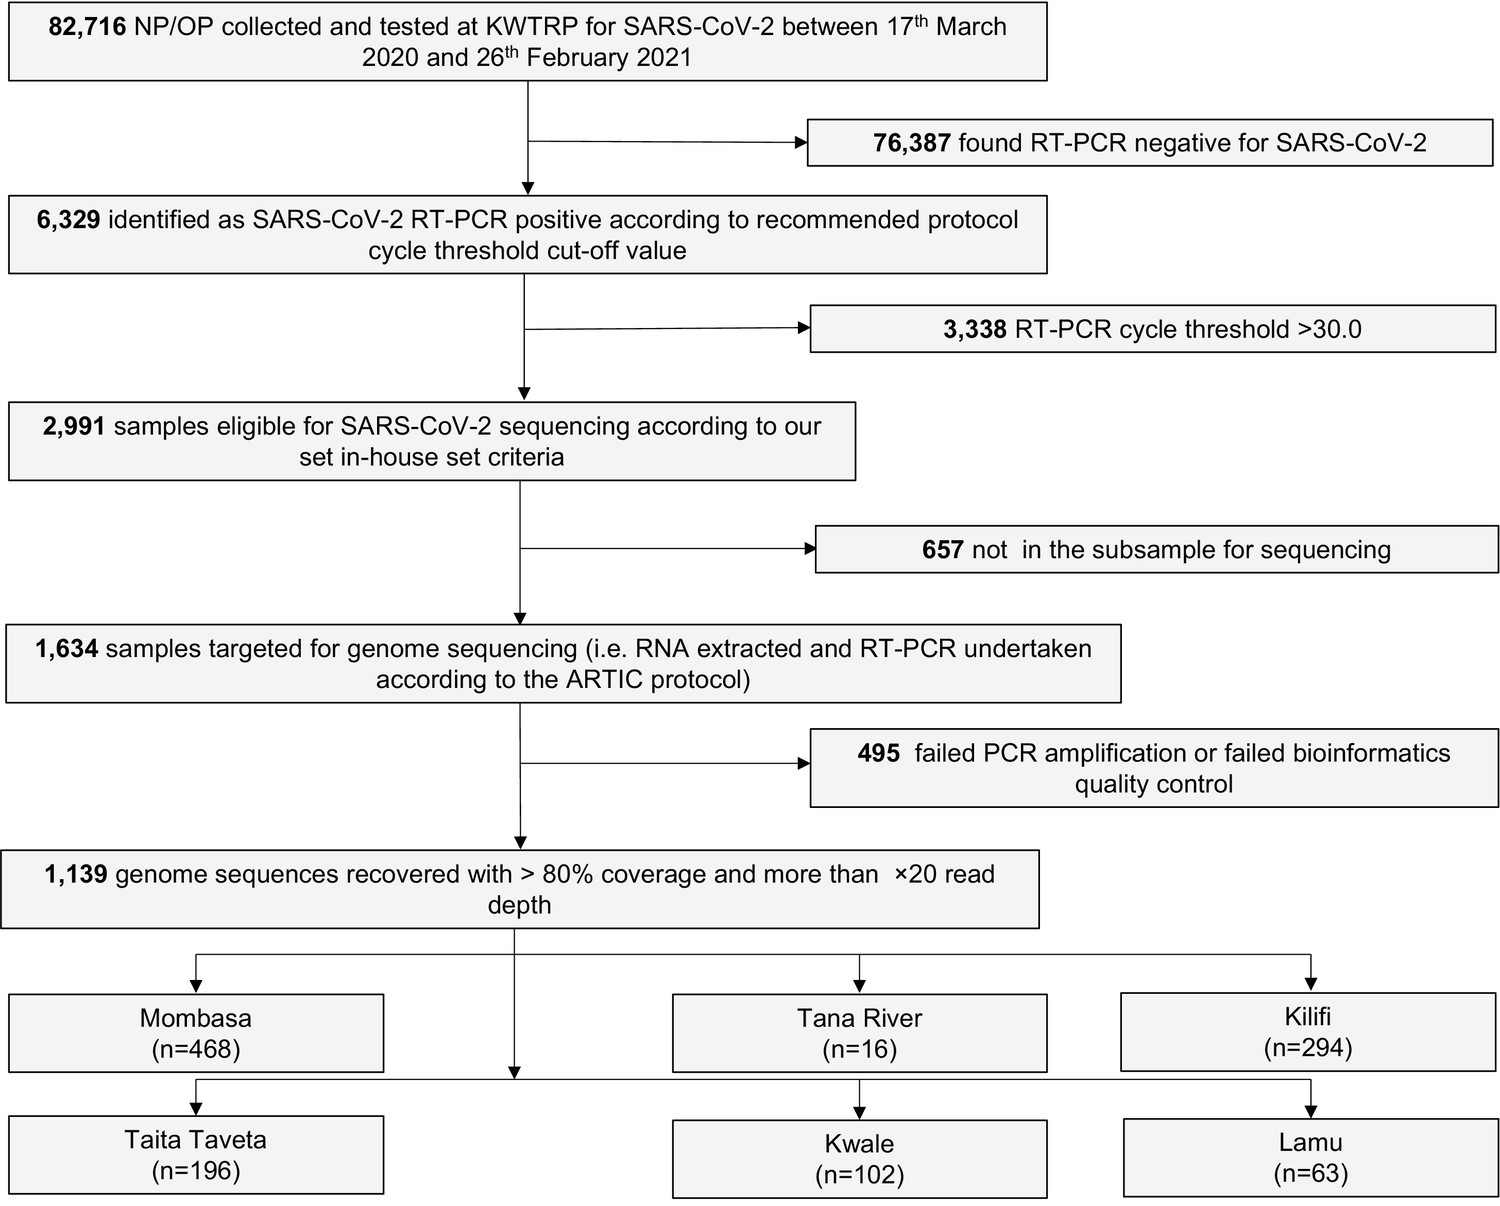
Laboratory flow of samples analysed in this study.
Figure 3
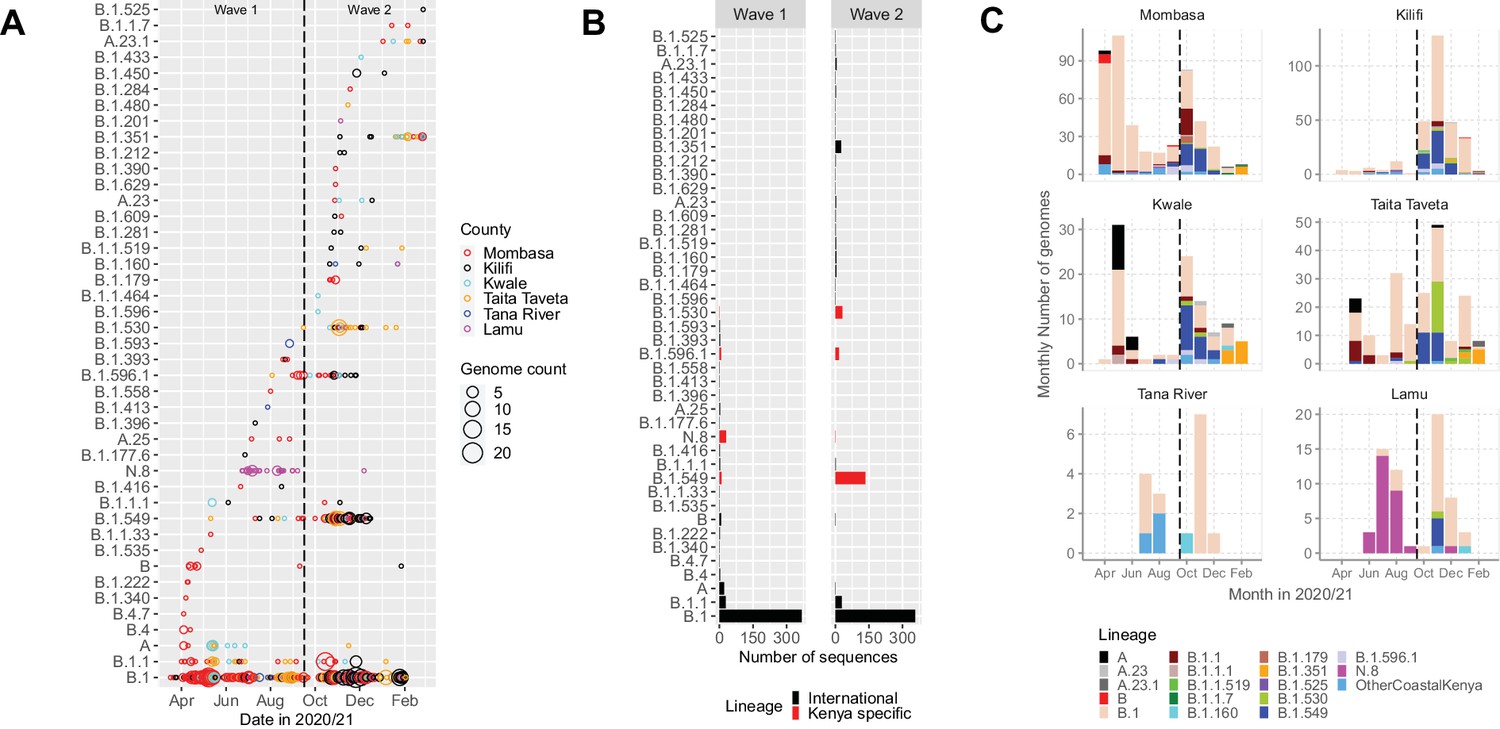
Lineage introductions and temporal dynamics in Coastal Kenya.
(A) Timing of detections of severe acute respiratory syndrome coronavirus 2 (SARS-CoV-2) Pango lineages in the sequenced 1139 Coastal Kenya samples. The circle size scaled by number of daily detections. The vertical dashed line demarcates the date of transition from Wave 1 to Wave 2. (B) Cumulative detections by Pango lineage detections by wave number. The bars are coloured by known information about the lineages; Kenya specific (B.1.530, B.1.549, B.1.596.1, and N.8, red bars) or international lineages (black bars). (C) Monthly distribution of the common lineages identified across the six counties presented as raw counts of the sequenced infections. Lineages detected in less than four cases or not considered a variant of concern (VOC) or variant of interest (VOI) were put together and referred to as ‘other Coastal Kenya lineages’. This group comprises 26 lineages, namely, A.25, B.1.1.33, B.1.1.464, B.1.177.6, B.1.201, B.1.212, B.1.222, B.1.281, B.1.284, B.1.340, B.1.390, B.1.393, B.1.396, B.1.413, B.1.416, B.1.433, B.1.450, B.1.480, B.1.535, B.1.558, B.1.593, B.1.596, B.1.609, B.1.629, B.4, and B.4.7.
-
Figure 3—source data 1
The total daily number of sequenced cases for each identified lineage across each of the six coastal counties.
- https://cdn.elifesciences.org/articles/71703/elife-71703-fig3-data1-v2.csv
-
Figure 3—source data 2
Total cases sequenced for each 43 identified lineages in the two waves of infection in Kenya.
- https://cdn.elifesciences.org/articles/71703/elife-71703-fig3-data2-v2.csv
-
Figure 3—source data 3
The monthly number of cases for each lineage across the two waves of infection in Kenya.
- https://cdn.elifesciences.org/articles/71703/elife-71703-fig3-data3-v2.csv
Figure 4 with 2 supplements
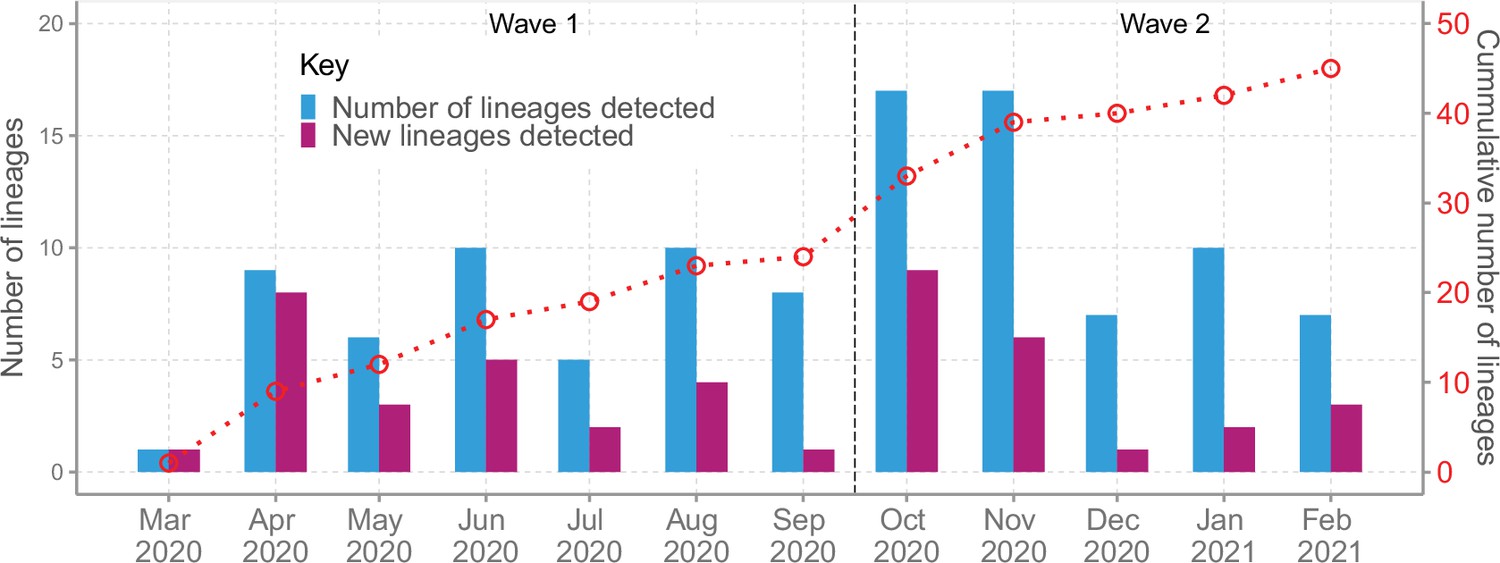
Lineage detection patterns in Coastal Kenya showing monthly count of total detected lineages, detected new lineages, and commutative total of detected lineages in Coastal Kenya across the study period (secondary axis).
-
Figure 4—source data 1
New, total circulating and cumulative Pango lineage counts by month in Coastal Kenya.
- https://cdn.elifesciences.org/articles/71703/elife-71703-fig4-data1-v2.csv
-
Figure 4—source data 2
Distribution of the detected Pango lineages by travel history information in Coastal Kenya.
- https://cdn.elifesciences.org/articles/71703/elife-71703-fig4-data2-v2.xlsx
Figure 4—figure supplement 1
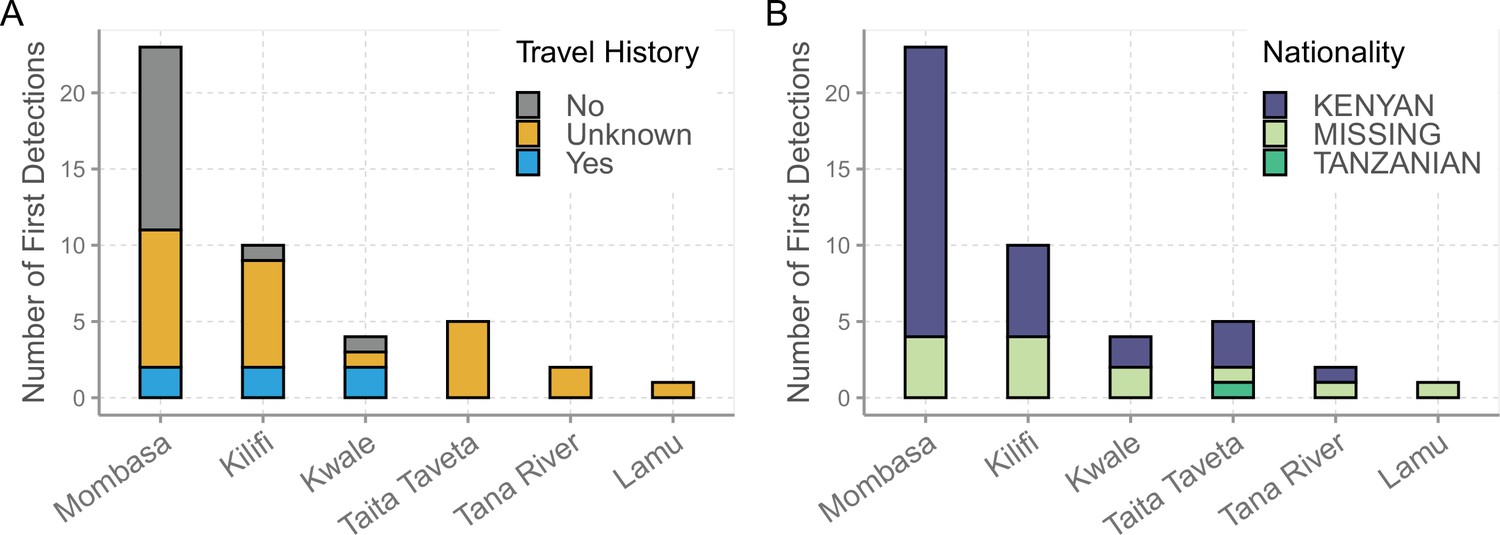
Demographic characteristics of the sequenced index cases of the 43 lineages identified in Coastal Kenya.
(A) The travel history distribution.and (B) the nationality distribution.
Figure 4—figure supplement 2
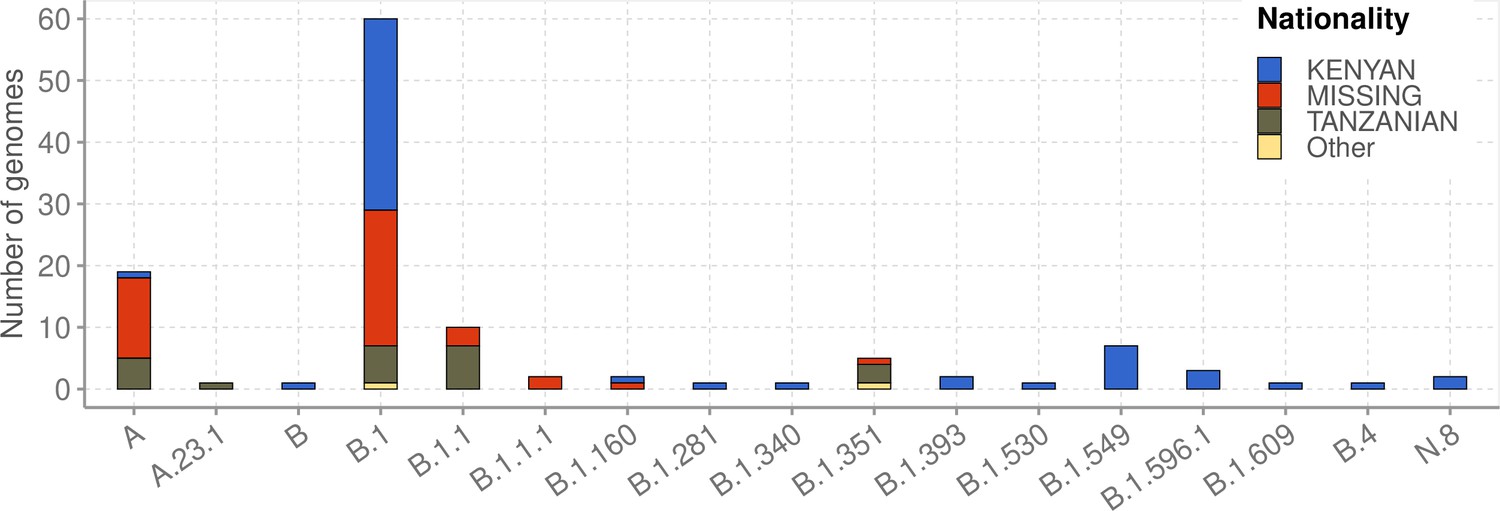
Lineages detected among individuals who reported a recent international travel history (n = 119) and their distribution by nationality.
Figure 5 with 2 supplements
Investigation of lineage spatial temporal dynamics at widening scales of observation.
(A) Monthly prevalence of detected lineages in Coastal Kenya from the sequenced 1139 genomes. (B) Monthly prevalence of detected lineages in Kenya (outside coastal counties) from 605 contemporaneous genomes data is available in GISAID. (C) Monthly prevalence of detected lineages in Eastern Africa from 3531 contemporaneous genomes from 10 countries whose contemporaneous data are available in GISAID. The included countries were Comoros, Ethiopia, Madagascar, Malawi, Mozambique, Reunion, Rwanda, Uganda, Zambia, and Zimbabwe. (D), Monthly distribution of detected lineages in African countries (excluding Eastern Africa). A total of 14,874 contemporaneous genomes from 37 countries that were available in GISAID are included in the analysis. (E) Monthly prevalence of detected lineages in a global subsample of 19,993 contemporaneous genomes from 147 countries that were compiled from GISAID (see detail in ‘Methods’ section). Genomes from African samples are excluded in this panel. (F) Includes all genomes analysed from the scales (A–E). Lineages not among the top 10 in at least one of the five scales of observation investigated have been lumped together as ‘Other lineages’.
-
Figure 5—source data 1
Monthly counts for the top lineages observed at the different scales of observation analysed.
- https://cdn.elifesciences.org/articles/71703/elife-71703-fig5-data1-v2.csv
Figure 5—figure supplement 1
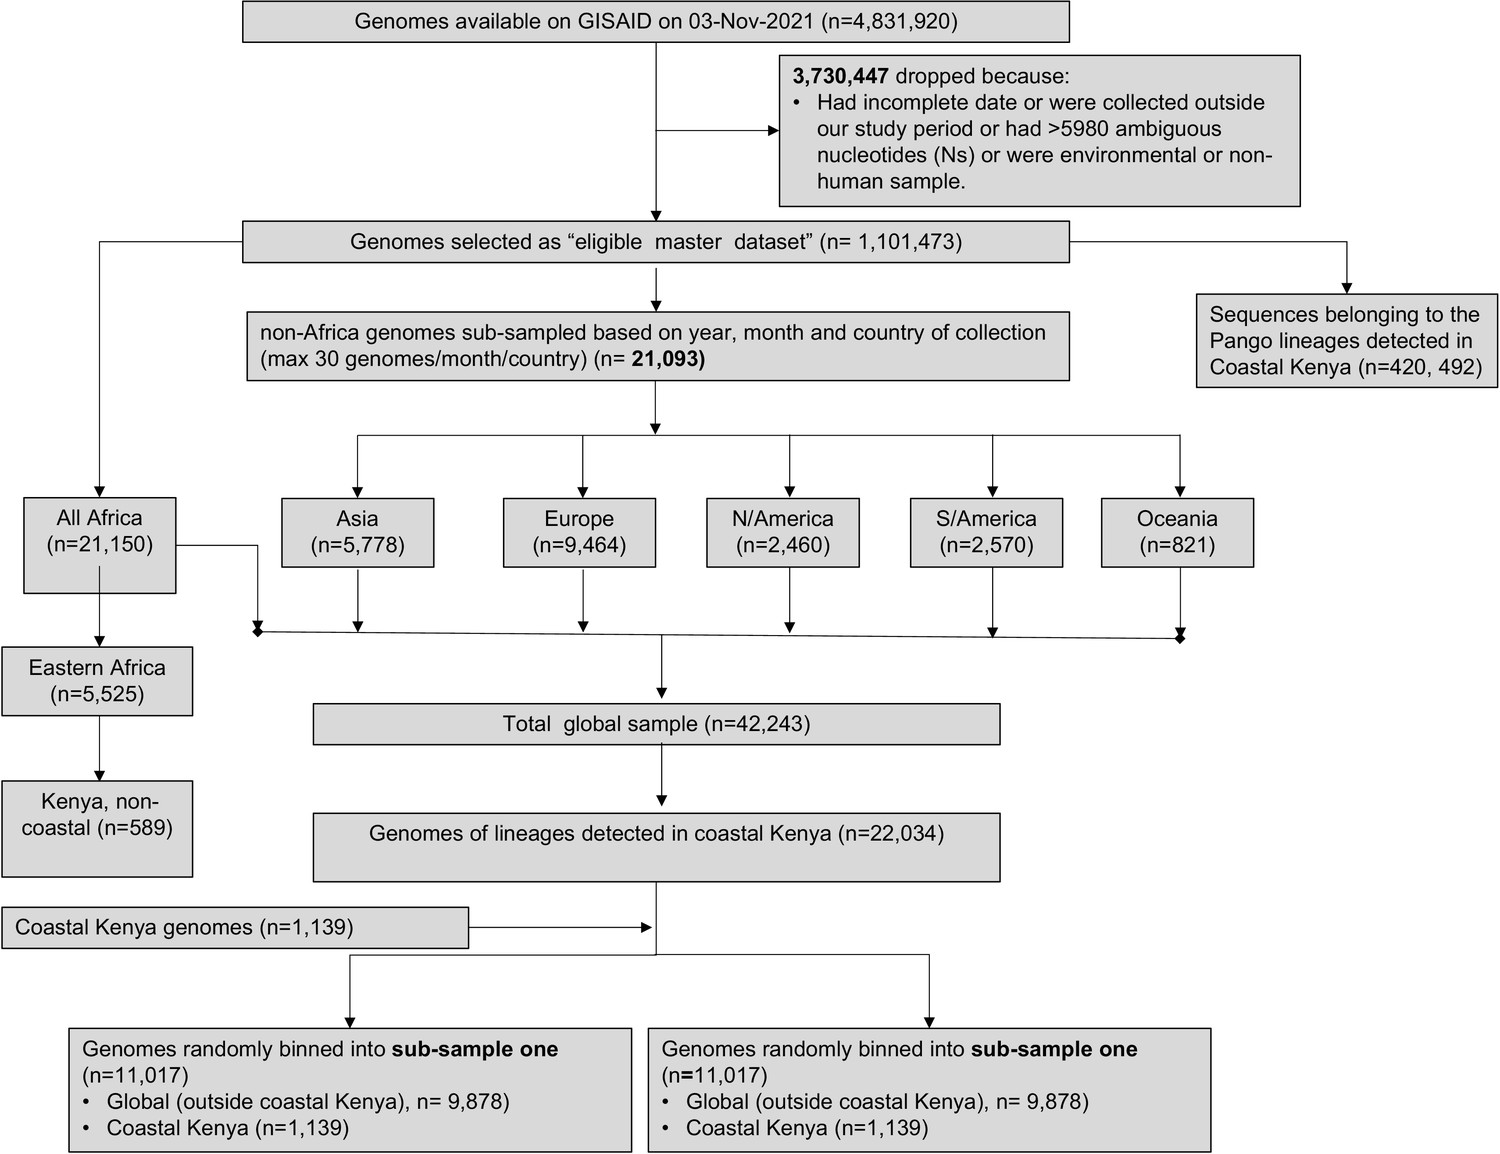
Flow of the genomes retrieved from GISAID and used in the comparative genomic epidemiology for lineage dynamics analysis and global context of the Coastal Kenya genomes.
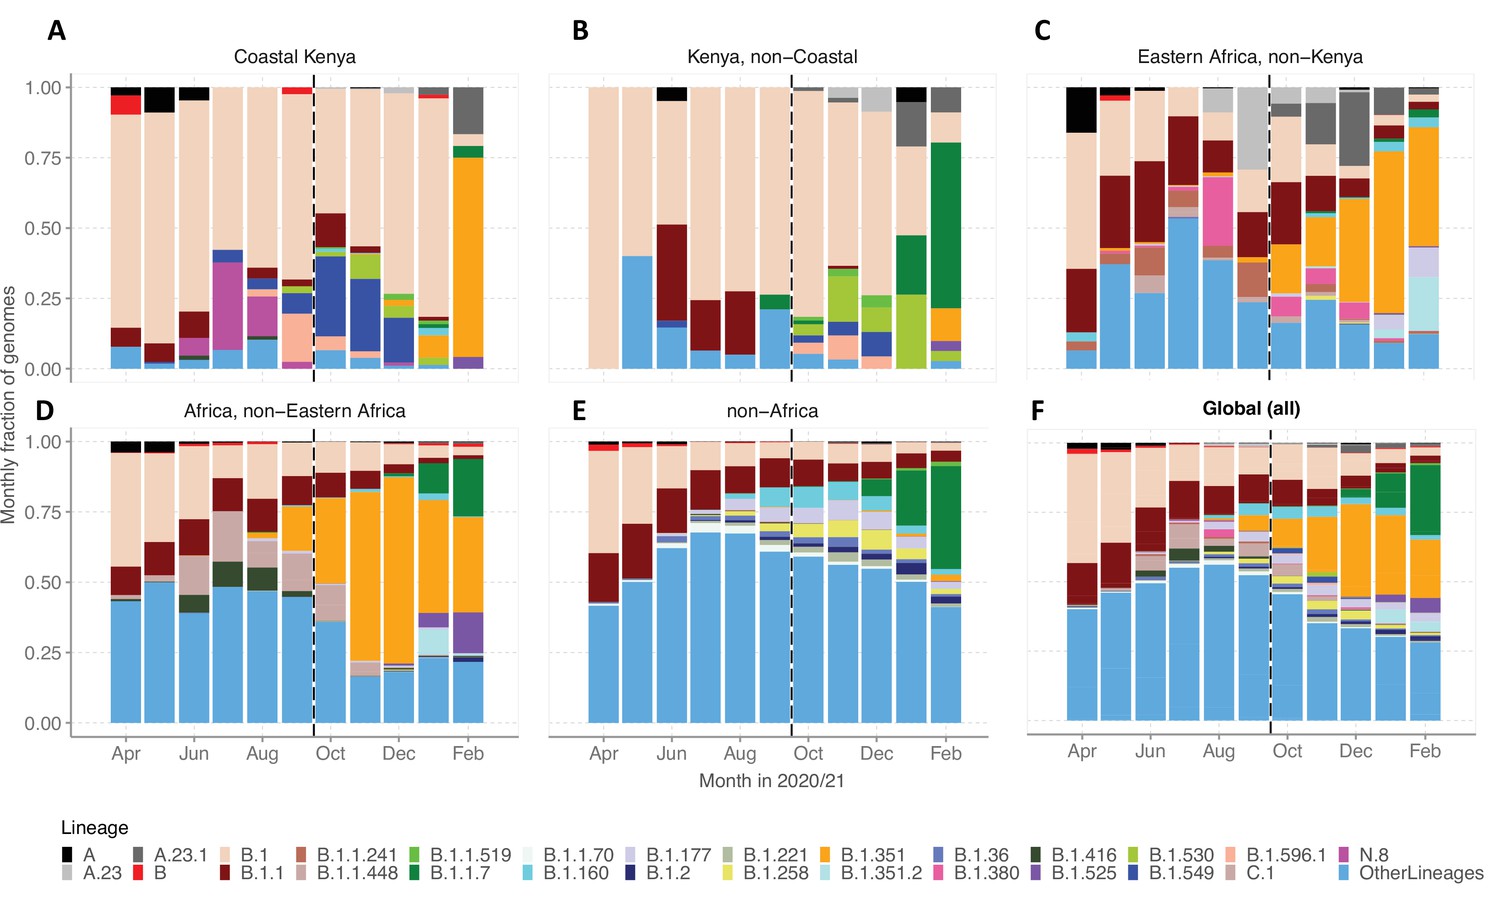
Figure 5—figure supplement 2
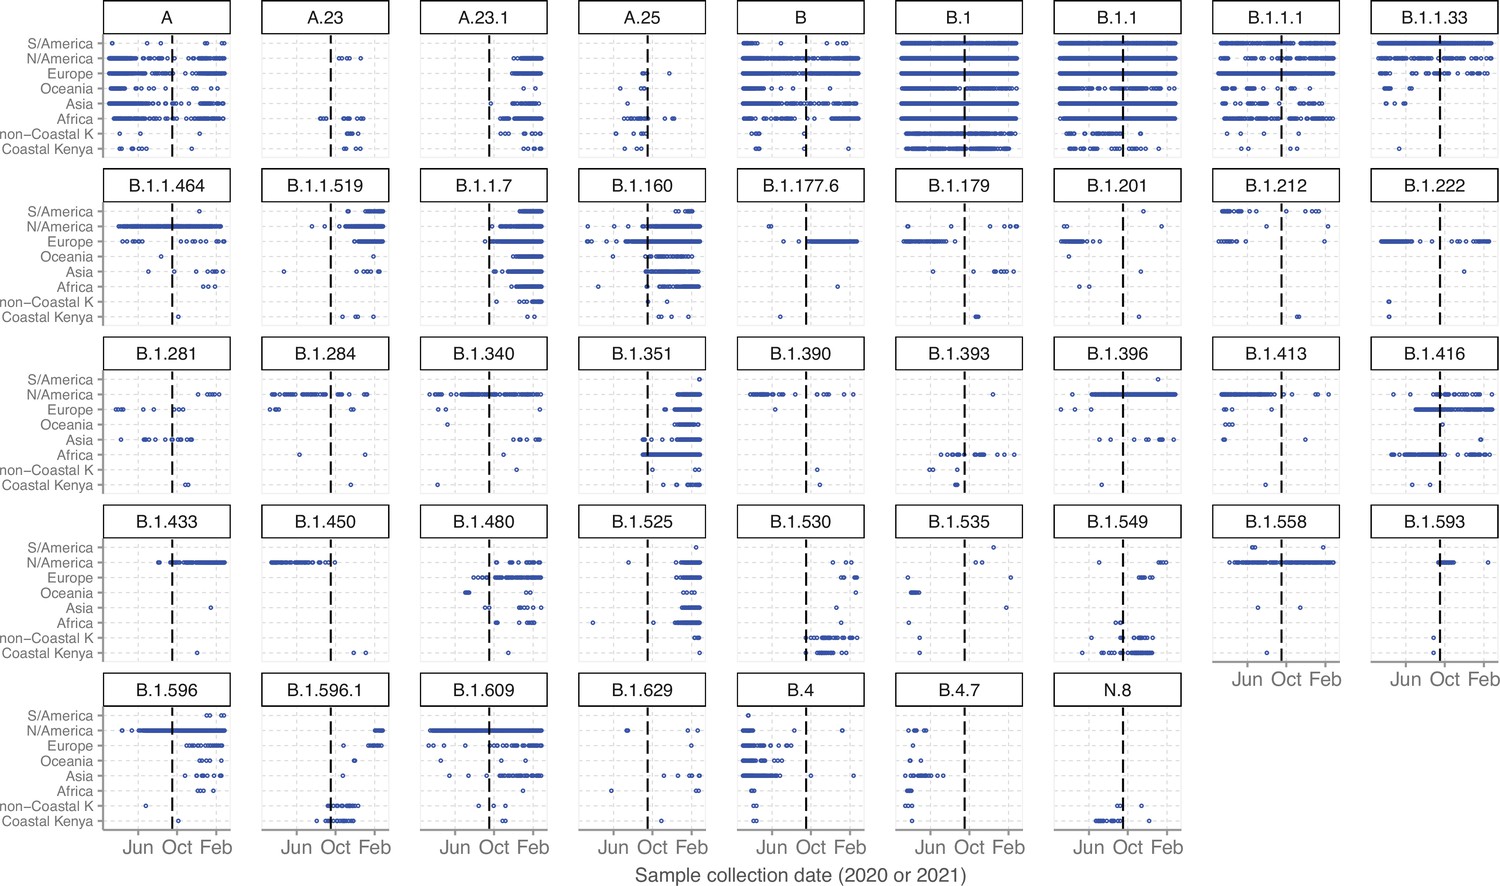
Global context and temporal dynamics of the Pango lineages detected in Coastal Kenya.
The plot was derived from a combination of 420,492 global genomes available on GISAID sampled between March 1, 2020, and February 28, 2021, and the 1139 Coastal Kenya genomes generated in this study. The GISAID data was stratified by continent and those from Kenya (and sampled in non-coastal counties) separated from those from the rest of Africa. The dashed vertical black line demarcates the Wave 1 and Wave 2 period inferred from the Kenya epidemic.
Figure 6 with 2 supplements
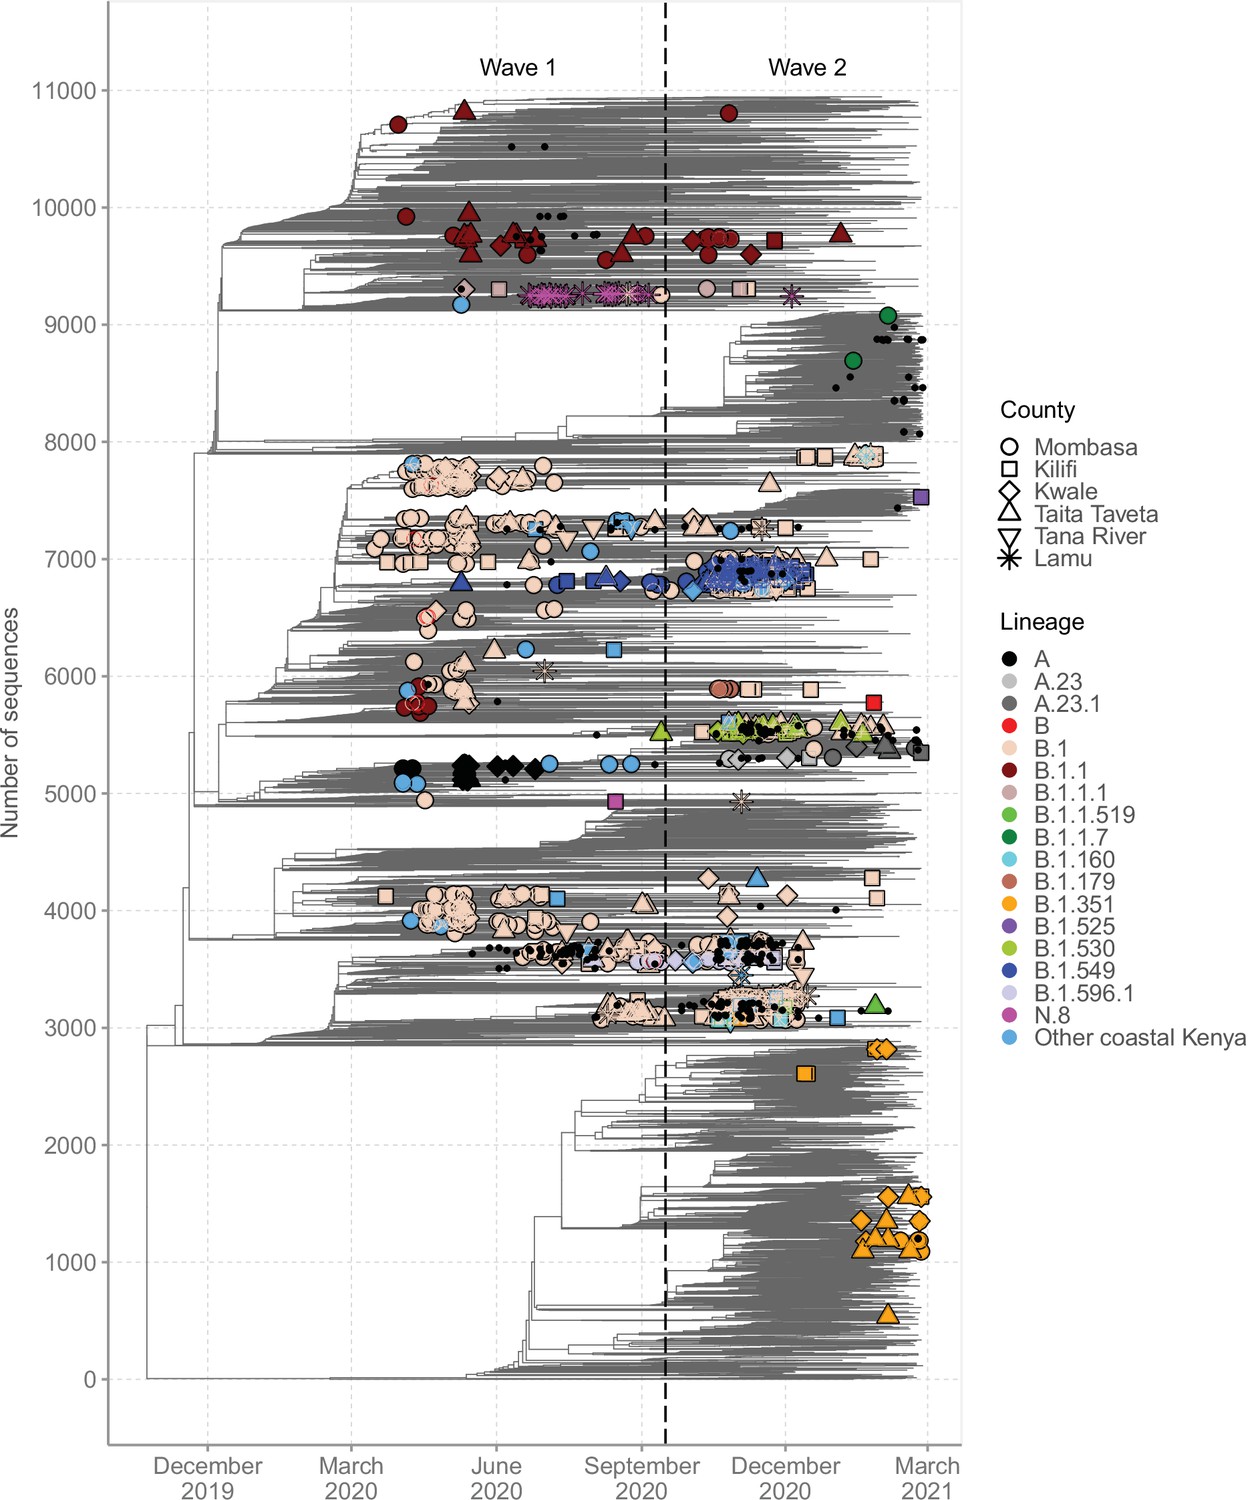
Global context of severe acute respiratory syndrome coronavirus 2 (SARS-CoV-2) diversity observed in Coastal Kenya.
A time-resolved global phylogeny that combined 1139 Coastal Kenya SARS-CoV-2 genomes and 9906 global reference sequences. Distinct shapes are used to identify the different Coastal Kenya counties and distinct colours to identify the different lineages. Lineages detected in less than four cases were put together and referred to as ‘other Coastal Kenya lineages’. This group comprises 26 lineages, namely, A.25, B.1.1.33, B.1.1.464, B.1.177.6, B.1.201, B.1.212, B.1.222, B.1.281, B.1.284, B.1.340, B.1.390, B.1.393, B.1.396, B.1.413, B.1.416, B.1.433, B.1.450, B.1.480, B.1.535, B.1.558, B.1.593, B.1.596, B.1.609, B.1.629, B.4, and B.4.7. Sequences not fitting clock-like molecular evolution were removed using TreeTime program (Sagulenko et al., 2018). The analysis included 292 genomes obtained from samples collected in Kenya but outside coastal counties and these are shown as a small, solid black circles.
Figure 6—figure supplement 1
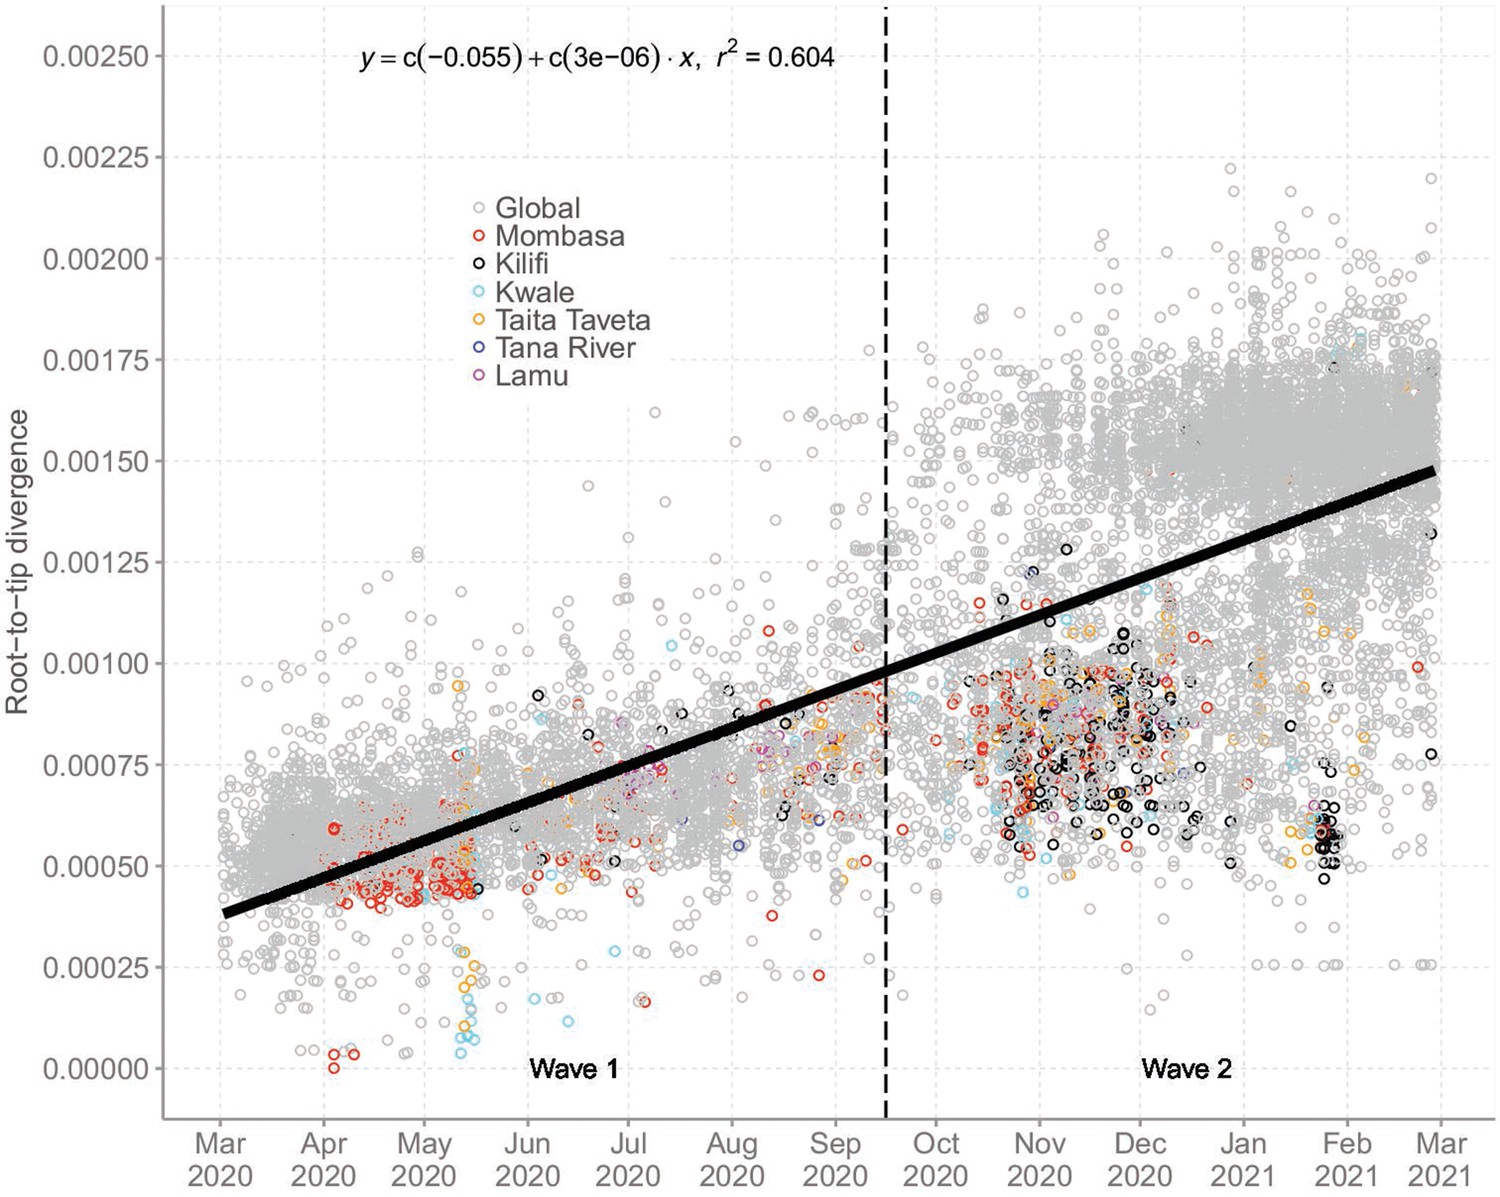
Root-to-tip regression analysis of Coastal Kenya genomes combined with global sequences.
Figure 6—figure supplement 2
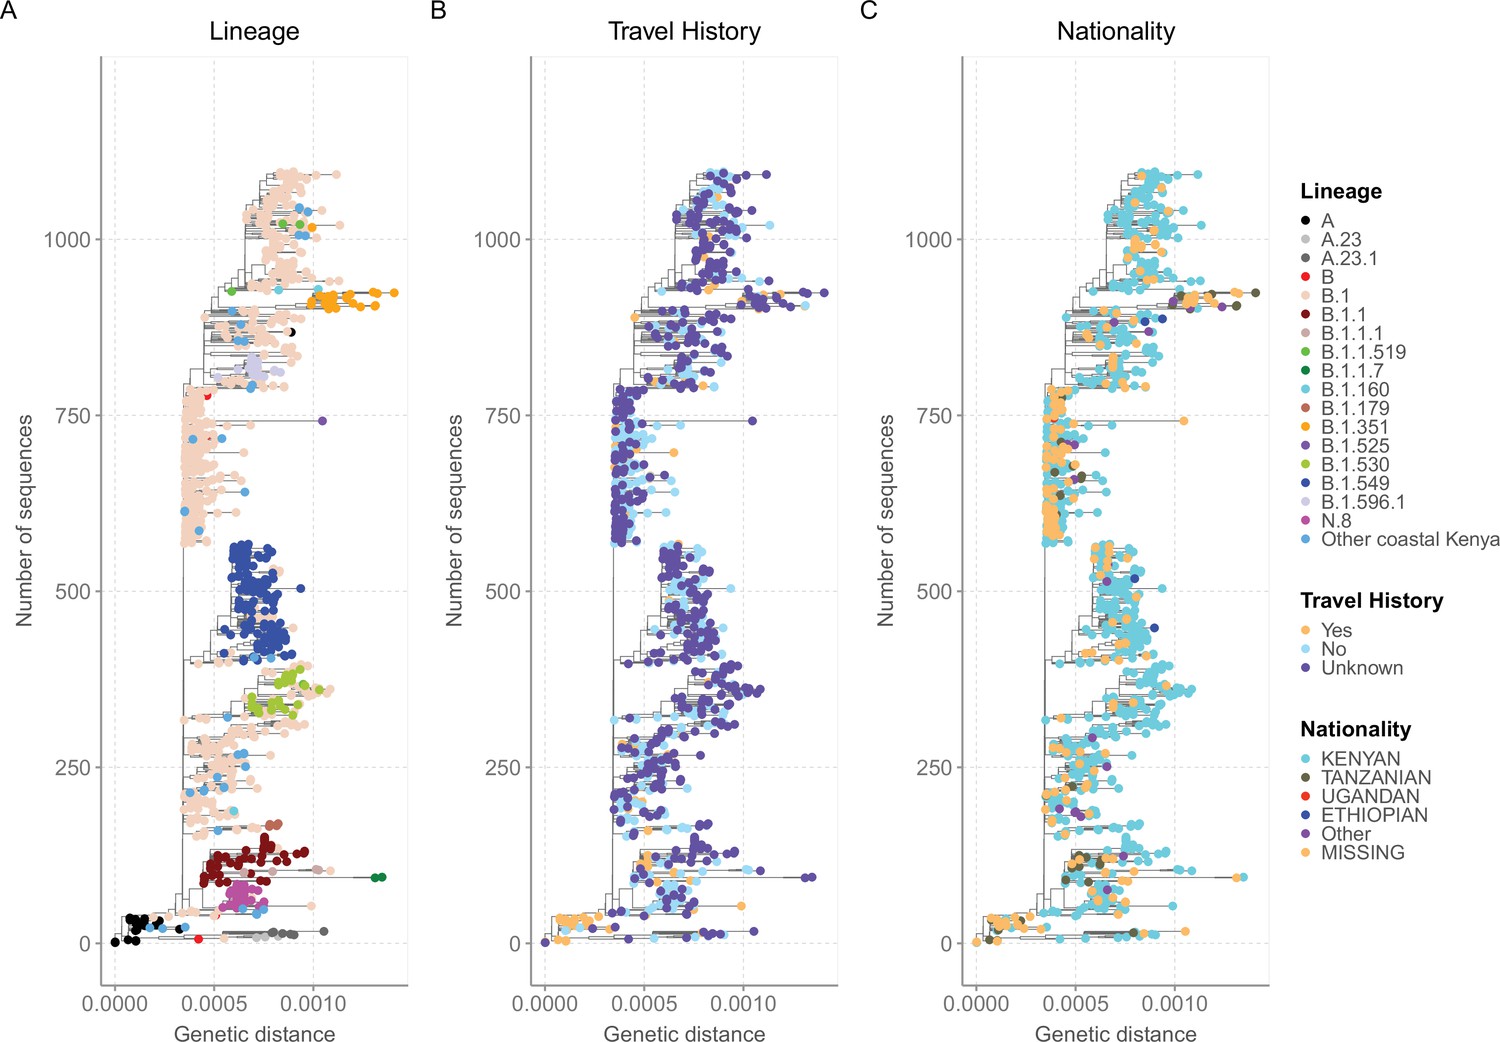
Mutation-resolved maximum likelihood (ML) phylogeny of the 1139 Coastal Kenya genomes annotated with available epidemiological information.
(A) The phylogenetic relationships of the sequenced genomes with the taxa colored by the identified lineages. (B) The phylogenetic relationships of the sequenced genomes with the taxa colured by the travel history of the cases. (C) The phylogenetic relationships of the sequenced genomes with the taxa colored by the nationality of the cases.
Figure 7 with 2 supplements
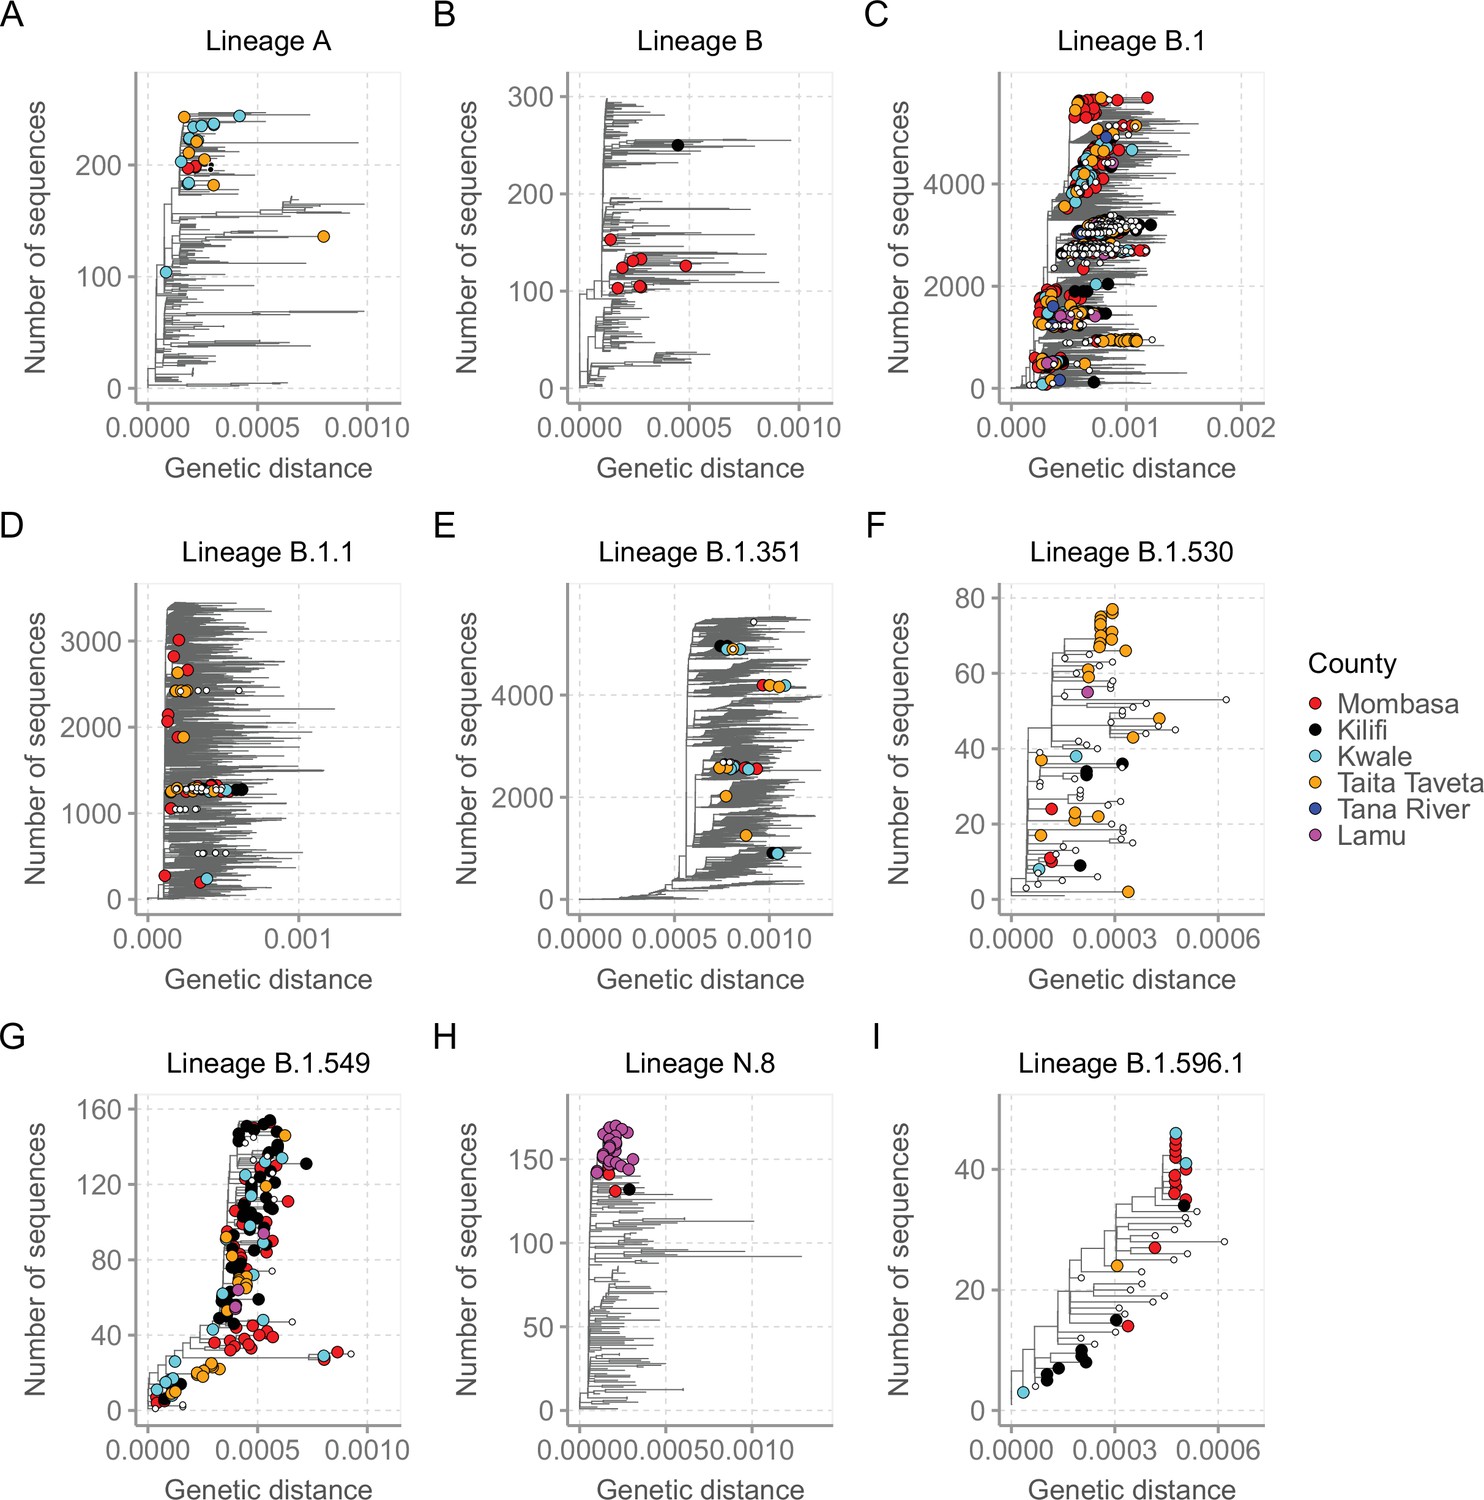
Mutation-resolved lineage-specific phylogenies for the top nine lineages detected in Coastal Kenya.
The Coastal Kenya genomes are indicated with filled different shapes for the different counties. Genomes from other locations within Kenya are indicated with small solid black circles. (A) Phylogeny of the 22 lineage A Coastal Kenya genome combined 240 global lineage A sequences. (B) Phylogeny of the lineage B that combined 9 Coastal Kenya genomes and 291 global lineage B sequences. (C) Phylogeny for lineage B.1 that combined 723 Coastal Kenya genomes and 5136 global lineage B.1 sequences. (D) Phylogeny for lineage B.1.1 that combined 57 Coastal Kenya genomes and 3451 global lineage B.1.1sequences. (E) Phylogeny for lineage B.1.351 that combined 26 Coastal Kenya genomes and 5613 global lineage B.1.351 sequences. (F) Phylogeny for lineage B.1.530 that combined 32 Coastal Kenya genomes and 45 global lineage B.1.530 sequences. (G) Phylogeny for lineage B.1.549 that combined 143 Coastal Kenya genomes and 14 lineage B.1. 549 sequences from other locations. (H) Phylogeny for lineage N.8 that combined 31 Coastal Kenya genomes of lineage N.8, a single Coastal Kenya genomes of lineage B.1.1.33 and 139 lineage B.1.1.33 global sequences. (I) Phylogeny for lineage B.1.596.1 that combined 24 Coastal Kenya genomes and 22 lineage B.1.596.1 global sequences.
Figure 7—figure supplement 1
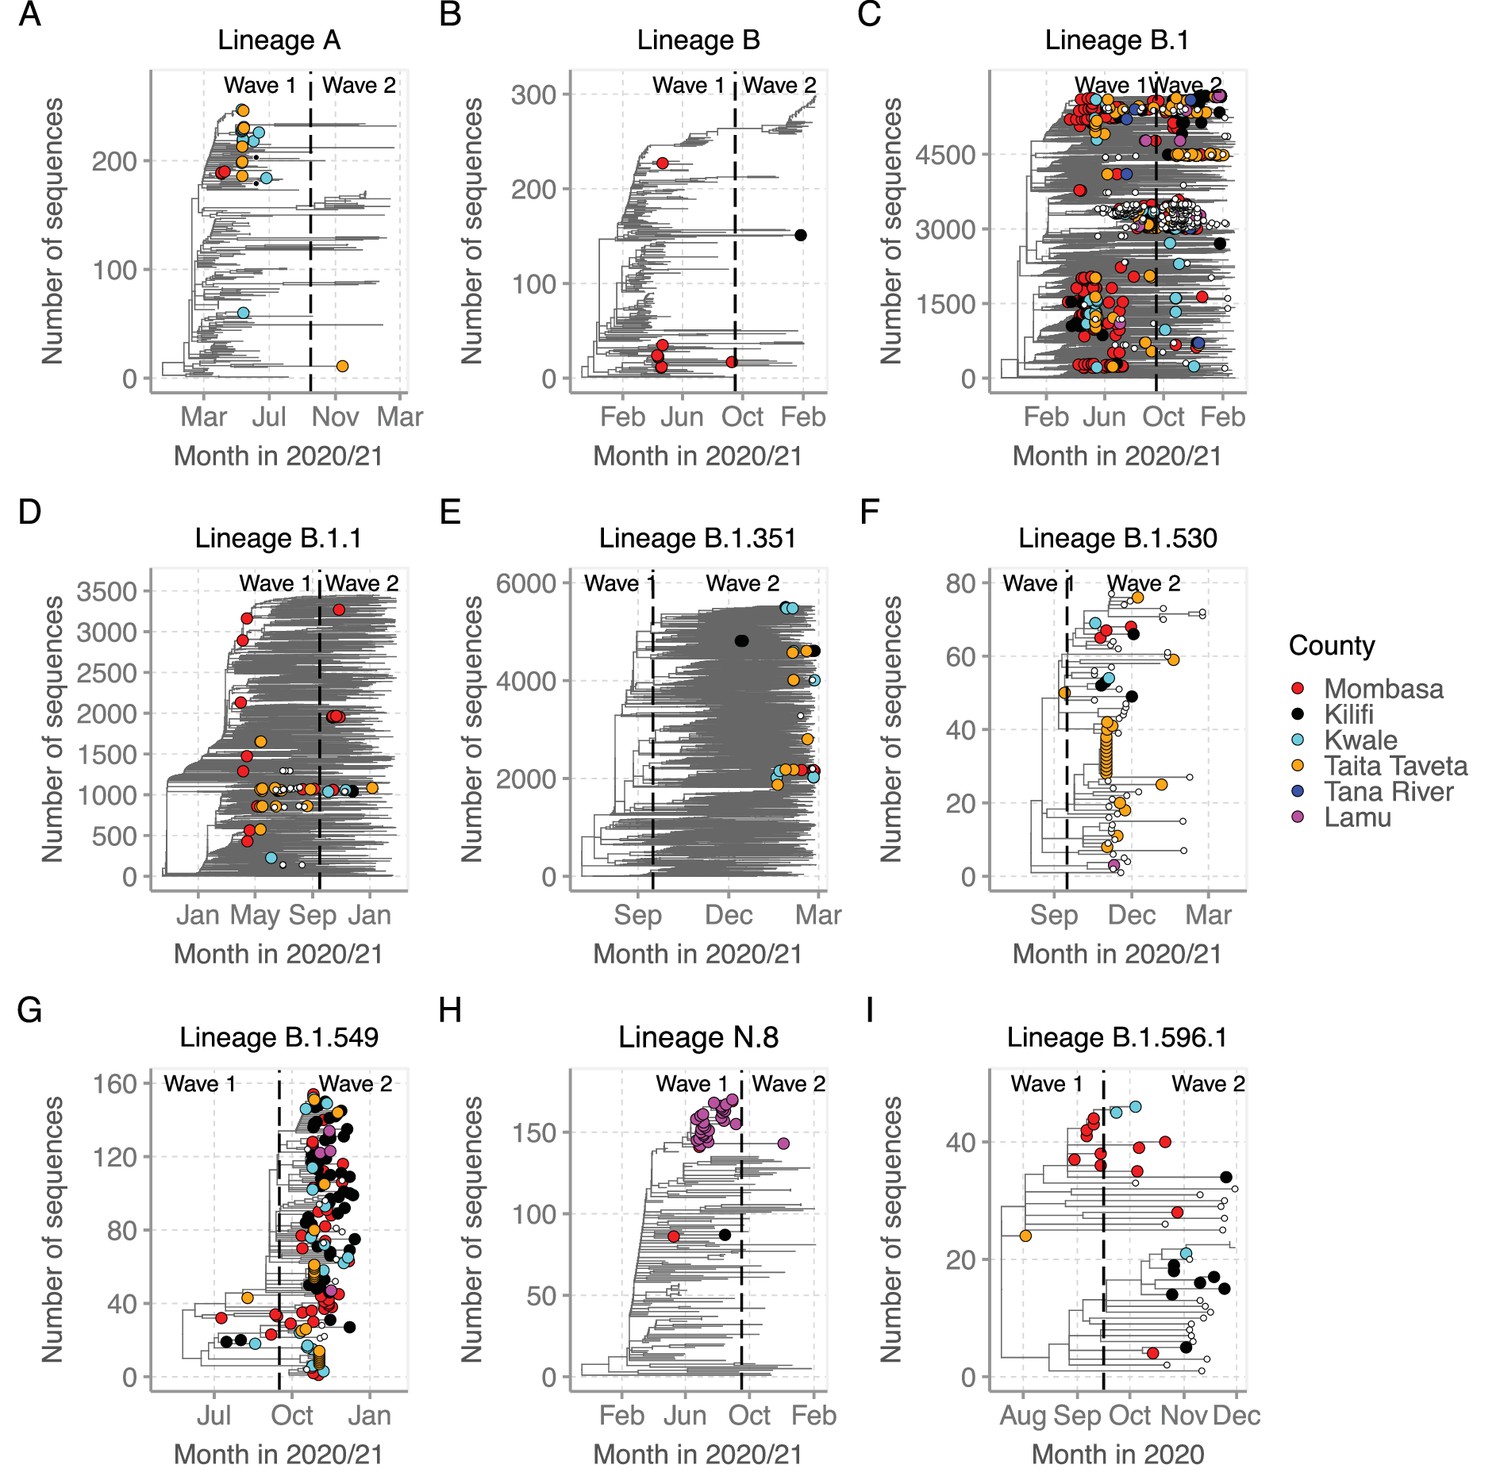
Time-resolved lineage-specific phylogenetic trees for top nine lineages detected in Coastal Kenya.
(A) Phylogeny for lineage A that combined 22 Coastal Kenya genomes and 240 global sequences belonging also to lineage A. (B) Phyogeny for lineage B that combined 9 Coastal Kenya genomes and 291 global sequences also belonging to lineage B. (C) Phylogeny for lineage B.1 that combined 723 Coastal Kenya genomes and 5136 global sequences beloging also to lineage B.1. (D) Phylogeny for lineage B.1.1 that cimbined 57 coastal enya genomes and 3451 glonal sequences also belonging to lineage B.1.1. (E) Phylogeny for lineage B.1.351 that combined the 26 Coastal Kenya genomes and 5613 global sequences beloging to also lineage B.1.351. (F) Phylogeny for lineage B.1.530 that combined 32 Coastal Kenya genomes and 45 global sequences belonging to also lineage B.1.530. (G) Phylogeny of lineage B.1.549 that combined the 143 Coastal Kenya genomes and 14 global sequences from other locations belonging to also lineage B.1.549. (H) Phylogeny of lineage N.8 that combined 31 Coastal Kenya genomes of lineage N.8, 1 Coastal Kenya genome of lineage B.1.1.33 and 139 global genome sequences belonging to lineage B.1.1.33. (I) Phylogeny for lineage B.1.596.1 that combined 24 Coastal Kenya genomes and 22 global sequences that also belonged to lineage B.1.596.1.
Figure 7—figure supplement 2
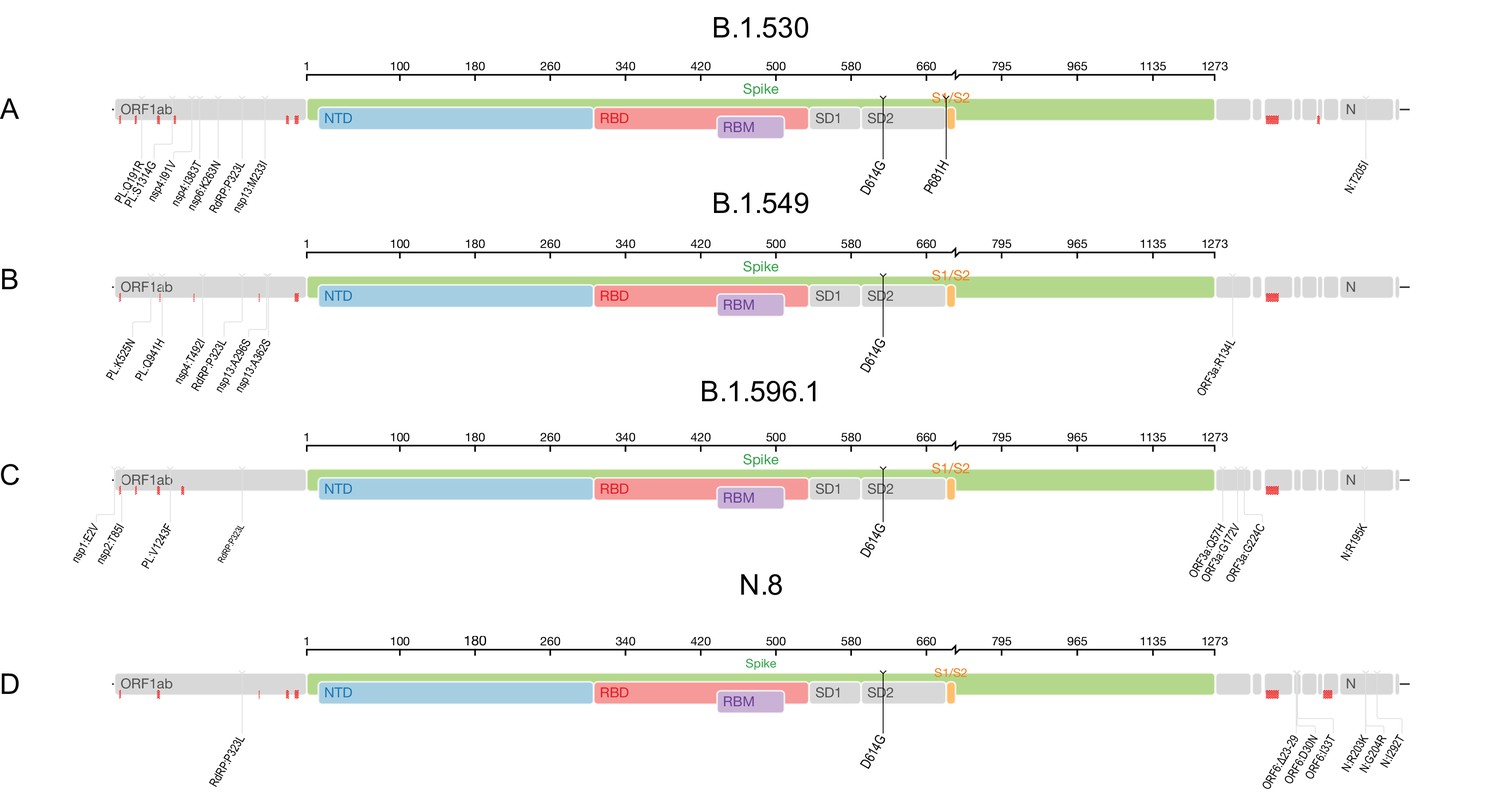
Genome maps of the ‘Kenya’ lineages where the spike region is shown in detail and in colour and the rest of the genome is shown in grey colour.
(A) Pango lineage B.1.530. (B) Pango lineage B.1.549. (C) Pango lineage B.1.596.1. (D) Pango lineage N.8. Red marks throughout the four panels indicate where sequencing of Kenya strains resulted in ambiguous nucleotides. Plots generated using tool available from Stanford University Web page Coronavirus antiviral and resistance database https://covdb.stanford.edu/page/mutation-viewer/: last accessed on August 3, 2021.
Figure 8 with 1 supplement
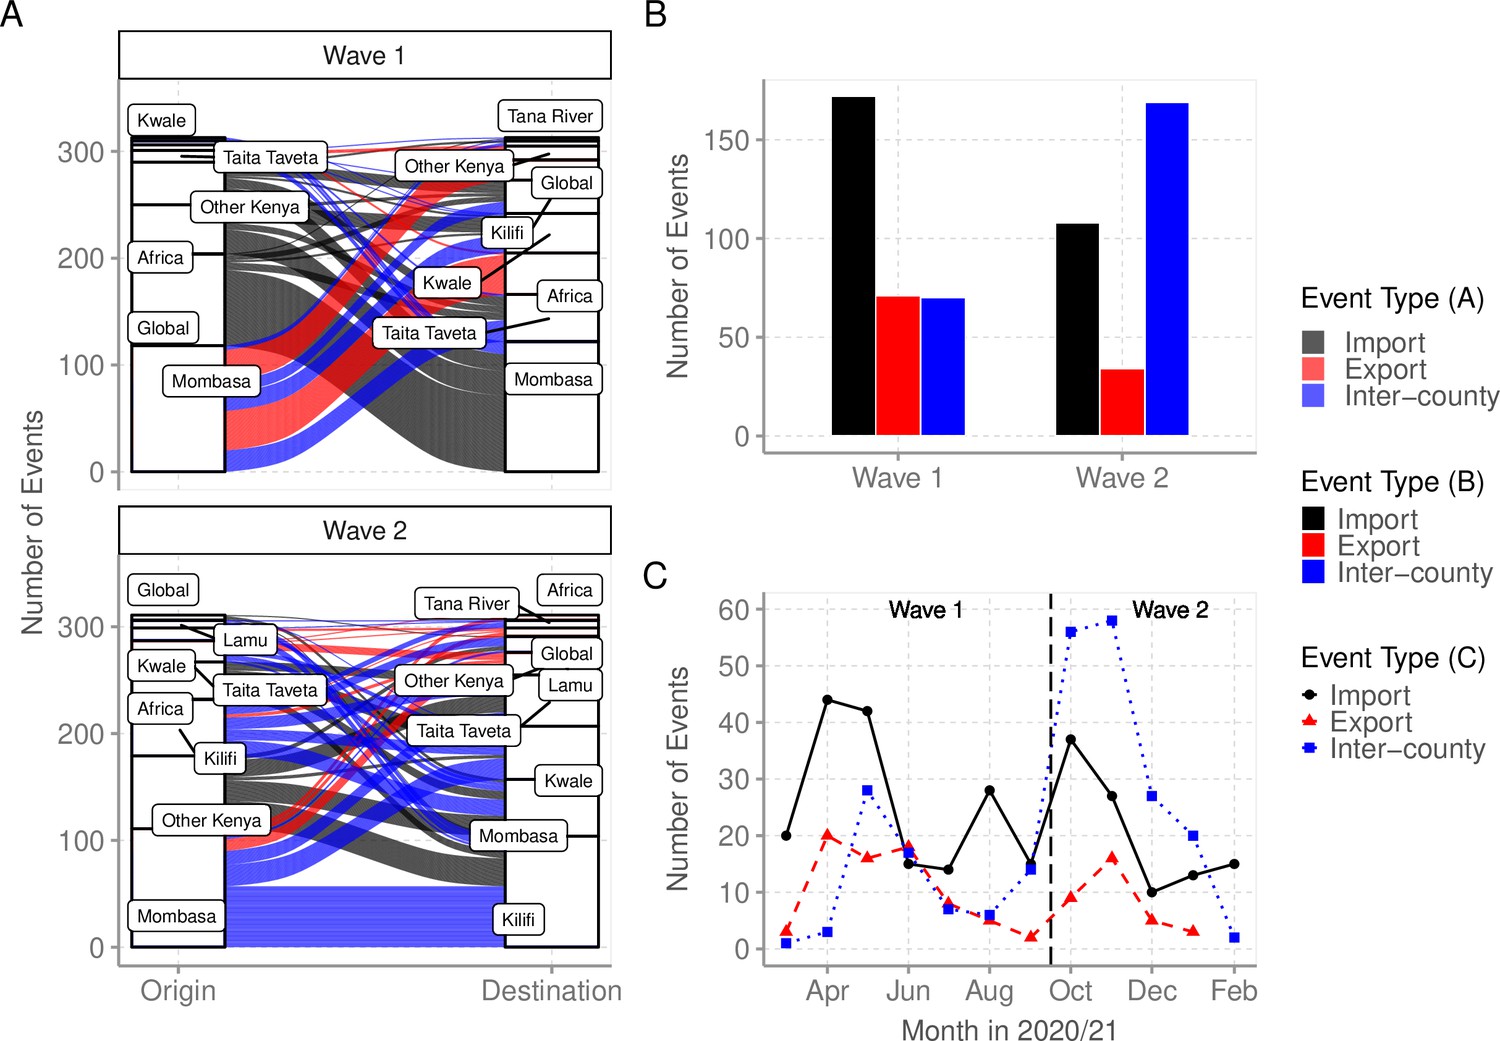
Virus importations and exportations from Coastal Kenya.
(A) Alluvium plots stratified by wave number showing the estimated number and flow of importations into and exportations from Coastal Kenya. ‘Global’ refer to origins or destinations outside Kenya while ‘Other Kenya’ refer to origins or destinations within Kenya but outside the Coastal Counties. (B) The raw counts bar plot of location transition events observed within and between Coastal Kenya outside world shown as either virus exportations, importations, or inter-county transmission, these stratified by wave number. (C) Monthly trends of the observed transition events stratified by type. The findings presented in this figure are based on subsample 1.
-
Figure 8—source data 1
The number of importation and exportation events by county and wave period.
- https://cdn.elifesciences.org/articles/71703/elife-71703-fig8-data1-v2.csv
-
Figure 8—source data 2
The number of importations, inter-county transmission, and exportation events by month.
- https://cdn.elifesciences.org/articles/71703/elife-71703-fig8-data2-v2.csv
Figure 8—figure supplement 1
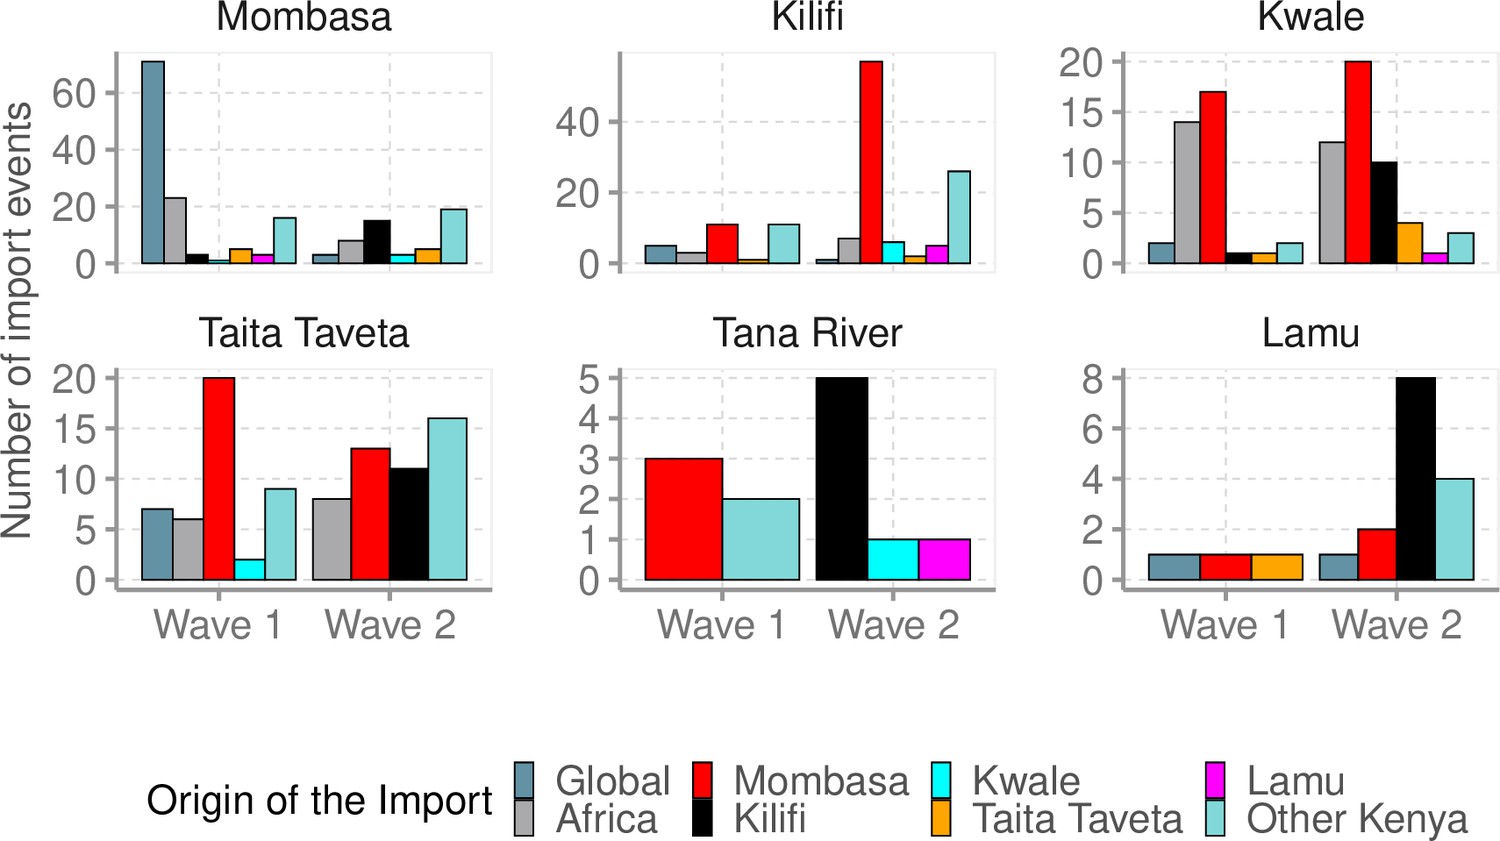
The number of import events, stratified by wave period into the individual coastal counties and their estimated origins.
Figure 9
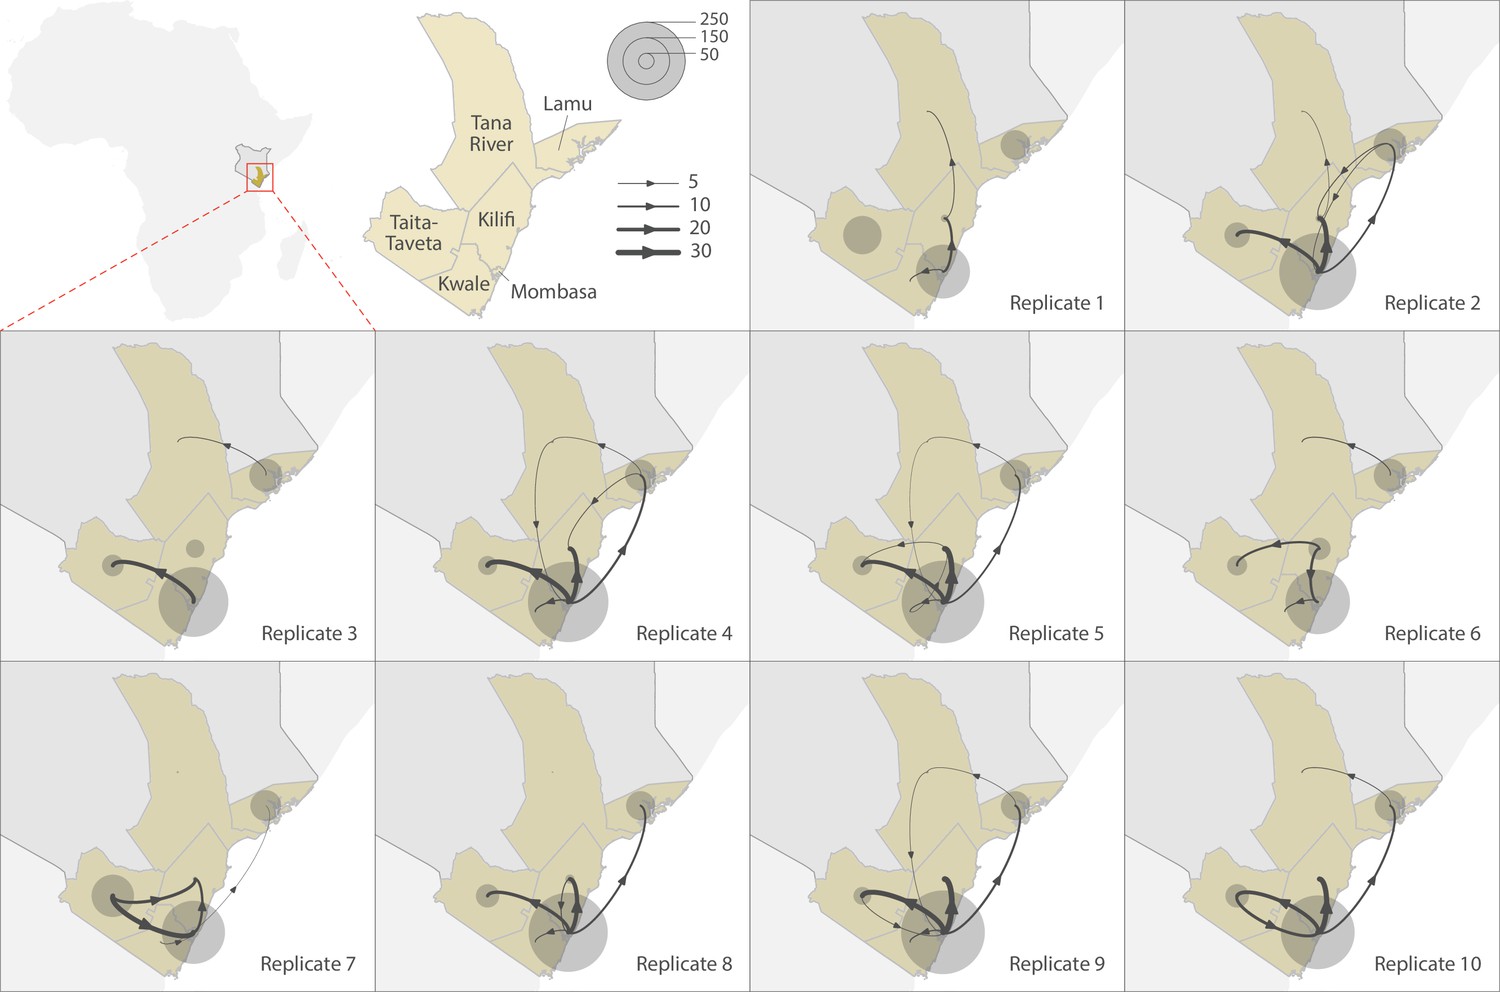
Replicated discrete phylogeographic reconstructions of the circulation of severe acute respiratory syndrome coronavirus 2 (SARS-CoV-2) lineages within and among counties of Coastal Kenya.
Each replicated analysis was based on a random subset of genomic sequences subsampled according to local incidence (see the ‘Methods’ section for further detail). We here report the number of lineage dispersal events inferred among (arrows) and within (transparent grey circles) counties, both measures being averaged over posterior trees sampled from each posterior distribution. We here only report among-counties transition events supported by adjusted Bayes factor (BF) values >20, which corresponds to a strong support according to the scale of BF values interpretation of Kass and Raftery, 1995.
Tables
Table 1
Number of severe acute respiratory syndrome coronavirus 2 (SARS-CoV-2) positives reported by the Ministry of Health in Kenya by February 26, 2021, and breakdown of those conducted at KEMRI-Wellcome Trust Research Programme (KWTRP), including status of sequencing.
| County | Total Population size* (%) | Population density† | Ministry of Health reported positves ‡ (%) | RT-PCR tests (KWTRP, %) | Positives (KWTRP, %) | No. of whole genomes sequenced (%)§ |
|---|---|---|---|---|---|---|
| Mombasa | 1,208,333 (27.9) | 5,495 | 8450 (66.8) | 46,143 (55.8) | 3139 (49.6) | 468 (41.1) |
| Kilifi | 1,453,787 (33.6) | 116 | 2458 (19.4) | 12,908 (15.6) | 1443 (22.8) | 294 (25.8) |
| Kwale | 866,820 (20.0) | 105 | 436 (3.4) | 5491 (6.6) | 436 (6.9) | 102 (9.0) |
| Taita Taveta | 340,671 (7.9) | 20 | 855 (6.7) | 14,543 (17.6) | 855 (13.5) | 196 (13.5) |
| Tana River | 315,943 (7.3) | 8 | 106 (0.8) | 877 (1.1) | 106 (1.7) | 16 (1.7) |
| Lamu | 143,920 (3.3) | 23 | 350 (2.7) | 2754 (3.3) | 350 (5.5) | 63 (5.5) |
| Overall | 4,329,474 (100.0) | 52 | 12,655 (100.0) | 82,716 (100.0) | 6329 (100.0) | 1139 (100.0) |
-
*
Number of residents as per the 2019 national population census.
-
†
Units here are number of persons per square kilometre.
-
‡
The Ministry of Health reports compiled results from all testing centres across the country including KWTRP.
-
§
The numbers in brackets represents the proportion sequenced of those detected following RT-PCR at the KWTRP.
Table 2
Demographic characteristics of the positive cases identified at KEMRI-Wellcome Trust Research Programme (KWTRP) in Coastal Kenya by sequencing status and wave period.
| Characteristic | Total positives | Overall sequencing status | Total positives by wave period | Total sequenced by wave period | ||||||
|---|---|---|---|---|---|---|---|---|---|---|
| (n = 6329)(%) | Sequenced(n = 1139)(%) | Non-sequenced(n = 5190)(%) | p-Value† | Wave 1 (n = 2849)(%) | Wave 2 (n = 3480)(%) | p-Value† | Wave 1 (n = 499)(%) | Wave 2 (n = 640)(%) | p-Value† | |
| Age category (years) | <0.001 | 0.0149 | 0.0419 | |||||||
| 0–9 | 178 (2.8) | 22 (1.9) | 156 (3.0) | 94 (3.3) | 84 (2.4) | 11 (2.2) | 11 (1.7) | |||
| 10–19 | 472 (7.5) | 85 (7.5) | 387 (7.5) | 185 (6.5) | 287 (8.2) | 21 (4.2) | 64 (10.0) | |||
| 20–29 | 1682 (26.6) | 234 (20.5) | 1,448 (27.9) | 769 (27.2) | 913 (26.1) | 94 (18.9) | 140 (21.8) | |||
| 30–39 | 1653 (26.1) | 290 (25.5) | 1,363 (26.3) | 764 (27.0) | 889 (25.4) | 123 (24.7) | 167 (26.1) | |||
| 40–49 | 1140 (18.0) | 218 (19.1) | 922 (17.8) | 488 (17.2) | 652 (18.6) | 88 (17.7) | 130 (20.3) | |||
| 50–59 | 605 (9.6) | 122 (10.7) | 483 (9.3) | 247 (8.7) | 358 (10.2) | 57 (11.4) | 65 (10.1) | |||
| 60–69 | 187 (2.9) | 46 (4.0) | 141 (2.7) | 78 (2.8) | 109 (3.1) | 23 (4.6) | 23 (3.6) | |||
| 70–79 | 74 (1.1) | 17 (1.5) | 57 (1.1) | 33 (1.2) | 41 (1.2) | 7 (1.4) | 10 (1.6) | |||
| 80+ | 13 (0.2) | 4 (0.4) | 9 (0.2) | 7 (0.2) | 6 (0.2) | 3 (0.6) | 1 (0.2) | |||
| Missing | 325 (3.25) | 101 (8.9) | 224 (4.3) | 167 (5.9) | 158 (4.5) | 71 (14.3) | 30 (4.7) | |||
| Gender | 0.554 | <0.001 | 0.1979 | |||||||
| Female | 1896 (29.9) | 333 (29.2) | 1563 (30.1) | 763 (26.9) | 1,133 (32.4) | 125 (25.1) | 208 (32.4) | |||
| Male | 4058 (64.1) | 686 (60.2) | 3372 (65.0) | 1860 (65.7) | 2198 (62.9) | 288 (57.8) | 398 (62.1) | |||
| Missing | 375 (5.9) | 120 (10.5) | 255 (4.9) | 209 (7.4) | 166 (4.7) | 85 (17.1) | 85 (5.5) | |||
| Nationality | <0.001 | <0.001 | <0.001 | |||||||
| Kenyan | 5356 (84.6) | 870 (76.4) | 4486 (86.4) | 2270 (80.2) | 3086 (88.2) | 316 (63.5) | 554 (86.4) | |||
| Tanzania | 131 (2.1) | 34 (3.0) | 97 (1.9) | 81 (2.9) | 50 (1.4) | 25 (5.0) | 9 (1.4) | |||
| Uganda | 16 (0.3) | 1 (0.1) | 15 (0.3) | 10 (0.4) | 6 (0.2) | 0 (0.2) | 4 (0.0) | |||
| Ethiopia | 14 (0.2) | 4 (0.4) | 10 (0.2) | 0 (0.0) | 14 (0.4) | 1 (0.2) | 0 (0.0) | |||
| Other† | 117 (1.84) | 24 (2.1) | 93 (1.8) | 46 (1.6) | 71 (2.0) | 6 (1.2) | 18 (2.8) | |||
| Missing | 695 (10.9) | 206 (18.1) | 489 (9.4) | 425 (15.0) | 270 (7.7) | 150 (30.1) | 56 (8.7) | |||
| Travel history* | <0.001 | <0.001 | <0.001 | |||||||
| Yes | 485 (7.7) | 119 (10.4) | 366 (7.1) | 340 (12.0) | 145 (4.1) | 83 (16.7) | 36 (5.6) | |||
| No | 2562 (40.7) | 407 (35.7) | 2155 (41.5) | 1372 (48.4) | 1190 (34.0) | 189 (38.0) | 218 (34.0) | |||
| Missing | 3282 (51.9) | 613 (53.8) | 2669 (51.4) | 1120 (39.5) | 2162 (61.8) | 226 (45.4) | 387 (60.4) | |||
-
*
Defined as having moved into Kenya in the previous 14 days or sampled at a point of entry (POE) into Kenya.
-
†
p-value calculated using a Pearson’s chi-squared test, for variables where some cells in the table had <5 observations, Fishers' exact test was applied.
Table 3
Lineages observed in Coastal Kenya, their county distribution, global history, and variants of concern (VOC)/variants of interest (VOI) status.
| Lineage | Frequency (%) | Mombasa | Kilifi | Kwale | Taita Taveta | Tana River | Lamu | Earliest date | Number assigned | Description |
|---|---|---|---|---|---|---|---|---|---|---|
| A | 22 (0.3) | 3 | - | 13 | 6 | - | - | Decmber 30, 2019 | 2224 | Root of the pandemic lies within lineage A Predominantly found in China |
| A.23 | 4 (0.1) | 1 | 1 | 2 | - | - | - | August 14, 2020 | 92 | Predominantly found in Uganda |
| A.23.1 | 6 (0.1) | 2 | 1 | 1 | 2 | - | - | September 21, 2020 | 1191 | International lineage |
| A.25 | 3 (0.0) | 3 | - | - | - | - | - | June 8, 2020 | 47 | Predominantly found in Uganda |
| B | 9 (0.1) | 8 | 1 | - | - | - | - | December 24, 2019 | 7358 | Second major haplotype (and first to be discovered) |
| B.1 | 723 (11.4) | 328 | 192 | 44 | 119 | 12 | 28 | January 1, 2020 | 88,731 | Predominantly found in Europe, origin corresponds to the Northern Italian outbreak early in 2020 |
| B.1.1 | 57 (0.9) | 33 | 6 | 5 | 13 | - | - | January 8, 2020 | 49,562 | Predominantly found in Europe |
| B.1.1.1 | 5 (0.1) | 1 | 2 | 2 | - | - | - | March 2, 2020 | 2827 | Predominantly found in England |
| B.1.1.33 | 1 (0.0) | 1 | - | - | - | - | - | March 1, 2020 | 2117 | Predominantly found in Brazil |
| B.1.1.464 | 1 (0.0) | - | - | 1 | - | - | - | April 1, 2020 | 666 | Predominantly found in USA |
| B.1.1.519 | 4 (0.1) | - | 2 | - | 2 | - | - | July 30, 2020 | 23,815 | Predominantly found in USA/ Mexico |
| B.1.1.7 | 2 (0.0) | 2 | - | - | - | - | - | September 3, 2020 | 1,062,326 | Alpha variant of concern |
| B.1.160 | 5 (0.1) | - | 2 | 1 | - | 1 | 1 | February 2, 2020 | 28,128 | Predominantly found in Europe |
| B.1.177.6 | 1 (0.0) | - | 1 | - | - | - | - | May 29, 2020 | 949 | Predominantly found in Wales |
| B.1.179 | 5 (0.1) | 5 | - | - | - | - | - | March 9, 2020 | 242 | Predominantly found in Denmark |
| B.1.201 | 1 (0.0) | - | - | - | - | - | 1 | March 6, 2020 | 173 | Predominantly found in the UK |
| B.1.212 | 2 (0.0) | - | 2 | - | - | - | - | March 3, 2020 | 59 | Predominantly found in South America |
| B.1.222 | 2 (0.0) | 2 | - | - | - | - | - | February 24, 2020 | 568 | Predominantly found in Scotland |
| B.1.281 | 2 (0.0) | - | 2 | - | - | - | - | April 8, 2020 | 41 | Predominantly found in Bahrain |
| B.1.284 | 1 (0.0) | 1 | - | - | - | - | - | March 9, 2020 | 85 | Predominantly found in TX,USA |
| B.1.340 | 1 (0.0) | 1 | - | - | - | - | - | March 13, 2020 | 221 | Predominantly found in USA |
| B.1.351 | 26 (0.4) | 6 | 5 | 8 | 7 | - | - | September 1, 2020 | 29,720 | Beta variant of concern |
| B.1.390 | 1 (0.0) | 1 | - | - | - | - | - | March 25, 2020 | 91 | Predominantly found in USA |
| B.1.393 | 3 (0.0) | 2 | 1 | - | - | - | - | May 29, 2020 | 34 | Predominantly found in Uganda |
| B.1.396 | 1 (0.0) | - | 1 | - | - | - | - | April 6, 2020 | 1375 | Predominantly found in USA |
| B.1.413 | 1 (0.0) | - | - | - | - | 1 | - | March 12, 2020 | 195 | Predominantly found in USA |
| B.1.416 | 2 (0.0) | 1 | 1 | - | - | - | - | April 11, 2020 | 594 | Predominantly found in Senegal/ Gambia, reassigned from B.1.5.12 |
| B.1.433 | 1 (0.0) | - | - | 1 | - | - | - | August 3, 2020 | 314 | Predominantly found in TX, USA |
| B.1.450 | 3 (0.0) | - | 3 | - | - | - | - | March 14, 2020 | 86 | Predominantly found in TX, USA |
| B.1.480 | 1 (0.0) | - | - | - | 1 | - | - | July 3, 2020 | 386 | Predominantly found in England, Australia, Sweden, Norway |
| B.1.525 | 1 (0.0) | - | 1 | - | - | - | - | March 28, 2020 | 8012 | Eta variant of interest |
| B.1.530 | 32 (0.5) | 3 | 4 | 2 | 22 | - | 1 | October 1, 2020 | 111 | Predominantly found in Kenya |
| B.1.535 | 1 (0.0) | 1 | - | - | - | - | - | March 22, 2020 | 29 | Predominantly found in Australia |
| B.1.549 | 143 (2.3) | 42 | 56 | 18 | 23 | - | 4 | May 11, 2020 | 171 | Predominantly found in Kenya and England |
| B.1.558 | 1 (0.0) | 1 | - | - | - | - | - | April 6, 2020 | 211 | Predominantly found in USA/ Mexico |
| B.1.593 | 2 (0.0) | - | - | - | - | 2 | - | July 3, 2020 | 99 | Predominantly found in USA |
| B.1.596 | 1 (0.0) | - | - | 1 | - | - | - | April 11, 2020 | 9968 | Predominantly found in USA |
| B.1.596.1 | 24 (0.4) | 12 | 8 | 3 | 1 | - | - | September 7, 2020 | 83 | Predominantly found in Kenya |
| B.1.609 | 2 (0.0) | 1 | 1 | - | - | - | - | March 10, 2020 | 1879 | Predominantly found in USA/ Mexico |
| B.1.629 | 1 (0.0) | 1 | - | - | - | - | - | July 12, 2020 | 231 | Lineage circulating in several countries |
| B.4 | 3 (0.0) | 3 | - | - | - | - | - | January 18, 2020 | 386 | Predominantly found in Iran |
| B.4.7 | 1 (0.0) | 1 | - | - | - | - | - | March 14, 2020 | 68 | Predominantly found in Africa and UAE |
| N.8 | 31 (0.5) | 2 | 1 | - | - | - | 28 | June 23, 2020 | 15 | Alias of B.1.1.33.8, predominantly found in Kenya |
Table 4
Summary of import and export events and rates into coastal counties populations.
| County | Virus import (%) | Import rate (per 100,000)* | Virus export (%) | Export rate (per 100,000)* |
|---|---|---|---|---|
| Mombasa | 140 (50) | 11.6 | 85 (81) | 7.0 |
| Kilifi | 53 (19) | 3.6 | 4 (4) | 0.3 |
| Kwale | 33 (12) | 3.8 | 4 (4) | 0.5 |
| Taita Taveta | 46 (16) | 13.5 | 12 (11) | 3.5 |
| Tana River | 2 (<1) | 0.6 | - | - |
| Lamu | 6 (2) | 4.1 | - | - |
| Overall | 280 | 6.7 | 105 | 2.4 |
-
*
Denominator population as per the 2019 national census (see Table 1).
Additional files
-
Supplementary file 1
Kenya government public health response and intervention to the COVID-19 pandemic.
- https://cdn.elifesciences.org/articles/71703/elife-71703-supp1-v2.docx
-
Supplementary file 2
Details on GISAID accession IDs, county of sampling, date of sample collection, assigned lineage, assigned clade, and the nucleotide sequences of the presented 1139 Coastal Kenya severe acute respiratory syndrome coronavirus 2 (SARS-CoV-2) genomes.
- https://cdn.elifesciences.org/articles/71703/elife-71703-supp2-v2.csv
-
Supplementary file 3
History of lineages detected in Coastal Kenya during the study period.
- https://cdn.elifesciences.org/articles/71703/elife-71703-supp3-v2.docx
-
Supplementary file 4
Patterns of Pango lineage detection at the various scales of observation analysed.
- https://cdn.elifesciences.org/articles/71703/elife-71703-supp4-v2.docx
-
Supplementary file 5
A summary of the top 10 detected Pango lineages detected in the different scales of observation investigated.
- https://cdn.elifesciences.org/articles/71703/elife-71703-supp5-v2.docx
-
Supplementary file 6
Summary output from separate runs of the import/export ancestral state reconstruction (ASR) analysis.
- https://cdn.elifesciences.org/articles/71703/elife-71703-supp6-v2.docx
-
Supplementary file 7
Acknowledgement of investigators and laboratories that have deposited genomic data into GISAID database that we used to place the Coastal Kenya genomes into the global context.
- https://cdn.elifesciences.org/articles/71703/elife-71703-supp7-v2.pdf
-
Transparent reporting form
- https://cdn.elifesciences.org/articles/71703/elife-71703-transrepform1-v2.docx
-
Reporting standard 1
STROBE Checklist.
- https://cdn.elifesciences.org/articles/71703/elife-71703-repstand1-v2.docx
-
Source code 1
The R scripts used in the generation of the main text figures presented in the article.
- https://cdn.elifesciences.org/articles/71703/elife-71703-code1-v2.zip
Download links
A two-part list of links to download the article, or parts of the article, in various formats.
Downloads (link to download the article as PDF)
Open citations (links to open the citations from this article in various online reference manager services)
Cite this article (links to download the citations from this article in formats compatible with various reference manager tools)
Transmission networks of SARS-CoV-2 in Coastal Kenya during the first two waves: A retrospective genomic study
eLife 11:e71703.
https://doi.org/10.7554/eLife.71703


