How clustered protocadherin binding specificity is tuned for neuronal self-/nonself-recognition
- Zuckerman Mind, Brain and Behavior Institute, Columbia University, United States
- School of Neurobiology, Biochemistry and Biophysics, Tel Aviv University, Israel
- Sagol School of Neuroscience, Tel Aviv University, Israel
- Department of Medicine, Division of Nephrology, Columbia University, United States
- Department of Biochemistry and Molecular Biophysics, Columbia University, United States
- Department of Systems Biology, Columbia University, United States
Figures
Figure 1
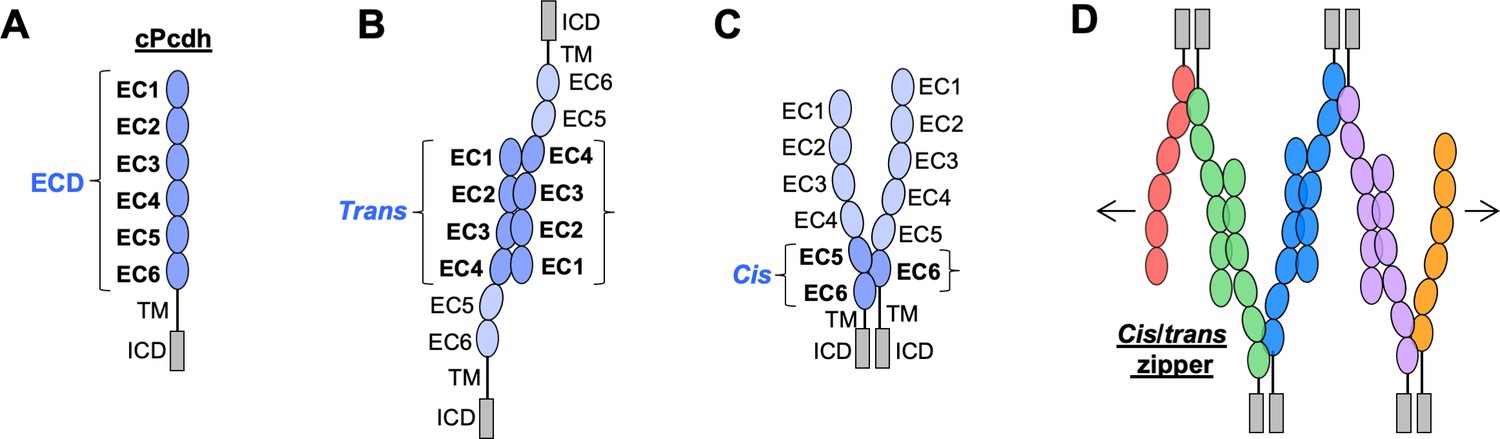
Clustered protocadherin (cPcdh) domain organization and extracellular interactions.
(A) Schematic depicting the domain organization of cPcdhs. EC, extracellular cadherin domain; TM, transmembrane domain; ECD, ectodomain; ICD, intracellular domain. (B) Schematic of two cPcdhs interacting via the EC1–4 trans interface. (C) Schematic of two cPcdhs interacting via the EC5–6/EC6 cis interface. (D) Schematic depiction of the cis/trans cPcdh zipper comprising multiple cPcdh isoforms (various colors) engaged in homophilic trans interactions and promiscuous cis interactions as required for the proposed ‘isoform-mismatch chain-termination model’ of cPcdh-mediated neuronal self-recognition and self-avoidance.
Figure 2 with 2 supplements
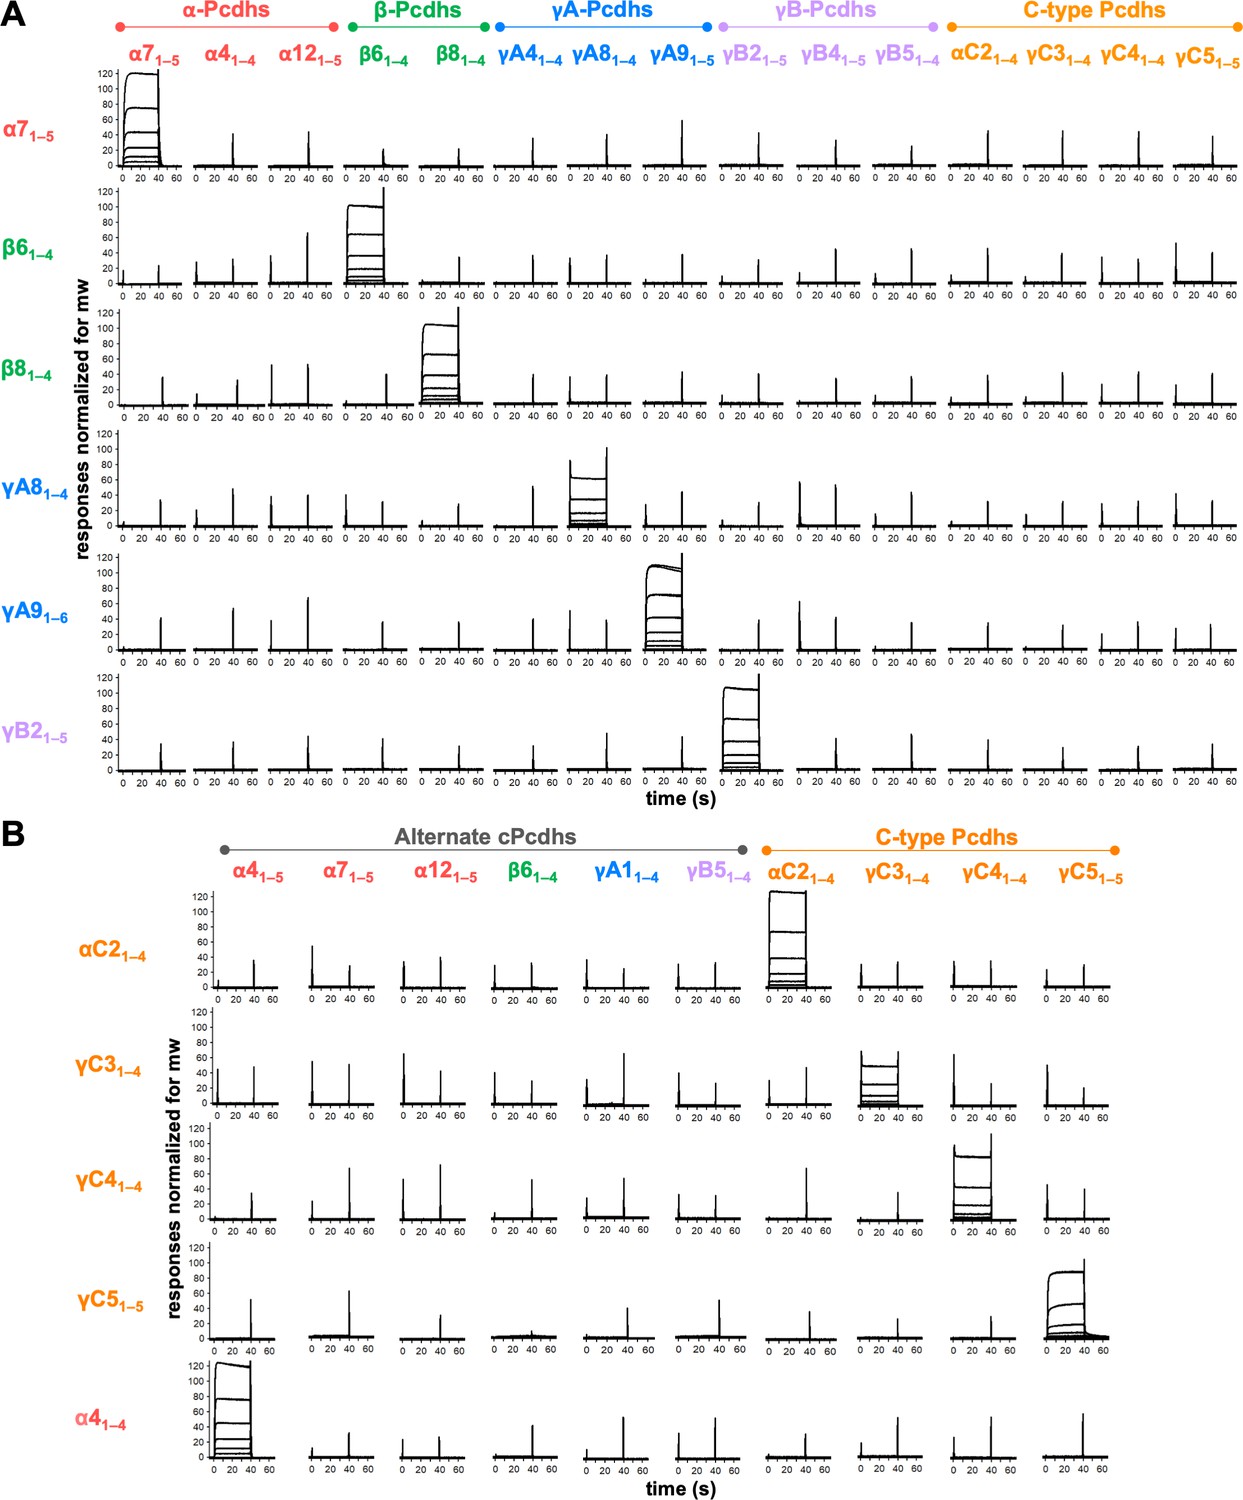
Clustered protocadherins (cPcdhs) show strict homophilic specificity in their trans interactions.
(A) Surface plasmon resonance (SPR) binding profiles of cPcdh trans fragment analytes from all cPcdh subfamilies (denoted in the top row) flowed over six surfaces coated with alternate cPcdh trans fragments (rows). Responses over all surfaces are drawn on the same scale and normalized for molecular weight (mw). (B) SPR binding profiles of cPcdh trans fragment analytes from all cPcdh subfamilies (shown in columns) flowed over individual surfaces coated with C-type and α4 cPcdh trans fragments (rows). Responses over all surfaces are drawn on the same scale and normalized for molecular weight.
-
Figure 2—source data 1
Sedimentation equilibrium analytical ultracentrifugation data for trans SPR reagents.
- https://cdn.elifesciences.org/articles/72416/elife-72416-fig2-data1-v1.docx
Figure 2—figure supplement 1
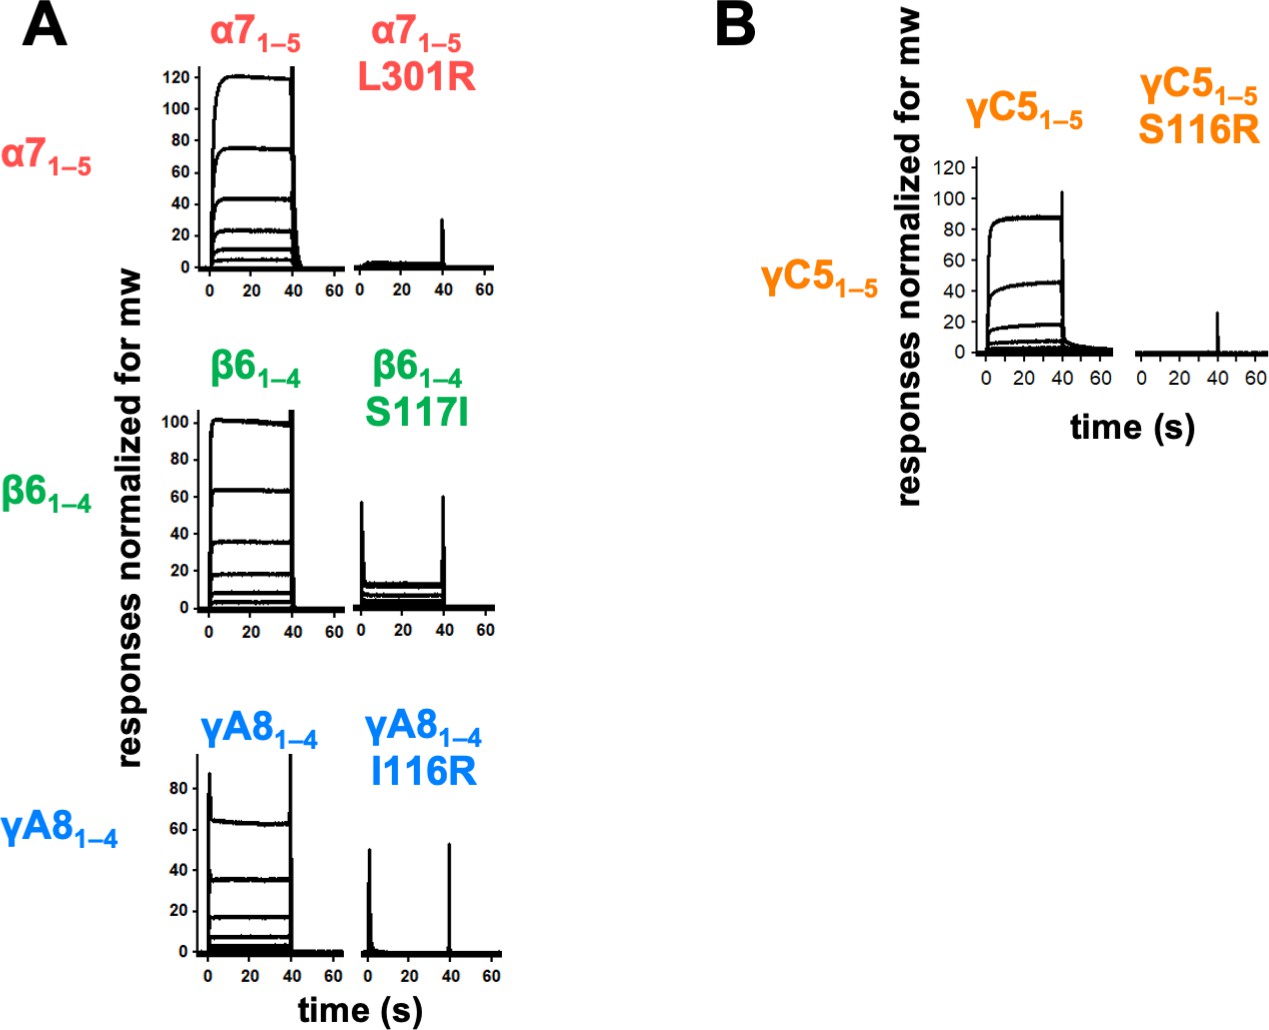
Trans interface mutants demonstrate homophilic interactions observed in surface plasmon resonance (SPR) are mediated by the trans dimer interface.
(A) SPR-binding curves for wild-type and trans mutant alternate clustered protocadherins (cPcdhs) flowed over their respective immobilized wild-type molecule. (B) SPR-binding curves for wild-type and trans mutant C-type cPcdh γC5 flowed over immobilized wild-type γC5.
Figure 2—figure supplement 2
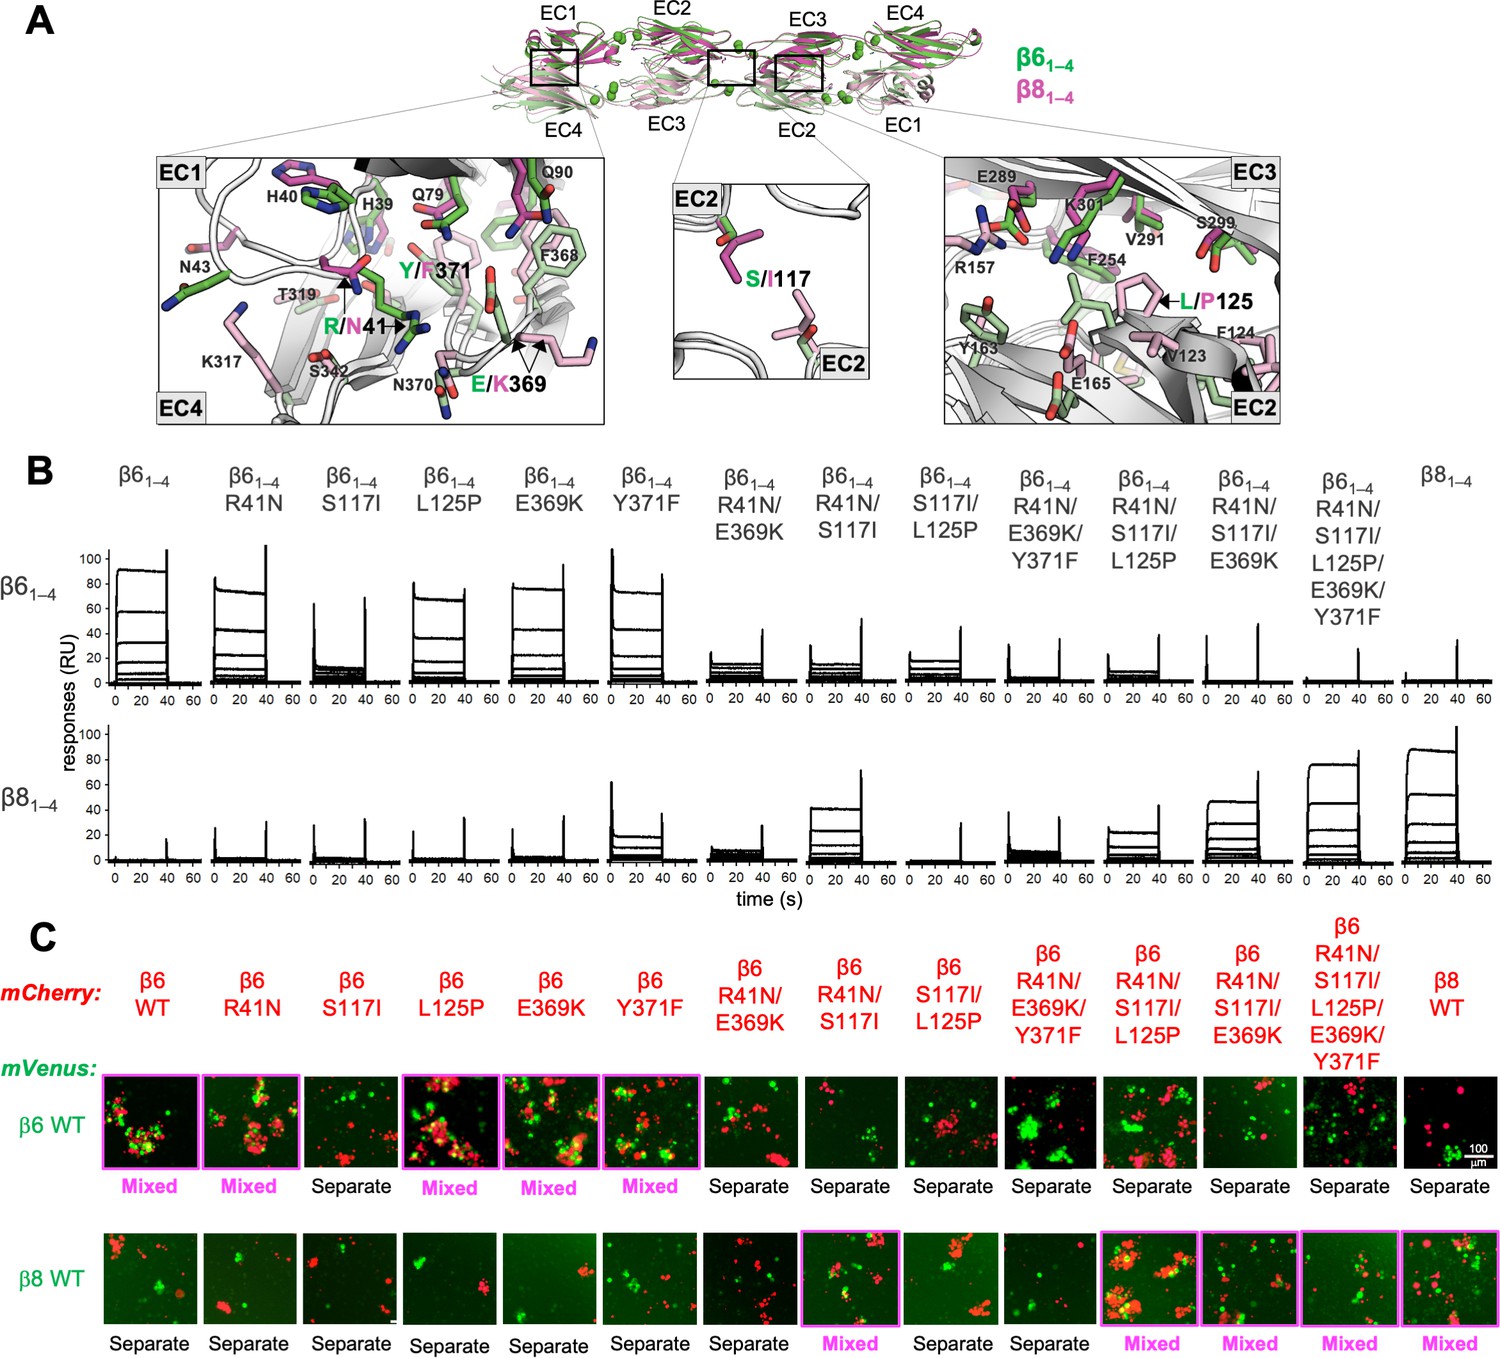
Mutagenesis experiments reveal role in trans specificity for the five interfacial residue differences between close pair β61–4 and β81–4.
(A) Structural superposition of the β61–4 and β81–4 trans dimer crystal structures (PDBs: 5DZX and 5DZY) shown in ribbon depiction above, with close-up views of the trans interfacial regions containing the five interfacial residues that vary between β61–4 and β81–4 shown below. The two protomers forming the β61–4 dimer are colored green and pale green, respectively. The β81–4 dimer is colored magenta/light pink. Bound calcium ions are shown as green spheres. Interfacial residue side chains are shown in the close-up views. The five variable residues are labeled with the β61–4 amino acid given in green and the β81–4 amino acid in magenta: R/N41 is in EC1; E/K369 and Y/F371 are in EC4; S/I117 is in EC2 and self-interacts at the trans dimer center of symmetry; and L/P125 is also in EC2. (B) Surface plasmon resonance (SPR)-binding profiles of β6 trans interface mutants converting β61–4 to β81–4 and the wild-type molecules (shown in columns) were flowed over surfaces coated with wild-type β61–4 or β81–4 (rows). (C) Results of the K562 coaggregation assay where cells transfected with mCherry-labeled β6 and β8 wild-types (WT) and the same trans specificity mutants as in (B) were each mixed with cells transfected with mVenus labeled β6 and β8 WT. Experiments where the red and green cells coaggregate demonstrating interaction between the mCherry-labeled WT or mutant clustered protocadherin (cPcdh) and the mVenus-labeled WT cPcdh are labeled ‘mixed’ and highlighted with magenta boxes. Scale bar, 100 μM.
Figure 3 with 1 supplement

C-type clustered protocadherin (cPcdh) γC4 adopts an EC1–4-mediated head-to-tail trans dimer like alternate cPcdhs with a comparatively weak dimer affinity.
(A) Ribbon diagrams of the γC4EC1–4 trans dimer crystal structures obtained from two different crystal forms. Bound calcium ions are shown as green spheres and glycans are shown in pale blue spheres. (B) The two crystal structures have a markedly different trans interface buried surface area (BSA). Left, surface views of the two trans dimer crystal structures highlight the difference, with a gap apparent in the EC2:EC3 region of the interface in crystal form two that is absent from crystal form 1. Surfaces are colored by atom type with the carbons colored orange for crystal form one and yellow for crystal form 2. Right, close-up view of the gap region in the crystal form two dimer with the side chains depicted as sticks. The intact crystal form 1 γC4 dimer is similar overall to those of the published intact alternate α, β, γA, and γB cPcdhs and the published δ2 nonclustered (nc) Pcdh trans dimers (root mean square deviation [RMSD] over aligned Cαs 2.4–4.5 Å; Figure 3—source data 2). The published crystal structures of γA1, γA8, and γB3 also show partially disrupted trans interfaces though in differing regions of the interface (Goodman et al., 2016a, Nicoludis et al., 2016). (C) Comparison between the (i) EC1:EC4 and (ii) EC2:EC3 regions of the γC4 (orange) and γB2 (blue, PDB 5T9T) trans dimer interfaces. Potential hydrogen bonds are depicted as dashed black/yellow (γC4) or blue (γB2) lines. (i) Structural alignment of the EC1:EC4 portion of the γC4 and γB2 trans dimers highlights a possible destabilizing role for γC4 residue E78 since unlike its counterpart in γB2 (D77), it is not juxtaposed with a basic residue. (ii) Similarly, an additional negatively charged residue (D290) which occupies a central position in the γC4 EC2:EC3 interface may also contribute to γC4’s comparatively weak trans dimer interaction. Distances between the D290 side chain and its nearest contacts are shown as dashed gray lines with distances given in Angstroms. (D) Sedimentation equilibrium analytical ultracentrifugation (AUC) experiments were conducted on γC4 EC1–4 wild-type (wt) and interface mutants to assess whether E78 and D290 negatively impact trans dimerization. Table details the oligomeric state and dissociation constants for each protein tested.
-
Figure 3—source data 1
X-ray crystallography data collection and refinement statistics.
- https://cdn.elifesciences.org/articles/72416/elife-72416-fig3-data1-v1.docx
-
Figure 3—source data 2
Overall structural similarity between cPcdh γC4, alternate cPcdhs, and non-clustered Pcdhs trans dimer structures.
- https://cdn.elifesciences.org/articles/72416/elife-72416-fig3-data2-v1.docx
Figure 3—figure supplement 1
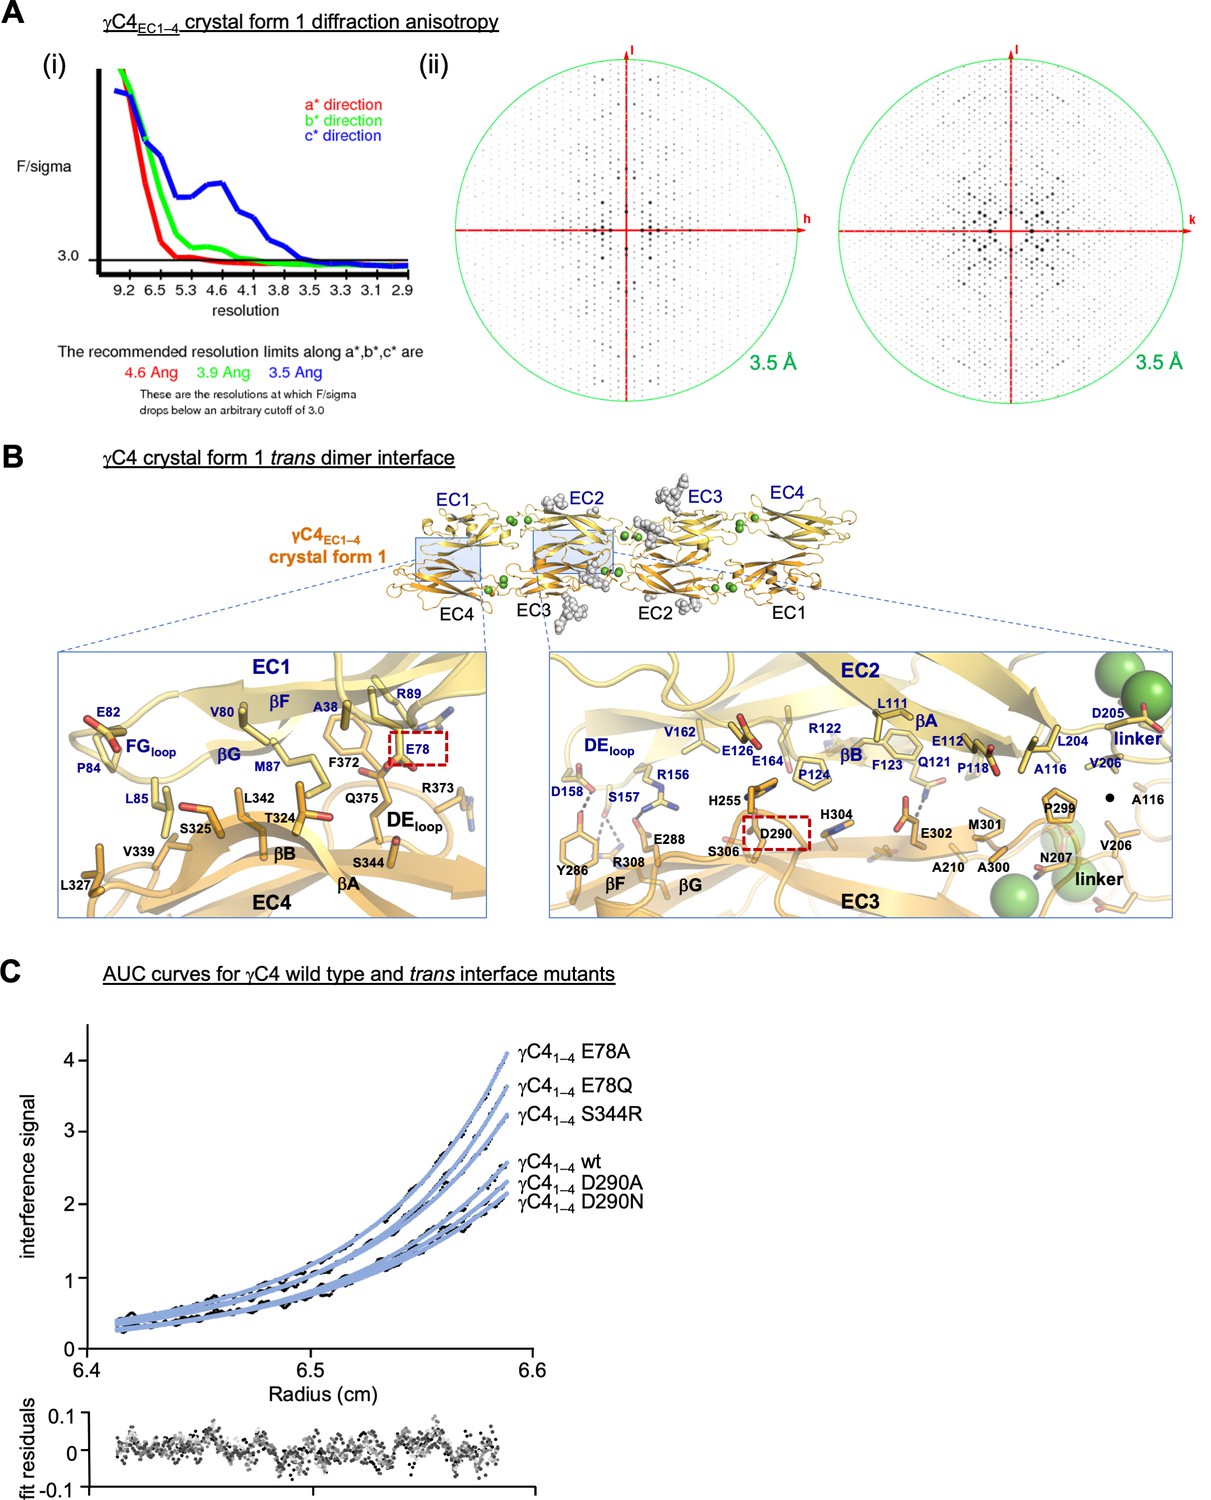
γC4 trans dimer crystal structures and trans interface analysis.
(A) Our crystallization experiments with γC4EC1–4 yielded two distinct crystal forms the first of which showed significant X-ray diffraction anisotropy. (i) UCLA Diffraction Anisotropy Server (Strong et al., 2006) plot shows the F/sigma by resolution along the a*, b*, and c* axes. (ii) Synthetic precession photographs of the X-ray diffraction in the k = 0 plane (left) and the h = 0 plane (right) showing the comparatively stronger/weaker diffraction. (B) Close-up views of the EC1:EC4 and EC2:EC3 interfacial regions from the first crystal form. One protomer in the symmetric dimer is colored yellow the other orange. Interfacial residues are labeled, side chains are shown in stick representation and dashed black lines depict potential interfacial hydrogen bond interactions. The two charged residues, E78 and D290, we selected for mutagenesis experiments to see whether they play a destabilizing role in the γC4 trans interaction are marked with red dashed boxes. (C) Representative plot of analytical ultracentrifugation (AUC) data for the wild-type (wt) and mutant γC4 EC1–4 molecules. Raw data are shown in black circles, and the nonlinear fits to a monomer-to-dimer model are shown as blue lines. The residuals between the data and fits are shown in the plot below. Table detailing the oligomeric state and dissociation constants determined from the AUC data is shown in Figure 3.
Figure 4 with 3 supplements
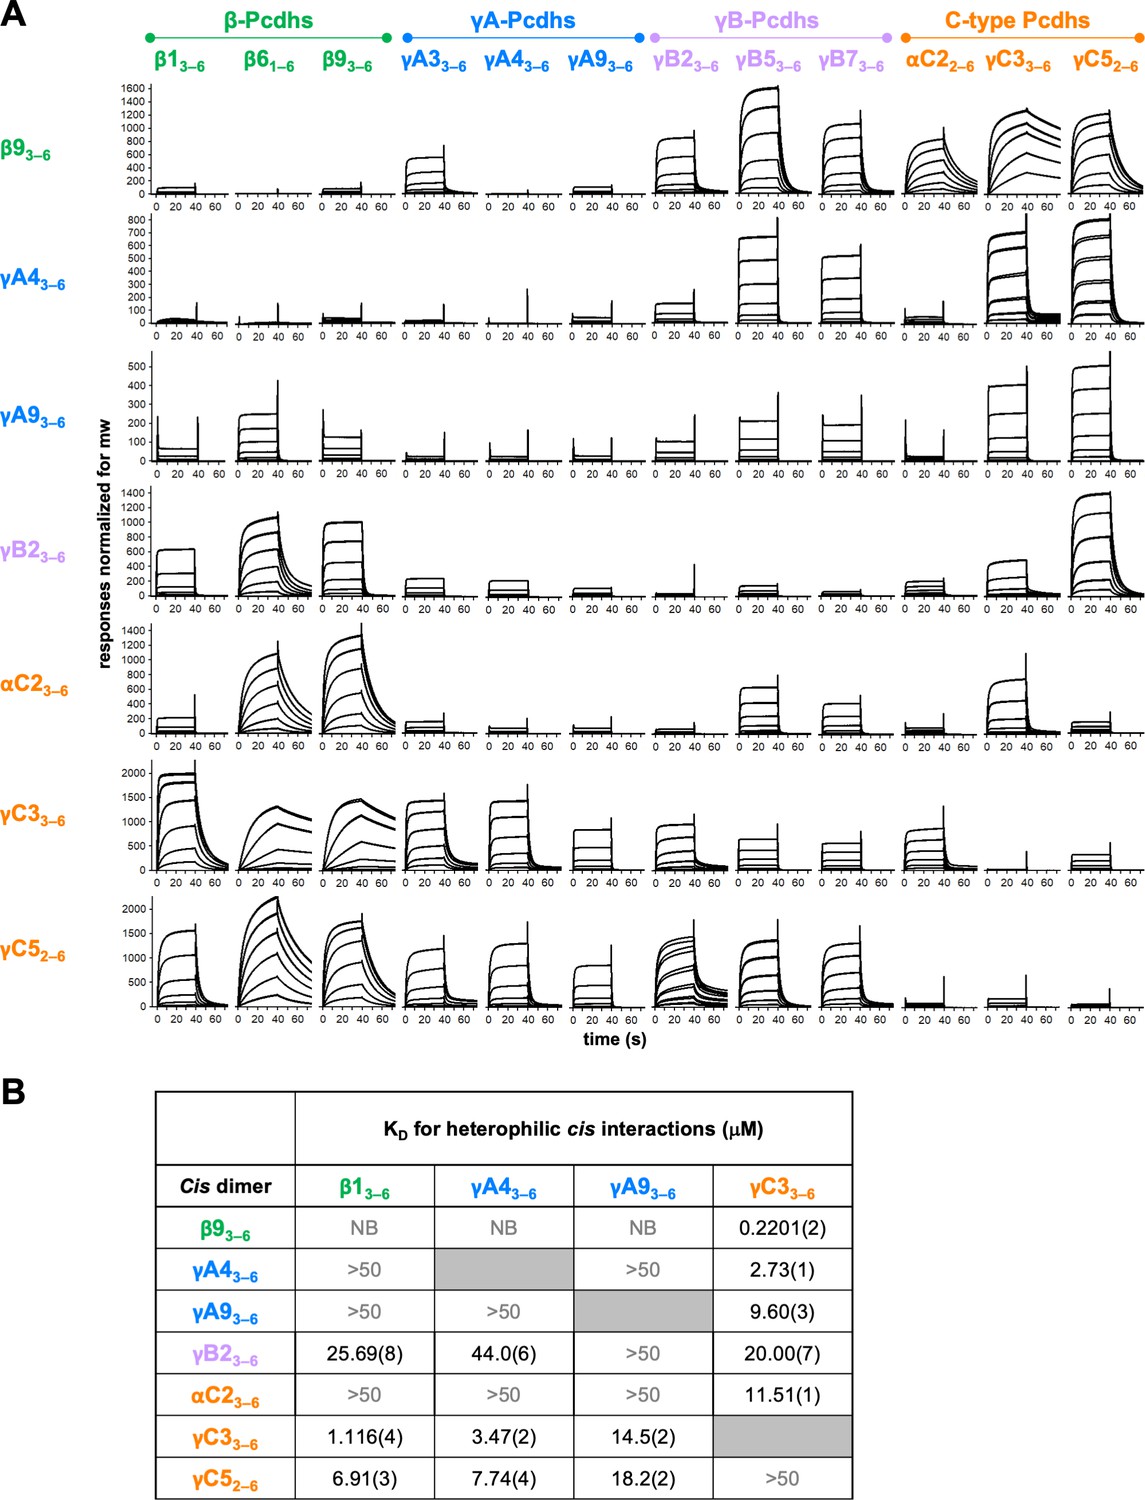
Clustered protocadherin (cPcdh) cis interactions are promiscuous with a preference for interfamily heterodimers.
(A) Surface plasmon resonance (SPR)-binding profiles of cPcdh cis fragment analytes from all cPcdh subfamilies except alphas (shown in columns) flowed over individual surfaces coated with cPcdh cis fragments. Binding profiles for each surface are individually scaled and responses are normalized for molecular weight. (B) Table of dissociation constants calculated from the SPR data for the four monomeric analytes. The number in brackets represents the error of the fit based on analysis of duplicate responses. Binding signals were not detected for interactions labeled NB (no binding) while >50 represents interactions with KDs > 50 μM, where an accurate KD cannot be determined.
-
Figure 4—source data 1
Sedimentation equilibrium analytical ultracentrifugation data for cis SPR reagents.
- https://cdn.elifesciences.org/articles/72416/elife-72416-fig4-data1-v1.docx
Figure 4—figure supplement 1
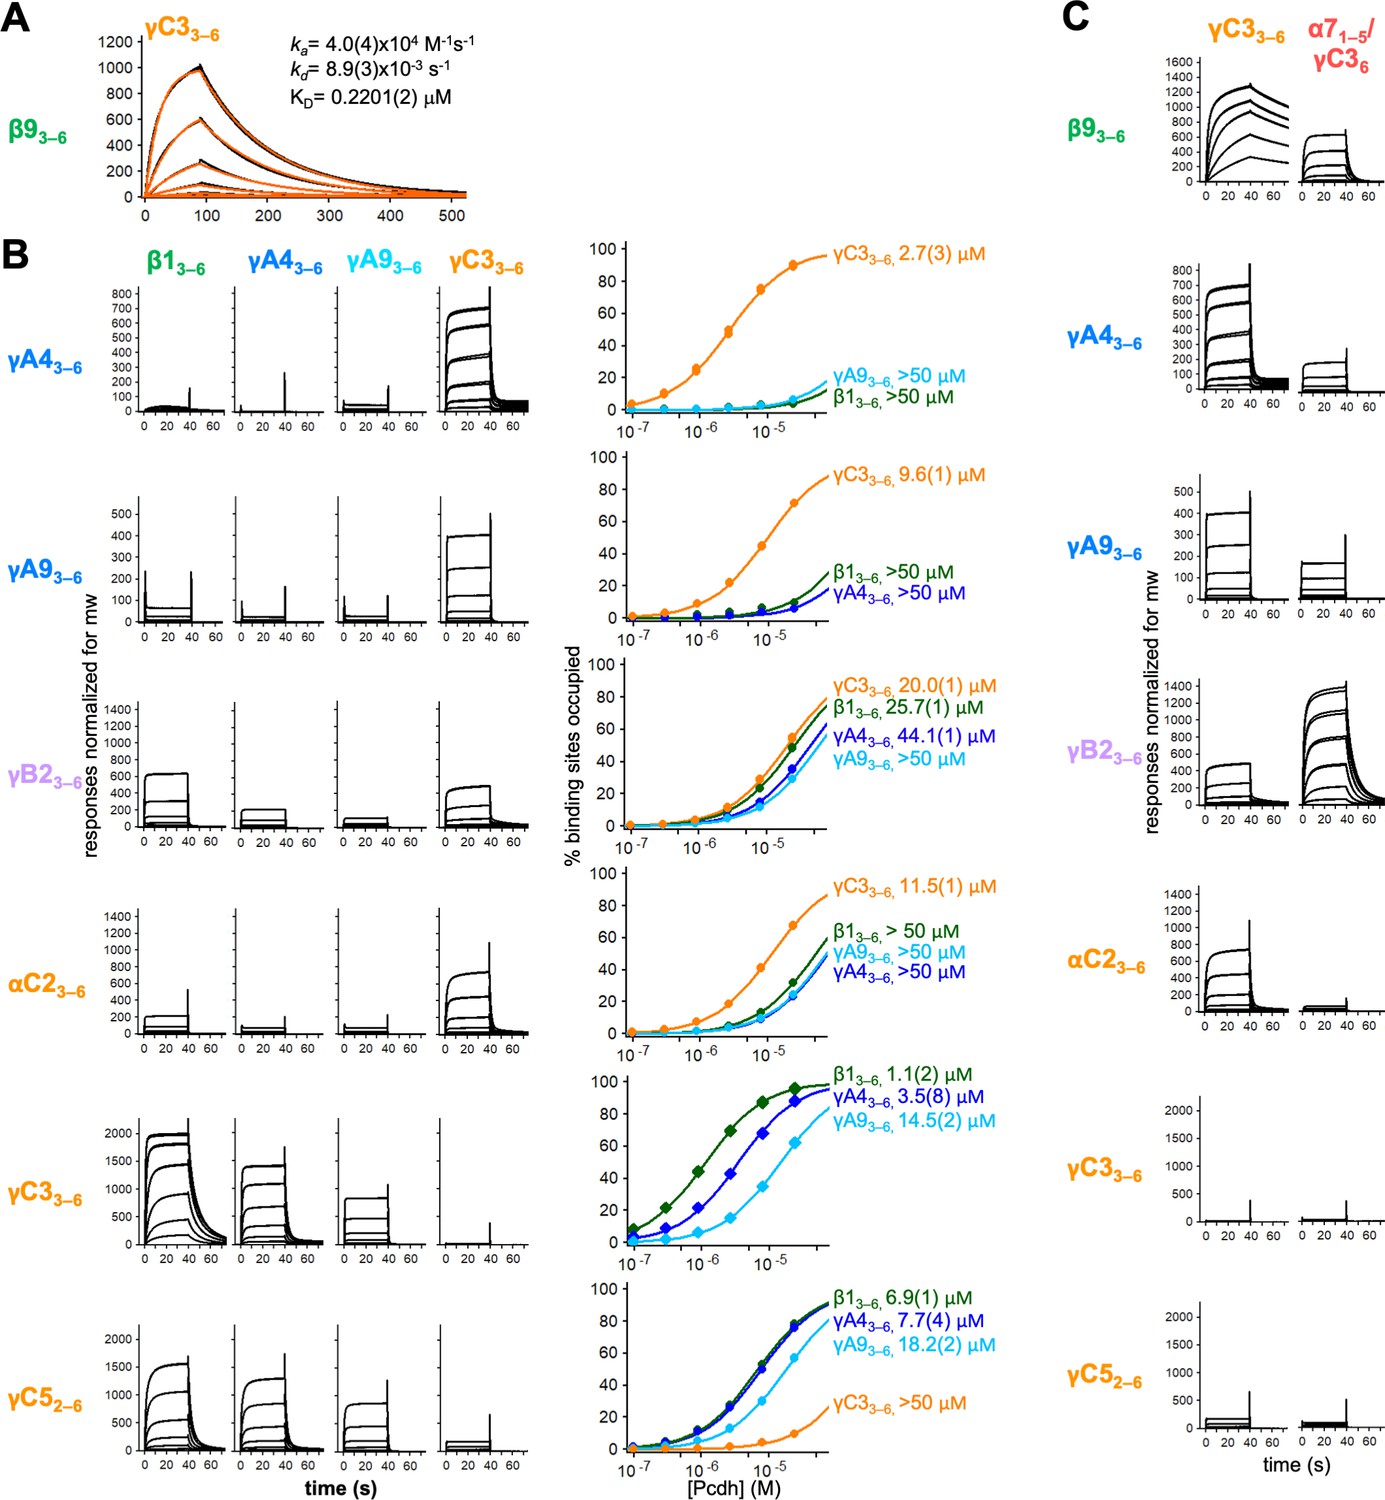
Calculation of cis interaction dissociation constants and the impact of an α-Pcdh EC5 on family-wide cis interactions.
(A) Kinetic binding analysis of γC33–6 analyte binding over a β93–6 covered surface. Data are shown in black, and the red traces represent the fit to an 1:1 binding model. (B) Left, surface plasmon resonance (SPR)-binding profiles from Figure 4 for the four monomeric cis fragment analytes over all six cis fragment surfaces. Right, fit of the binding data for these four analytes to 1:1 binding isotherms to calculate KDs. γA43–6 and γA93–6 are monomeric and they are not included in the binding isotherms over their respective surface. (C) SPR-binding profiles for γC33–6 (from Figure 4) and an α71–5/γC36 chimera flowed over the immobilized cis fragment surfaces. Binding profiles for each surface are individually scaled as in Figure 4.
Figure 4—figure supplement 2
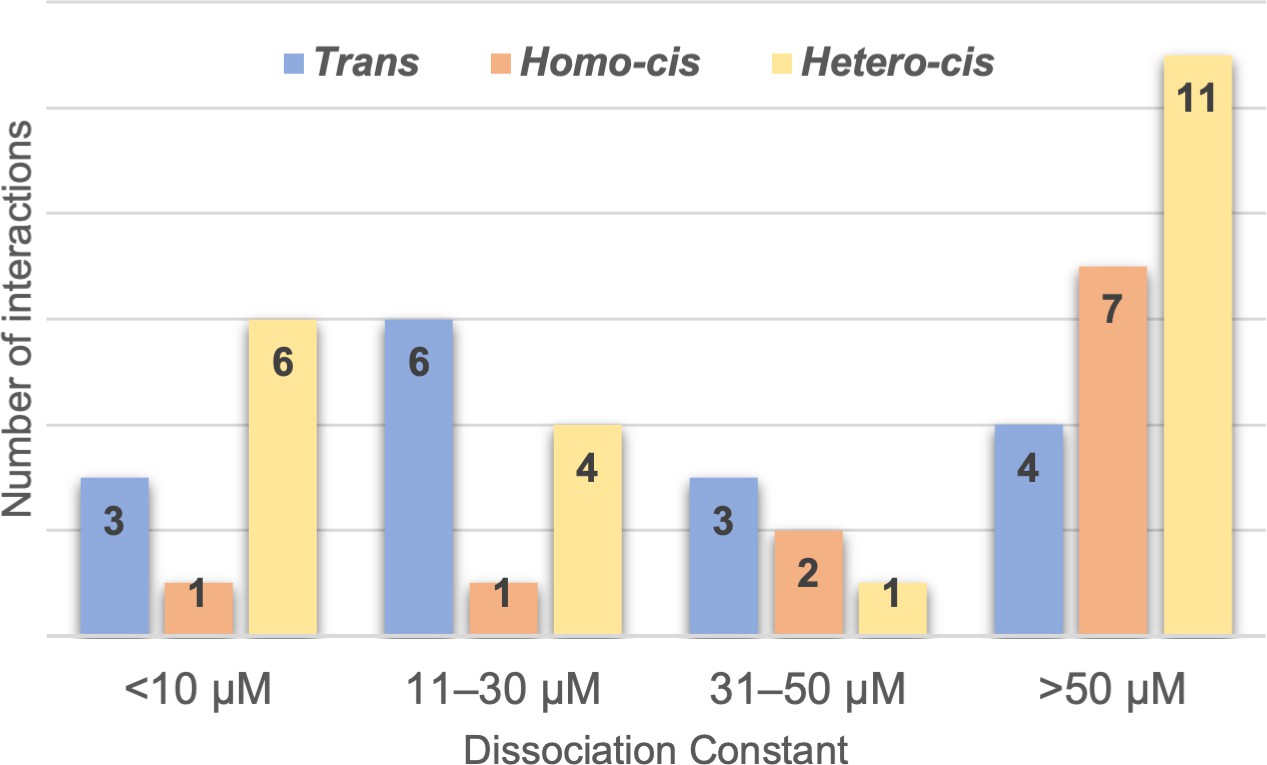
Range of clustered protocadherin (cPcdh) cis and trans dissociation constants, KDs.
Chart shows the cPcdh trans dimer, homophilic cis dimer, and heterophilic cis dimer interactions for which we have determined binding affinities divided into four subgroups based on their dissociation constant. The trans and homophilic cis dimer affinities were determined using analytical ultracentrifugation (AUC; Figure 2—source data 1 and Figure 4—source data 1) and the heterophilic cis dimer affinities were determined using surface plasmon resonance (SPR; Figure 4B). Of the interactions in the >50 μM group one trans interaction and four homophilic cis interactions are monomeric in solution (>500 μM KD in AUC). Three of the 11 heterophilic cis interactions in the >50 μM group show no binding in our SPR experiments based on a 40-RU-binding threshold.
Figure 4—figure supplement 3
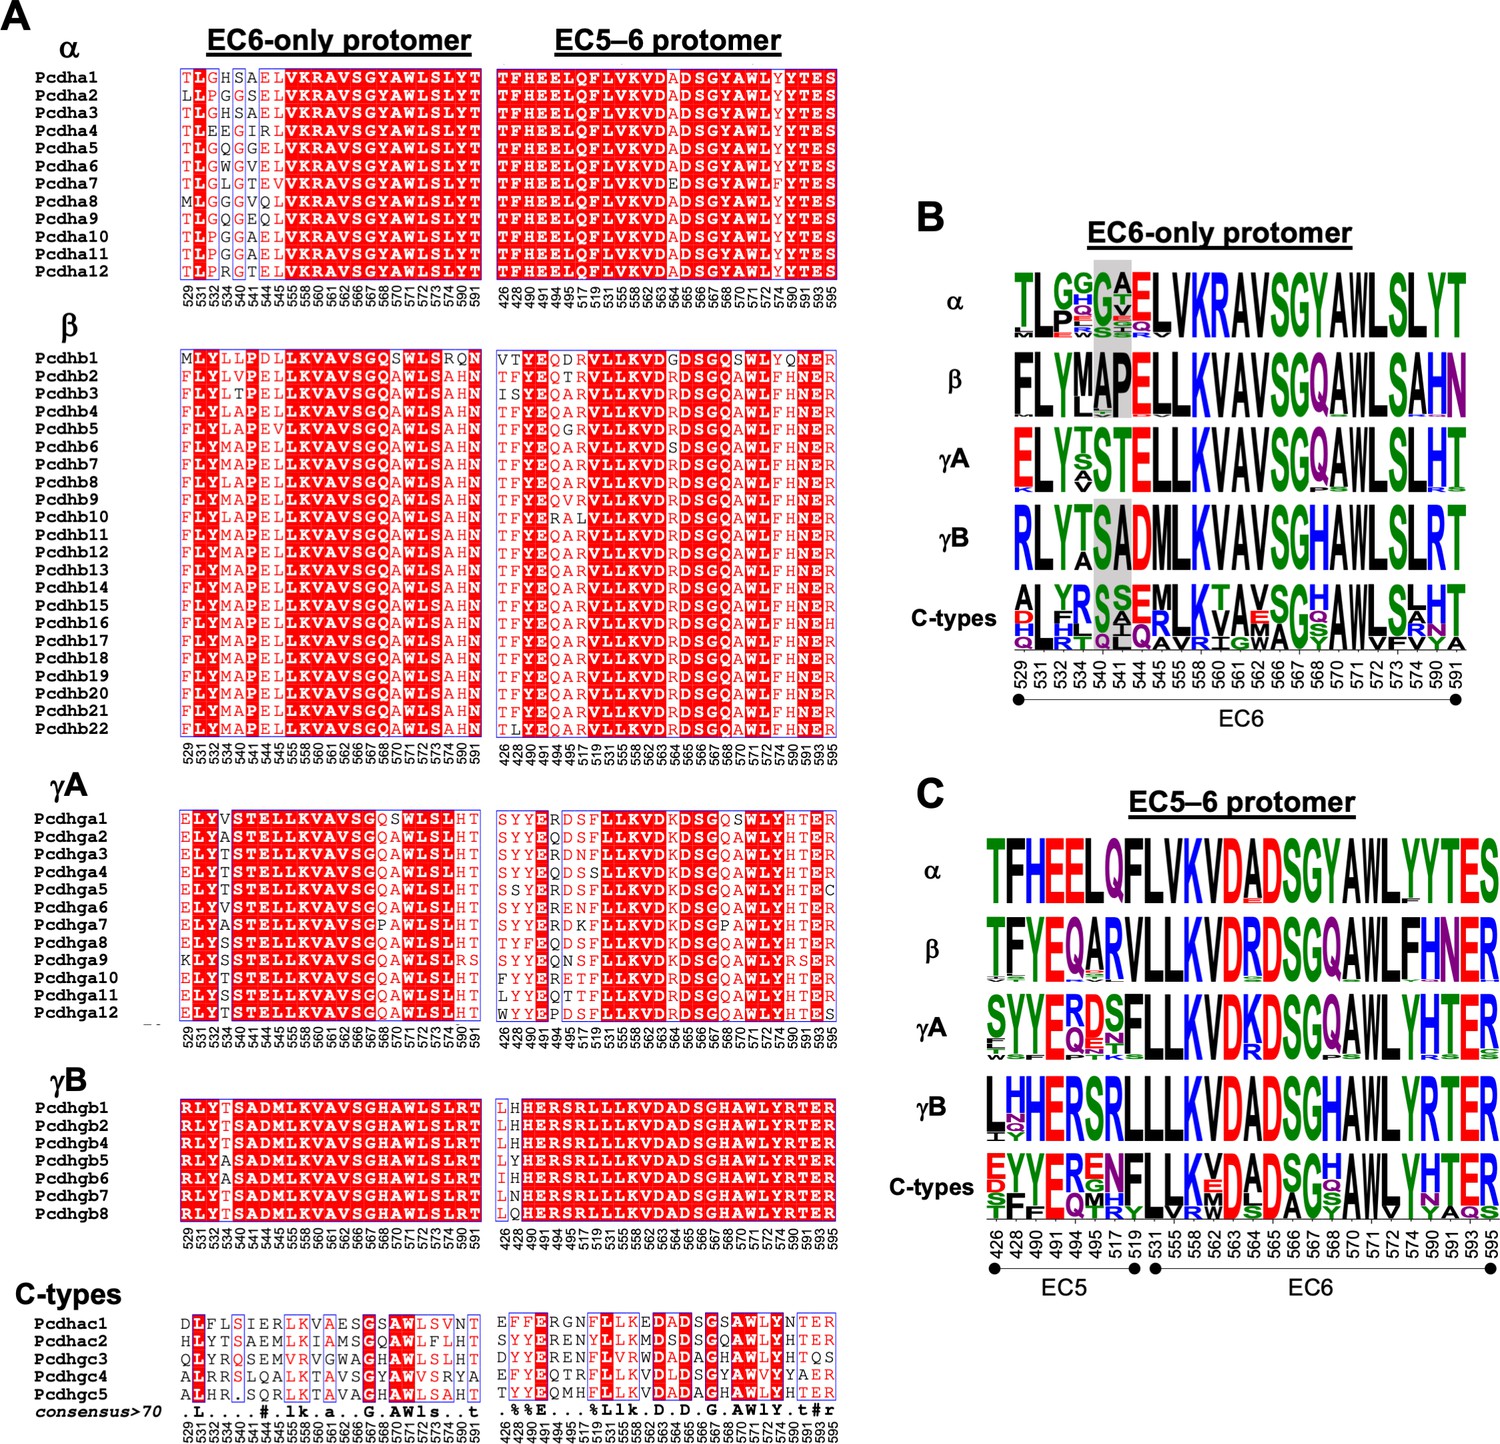
Amino acid sequence alignment reveals conservation of cis interfacial residues within the alternate clustered protocadherin (cPcdh) subfamilies.
(A) Amino acid sequence alignments of cis interfacial residues from the EC6-only and EC5–6 surfaces for all 58 mouse cPcdhs subdivided by subfamily. Completely conserved residues are highlighted in red with white lettering. Residues 540 and 541 are included in the EC6-only alignments since the crystal structure of γA4 EC3–6 (PDB: 5SZQ) revealed a distinct EC6 A–A′ loop architecture to that observed in the γB2, 4, and 7 (PDBs: 5SZR, 6E6B, and 5V5X) cis fragment crystal structures that would place these residues in the EC6-only interface if maintained in cis interactions. (B) Sequence logos based on the sequence alignment shown in (A) for the EC6-only cis interfacial residues from each of the five cPcdh subfamilies highlighting the similarities and conserved differences between the subfamilies. Residues 540 and 541 are included for all isoforms but grayed out for the non-γA isoforms since their involvement may be γA specific. NB: Previous studies have shown that α-cPcdhs have an impaired EC6-only interface (Thu et al., 2014; Goodman et al., 2017). (C) Sequence logos for the EC5–6 cis interfacial residues from each of the five cPcdh subfamilies.
Figure 5 with 2 supplements
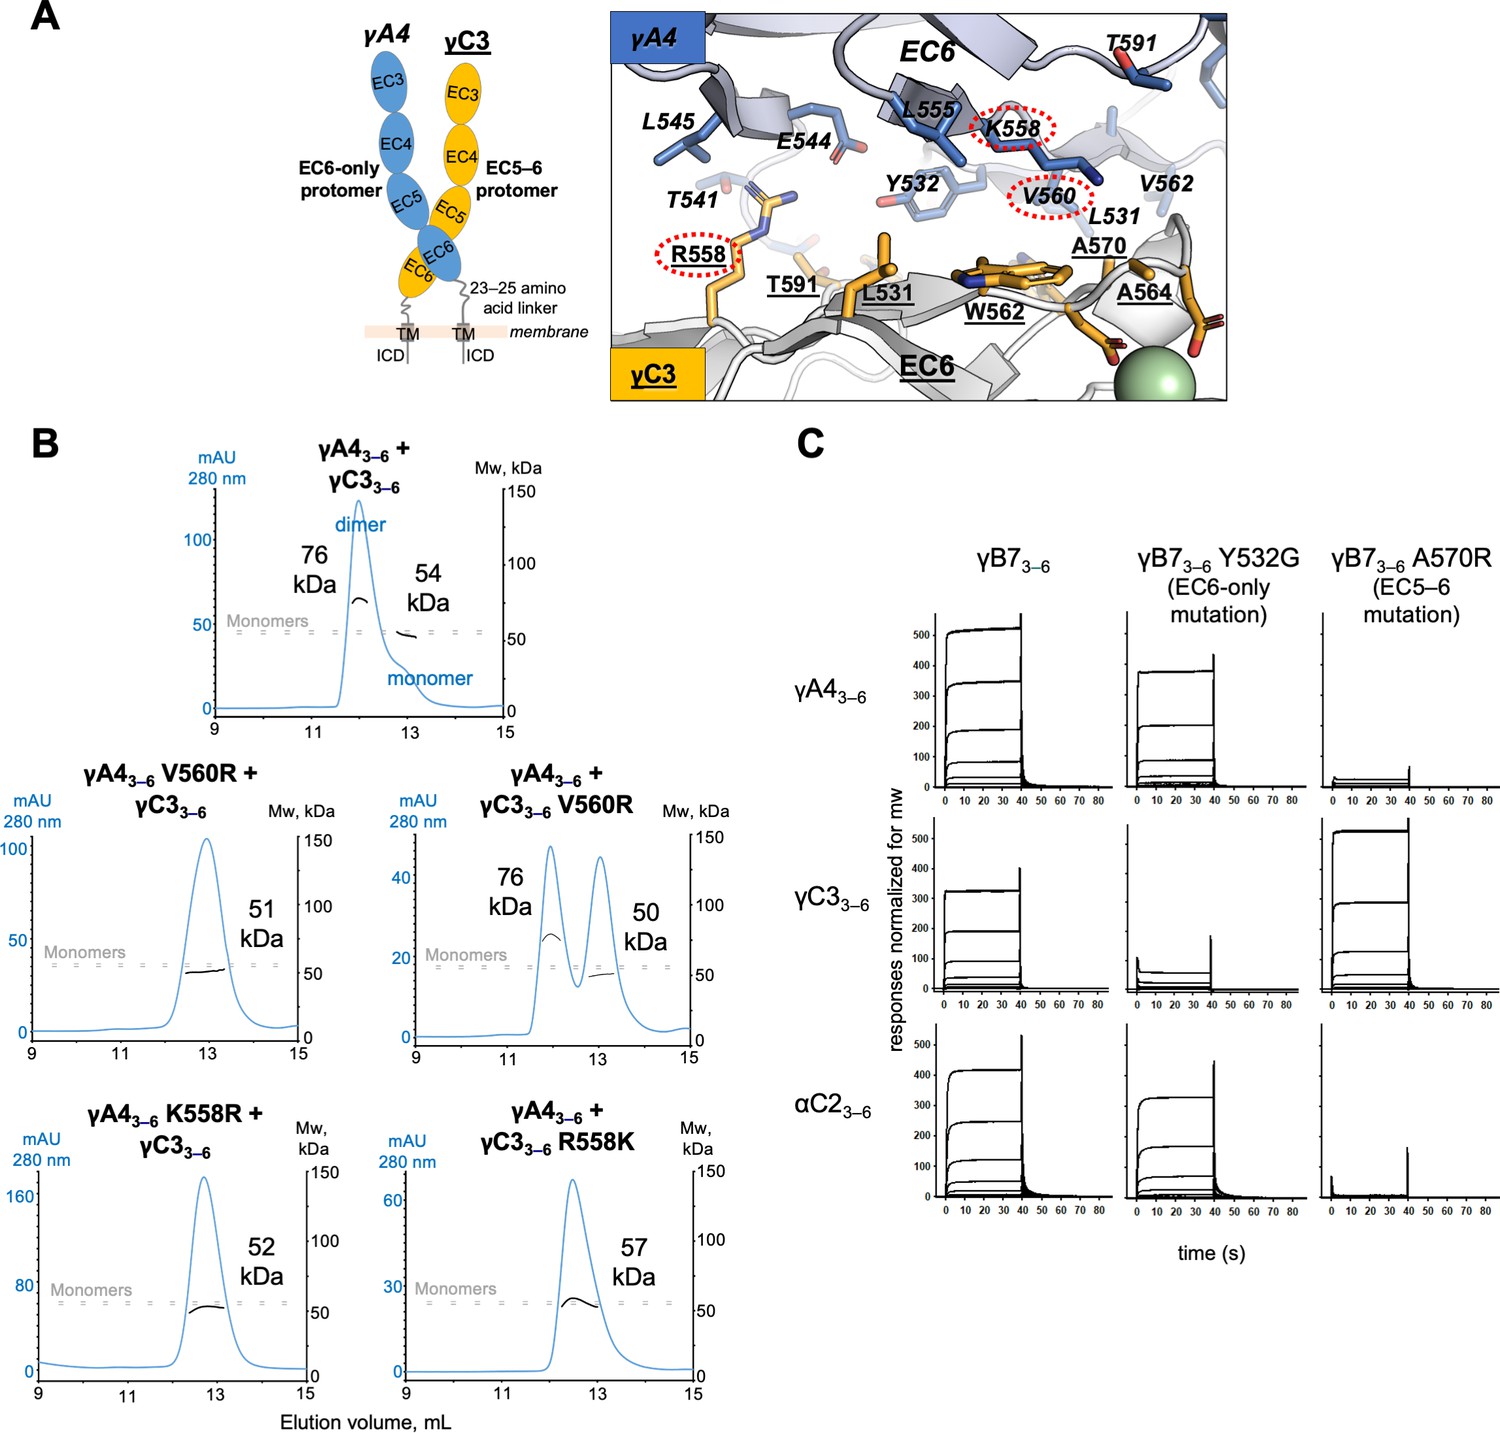
γA4 preferentially forms the EC6-only side and γC3 the EC5–6 side in cis dimers.
(A) Structural model of γA4/γC3 cis dimer based on γB7EC3–6 cis dimer and γA4EC3–6 crystal structures (PDBs: 5V5X and 5SZQ). γA4 is shown adopting the EC6-only side (blue protomer) and γC3 is shown adopting the EC5–6 side (yellow protomer). Left, schematic of the γA4/γC3 EC3–6 cis dimer. Right, close-up view of the EC6:EC6 interface from the modeled cis dimer showing interfacial residue side chains. Bound calcium ions are shown as green spheres. Residues which were mutated in the panel B are circled in red. γB7 crystal structure numbering is used for both γA4 and γC3 residues. See methods for γA4 and γC3 alignment. Please note the model shown here is solely for hypothesis generation, since it is unlikely to be completely accurate. See methods for further details of structural modeling. (B) Top, size exclusion-coupled multiangle light scattering (SEC-MALS) data for an equimolar mixture of wild-type γA4EC3–6 and γC3EC3–6 showing dimer formation. Plot shows size exclusion absorbance at 280 nm trace (left axis), molecular weight of the eluant peaks (right axis), and the monomer molecular weights of γA4EC3–6 and γC3EC3–6 measured by mass spectrometry – 54.5 and 56.5 kDa, respectively – as dashed gray lines. Average molecular weight of the molecules in the dimer and monomer eluant peaks are labeled. Middle, SEC-MALS data for V560R mutants, which target the EC6-only side of the interface. Bottom, SEC-MALS data for residue 558 mutants. The γC3-like K558R mutation in γA4 inhibits heterodimer formation with wild-type γC3. Similarly, the γA4-like R558K in γC3 inhibits dimerization with wild-type γA4. (C) SPR-binding profiles for γB7EC3–6 wild-type and cis interface mutants flowed over three individual wild-type cis fragment surfaces. The two mutations specifically target one side of the cis interface.
Figure 5—figure supplement 1
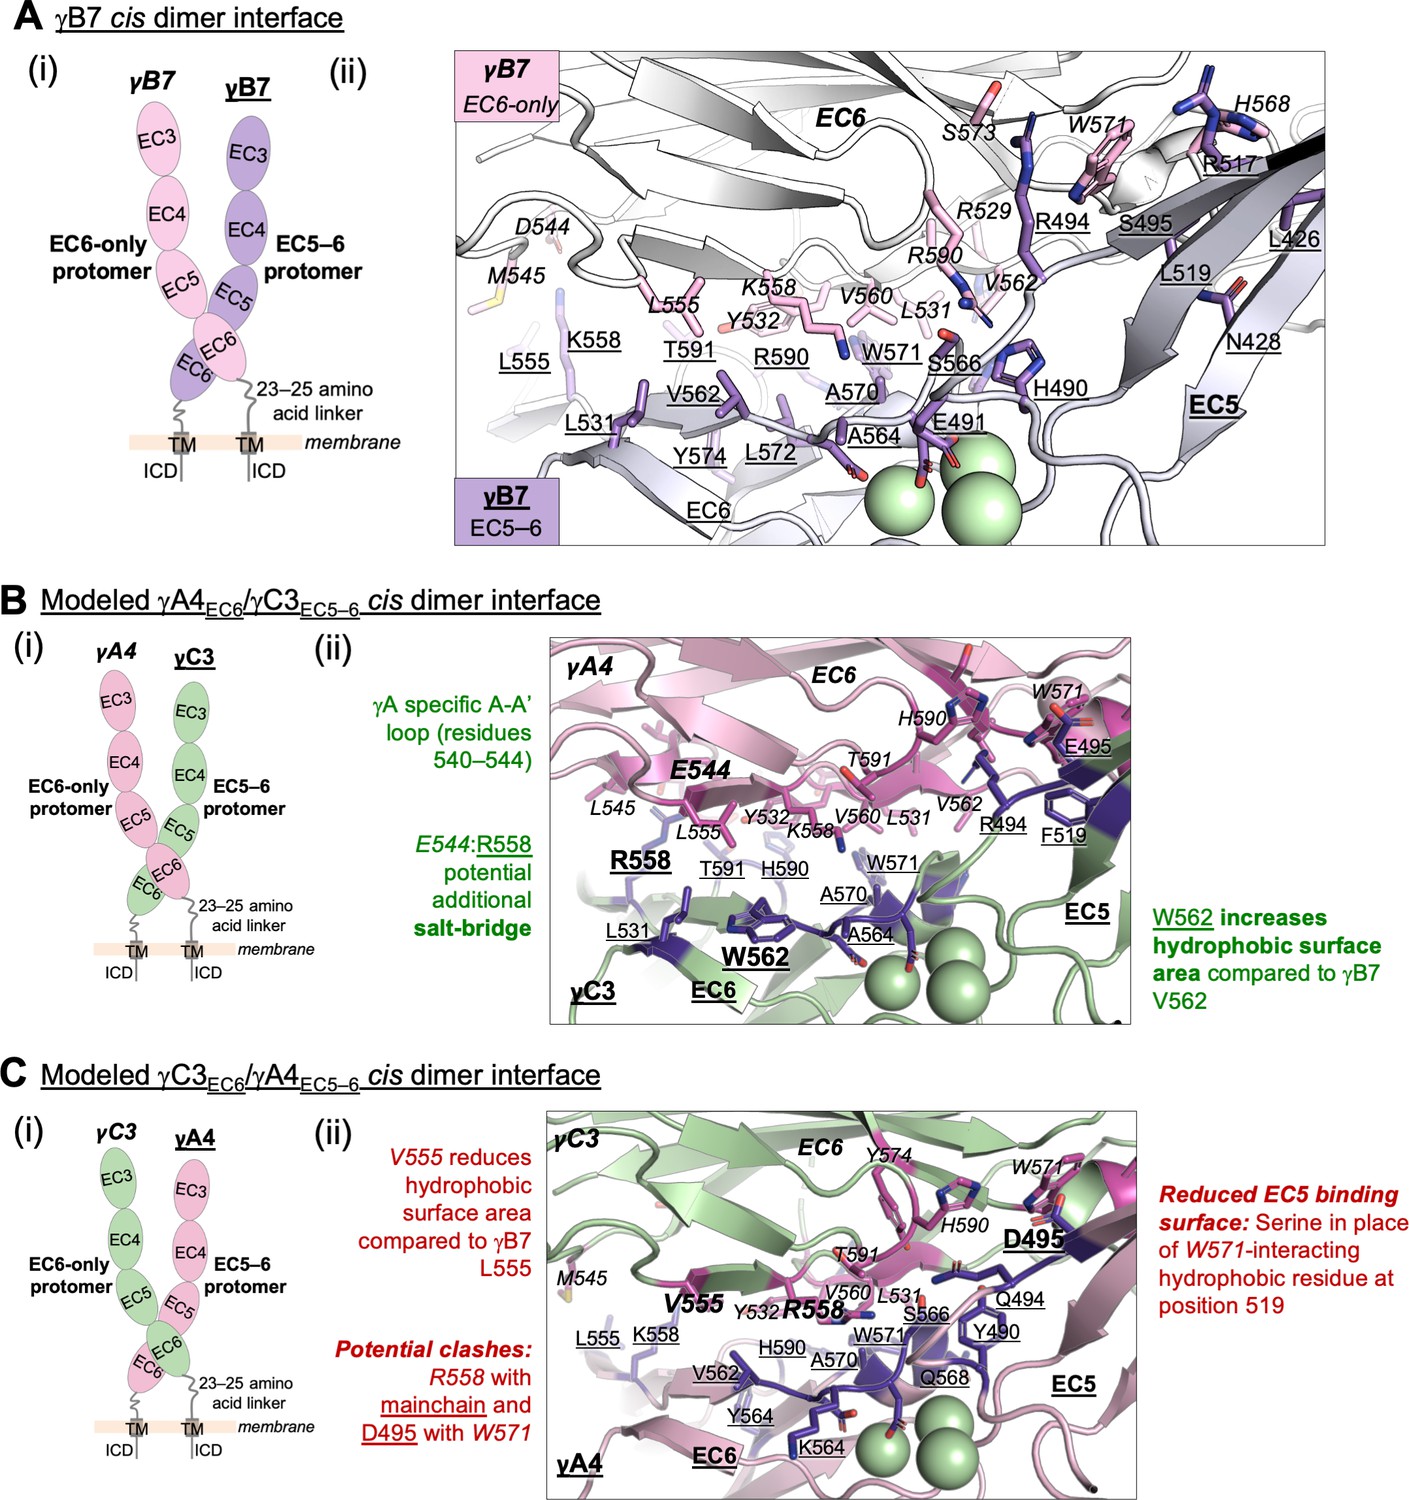
Structure-guided sequence analysis of γA4 and γC3 cis interactions.
(A) (i) Schematic of the asymmetric γB7EC3–6 cis dimer crystal structure. (ii) Close-up view of the γB7 cis interface: interfacial residue side chains are shown in pink for the EC6-only protomer and purple for the EC5–6 protomer. Bound calcium ions are shown as green spheres. (B) (i) Schematic of the γA4EC6/γC3EC5–6 cis dimer. (ii) Model of the γA4EC6/γC3EC5–6 cis dimer interaction generated using structural alignment of EC6 from the monomeric γA4 EC3–6 crystal structure (PDB 5SZQ) to the γB7 EC3–6 cis dimer structure for the EC6-only side and computational mutagenesis of γB7 to γC3 selecting the best-fit rotamer (without energy minimization) for the EC5–6 side. The model suggests that this will be the preferred orientation for the γA4/γC3 cis dimer interaction. Favorable residue differences between γB7 from (A) and γA4/γC3 in this orientation are noted in green. Please note the model shown here is only used for hypothesis generation, since it is unlikely to be completely accurate. (C) (i) Schematic of the γC3EC6/γA4EC5–6 cis dimer. (ii) Model of the γC3EC6/γA4EC5–6 cis dimer generated using computational mutagenesis of γB7 to γC3 selecting the best-fit rotamer (without energy minimization) for the EC6-only side and structural alignment of EC5–6 from the γA4 EC3–6 crystal structure to the γB7 EC3–6 cis dimer structure for the EC5–6 side. The model suggests that this orientation for the γA4/γC3 cis dimer interaction will be disfavored. Unfavorable residue differences between γB7 and γA4/γC3 in this orientation are noted in red. Please note the model shown here is unlikely to be completely accurate and is simply for hypothesis generation.
Figure 5—figure supplement 2
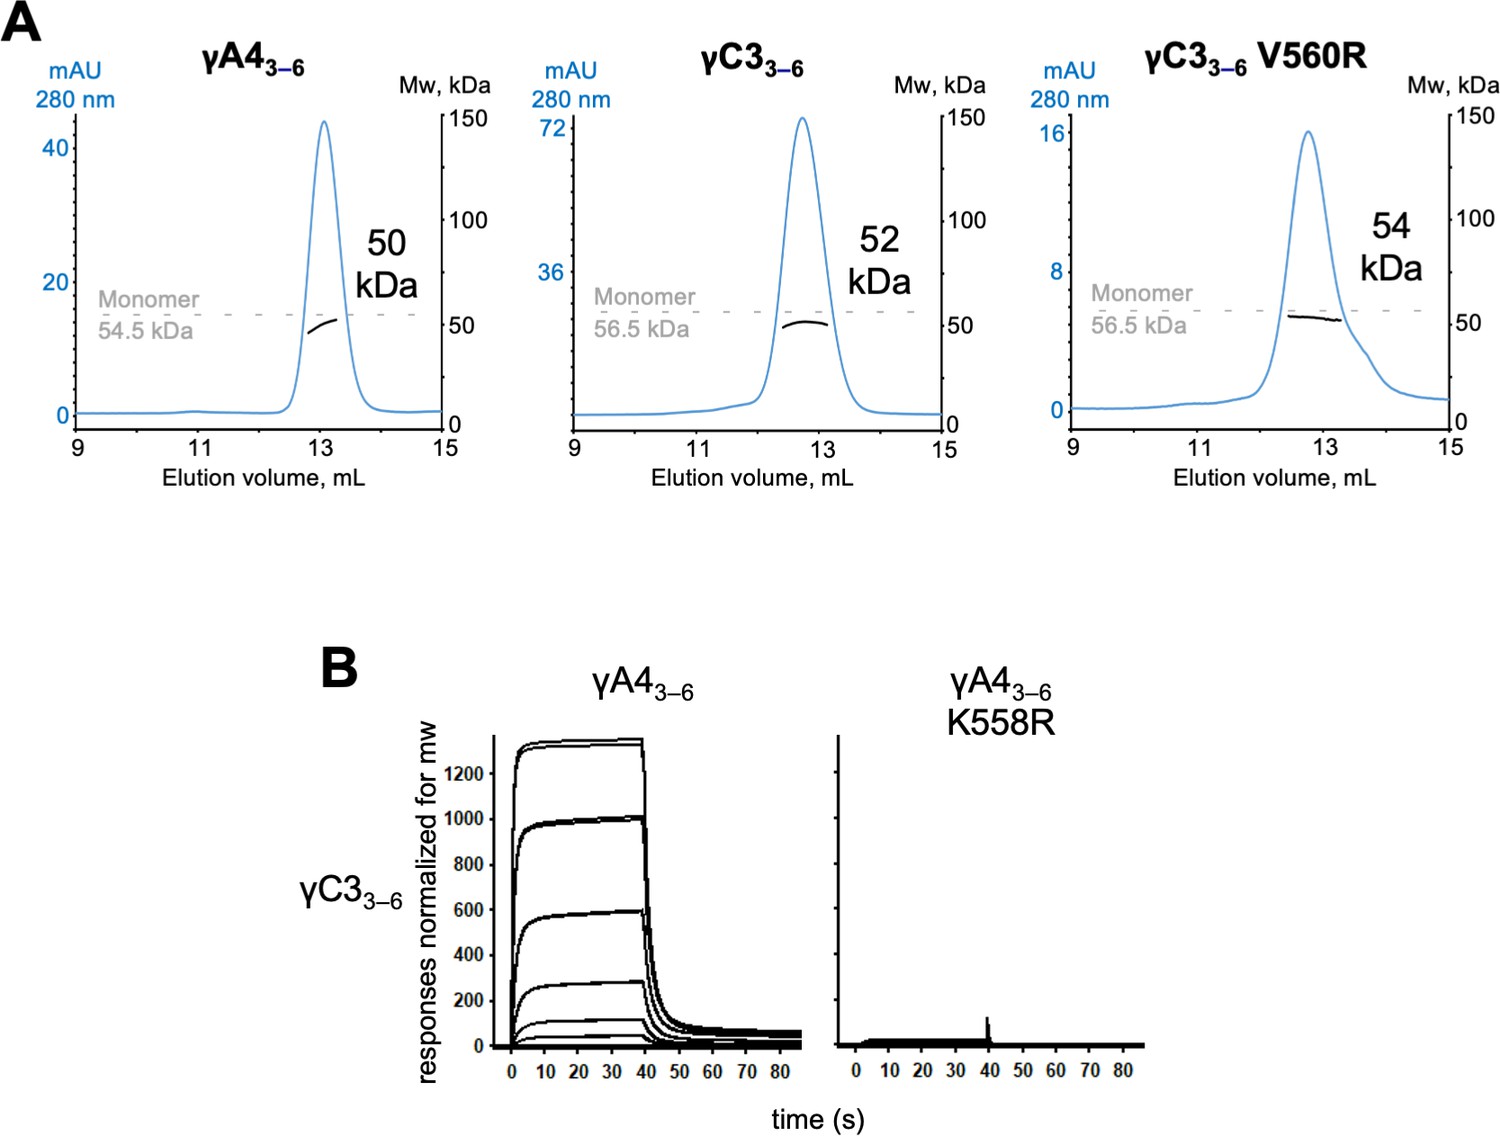
γA4 and γC3 cis fragments behave as monomers in size exclusion-coupled multiangle light scattering (SEC-MALS) and mutating γA4 to make it more like γC3 prevents γA4/γC3 cis heterodimerization.
(A) SEC-MALS data for wild-type γA43–6, wild-type γC33–6, and γC33–6 V560R showing all three molecules are monomeric in SEC-MALS, consistent with their behavior in sedimentation equilibrium AUC. Plots show size exclusion absorbance at 280 nm trace in blue (left axis), molecular weight of the eluant peak in black (right axis), and the monomer molecular weight of γA43–6 or γC33–6 measured by mass spectrometry – 54.5 and 56.5 kDa, respectively – as dashed gray lines. Average molecular weight of the molecules in the eluant peaks are labeled. (B) Surface plasmon resonance (SPR)-binding profiles for γA43–6 wild-type and γA43–6 with γC3-like cis interface mutation K558R flowed over immobilized wild-type γC33–6. Loss of γC33–6 interaction in the presence of the K558R mutation is consistent with the SEC-MALS results shown in Figure 5.
Tables
Appendix 1—key resources table
| Reagent type (species) or resource | Designation | Source or reference | Identifiers | Additional information |
|---|---|---|---|---|
| Strain, strain background (E. coli) | One shot Top10 Competent Cells | Invitrogen | C4040-06 | Plasmid production |
| Cell line (Homo sapiens) | FreeStyle 293 F cells | Thermo Fisher Scientific | R79007 | Cell line for protein expression |
| Cell line (Homo sapiens) | K-562 bone marrow chronic myelogenous leukemia (CML) cells | ATCC | ATCC CCL-243 | Cell line for cell-aggregation assays |
| Transfected construct (M. musculus) | α41–5 | This paper | Pcdhα4 EC1–5, Honig/Shapiro labs | |
| Transfected construct (M. musculus) | α71–5 | Rubinstein et al., 2015 | ||
| Transfected construct (M. musculus) | α121–5 | This paper | Pcdhα12 EC1–5, Honig/Shapiro labs | |
| Transfected construct (M. musculus) | β61–4 | Goodman et al., 2016c | ||
| Transfected construct (M. musculus) | β81–4 | Goodman et al., 2016c | ||
| Transfected construct (M. musculus) | γA11–4 | Goodman et al., 2016a | ||
| Transfected construct (M. musculus) | γA41–4 | Goodman et al., 2016a | ||
| Transfected construct (M. musculus) | γA81–4 | Rubinstein et al., 2015 | ||
| Transfected construct (M. musculus) | γA91–5 | Goodman et al., 2016a | ||
| Transfected construct (M. musculus) | γB21–5 | Goodman et al., 2016a | ||
| Transfected construct (M. musculus) | γB41–5 | This paper | PcdhγB4 EC1–5, Honig/Shapiro labs | |
| Transfected construct (M. musculus) | γB51–4 | Goodman et al., 2016a | ||
| Transfected construct (M. musculus) | αC21–4 | Rubinstein et al., 2015 | ||
| Transfected construct (M. musculus) | γC31–4 | Goodman et al., 2016a | ||
| Transfected construct (M. musculus) | γC41–4 | This paper | PcdhγC4 EC1–4, Honig/Shapiro labs | |
| TRansfected construct (M. musculus) | γC51–5 | Rubinstein et al., 2015 | ||
| Transfected construct (M. musculus) | α71–5-AVI | This paper | Biotinylated Pcdhα7 EC1–5, Honig/Shapiro labs | |
| Transfected construct (M. musculus) | β61–4-AVI | This paper | Biotinylated Pcdhβ6 EC1–4, Honig/Shapiro labs | |
| Transfected construct (M. musculus) | β81–4-AVI | This paper | Biotinylated Pcdhβ8 EC1–4, Honig/Shapiro labs | |
| Transfected construct (M. musculus) | γA81–4-AVI | This paper | Biotinylated PcdhγA8 EC1–4, Honig/Shapiro labs | |
| Transfected construct (M. musculus) | γA91–5-AVI | This paper | Biotinylated PcdhγA9 EC1–5, Honig/Shapiro labs | |
| Transfected construct (M. musculus) | γB21–5-AVI | This paper | Biotinylated PcdhγB2 EC1–5, Honig/Shapiro labs | |
| Transfected construct (M. musculus) | αC21–4-AVI | This paper | Biotinylated PcdhαC2 EC1–4, Honig/Shapiro labs | |
| Transfected construct (M. musculus) | γC31–4-AVI | This paper | Biotinylated PcdhγC3 EC1–4, Honig/Shapiro labs | |
| Transfected construct (M. musculus) | γC41–4-AVI | This paper | Biotinylated PcdhγC4 EC1–4, Honig/Shapiro labs | |
| Transfected construct (M. musculus) | γC51–5-AVI | This paper | Biotinylated PcdhγC5 EC1–5, Honig/Shapiro labs | |
| Transfected construct (M. musculus) | α41–4-AVI | This paper | Biotinylated Pcdhα4 EC1–4, Honig/Shapiro labs | |
| Transfected construct (M. musculus) | α71–5 L301R | This paper | Pcdhα7 EC1–5 mutant, Honig/Shapiro labs | |
| Transfected construct (M. musculus) | γA81–4 I116R | Rubinstein et al., 2015 | PcdhγA8 EC1–4 mutant, Honig/Shapiro labs | |
| Transfected construct (M. musculus) | β61–4 R41N | This paper | Pcdhβ6 EC1–4 mutant, Honig/Shapiro labs | |
| Transfected construct (M. musculus) | γC51–5 S116R | This paper | PcdhγC5 EC1–5 mutant, Honig/Shapiro labs | |
| Transfected construct (M. musculus) | β61–4 S117I | This paper | Pcdhβ6 EC1–4 mutant, Honig/Shapiro labs | |
| Transfected construct (M. musculus) | β61–4 L125P | This paper | Pcdhβ6 EC1–4 mutant, Honig/Shapiro labs | |
| Transfected construct (M. musculus) | β61–4 E369K | This paper | Pcdhβ6 EC1–4 mutant, Honig/Shapiro labs | |
| Transfected construct (M. musculus) | β61–4 Y371F | This paper | Pcdhβ6 EC1–4 mutant, Honig/Shapiro labs | |
| Transfected construct (M. musculus) | β61–4 R41N/S117I | This paper | Pcdhβ6 EC1–4 mutant, Honig/Shapiro labs | |
| Transfected construct (M. musculus) | β61–4 R41N/E369K | This paper | Pcdhβ6 EC1–4 mutant, Honig/Shapiro labs | |
| Transfected construct (M. musculus) | β61–4 S117I/L125P | This paper | Pcdhβ6 EC1–4 mutant, Honig/Shapiro labs | |
| Transfected construct (M. musculus) | β61–4 R41N/S117I/L125P | This paper | Pcdhβ6 EC1–4 mutant, Honig/Shapiro labs | |
| Transfected construct (M. musculus) | β61–4 R41N/S117I/E369K | This paper | Pcdhβ6 EC1–4 mutant, Honig/Shapiro labs | |
| Transfected construct (M. musculus) | β61–4 R41N/S117I/Y371F | This paper | Pcdhβ6 EC1–4 mutant, Honig/Shapiro labs | |
| Transfected construct (M. musculus) | β61–4 R41N/S117I/L125P/E369K/Y371F | This paper | Pcdhβ6 EC1–4 mutant, Honig/Shapiro labs | |
| Transfected construct (M. musculus) | γC41–4 E78A | This paper | PcdhγC4 EC1–4 mutant, Honig/Shapiro labs | |
| Transfected construct (M. musculus) | γC41–4 E78Q | This paper | PcdhγC4 EC1–4 mutant, Honig/Shapiro labs | |
| Transfected construct (M. musculus) | γC41–4 S344R | This paper | PcdhγC4 EC1–4 mutant, Honig/Shapiro labs | |
| Transfected construct (M. musculus) | γC41–4 D290A | This paper | PcdhγC4 EC1–4 mutant, Honig/Shapiro labs | |
| Transfected construct (M. musculus) | γC41–4 D290N | This paper | PcdhγC4 EC1–4 mutant, Honig/Shapiro labs | |
| Transfected construct (M. musculus) | β13–6 | This paper | Pcdhβ1 EC3–6, Honig/Shapiro labs | |
| Transfected construct (M. musculus) | β61–6 | This paper | Pcdhβ6 EC1–6, Honig/Shapiro labs | |
| Transfected construct (M. musculus) | β93–6 | This paper | Pcdhβ9 EC3–6, Honig/Shapiro labs | |
| Transfected construct (M. musculus) | γA33–6 | This paper | PcdhγA3 EC3–6, Honig/Shapiro labs | |
| Transfected construct (M. musculus) | γA43–6 | Goodman et al., 2016a | ||
| Transfected construct (M. musculus) | γA93–6 | This paper | PcdhγA9 EC3–6, Honig/Shapiro labs | |
| Transfected construct (M. musculus) | γB23–6 | Goodman et al., 2016a | ||
| Transfected construct (M. musculus) | γB53–6 | Goodman et al., 2016a | ||
| Transfected construct (M. musculus) | γB73–6 | Goodman et al., 2016a | ||
| Transfected construct (M. musculus) | αC22–6 | Goodman et al., 2016a | ||
| Transfected construct (M. musculus) | α71–5/γC36 chimera | Goodman et al., 2016a | ||
| Transfected construct (M. musculus) | γC33–6 | Goodman et al., 2016a | ||
| Transfected construct (M. musculus) | γC52–6 | This paper | PcdhγC5 EC2–6, Honig/Shapiro labs | |
| Transfected construct (M. musculus) | β93–6-AVI | This paper | Biotinylated Pcdh β9 EC3–6, Honig/Shapiro labs | |
| Transfected construct (M. musculus) | γA43–6-AVI | This paper | Biotinylated PcdhγA4 EC3–6, Honig/Shapiro labs | |
| Transfected construct (M. musculus) | γA93–6-AVI | This paper | Biotinylated PcdhγA9 EC3–6, Honig/Shapiro labs | |
| Transfected construct (M. musculus) | γB23–6-AVI | This paper | Biotinylated PcdhγB2 EC3–6, Honig/Shapiro labs | |
| Transfected construct (M. musculus) | αC23–6-AVI | This paper | Biotinylated Pcdh αC2 EC3–6, Honig/Shapiro labs | |
| Transfected construct (M. musculus) | γC33–6-AVI | This paper | Biotinylated PcdhγC3 EC3–6, Honig/Shapiro labs | |
| Transfected construct (M. musculus) | γC52–6-AVI | This paper | Biotinylated PcdhγC5 EC2–6, Honig/Shapiro labs | |
| Transfected construct (M. musculus) | γA43–6 V560R | This paper | PcdhγA4 EC3–6 mutant, Honig/Shapiro labs | |
| Transfected construct (M. musculus) | γC33–6 V560R | This paper | PcdhγC3 EC3–6 mutant, Honig/Shapiro labs | |
| Transfected construct (M. musculus) | γA43–6 K558R | This paper | PcdhγA4 EC3–6 mutant, Honig/Shapiro labs | |
| Transfected construct (M. musculus) | γC33–6 R558K | This paper | PcdhγC3 EC3-6 mutant, Honig/Shapiro labs | |
| Transfected construct (M. musculus) | γB73–6 Y532G | Goodman et al., 2017 | ||
| Transfected construct (M. musculus) | γB73–6 A570R | This paper | PcdhγB7 EC3–6 mutant, Honig/Shapiro labs | |
| Peptide, recombinant protein | NeutrAvidin-HRP | Thermo Fisher Scientific | 31,030 | Biotinylated protein western bot |
| Peptide, recombinant protein | NeutrAvidin protein | Thermo Fisher Scientific | 31,000 | SPR assays |
| Peptide, recombinant protein | BSA | Sigma-Aldrich | A7906 | SPR assays |
| Commercial assay or kit | Spin Miniprep Kit | Qiagen | 27,106 | |
| Commercial assay or kit | Hi-speed Plasmid Maxi Kit | Qiagen | 12,663 | |
| Commercial assay or kit | SF Cell Line 4D-Nucleofector X Kit S | Lonza | V4XC-2032 | |
| Commercial assay or kit | Amine-coupling kit | Cytiva | BR100050 | SPR experiments |
| Commercial assay or kit | Morpheus Amino Acids | Molecular Dimensions | MD2-100-77 | Crystallography |
| Commercial assay or kit | Morpheus Buffer System II | Molecular Dimensions | MD2-100-101 | Crystallography |
| Chemical compound | Polyethylenimine | Polysciences | 24765-2 | Transfection |
| Chemical compound | Biotin | Sigma-Aldrich | B4501 | Protein biotinylation |
| Chemical compound | Tris Base | Fisher Scientific | BP152-5 | |
| Chemical compound | Sodium Chloride | Fisher Scientific | S271-10 | |
| Chemical compound | Calcium Chloride Dihydrate | JT Baker | 1336-01 | |
| Chemical compound | Imidazole | ACROS | 301870025 | |
| Chemical compound | HEPES | Sigma-Aldrich | H3375 | |
| Chemical compound | Tween-20 | Sigma-Aldrich | P7949 | |
| Chemical compound | Sodium Acetate | Sigma-Aldrich | S7545 | |
| Chemical compound | IMAC Sepharose 6 Fast Flow | Cytiva | 17092109 | |
| Chemical compound | Penicillin Streptomycin | Thermo Fisher Scientific | 15070063 | |
| Chemical compound | PEG 6000 | Sigma-Aldrich | 81,260 | |
| Chemical compound | PEG 8000 | Sigma-Aldrich | 89,510 | |
| Chemical compound | Ethylene Glycol | Fluka | 03760 | |
| Chemical compound | Lithium Chloride | Sigma-Aldrich | L8895 | |
| Chemical compound | MES | Sigma-Aldrich | M3671 | |
| Chemical compound | Glycerol | ACROS | 332031000 | |
| Software, algorithm | UCLA Diffraction Anisotropy Server | Strong et al., 2006 | https://srv.mbi.ucla.edu/Anisoscal/ | |
| Software, algorithm | SednTerp | Thomas Laue | http://bitcwiki.sr.unh.edu/index.php/Main_Page | |
| Software, algorithm | HeteroAnalysis | https://core.uconn.edu/auf | ||
| Software, algorithm | Scrubber 2.0 | BioLogic Software | http://www.biologic.com.au | |
| Software, algorithm | Phaser | McCoy et al., 2007 | Implemented in CCP4 or Phenix (see below) | |
| Software, algorithm | CCP4 | Winn et al., 2011 | https://www.ccp4.ac.uk/ | |
| Software, algorithm | Phenix | Liebschner et al., 2019 | http://www.hkl-xray.com/ | |
| Software, algorithm | XDS | Kabsch, 2010 | http://xds.mpimf-heidelberg.mpg.de | |
| Software, algorithm | AIMLESS | Evans and Murshudov, 2013 | http://www.ccp4.ac.uk | |
| Software, algorithm | Coot | Emsley et al., 2010 | https://www2.mrc-lmb.cam.ac.uk/personal/pemsley/coot/ | |
| Software, algorithm | PISA | Krissinel and Henrick, 2007 | http://www.ebi.ac.uk/pdbe/protint/pistart.html | |
| Software, algorithm | Pymol | Schrödinger | https://pymol.org | |
| Software, algorithm | UCSF Chimera | Pettersen et al., 2004 | https://www.cgl.ucsf.edu/chimera/ | |
| Software, algorithm | Clustal Omega | Sievers et al., 2011 | https://www.ebi.ac.uk/Tools/msa/clustalo/ | |
| Software, algorithm | WebLogo 3.0 | Crooks et al., 2004 | http://weblogo.threeplusone.com/ | |
| Software, algorithm | SignalP 4.0 | Petersen et al., 2011 | https://services.healthtech.dtu.dk/service.php?SignalP-5.0 | |
| Software, algorithm | ASTRA | Wyatt | https://www.wyatt.com/products/software/astra.html | |
| Other | Freestyle 23 Expression Media | Thermo Fisher Scientific | 12338-018 | Protein expression media |
| Other | Opti-MEM Reduced Serum Media | Thermo Fisher Scientific | 31985-070 | Protein expression media |
| Other | Series S CM4 chip | Cytiva | BR100539 | SPR assays |
| Other | Fetal Bovine Serum | Thermo Fisher Scientific | 16141079 | Cell-aggregation assays media |
| Other | DMEM with GlutaMAX | Thermo Fisher Scientific | 10569010 | Cell-aggregation assays media |
Additional files
Download links
A two-part list of links to download the article, or parts of the article, in various formats.
Downloads (link to download the article as PDF)
Open citations (links to open the citations from this article in various online reference manager services)
Cite this article (links to download the citations from this article in formats compatible with various reference manager tools)
How clustered protocadherin binding specificity is tuned for neuronal self-/nonself-recognition
eLife 11:e72416.
https://doi.org/10.7554/eLife.72416


