Multi-omics investigation of Clostridioides difficile-colonized patients reveals pathogen and commensal correlates of C. difficile pathogenesis
- The Edison Family Center for Genome Sciences and Systems Biology, Washington University School of Medicine, United States
- Department of Pathology and Immunology, Washington University School of Medicine, United States
- Center for Women’s Infectious Disease Research, Division of Infectious Diseases, Department of Internal Medicine, Washington University School of Medicine, United States
- Division of Infectious Diseases, Washington University School of Medicine, United States
- Department of Molecular Microbiology, Washington University School of Medicine, United States
- Department of Pediatrics, Washington University School of Medicine, United States
- Department of Biomedical Engineering, Washington University in St. Louis, United States
Figures
Figure 1 with 2 supplements
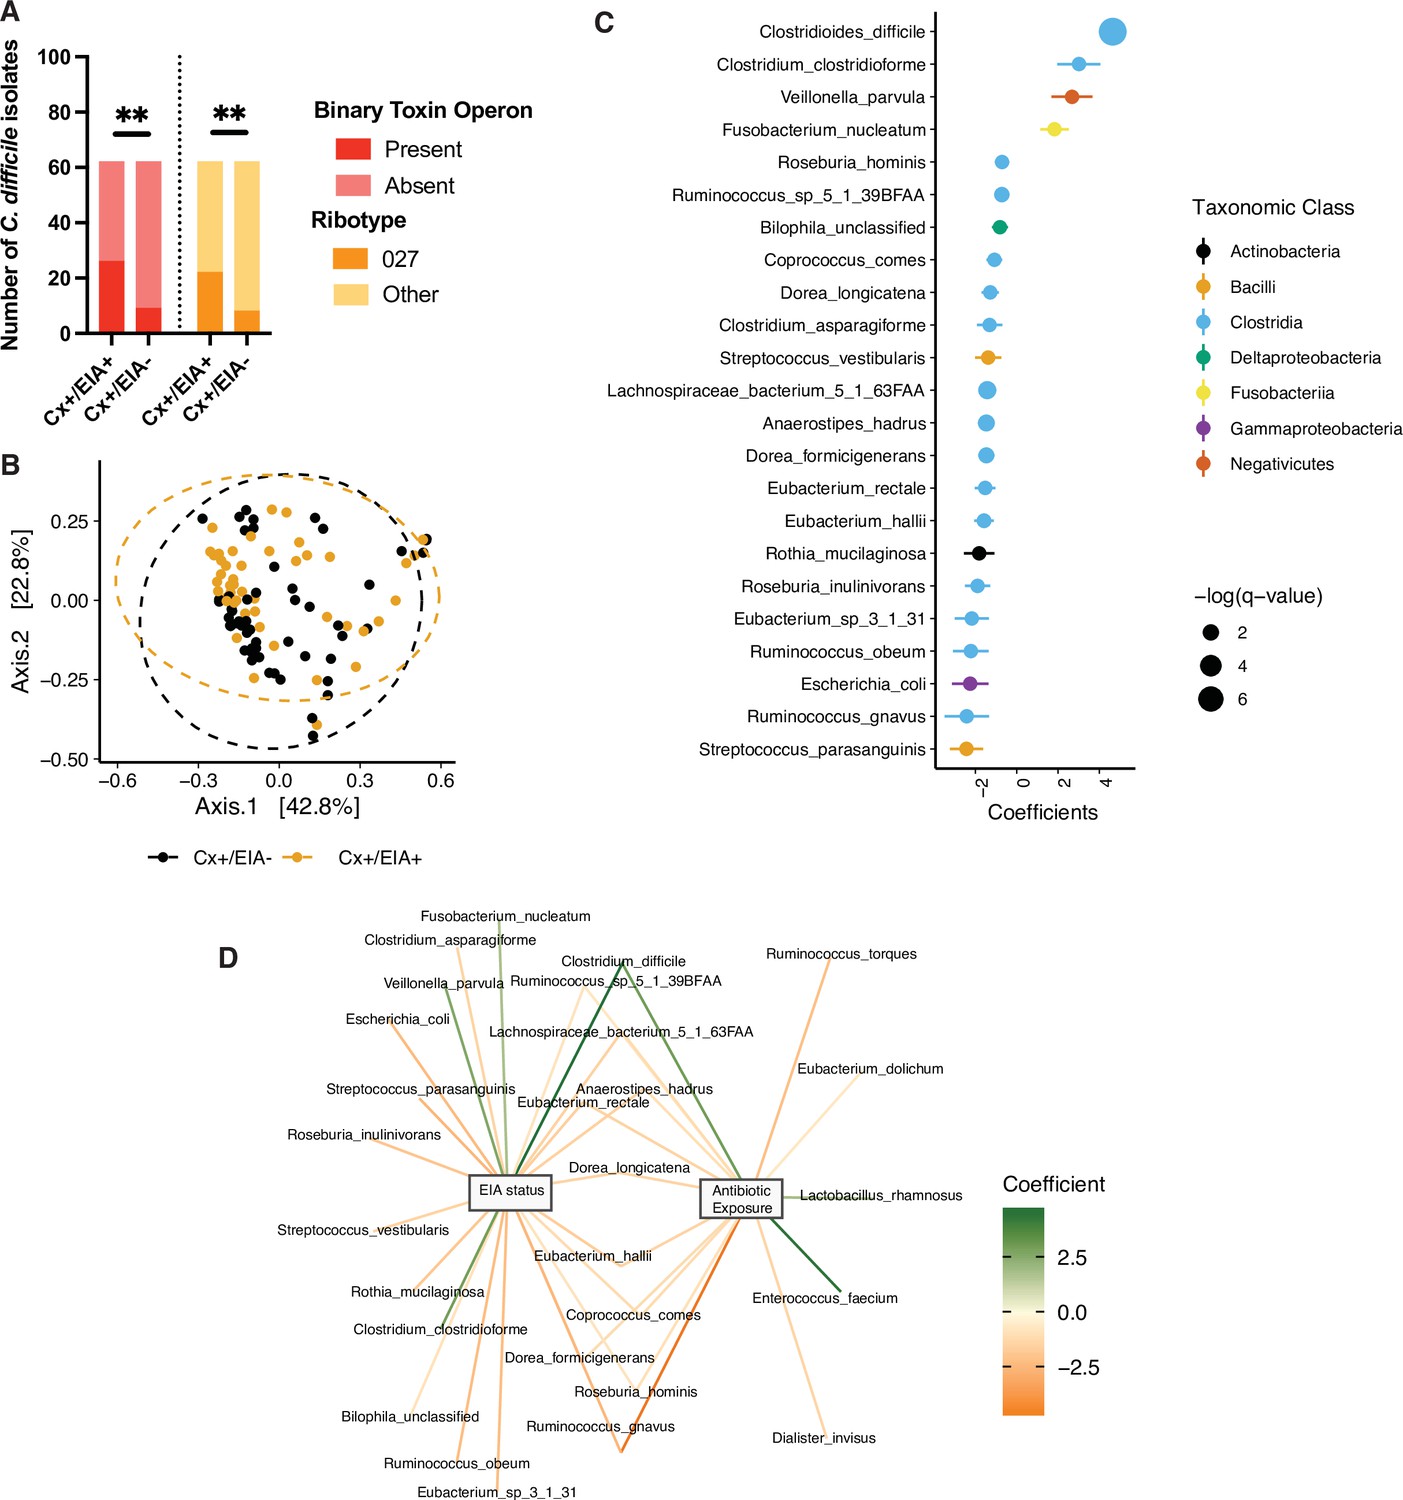
Pathogen and microbiome determinants of C. difficile-colonized patients.
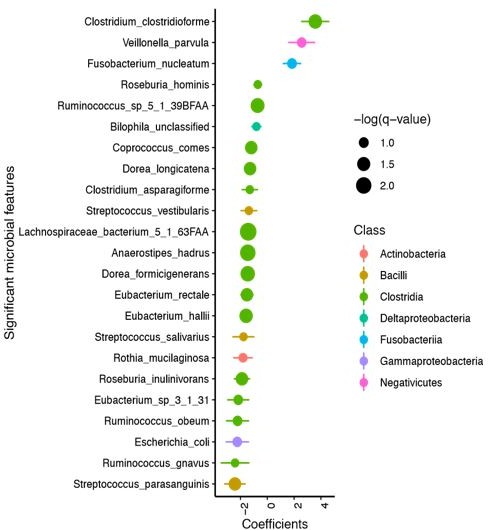
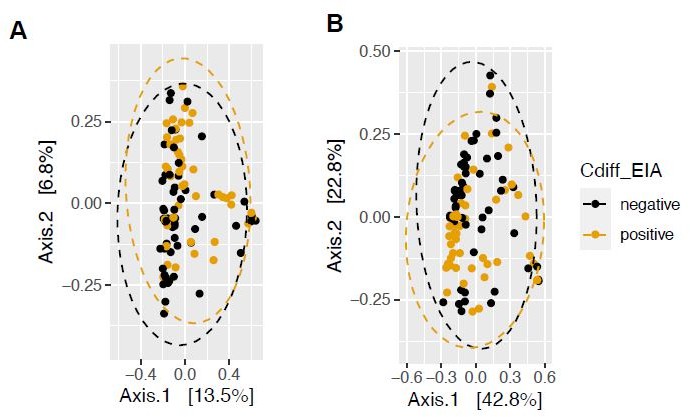
(A) Clostridioides difficile isolate distribution based on PCR and ribotyping data for each isolate cultured from patient stools. **, p < 0.001 as measured by a Fisher’s exact test. (B) Principal coordinate analysis (PCoA) of weighted Unifrac distances between stool microbiomes. Colors indicate EIA status. Groups were not significantly different as measured by a PERMANOVA (p = 0.69). (C) Significant microbial taxa associated with disease state, where a positive coefficient is associated with Cx+/EIA+ state and a negative coefficient is associated with Cx+/EIA- state. Colors indicate taxonomic Class of the microbial feature, and the size of circle corresponds to magnitude of statistical significance. Features with q-value of <0.25 were plotted. (D) Network of features associated with antibiotic exposure or EIA status. Species nodes are connected to metadata nodes by edged colored with the feature weight (coefficient) computed using linear mixed modeling (MaAslin2). All taxa displayed had a q-value of <0.25 in respective analyses.
-
Figure 1—source data 1
Raw absorbance value for in vitro toxin ELISA of 102 C.difficile isolates.
- https://cdn.elifesciences.org/articles/72801/elife-72801-fig1-data1-v1.xlsx
Figure 1—figure supplement 1
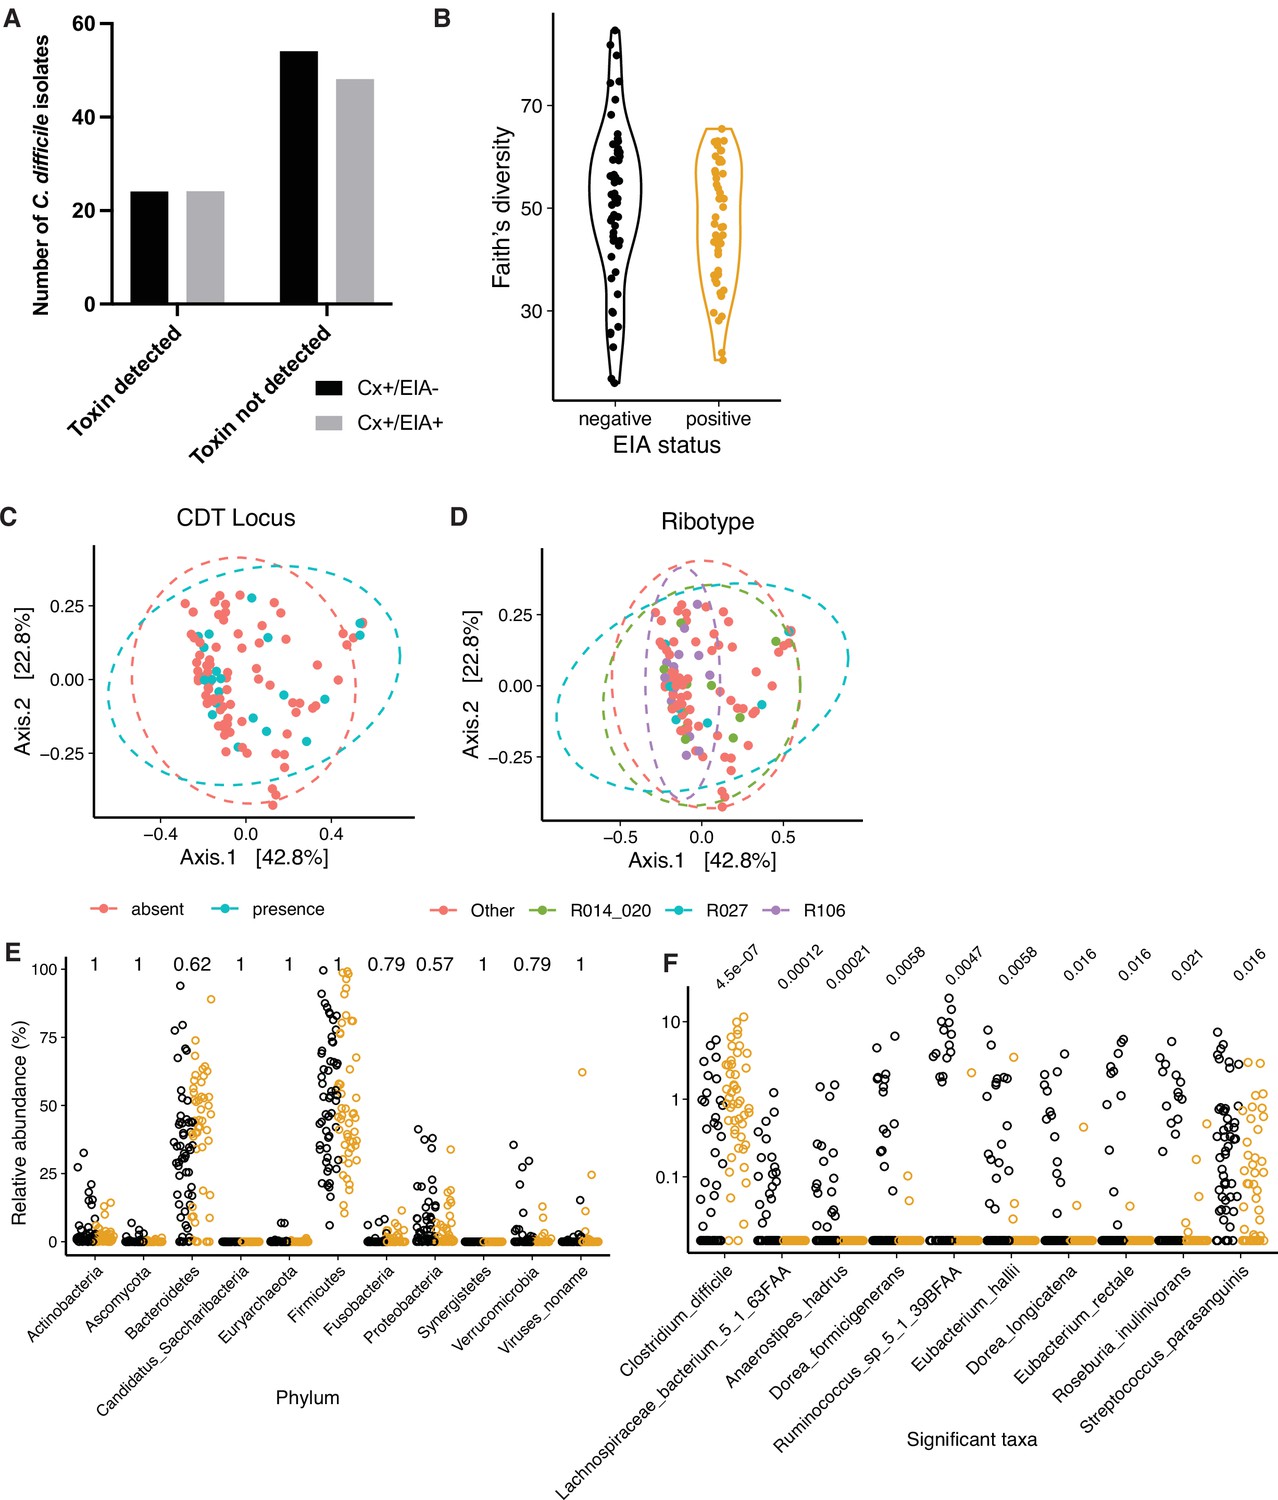
Microbiome configuration of C. difficile-colonized patients.
(A) Presence of protein toxins TcdA and TcdB, based on ELISA of in vitro culture supernatants. There was no significant difference in the number of isolates able to produce toxin (p = 0.86, Fisher’s exact test). (B) Faith’s diversity between microbiomes of asymptomatically-colonized (Cx+/EIA-) and CDI (Cx+/EIA+) patients. Diversity between groups was not significantly different (p = 0.1602, Wilcoxon rank sum test). PCoA of weighted UniFrac distances between stool metagenomes, colored by the presence of the binary toxin (CDT) locus (C) or corresponding isolate ribotype (D). (E) Phylum-level relative abundances between CDI and asymptomatically-colonized patients. (F) Relative abundance of significantly altered clostridial taxa from MaAsLin2 analysis. p-values in (E) and (F) calculated using a Wilcoxon rank sum test and corrected for multiple testing.
Figure 1—figure supplement 2
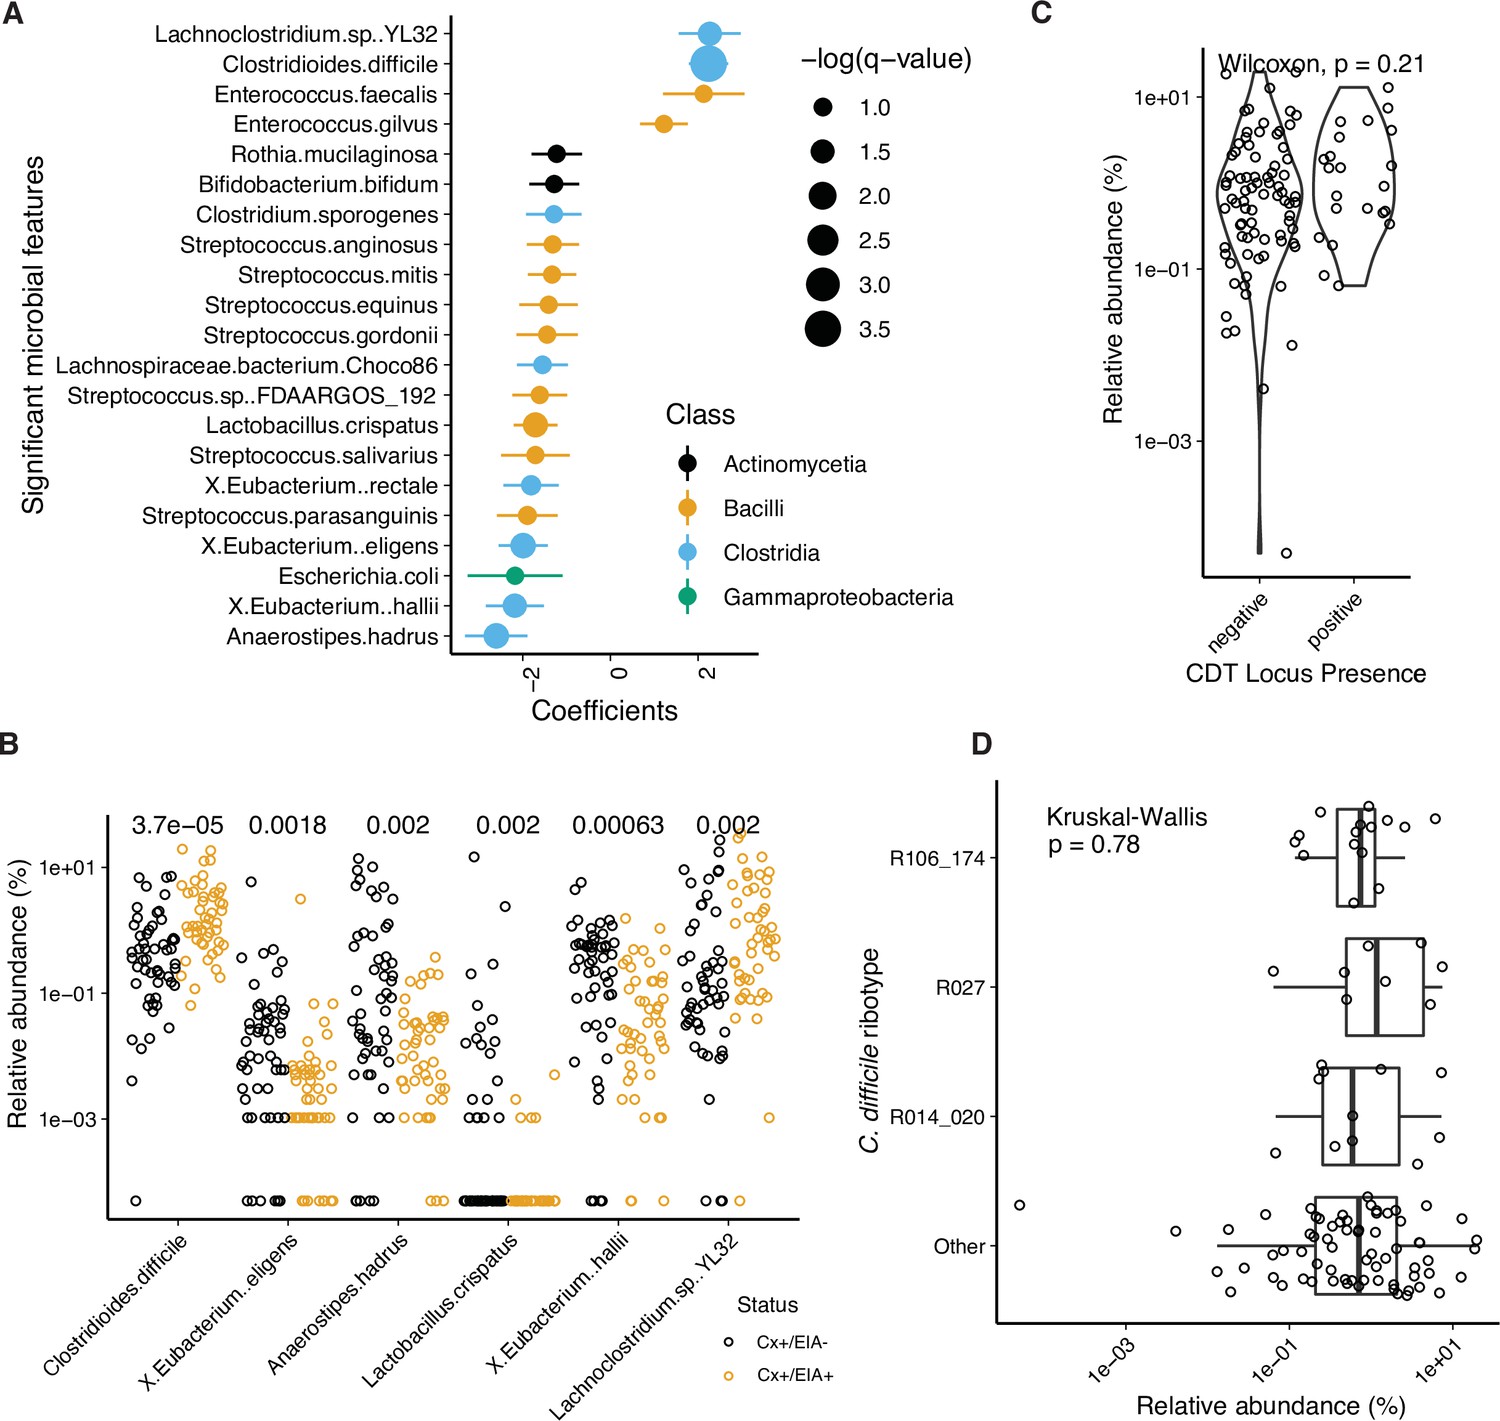
Kraken analysis of metagenomic data.
(A) Significant microbial taxa associated with disease state, where a positive coefficient is strongly associated with CDI state. Colors indicate taxonomic Class of microbial feature, and size of circle corresponds to magnitude of statistical significance. Features with q-value of <0.25 were plotted. (B) Relative abundance of significantly altered taxa from MaAsLin2 analysis with a q-value of <0.05. p-Values indicate a corrected Wilcoxon rank sum test. (C) Relative abundance of C. difficile stratified by whether the stool contained an isolate with cdtAB or not. (D) Relative abundance of C. difficile stratified by the corresponding isolate ribotype.
Figure 2 with 1 supplement
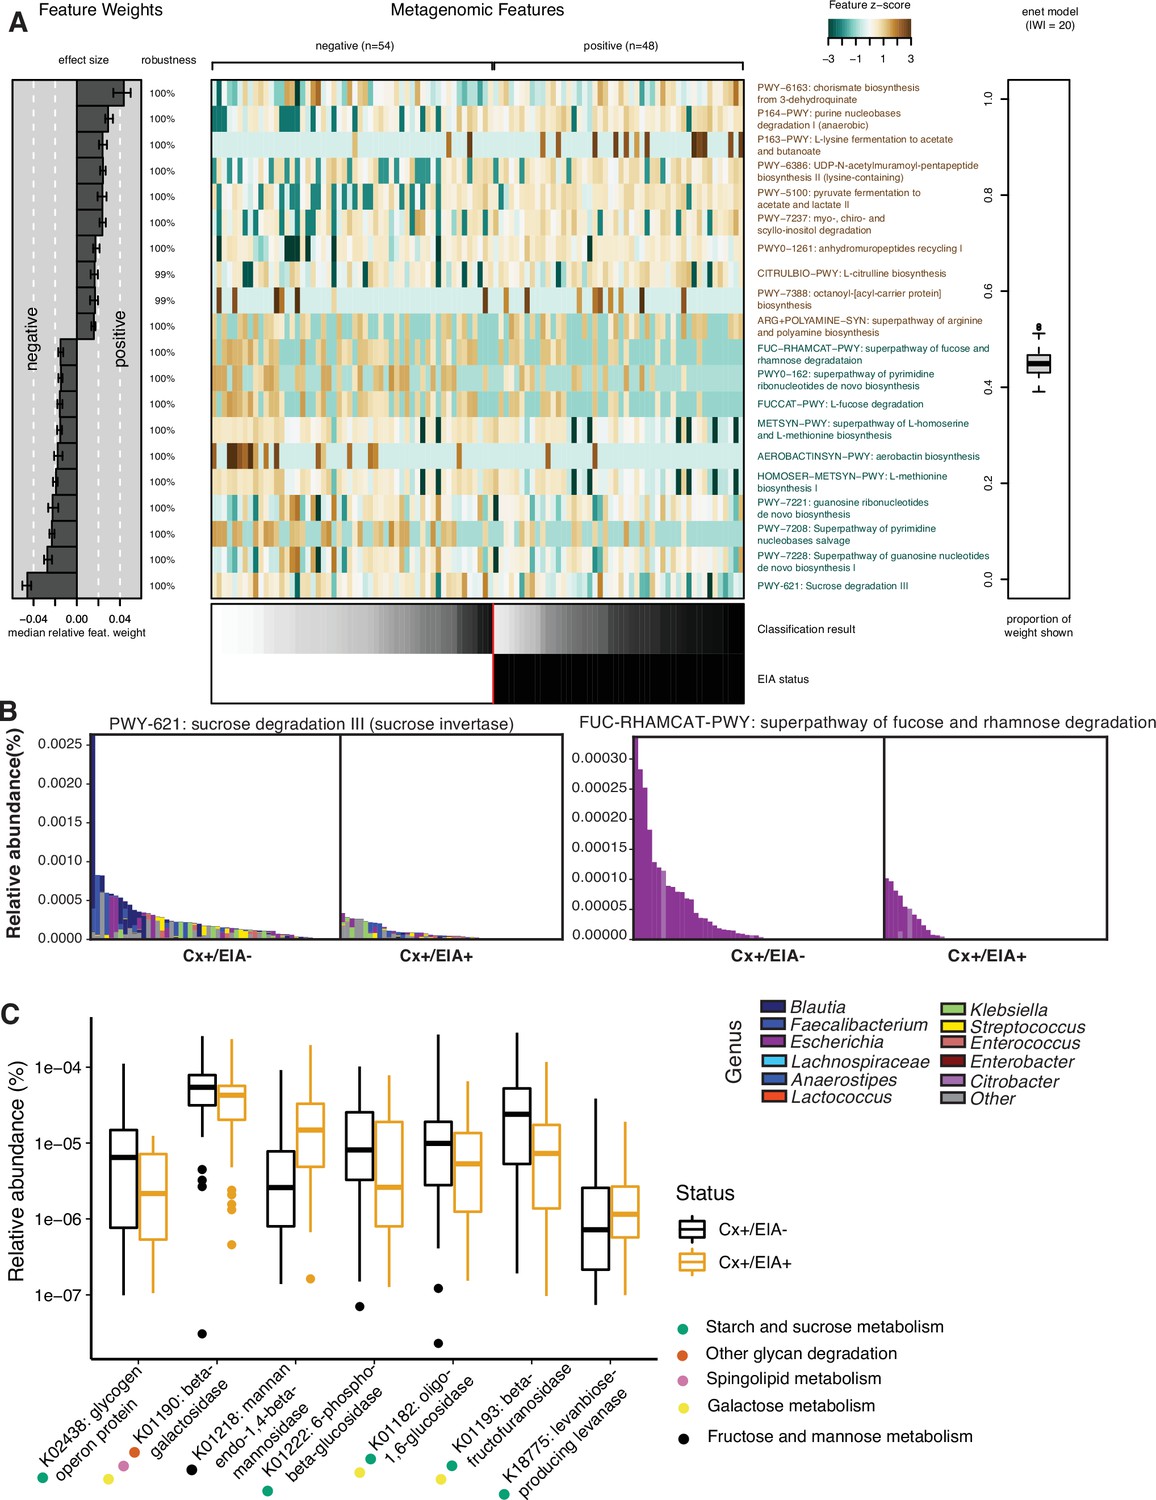
Carbohydrate metabolic processes present in asymptomatic patient microbiome.
(A) Significant pathways associated with EIA status, as derived from the elastic net model. Mean-prediction AUC for the elastic net model was 0.825. (B) Relative abundance of taxa in pathways associated with asymptomatic patients, where each patient’s metagenomic relative abundance is depicted by a single bar. Bars are colored by genera predicted to encode pathway. (C) Relative abundance of glycosidic hydrolase genes significantly associated with EIA status (q-value of <0.25) in stool metagenomes, where circles represent KEGG pathway classification.
Figure 2—figure supplement 1
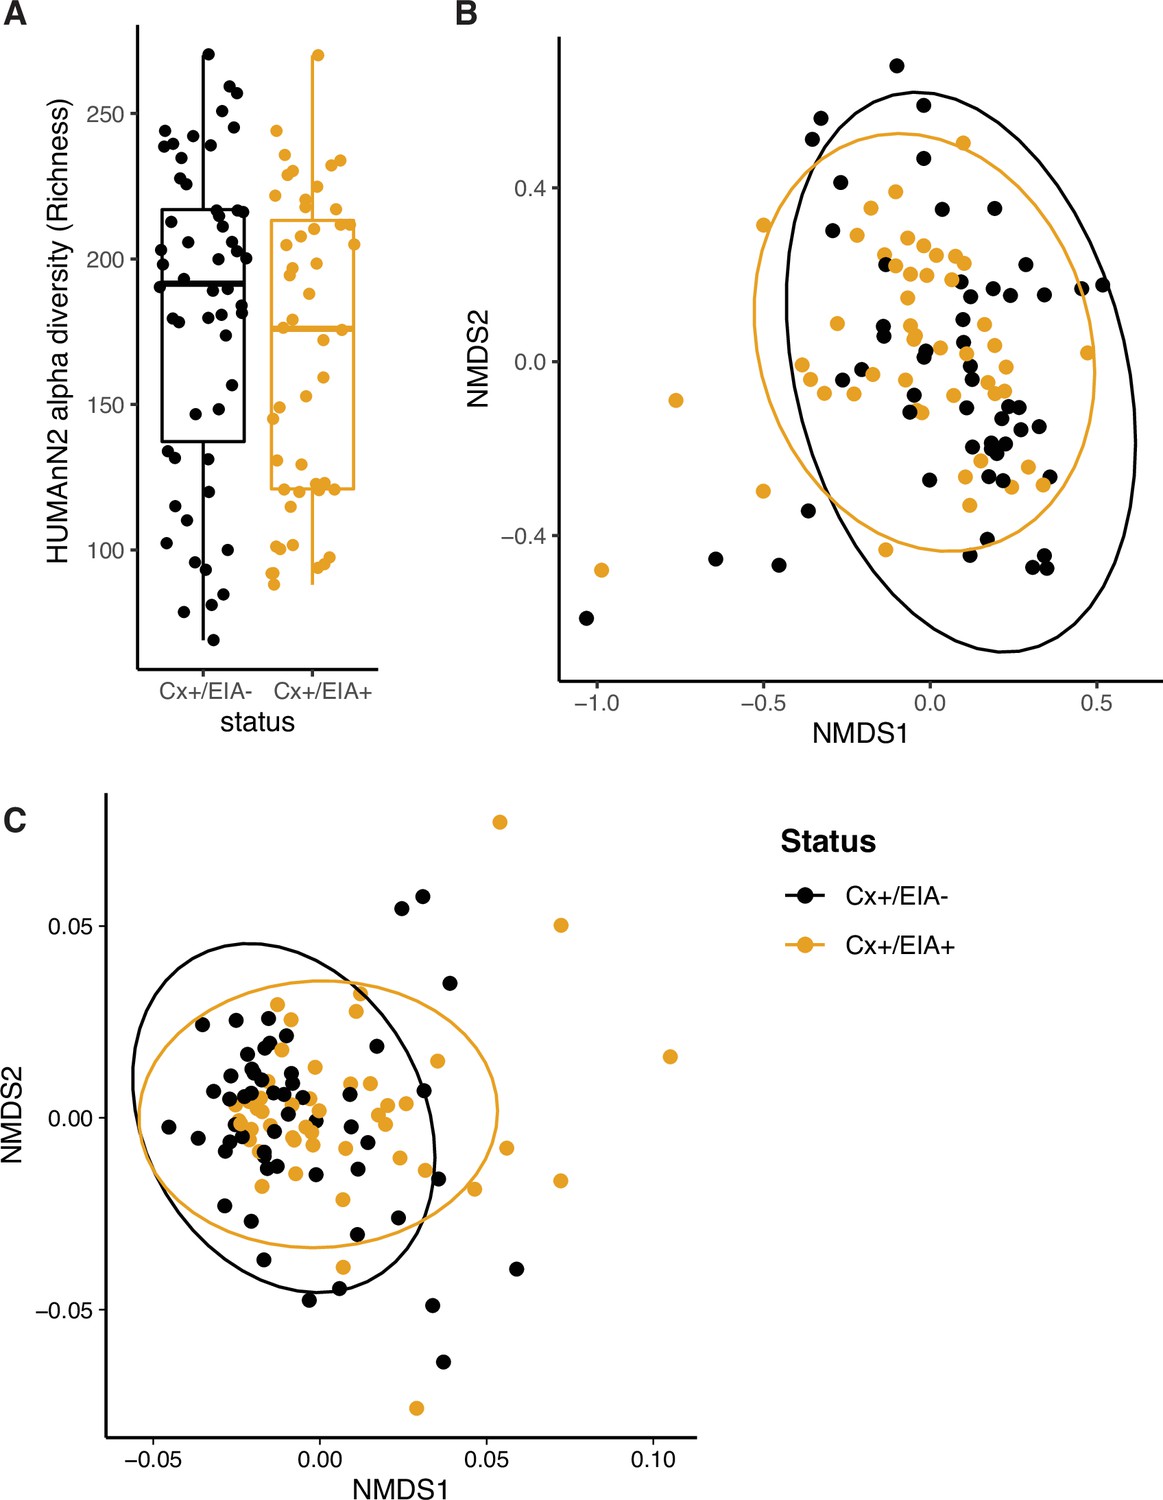
Compositional measurements of metabolic pathways and metabolites.
(A) Alpha-diversity (measured by richness) of metabolic pathways in patient groups. (B) Non-metric multi-dimensional scaling (NMDS) ordination of Bray-Curtis dissimilarity measurements between stool microbiome metabolic pathways. (C) NMDS ordination of Euclidean distances between stool metabolomes. A permutation test was used to quantify centroid distances between groups (p = 0.01).
Figure 3 with 1 supplement
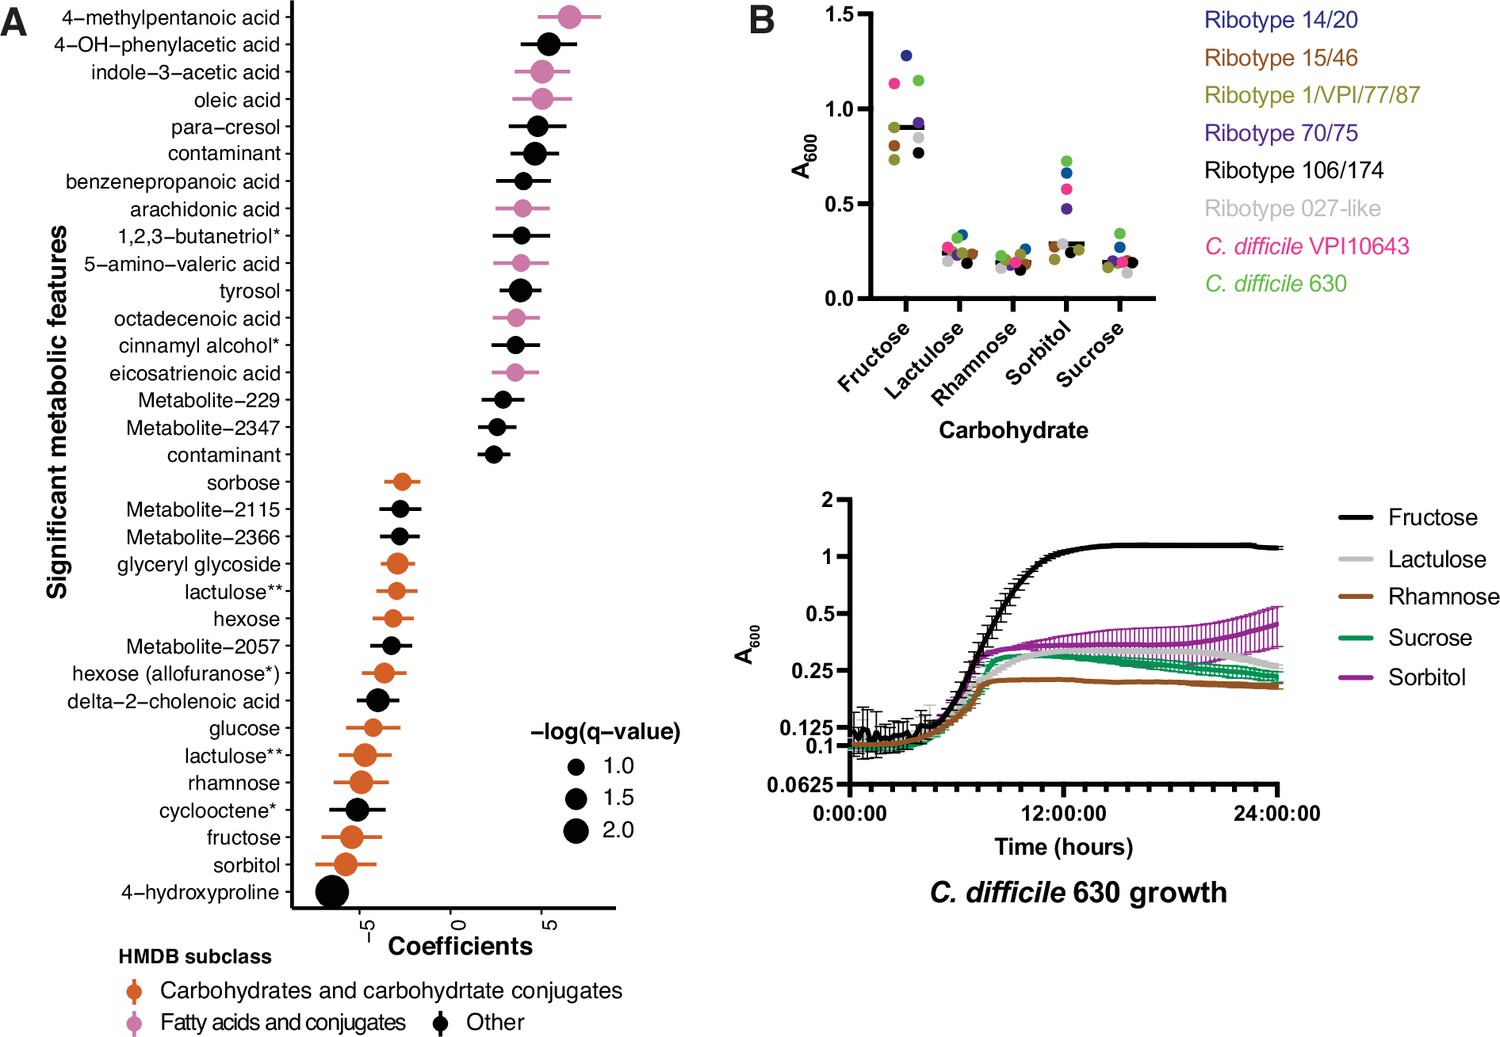
Asymptomatically colonized patients are defined by carbohydrate species.
(A) Significant metabolites associated with EIA state, where a positive coefficient is strongly associated with Cx+/EIA+ metabolomes. Colors indicate human metabolic database (HMDB) sub-classification, and size of circle corresponds to magnitude of statistical significance. * indicates closest potential match; ** indicates two peaks from the same compound; contaminant indicates mass spectrometry contaminant. (B) Clinical and reference strains grown in C. difficile minimal medium (CDMM) with equimolar amounts of carbohydrate sources added. Growth was measured by taking maximum absorbance values over 48 hr. Each point represents the mean of two technical replicates of a unique isolate (top). Growth of C. difficile 630, from same conditions as above (bottom).
-
Figure 3—source data 1
Growth curve data for C. difficile isolates.
- https://cdn.elifesciences.org/articles/72801/elife-72801-fig3-data1-v1.xlsx
Figure 3—figure supplement 1
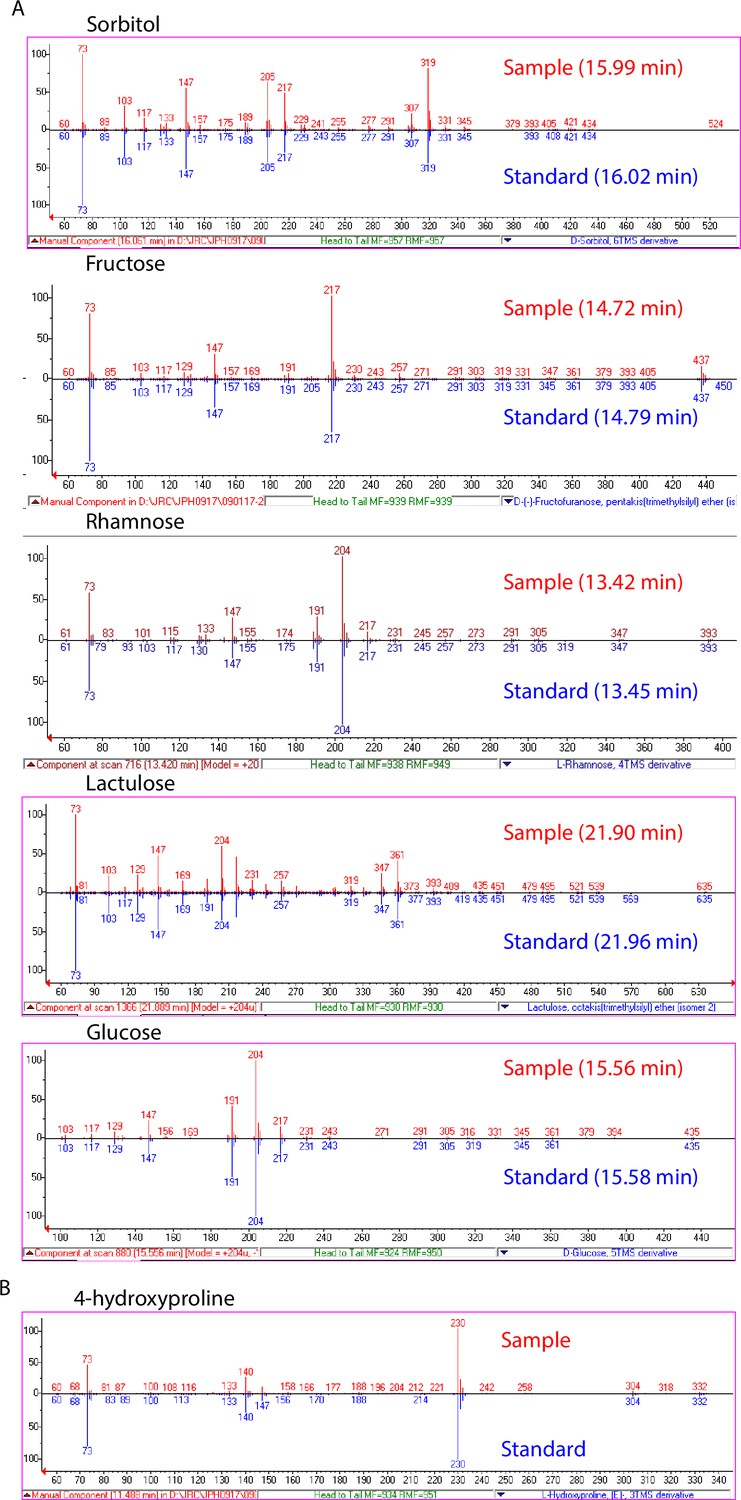
Validation of significantly associated metabolites.
(A) EI spectra and GC retention times of identified sugar and sugar alcohol features (red) compared to spectra of authentic standards (blue). (B) EI spectrum of 4-hydroxyproline feature compared to NIST14 library spectrum.
Figure 4 with 1 supplement
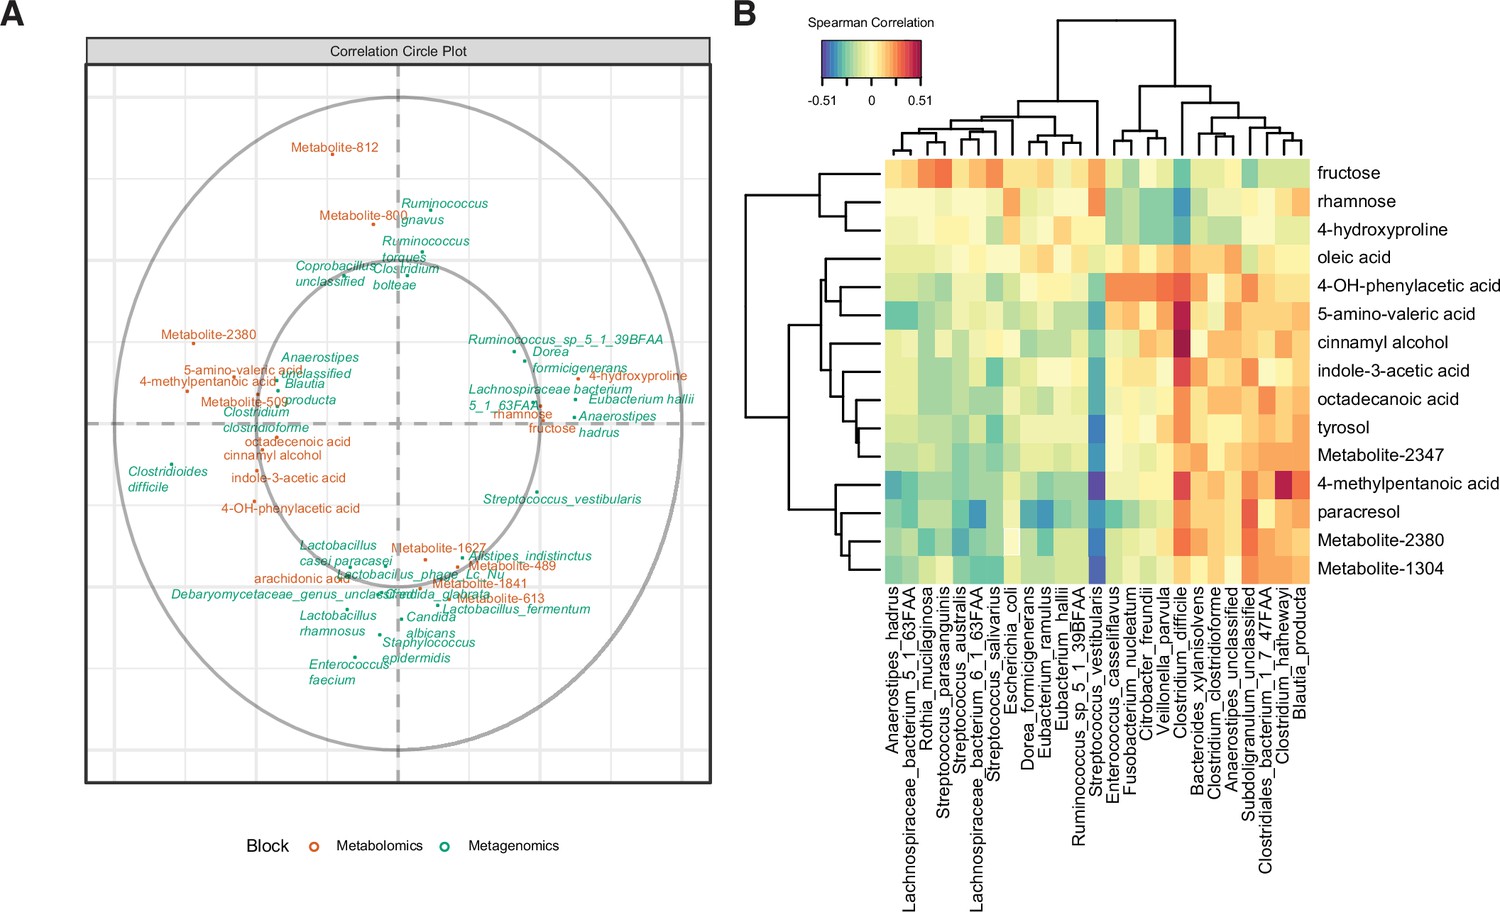
Multi-omics signature of C. difficile-colonized patients reveals C.difficile-metabolite relationships.
(A) Correlation circle indicating the contribution of each variable (microbe or metabolite) to latent component of sparse partial least-squares-discriminatory analysis (sPLS-DA) using MetaPhlAn2 data. (B) Heatmap of Spearman correlations between metagenomic and metabolomic variables from the first latent component using MetaPhlAn2 data.
Figure 4—figure supplement 1
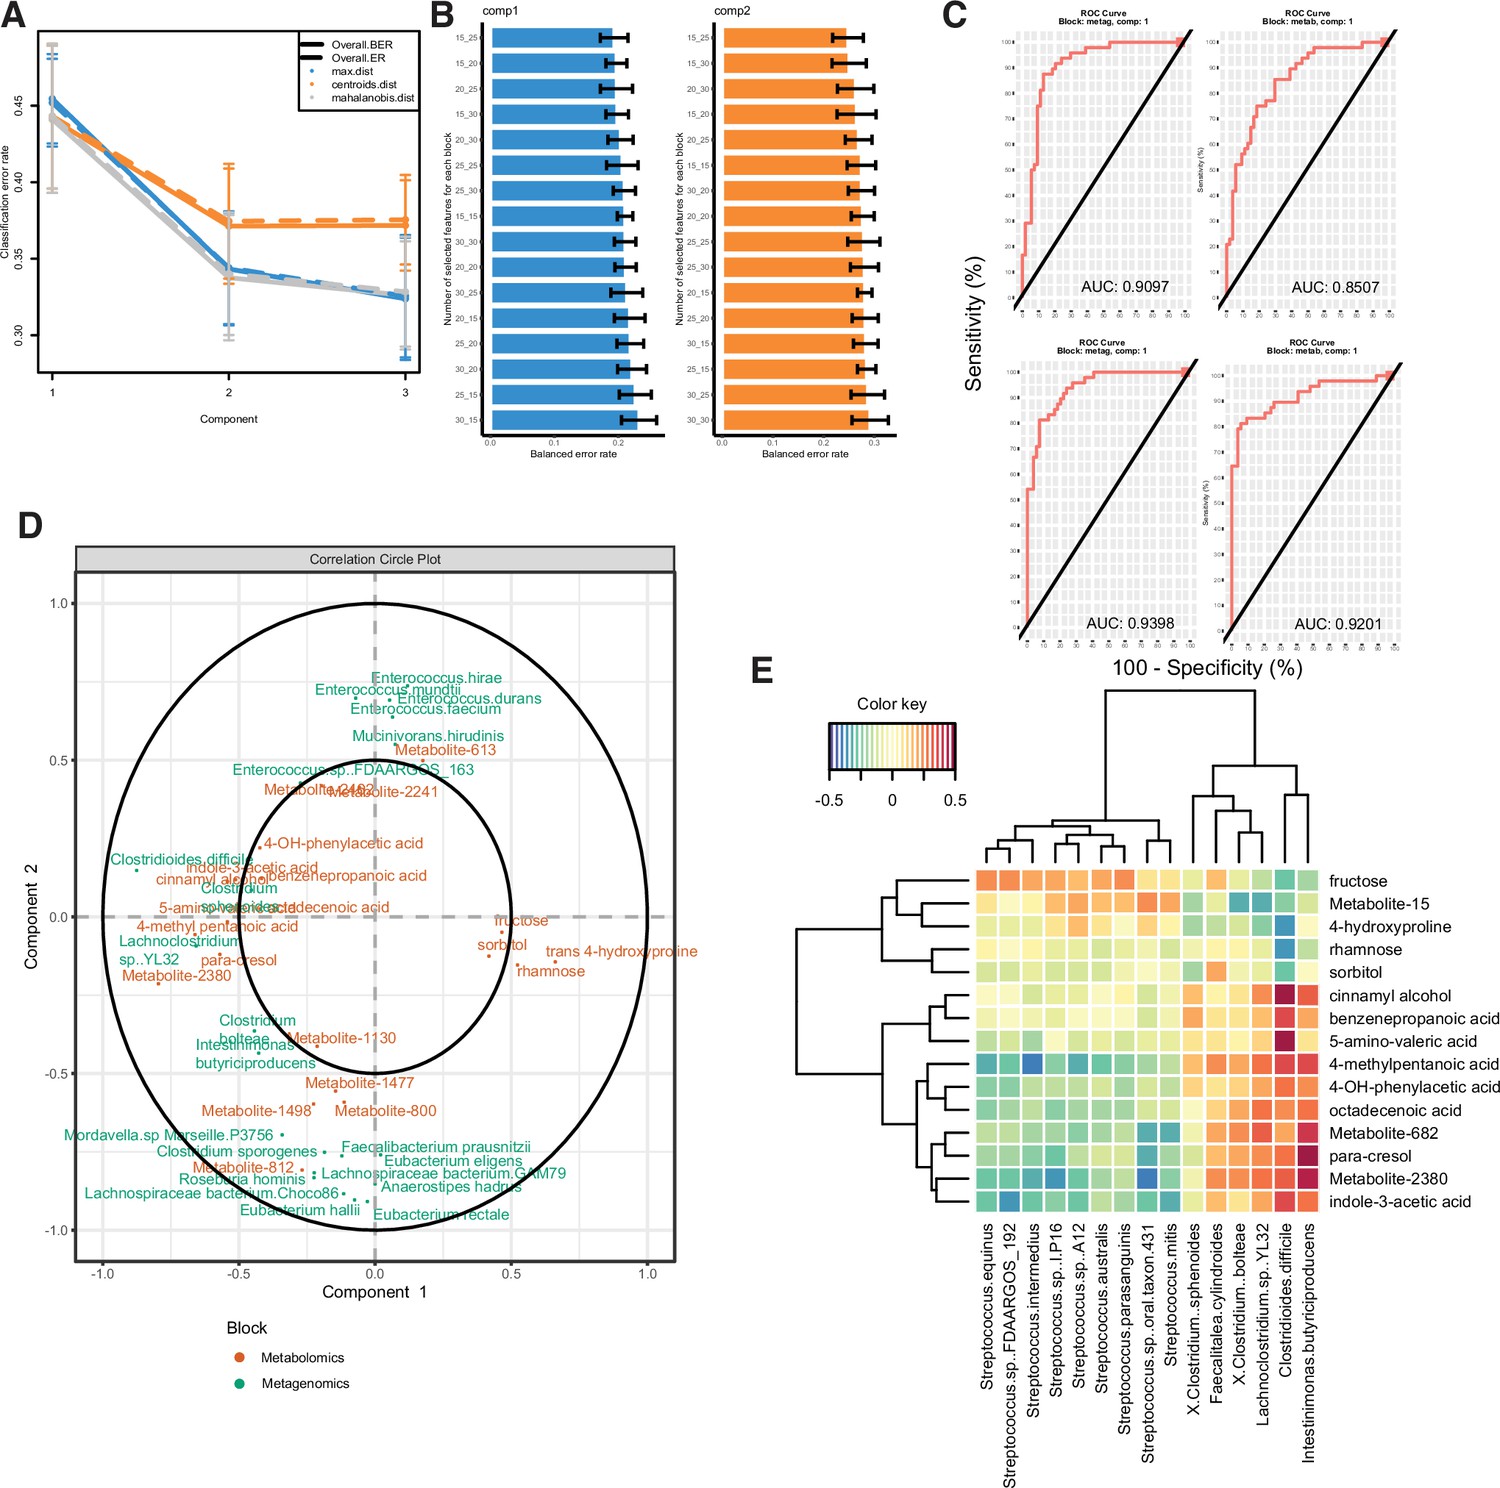
Multi-omics analysis performance.
(A) Examination of error rate dependent on number of components included in model construction, related to Figure 4. (B) Balanced error rate dependent on the number of features used in each block of each component; the left number indicates the number of metagenomic features used, and the right number indicates the number of metabolomic features used. (C) ROC curves with area under the curve measurements indicated for each block and component of the MetaPhlAn2 model. (D) Correlation circle indicating the contribution of each variable (microbe or metabolite) to latent component of sparse partial least-squares-discriminatory analysis (sPLS-DA) using Kraken data. (E) Heatmap of Spearman correlations between metagenomic and metabolomic variables from the first latent component using Kraken data.
Author response image 1
Maaslin2 analysis of metagenomes with C. difficile reads removed and compositional dataset renormalized.
Author response image 2

Maaslin2 analysis of stool metagenomes with detectable C. difficile.</Author response image 2 title/legend>.
Author response image 3
Tables
Table 1
Logistic regression coefficients for antibiotic exposures associated with Cx+/EIA+ in patient cohort.
| Antibiotic | Coefficient | Standard error | p-Value |
|---|---|---|---|
| Cephalosporin | 2.68 | 0.74 | 2.70E-04 |
| Fluoroquinolone | 0.19 | 1.09 | 0.86 |
| Carbapenem | 0.34 | 1.12 | 0.76 |
| Metronidazole | 1.11 | 0.95 | 0.24 |
| Vancomycin (intravenous) | 1.44 | 0.95 | 0.13 |
-
*Hosmer and Lemeshow Goodness of fit test p = 0.7536.
Additional files
-
Supplementary file 1
Patient demographic data.
- https://cdn.elifesciences.org/articles/72801/elife-72801-supp1-v1.xlsx
-
Supplementary file 2
Fecal metagenomics metadata file with isolate information.
- https://cdn.elifesciences.org/articles/72801/elife-72801-supp2-v1.xlsx
-
Supplementary file 3
MaAsLin2 output of metabolites associated with EIA status in addition to metabolite validation information.
- https://cdn.elifesciences.org/articles/72801/elife-72801-supp3-v1.xlsx
-
Supplementary file 4
DEseq output of in vitro rhamnose-exposed C difficile transcriptomic profiling.
- https://cdn.elifesciences.org/articles/72801/elife-72801-supp4-v1.xlsx
-
Transparent reporting form
- https://cdn.elifesciences.org/articles/72801/elife-72801-transrepform1-v1.pdf
Download links
A two-part list of links to download the article, or parts of the article, in various formats.
Downloads (link to download the article as PDF)
Open citations (links to open the citations from this article in various online reference manager services)
Cite this article (links to download the citations from this article in formats compatible with various reference manager tools)
Multi-omics investigation of Clostridioides difficile-colonized patients reveals pathogen and commensal correlates of C. difficile pathogenesis
eLife 11:e72801.
https://doi.org/10.7554/eLife.72801


