Emergence of a geometric pattern of cell fates from tissue-scale mechanics in the Drosophila eye
- Department of Molecular Biosciences, Northwestern University, United States
- NSF Simons Center for Quantitative Biology, Northwestern University, United States
- Department of Engineering Sciences and Applied Mathematics, Northwestern University, United States
Figures
Figure 1 with 2 supplements
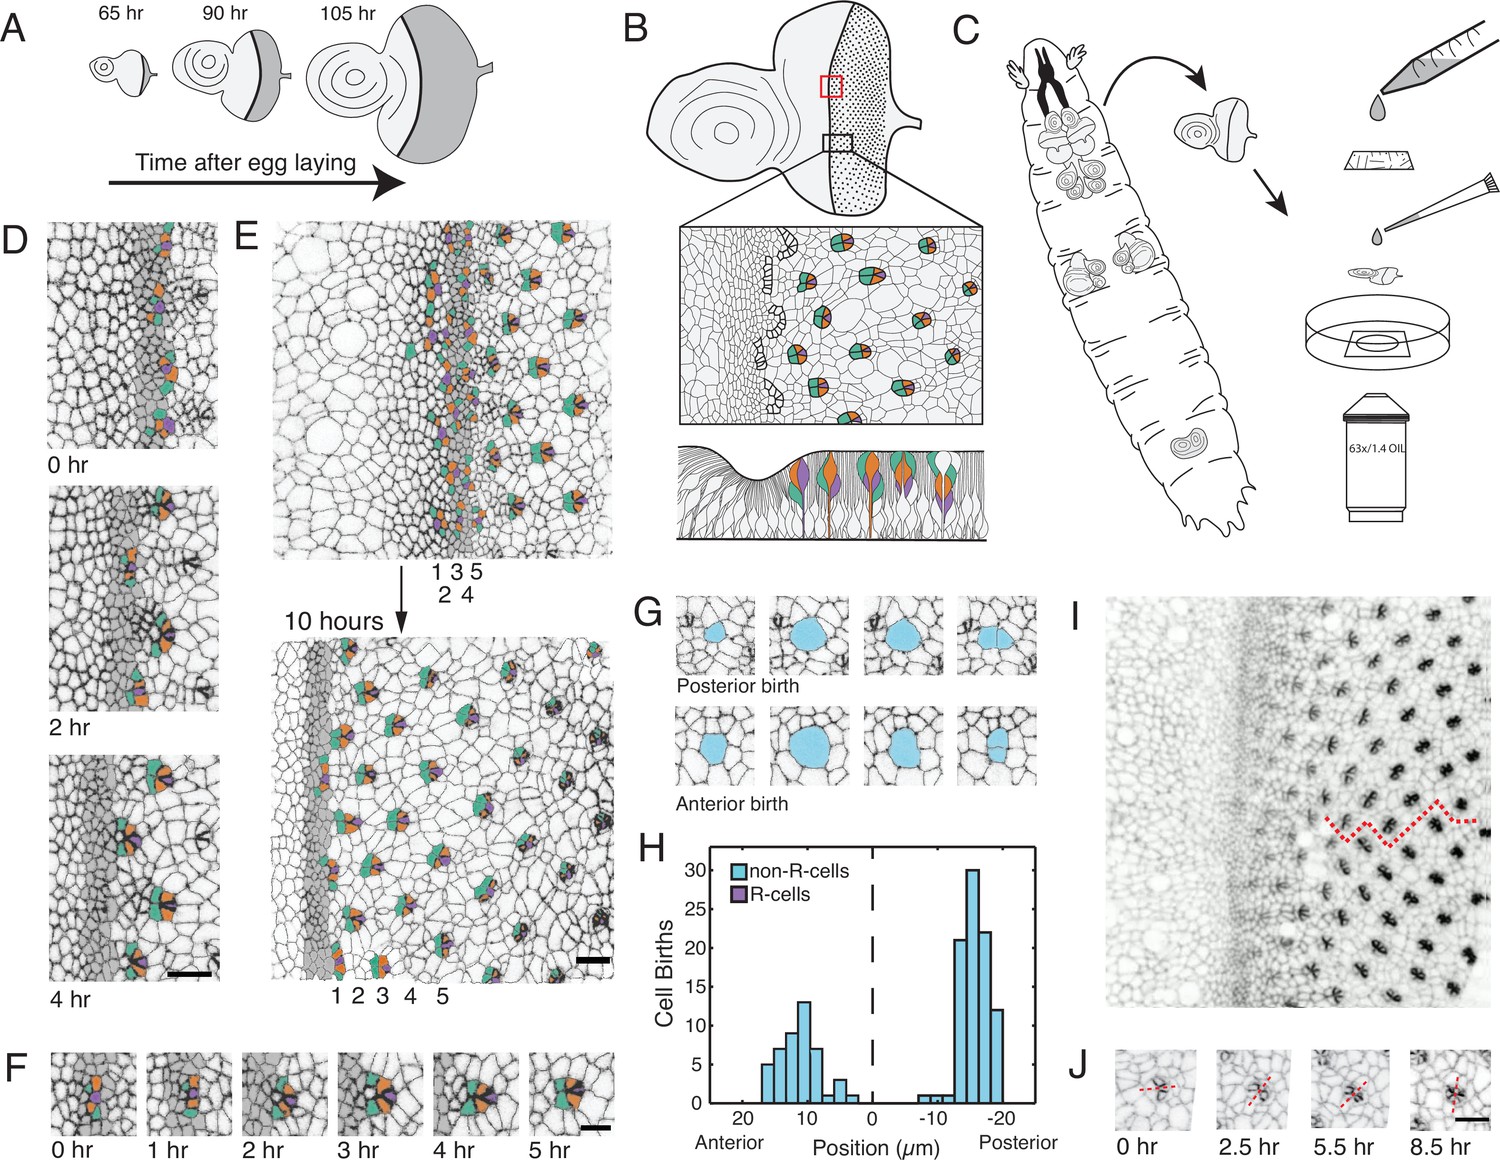
Living eye discs imaged by time-lapse microscopy.
(A) Differentiation is initiated in the eye disc by the MF, which moves across the eye epithelium. As the MF transits the eye, cells on either side proliferate, which generates disc growth. Shown are three discs at various times after egg laying, the beginning of the animal’s life. (B) Top, an apical view of an eye disc showing the triangular grid of ommatidia on the posterior side of the MF. A red rectangle outlines the region that was typically imaged by time-lapse microscopy; the black rectangle corresponds to the developmental sequence outlined below. Middle, camera lucida of apical plane of an eye disc. R cells are color coded: R8 (purple), R2 and R5 (orange), R3 and R4 (cyan). The other R cells are not colored but are differentiating in columns 4–6. Bottom, a cross-section view of the eye epithelium. Note the progenitor cell nuclei are basally positioned, and as they transition into a differentiated state, their nuclei migrate apically. Adapted after Figure 19 from Wolff and Ready, 1993. (C) Method of time-lapse microscopic imaging of an eye disc surgically excised from a late third-instar larva. (D) An E-cadherin GFP fusion protein outlines cell junctions, enabling cell segmentation and tracking. Two successive columns of ommatidia are formed at the indicated time points. R cells in this panel and all subsequent figure panels are colored as in panel B. (E) R cells constituting five columns of ommatidia (numbered 1–5) shown at the beginning and end of imaging. The ommatidia ultimately form a triangular lattice. (F) Time series for one cluster of presumptive R cells as they emerge from the MF and form a 5-cell rosette within 5 hours. The multicellular arc stage at 2–3 hr is followed by the immature rosette stage at 4 hr. (G) Cells located anterior and posterior to the MF undergo division. (H) Number of cell divisions recorded throughout the imaging session as a function of the cell’s distance from the MF (dashed line). Note the division wave posterior to the MF is exclusively composed of non R-cells. (I) Frame from E-cadherin-GFP live imaging showing ommatidia at different stages of rotation with respect to the equator (red line). Rotation is clockwise for dorsal ommatidia and counter-clockwise for ventral ommatidia. (J) Successive time points of one ommatidium as it undergoes rotation. After rotating 45° by 2.5 hours, it resumes rotation at 5.5 hr and completes the 90° rotation after 8.5 hr. For panels D-J, anterior is to the left and dorsal to the top. Scale bar in panels D, E, and J is 5 µm. Scale bar in panel F is 3 µm.
Figure 1—figure supplement 1
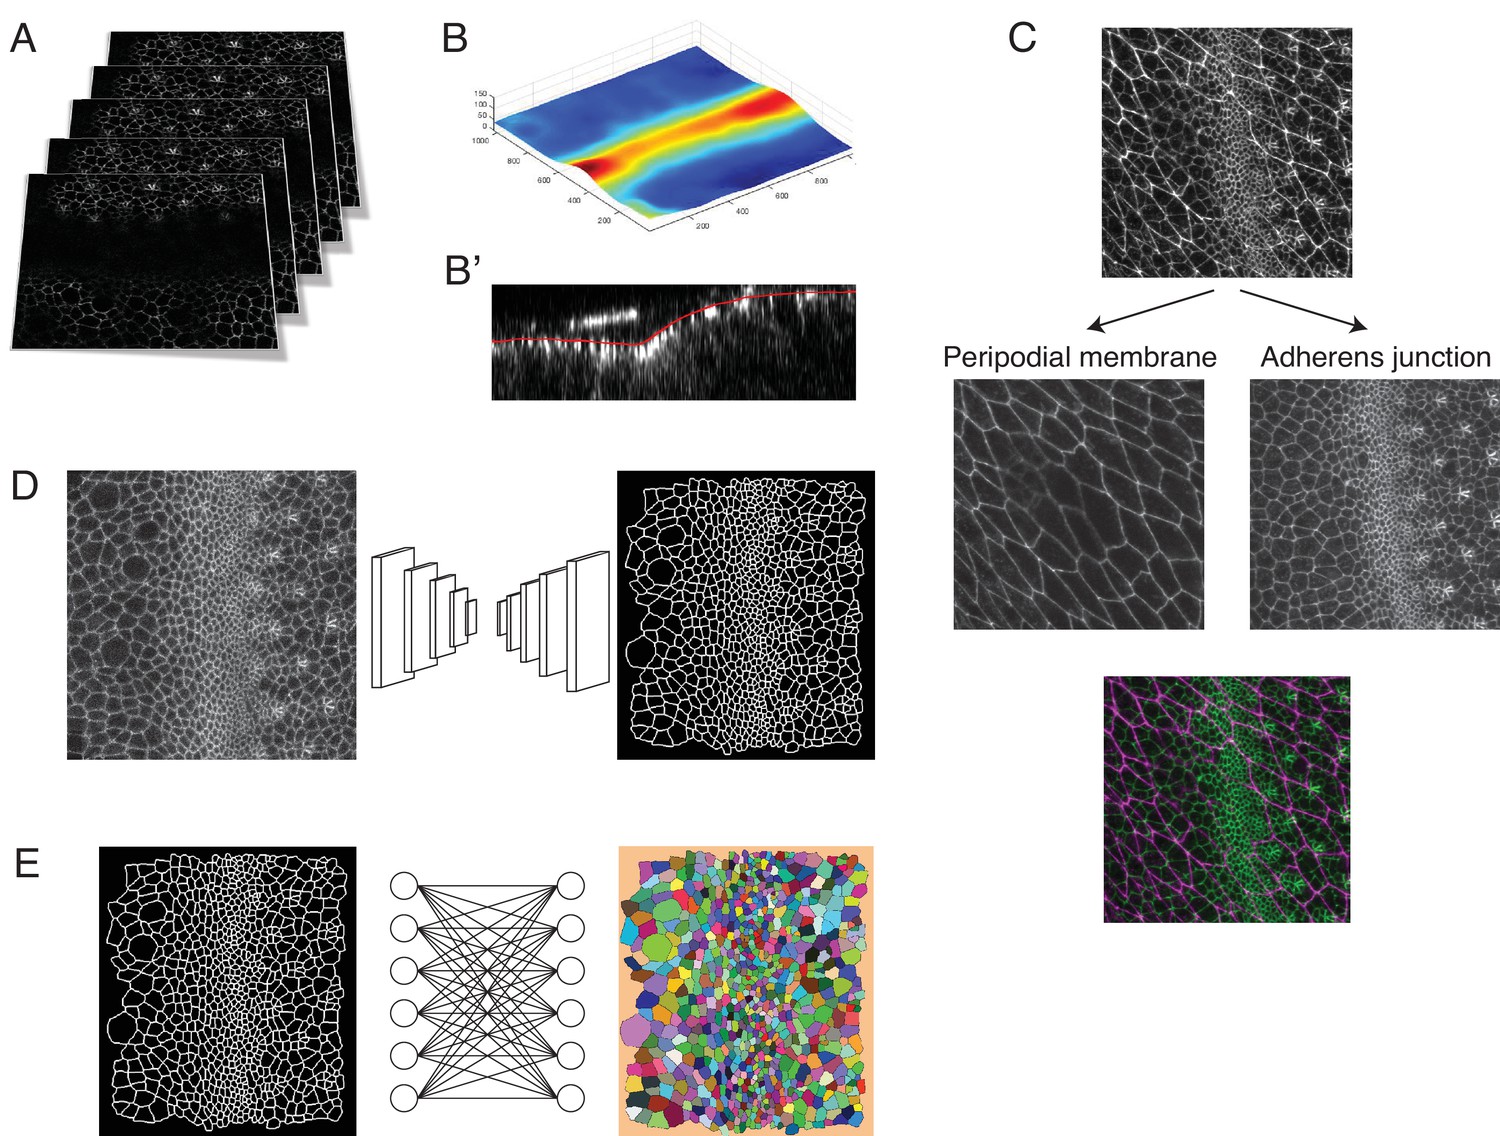
Pipeline for image capture and processing.
(A) A Z-stack of optical sections are collected at each time point. This stack is centered around the adherens junction plane of the eye disc epithelium in the z dimension. (B) Since the adherens junction plane has a laminar structure, resembling a surface with curvature, we applied the ImSAnE toolbox in MATLAB to reduce the data in each Z-stack to a Surface of Interest (SOI). (C) Use of ImSAnE also enabled us to computationally separate the fluorescence signal of E-cadherin-GFP from the squamous peripodial epithelium that closely overlies the disc epithelium. Thus, we can process the SOI from the disc adherens junction alone. (D) For every processed dataset collected over the time course of imaging, the cell-cell interfaces in the SOI are segmented using a custom convolutional neural network. (E) Segmented objects in one time-point dataset are then linked to objects in neighboring time-point datasets using the Munkres assignment algorithm. This enables tracking of cells over time. All errors in segmentation and tracking are manually corrected using a custom-built MATLAB tool equipped with a graphical user interface.
Figure 1—figure supplement 2

General features of ex vivo eye development.
For panels A to D, all images are oriented with anterior to the left and dorsal is top. For each panel, the time course shown is arbitrarily set to begin at 0 and does not represent the actual time of imaging.(A) A single nascent ommatidium as it arcs (2 hr) to form an immature rosette (3 hr) and mature rosette (4 hr). (A’) is unmarked to show the dynamics of E-cadherin-GFP expression in cells. (A’’) is marked to show the presumptive identities of cells. Note the intercalation events that bring cells together as the ommatidium develops. (B) A single ommatidium beginning at the mature rosette stage and showing the presumptive R1, R6, R7, and cone cells as they are recruited to join the ommatidium. Note that their apical domains contract over time, reflecting the adoption of their respective cell fates. (C) Three representative ommatidia showing the reproducible dynamics of their development to form mature rosettes. Presumptive R cells are labeled purple (R8), orange (R2, R5) and cyan (R3, R4). (D) Six successive time frames of a region posterior to the MF, where a single cell (purple) becomes smaller until it wholly disappears from the field of view. It does not reappear and presumably delaminates from the tissue and is lost. Cell delamination in imaginal fly tissues has been described as occurring with living cells (Marinari et al., 2012), although we cannot exclude that the events we observed are not apoptosis-mediated extrusion events. Cell apoptosis occurs sporadically throughout the eye disc (Hay et al., 1994). (D’) Delamination of cells as a function of their distance from the MF (vertical dashed line) along the anterior-posterior axis. Shown are all delamination events over the time course of imaging. Anterior is to the left.
Figure 2 with 1 supplement

A periodic cell flow exists in the MF.
(A) Velocities for all cells in the MF at the indicated times. Arrow length is proportional to the magnitude of velocity. Clusters of cells with higher anterior velocity alternate with clusters of lower anterior velocity, and their positions along the dorsal-ventral axis (top-bottom) correspond to where nascent ommatidia emerge to form even and odd numbered columns. Note that anterior velocities progressively diminish over the time course, which matches a corresponding diminishment in the rate of MF movement over the time course. The cause of progressive MF slowdown ex vivo is not known. Scale bar is 5 µm. (B) Cell velocities in the anterior direction were decomposed by Fourier transformation. Left, transformation was independently performed on cells binned by their anterior-posterior positions relative to the MF. Velocities for all cells in each bin were collected over five hours. Each color represents a single bin. Right, Fourier transforms of bins specific to the MF show anterior velocity oscillations that have a fixed spatial frequency (marked by asterisks). The peaks close to zero frequency seen in all transforms likely corresponds to the known equator-to-margin gradient in ommatidia maturation (Wolff and Ready, 1993). Ommatidia closest to the equator are the earliest to develop in a column, and marginal ommatidia are the last. (C) The distance between each pair of neighboring R8 cells within in a column was sampled for all columns of ommatidia and all time-frames. This is shown as a probability density function. The velocity oscillations detected by Fourier transformation have a fixed period length (14.17 μm, red line) that is highly comparable to the average distance between neighboring R8s. (D) Cells within the MF that reside at the same position along the dorsal-ventral axis exhibit temporal oscillations in anterior velocity over the time course of imaging. Shading represents 95% confidence intervals. (E) Autocorrelation of anterior velocity at time t for cells within the MF that reside at the same position along the dorsal-ventral axis. Velocity is maximally anticorrelated at t + 2 hr and is positively correlated with a maximum at t + 4 hr. These timescales are typical for formation of one and two new ommatidial columns, respectively. Shading represents 95% confidence intervals. (F) All cells within the MF that are fated to join odd-numbered columns of ommatidia synchronously oscillate their anterior velocity over time, and their velocity oscillates out of phase with cells fated to join even-numbered columns. Shading represents 95% confidence intervals.
Figure 2—figure supplement 1

Position of the MF as it changes over time.
Position of the MF along the anterior-posterior axis of the field of view for two replicate eye discs. The data strongly fits a linear model with a slope of 1.44 μm/hr for both replicates.
Figure 3 with 1 supplement
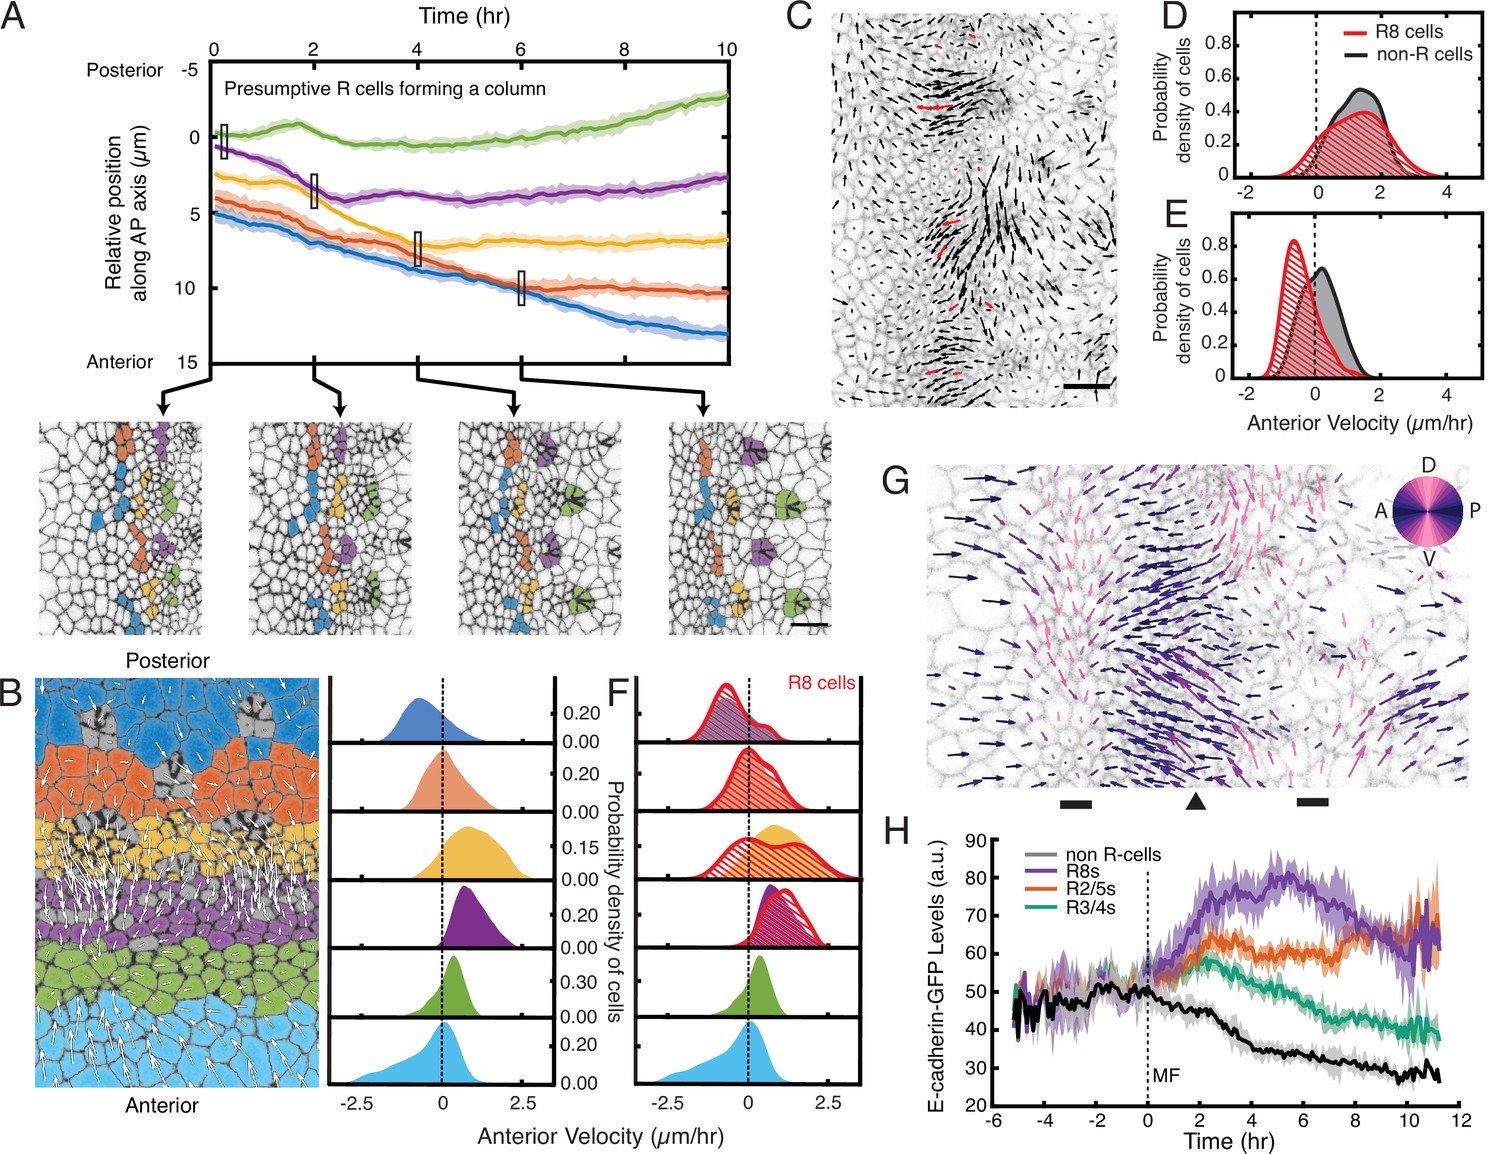
Complex cell flows within the eye disc.
(A) Tracking over time the positions of all presumptive R cells binned by their ommatidia column. Each bin is color coded. The moving line averages follow relative position along the anterior-posterior axis of the eye disc. The position of cells in the first column that emerges from the MF is zero. Shading represents 95% confidence intervals. Below, segmented images at the indicated time points when some R cell bins inflect their velocity. (B) Distribution of cell velocities in the anterior direction. Left, analysis was independently performed on cells binned by their anterior-posterior positions relative to the MF. Velocities for all cells in each bin were collected over five hours. Each color represents a single bin. Right, probability density of cells in each bin with respect to their anterior velocity. (C) Time point showing velocities for the presumptive R8 cells in the MF (red) and all other cells (black). Note the presumptive R8s in each low-flow cluster can have velocities oriented in different directions from one other. (D,E) Probability density of presumptive R8s and non-R cells with respect to their anterior velocity. Cells are within MF clusters experiencing high flow (D) or low flow (E). All such cells were sampled over five hours. (F) Density distribution of anterior velocities of presumptive R8 cells over five hours. Cells were binned as in panel B. Note the bimodal distribution of R8 anterior velocities within the MF. (G) Time point showing velocities for all cells in the field of view color-coded by their relative direction. The MF (arrowhead) is flanked by two dorsal-ventral stripes of cells (bars) that have little to no velocity along the anterior-posterior axis (left-right). (H) Tracking of the average abundance of E-cadherin-GFP protein over time for all presumptive R cells and non-R cells. Shading represents 95% confidence intervals. Cells were synchronized in time by the point when they exited the MF (time 0). Note the uniform elevated levels of E-cadherin for all cells within the MF, and a bifurcation at time 0 when R cells increase E-cadherin and non-R cells decrease E-cadherin.
Figure 3—figure supplement 1
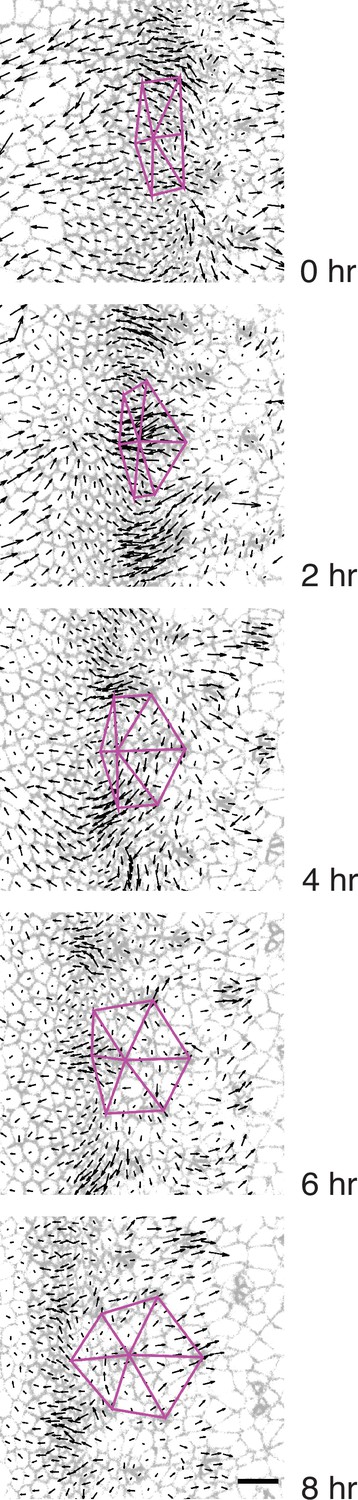
Triangular grid formation.
Time frames of a wildtype disc captured every 2 hr. A group of seven presumptive R8 cells spanning five neighboring columns are connected to one another by purple lines. All cells are labeled with their respective velocity vectors. Note how the vertices of triangles move coherently with surrounding cell flows to create a regular triangular grid.
Figure 4 with 1 supplement
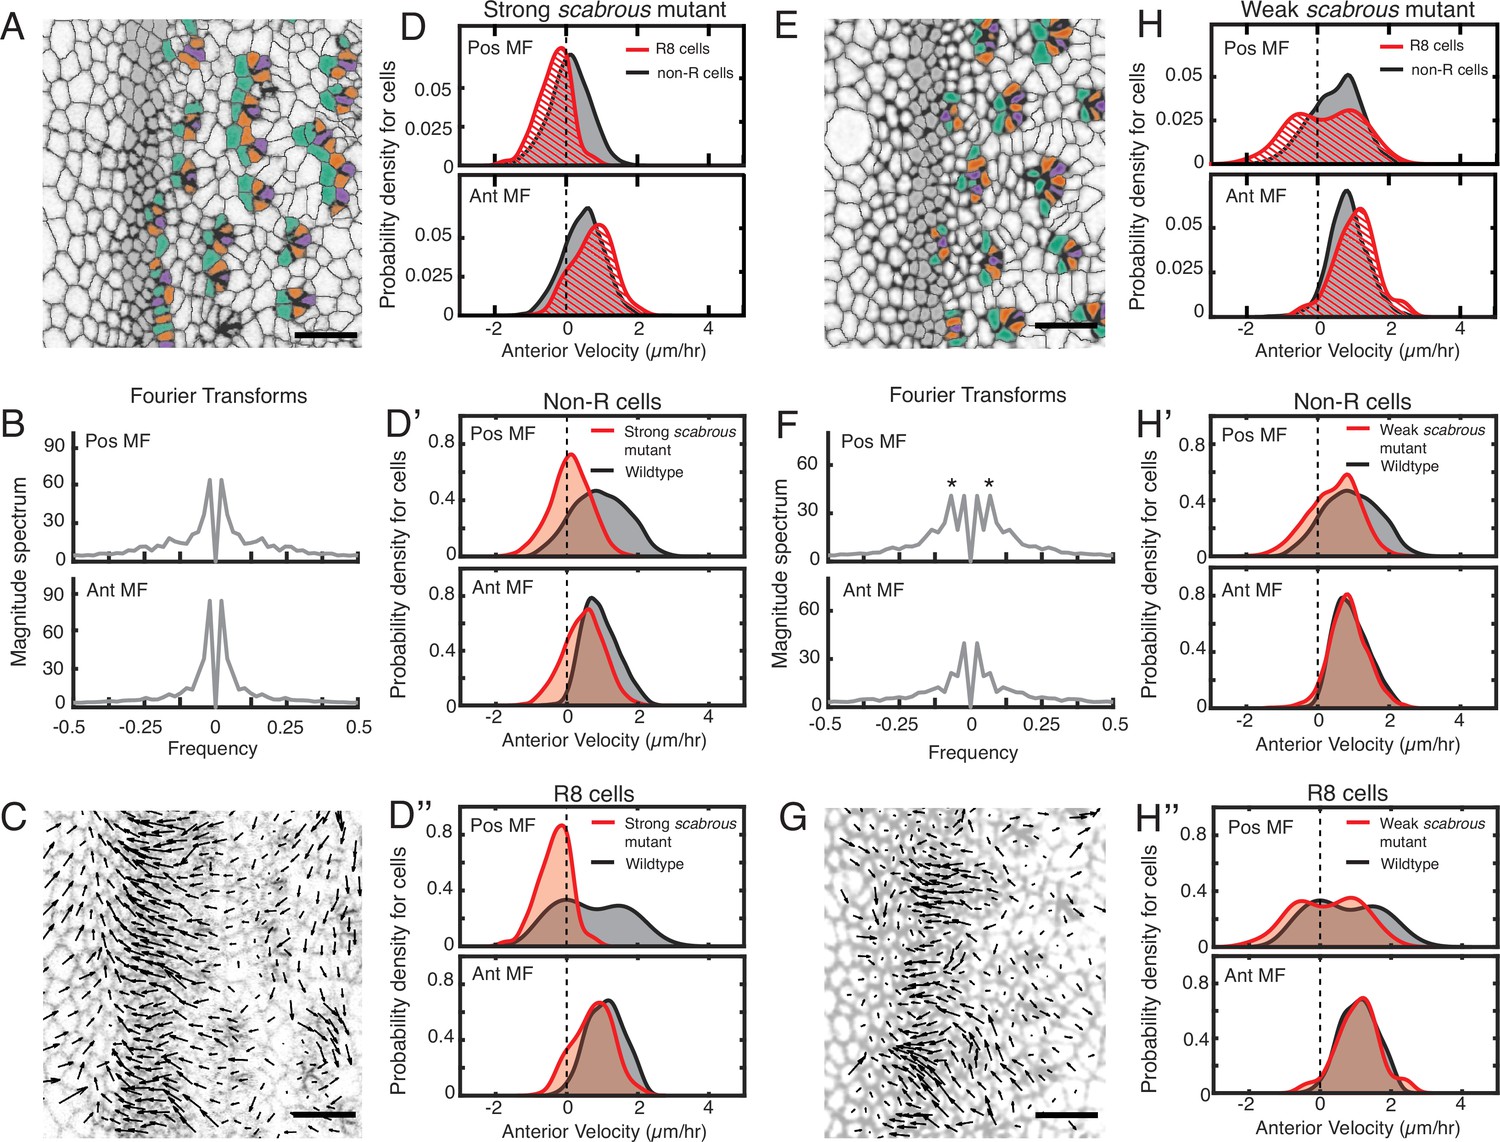
Scabrous is required for robust periodic cell flow in the MF.
(A-D’’) Analysis of scabrousBP2 eye disc with severe patterning defects. (A) Time point showing presumptive and fated R cells colored - R8 (purple), R2 and R5 (orange), R3 and R4 (cyan). (B) Cell velocities in the anterior direction were decomposed by Fourier transformation. Transformation was independently performed on cells binned by position relative to the MF, either on the posterior or anterior side of the MF. Velocities for all cells in each bin were collected over 5 hr. The peaks close to zero frequency correspond to the known equator-to-margin gradient in ommatidia maturation (Wolff and Ready, 1993). (C) A time point showing cell velocities. (D-D’’) Probability density of presumptive R8 (red) and non-R (black) cells with respect to their anterior velocity. Cells were binned by their position along the posterior or anterior sides of the MF, and cells were sampled over five hours. (D) Comparison of presumptive R8s and non-R cells in the scabrous mutant. (D’) Comparison of non-R cells from scabrous mutant and wildtype eyes. (D’’) Comparison of presumptive R8 cells from scabrous mutant and wildtype eyes. (E-H’’) Analysis of scabrousBP2 eye disc with mild patterning defects. (E) Time point showing presumptive R cells colored as in A. (F) Cell velocities in the anterior direction were decomposed by Fourier transformation. Transformation was independently performed on cells binned by their position along the posterior and anterior sides of the MF. Velocities for all cells in each bin were collected over 5 hr. Velocity oscillations of fixed spatial frequency (marked by asterisks) are weaker than in wildtype (compare to Figure 2B). (G) A time point showing cell velocities. (H-H’’) Probability density of presumptive R8 (red) and non-R (black) cells with respect to their anterior velocity. Cells were binned by their position along the posterior and anterior sides of the MF, and cells were sampled over 5 hr. (H) Comparison of presumptive R8s and non-R cells in the scabrous mutant. (H’) Comparison of non-R cells from scabrous mutant and wildtype eyes. (H’’) Comparison of presumptive R8 cells from scabrous mutant and wildtype eyes.
Figure 4—figure supplement 1

Macroscopic features of scabrous mutant discs.
(A) Cell division and delamination events as a function of their distance from the MF (vertical dashed line) along the anterior-posterior axis of scabrous mutant discs. Shown are all cell division and delamination events over the time course of imaging. Anterior is to the left. Strong and weak refers to the severity of the ommatidia spacing defects in each disc. (B) Position of the MF as it changes over time along the anterior-posterior axis of the field of view for scabrous mutant discs. The data strongly fits a linear model with slopes of 1.48 and 1.83 μm/hr for the replicates.
Figure 5
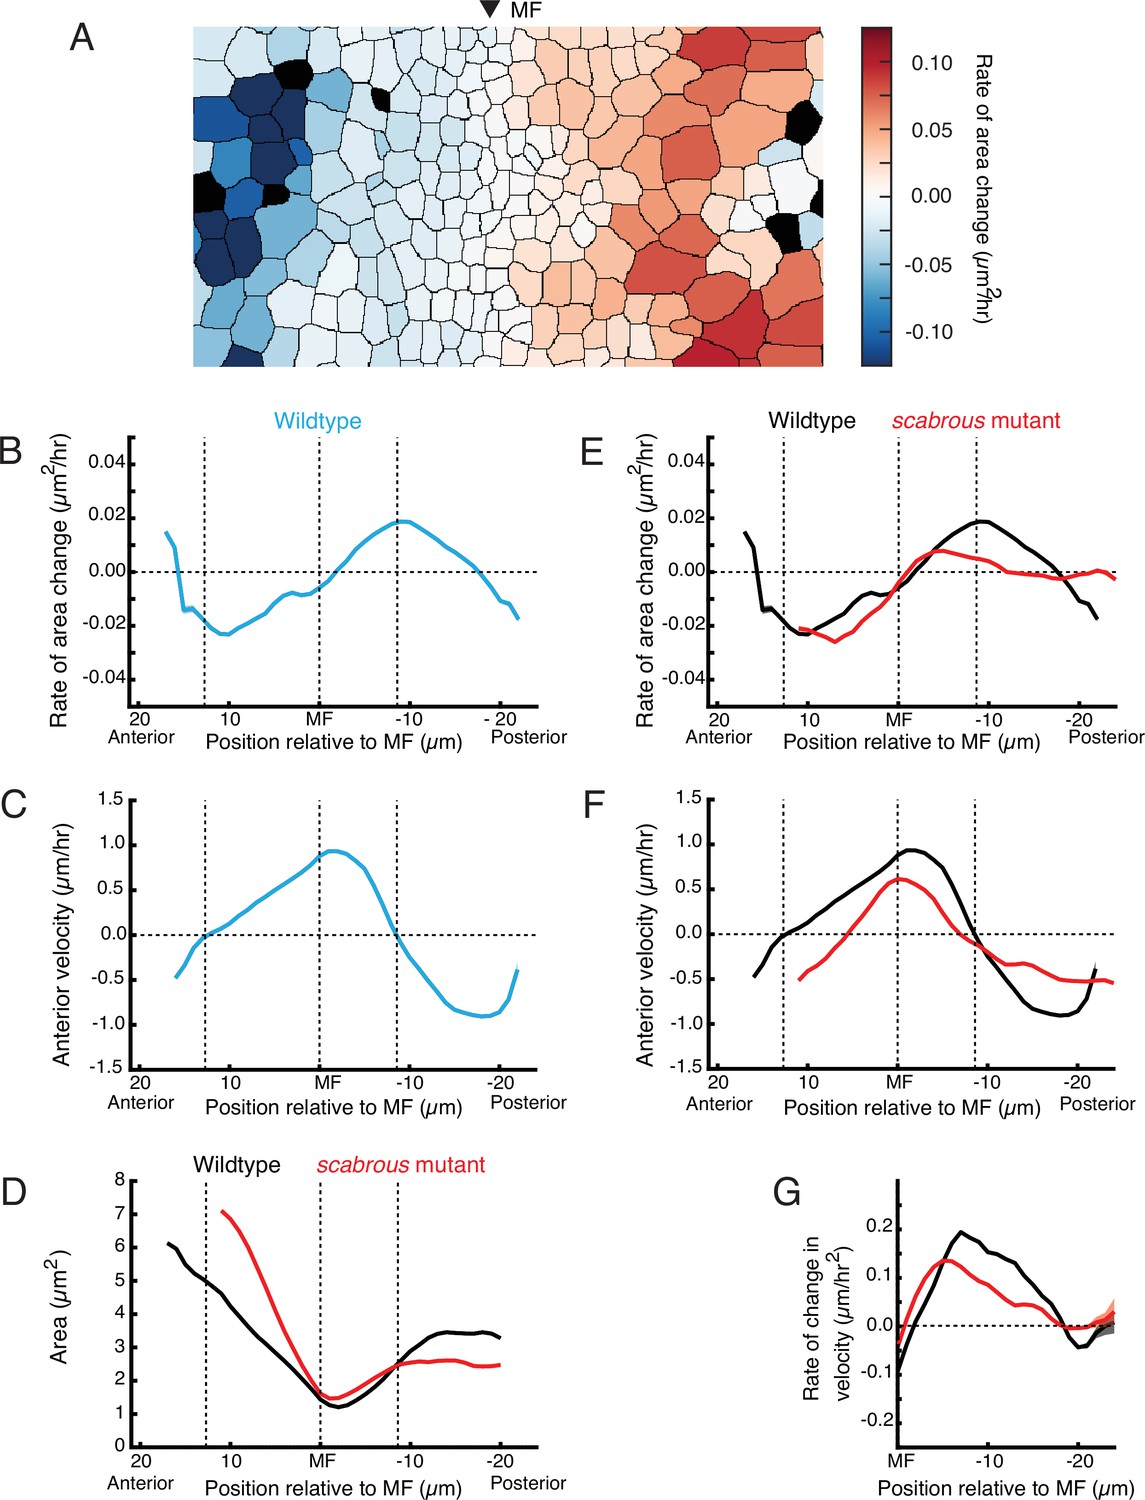
Scabrous is required for normal cell dilation and cell flow.
(A) The rate of area change for all cells in the field of view at a randomly chosen time point. A stripe of cells anterior to the MF shows rapid area contraction, while a stripe of cells posterior to the MF shows rapid area expansion. (B–G) Measurements of various cell features as a function of cell position along the anterior-posterior axis relative to the MF. The MF position is fixed at zero. Measured features were averaged across all cells along the dorsal-ventral axis and over 5 hr of imaging, giving a one-dimensional representation. Analysis of all discs was aggregated such that each moving line average shown is representative for multiple samples. Shading represents 95% confidence intervals. Note these features are highly stable throughout the time course of imaging and between samples. For B through F, dotted vertical lines denote the stable positions of inflection points in wildtype cell area change and direction of cell movement. (B) Rate of area change in wildtype cells. (C) Anterior velocity in wildtype cells. (D) Cell area in wildtype and scabrous mutant cells. (E) Rate of area change in wildtype and scabrous mutant cells. (F) Anterior velocity in wildtype cells and scabrous mutant cells. (G) Rate of velocity change in wildtype and scabrous mutant cells posterior to the MF.
Figure 6
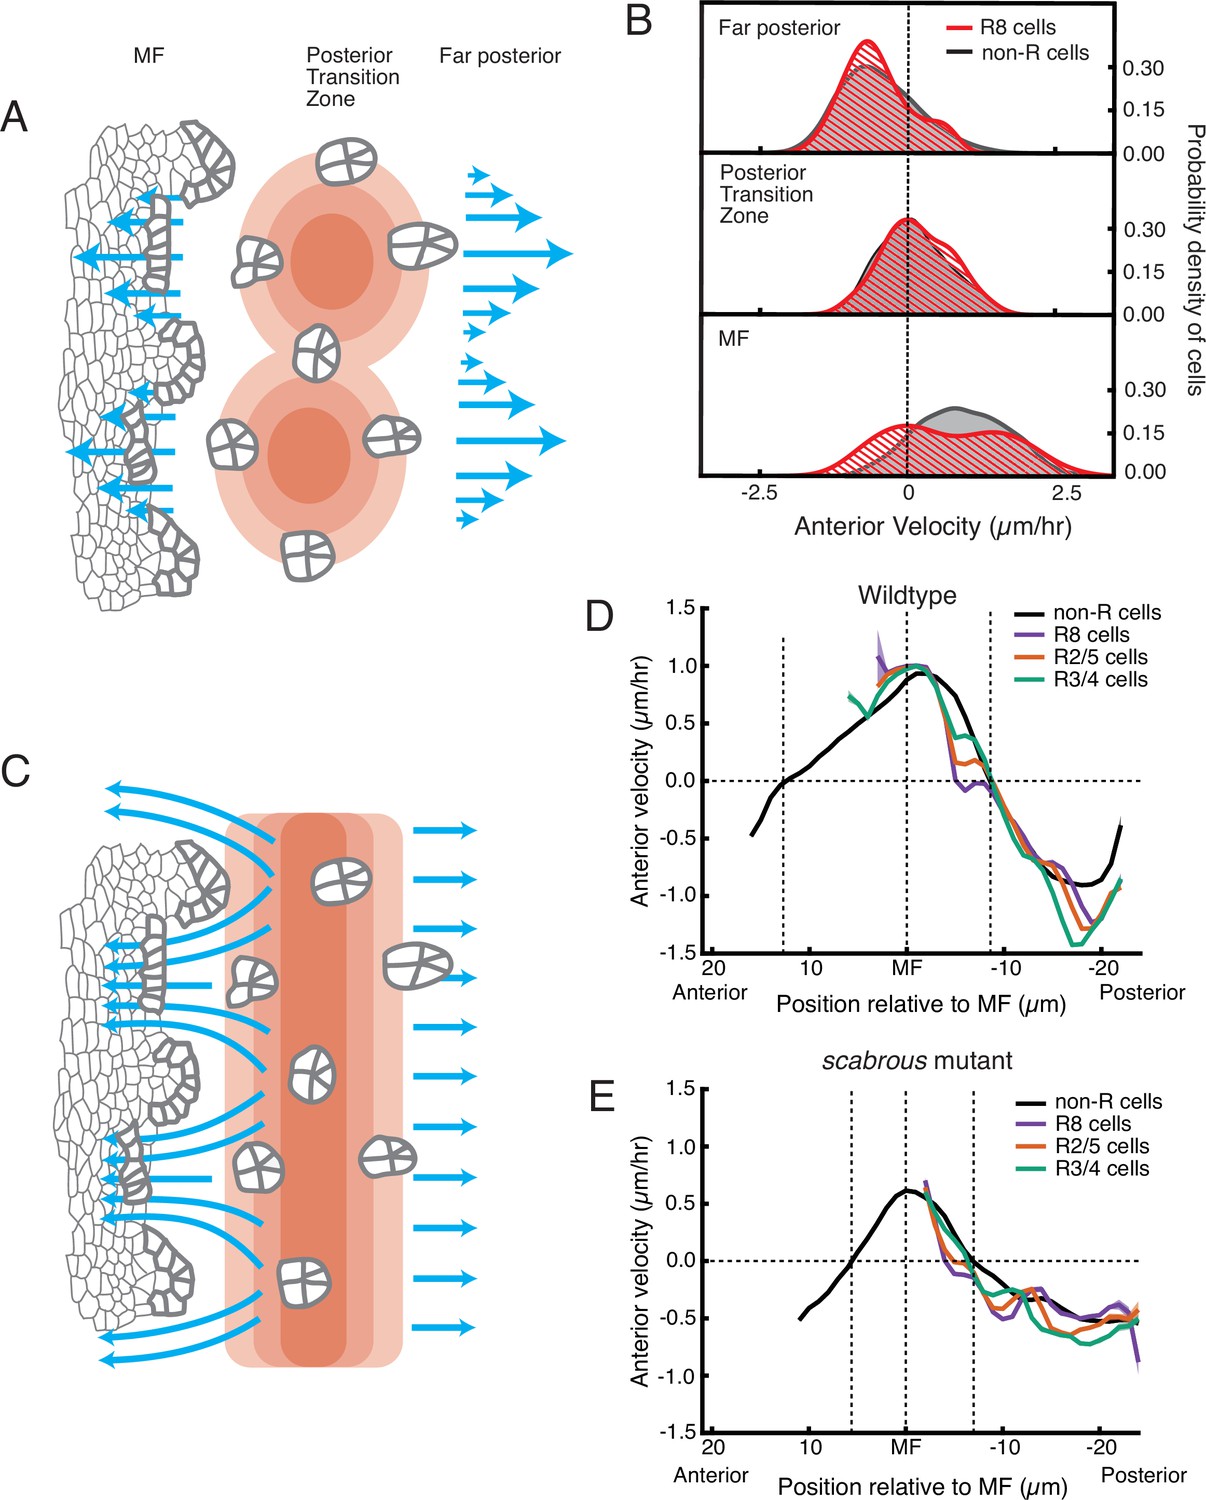
Relationship between cell flow and cell dilation/contraction.
(A) Hypothetical mechanism for how an inferred pressure gradient generates periodic flows in the MF. There are periodic domains of cell dilation (red) in the source of cell flows, causing periodic flow (blue arrows) away from the source in both posterior and anterior directions. (B) Probability density of presumptive R8 (red) and non-R (black) cells with respect to their anterior velocity. Cells are binned according to their positions relative to the source of cell flow. Velocities for all cells in each bin were collected over 5 hr. (C) Alternative mechanism for how an inferred pressure gradient generates periodic flows in the MF. The zone of cell dilation is uniform, causing uniform flow in both posterior and anterior directions. However, if ommatidia cells are immobilized, then they cause cells to flow around them, leading to a periodic flow field in the MF. (D,E) Measurements of anterior velocity of cells as a function of cell position along the anterior-posterior axis relative to the MF. The MF position is fixed at zero. Velocity was averaged across all cells along the dorsal-ventral axis and over five hours of imaging, giving a one-dimensional representation. Shading represents 95% confidence intervals. For both wildtype (D) and the severe scabrous mutant (E) discs, R cells abruptly decrease in velocity immediately posterior to the MF. R8 cells remain immobile until all other cells reach the velocity inflection point at the Posterior Transition Zone, marked with a vertical dotted line.
Figure 7
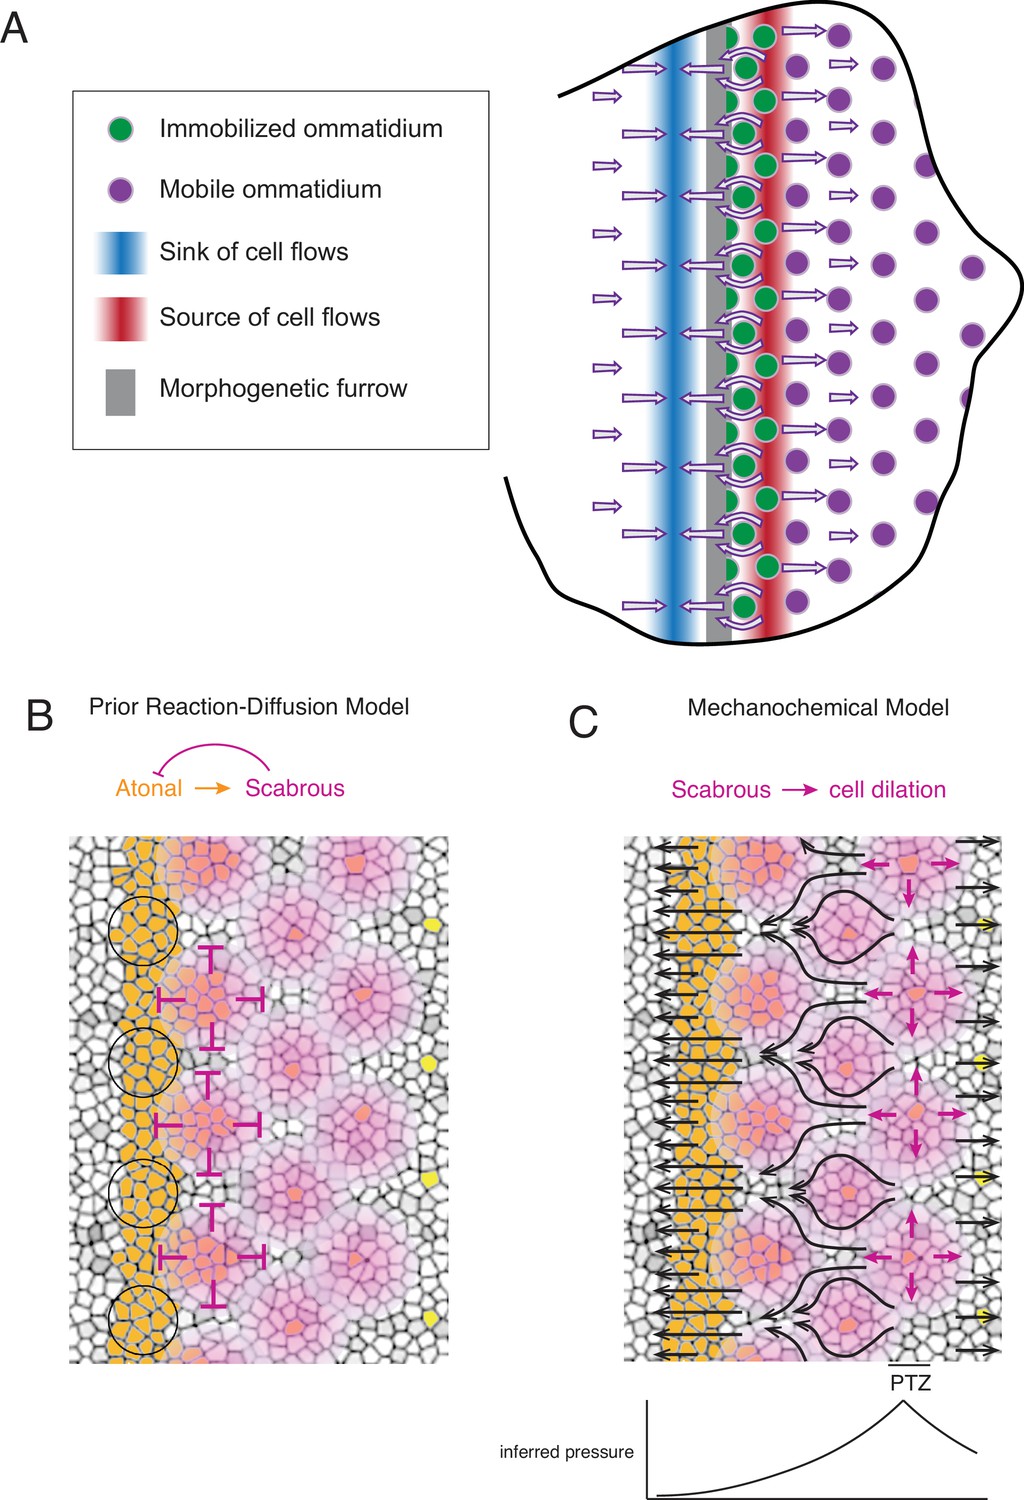
Self-organized triangular lattice formation.
(A) Summary of newly observed phenomena described in this study. Arrows show the cell flows across the eye disc. (B) Prior model for self-organized lattice formation based on a standard reaction-diffusion process. It was thought the stripe of Atonal-positive cells resolves into a triangular grid of R8 cells due to inhibitory fields of Scabrous diffusion (purple). Alternating clusters of Atonal-positive cells in the MF (black circles) lie outside the inhibitory fields and therefore maintain Atonal expression and become the next column of ommatidia. (C) Mechanochemical model for self-organized lattice formation. R8 cells secrete Scabrous in columns one to three, triggering nearby cells to dilate. At the posterior transition zone (PTZ), the rate of dilation is maximal, creating a pressure gradient. Since ommatidia cells in columns one to three are immobilized, anterior cell flow down the pressure gradient is deflected and focused to create flow in the MF that is periodic. This leads to alternating clusters of cells flowing with the MF before slowing down and exiting the MF.
Videos
Video 1
A wildtype disc after segmentation and tracking.
Each unique tracked cell is labeled a specific color. Note that cells gain and lose color when they enter and exit the field of view, which marks the beginning and end, respectively, of those cells’ tracks.
Video 2
A wildtype disc with the presumptive R cells labeled a specific color.
All R cells belonging to the same column are labeled with the same color. Cells shaded gray represent a strip of cells residing within the MF.
Video 3
A wildtype disc with all cells labeled with their respective velocity vectors, in which arrow length is proportional to the magnitude, and direction is marked by arrow orientation. Presumptive R8 cell velocities are labeled red.
Video 4
Emergence of the triangular lattice as a consequence of cell flow.
A group of seven presumptive R8 cells spanning five neighboring columns are connected to one another by purple lines. All cells are labeled with their respective velocity vectors. Note how the vertices of triangles move coherently with surrounding cell flows to create a regular triangular grid.
Video 5
A scabrous mutant disc with the presumptive R cells labeled with a specific color.
R8 (purple), R2 and R5 (orange), R3 and R4 (cyan). Cells shaded gray represent a strip of cells residing within the MF. The disc has a more severe spacing phenotype.
Video 6
A wildtype disc with all cells colored according to their Shape Index.
Each cell at each time-frame was fitted with an ellipse, and the dorsal-ventral vs. anterior-posterior span of the ellipse was used to calculate the Shape Index of that cell. The Shape Index was defined as the (AP span - DV span)/(AP span+ DV span). The Shape Index for each cell is shaded such that cells with no anisotropy in their Shape Index are white and cells with anisotropy in either the DV or AP direction are shaded darker. If the Index indicated a larger span along the DV axis than AP axis, that cell is shaded orange. If the Index indicated a larger span along the DV axis than AP axis, that cell is shaded blue. Cells in the MF frequently have anisotropic Shape Indices with a larger span along DV axis than AP axis. Note that cells in the MF do not change their Shape Index or alignment to the body axes with any apparent periodicity.
Video 7
A wildtype disc with cells initially colored in arbitrary stripes of one to two cells thickness and that are aligned with the dorsal-ventral axis (vertical).
Cells retain that color identity throughout the movie no matter where they move. Note that stripes of color within the anterior side of the MF retain their integrity, meaning that there are few T1 transitions pushing apart cells that are AP neighbors with one another. In contrast, frequent cell intercalations are observed posterior to the MF.
Tables
Table 1
Summary statistics of populations under comparison.
We performed non-parametric Mann-Whitney U tests since most distributions are not Gaussian. The large sample sizes going into all our measurements resulted in extremely low p-values for many. Therefore, we report the -log10(p-values) of the Mann-Whitney tests. The -log10 values report the statistical magnitude of the difference between one group and another; the larger that value, the larger the difference. For example, any -log10 value less than 1.3 means p > 0.05.
| Compared populations | -log10(Mann Whitney p-value) |
|---|---|
| Figure 3D & E - R8s vs. non-R cell flow in the MF | |
| 3D - R8 vs. non-R cells in high flow regions of the MF | 1.1467 |
| 3E - R8 vs. non-R cells in low flow regions of the MF | 24.8128 |
| Figure 3F - velocity distributions of R8s to non-R cells | |
| Dark blue (far posterior) | 0.5838 |
| Orange (PTZ) | 1.6628 |
| Yellow (posterior side MF) | 8.9340 |
| Purple (anterior side MF) | 15.5146 |
| Figure 4D–D’’ velocity distributions of strong sca vs. WT | |
| 4D top - R8s vs. non-R cells | 72.4072 |
| 4D bottom - R8s vs non-R cells | 23.9553 |
| 4D’ top - Strong sca vs. WT | Infinity* |
| 4D’ bottom - Strong sca vs. WT | Infinity* |
| 4D’’ top - Strong sca vs. WT | 68.3809 |
| 4D’’ bottom - Strong sca vs. WT | 22.5819 |
| Figure 4H–H’’ velocity distributions of weak sca vs. WT | |
| 4 H top - R8s vs. non-R cells | 12.7047 |
| 4 H bottom - R8s vs non-R cells | 20.9813 |
| 4 H’ top - Weak sca vs. WT | 447.4232 |
| 4 H’ bottom - Weak sca vs. WT | 24.8584 |
| 4 H’’ top - Weak sca vs. WT | 17.4521 |
| 4 H’’ bottom - Weak sca vs. WT | 0.3525 |
| Figure 6B - velocity distributions of R8s to non-R cells | |
| Far posterior | 0.5838 |
| Posterior Transition Zone (PTZ) | 1.6628 |
| Morphogenetic furrow (MF) | 8.9340 |
-
*
p Value reported in the test lower than the computational limit of the program.
Key resources table
| Reagent type (species) or resource | Designation | Source or reference | Identifiers | Additional information |
|---|---|---|---|---|
| Gene (Drosophila melanogaster) | DE-Cadherin::GFP | Huang et al., 2009 | Flybase: FBal0247908 | Knock-in in-frame fusion of GFP into endogenous shotgun (shg) gene. Gift from Suzanne Eaton |
| Gene (Drosophila melanogaster) | scabrousBP2 | Bloomington Drosophila Stock Center | FlyBase IDFBal0032653BDSC ID 7320 | ~ 2 kb deletion of 5’ region of sca, including first exon and start site. Protein null allele. |
| Other | Grace’s Insect Medium | Sigma Aldrich | G9771 | |
| Chemical compound, drug | PenStrep Stock Solution | Gibco | 15140–122 | |
| Chemical compound, drug | BIS-TRIS | Sigma Aldrich | B4429 | |
| Chemical compound, drug | Fetal Bovine Serum (FBS) | Thermo Fisher Scientific | 10270098 | |
| Chemical compound, drug | Insulin solution, human | Sigma Aldrich | 19,278 | |
| Other | Dumont forceps (0208–5-PO) | Fine Science Tools | 11252–00 | |
| Other | 26G × 5/8 Syringe | BD | 305,115 | |
| Other | 35 mm dish, No. 1.5 coverslip | MatTek | P35G-1.5–14 C | |
| Chemical compound, drug | 0.01% (w/v) Poly-L-Lysine | Sigma Aldrich | P4707 | |
| Other | Tesa double sided sticky tape | Tesa | 5,338 | |
| Other | 0.25 in (6 mm) hole puncher | Staples | 10,573 CC | |
| Other | Whatman polycarbonate membrane | Sigma Aldrich | WHA70602513 | |
| Chemical compound, drug | SeaKem Gold Agarose | Lonza Rockland | 50,150 | |
| Software, algorithm | ImSAnE MATLAB software | Heemskerk and Streichan, 2015 | https://github.com/idse/imsane | |
| Software, algorithm | Linear stack alignment with SIFT ImageJ plugin | Lowe, 2004 | https://imagej.net/plugins/linear-stack-alignment-with-sift | |
| Software, algorithm | MATLAB implementation of Hungarian algorithm | Cao, 2021 | https://www.mathworks.com/matlabcentral/fileexchange/20328-munkres-assignment-algorithm | |
| Software, algorithm | Convolutional neural network used for pixel classification | This paper | https://github.com/K-D-Gallagher/CNN-pixel-classification | |
| Software, algorithm | Trained CNN model for pixel classification of epithelial fluorescence confocal data | This paper | https://drive.google.com/drive/folders/1I-nRpn1esRzs5t4ztgbNvkBQuTN2vT7L?usp=sharing | |
| Software, algorithm | MATLAB pipeline for segmenting cells from pixel classified images and tracking them | This paper | https://github.com/K-D-Gallagher/eye-patterning | |
| Software, algorithm | MATLAB GUI for manually correcting segmentation errors | This paper | https://github.com/K-D-Gallagher/eye-patterning | |
| Software, algorithm | MATLAB datasets for Wildtype 1, Wildtype 2, Strong scabrous mutant, and Weak scabrous mutant | This paper | https://drive.google.com/drive/folders/1I-nRpn1esRzs5t4ztgbNvkBQuTN2vT7L?usp=sharing |
Table 2
Summary of published conditions to culture Drosophila imaginal discs ex vivo. Adapted from Tsao et al., 2016.
| Reference* | Medium | Serum (v/v) | Antibiotic | Fly extract (v/v) | Insulin | Ecdysone | Sample type | Duration |
|---|---|---|---|---|---|---|---|---|
| Robb, 1969 | R-14 | --- | 1X | --- | --- | --- | wing disc | --- |
| Davis and Shearn, 1977 | X (XCS) | --- | --- | --- | 0.4 mU/ml | 1 ng/ml | discs | --- |
| Wyss, 1982 | ZW | ??? FBS | --- | 22.5% | 10 mg/ml | 10 ng/ml | disc cells | --- |
| Currie et al., 1988 | Shields and Sang M3 | 2% FBS | --- | 5% | 125 mU/ml | 1 ng/ml | disc cells | --- |
| Schubiger and Truman, 2000 | Shields and Sang M3 D22 | 7.5% FCS | --- | --- | --- | 1 mg/ml | wing disc | 24 hr |
| Gibson et al., 2006 | Shields and Sang M3 | 10% FBS | 1X | --- | 0.01 mU/ml | --- | 1.5–2 hr | |
| Cafferty et al., 2009 | Schneider’s | 1% FBS | 10 X | --- | 200 mg/ml | --- | 4 hr | |
| Landsberg et al., 2009 | Shields and Sang M3 | 2% FCS | 1X | 2.5% | 0.125 iu/ml | --- | wing disc cells | |
| Aldaz et al., 2010 | Shields and Sang M3 | 2% FCS | 5X | --- | --- | 100–500 ng/ml | disc eversion | 10 hr |
| Mao et al., 2011 | Shields and Sang M3 | 2% FBS | 1X | --- | 0.01 mU/ml | --- | wing disc | 5 hr |
| Ohsawa et al., 2012 | Schneider’s | 10% FBS | --- | --- | --- | --- | 3 hr | |
| Zartman et al., 2013 | Schneider’s | variable | 4X | 5% | 6.2 µg/ml | --- | wing disc | 5 hr |
| Legoff et al., 2013 | Shields and Sang M3 | 2% FCS | --- | 2.5% | 125 mU/ml | --- | wing disc | 8 hr |
| Handke et al., 2014 | Shields and Sang M3 | 2% FBS | 10 X | 5% | 5 µg/ml | 1 ng/ml | wing disc | 7 hr |
| Tsao et al., 2016 | Schneider’s | 2% FBS | 4X | --- | 1250 µg/ml | --- | multiple discs | 18 hr |
| Dye et al., 2017 | Grace’s Insect Medium | 5% FBS | 1X | --- | --- | 1 ng/ml | wing discs | 12+ hr |
| This study | Grace’s Insect Medium | 2% FBS | 1X | --- | 625 µg/ml | --- | eye disc | 12–16 hr |
Additional files
Download links
A two-part list of links to download the article, or parts of the article, in various formats.
Downloads (link to download the article as PDF)
Open citations (links to open the citations from this article in various online reference manager services)
Cite this article (links to download the citations from this article in formats compatible with various reference manager tools)
Emergence of a geometric pattern of cell fates from tissue-scale mechanics in the Drosophila eye
eLife 11:e72806.
https://doi.org/10.7554/eLife.72806


