Brucella activates the host RIDD pathway to subvert BLOS1-directed immune defense
- Department of Microbial Pathogenesis and Immunology, College of Medicine, Texas A&M Health Science Center, United States
- Department of Electrical and Computer Engineering, Texas A&M University, United States
- Department of Veterinary Pathobiology, Texas A&M University, United States
- Texas A&M Veterinary Medical Diagnostic Laboratory, Texas A&M University, United States
- College of Plant Sciences, Key Laboratory of Zoonosis Research, Ministry of Education, Jilin University, China
- Key Laboratory of Symbolic Computation and Knowledge Engineering, Ministry of Education, College of Computer Science and Technology, Jilin University, China
- Genomics and Bioinformatics Services, Texas A&M University, United States
- Department of Poultry Science, Texas A&M University, United States
- Department of Molecular and Cellular Medicine, College of Medicine, Texas A&M Health Science Center, United States
- Department of Computer Science and Engineering, Dwight Look College of Engineering, Texas A&M University, United States
- Department of Biochemistry & Biophysics, Texas A&M University, United States
- TEES-AgriLife Center for Bioinformatics & Genomic Systems Engineering, Texas A&M University, United States
Figures
Figure 1 with 2 supplements
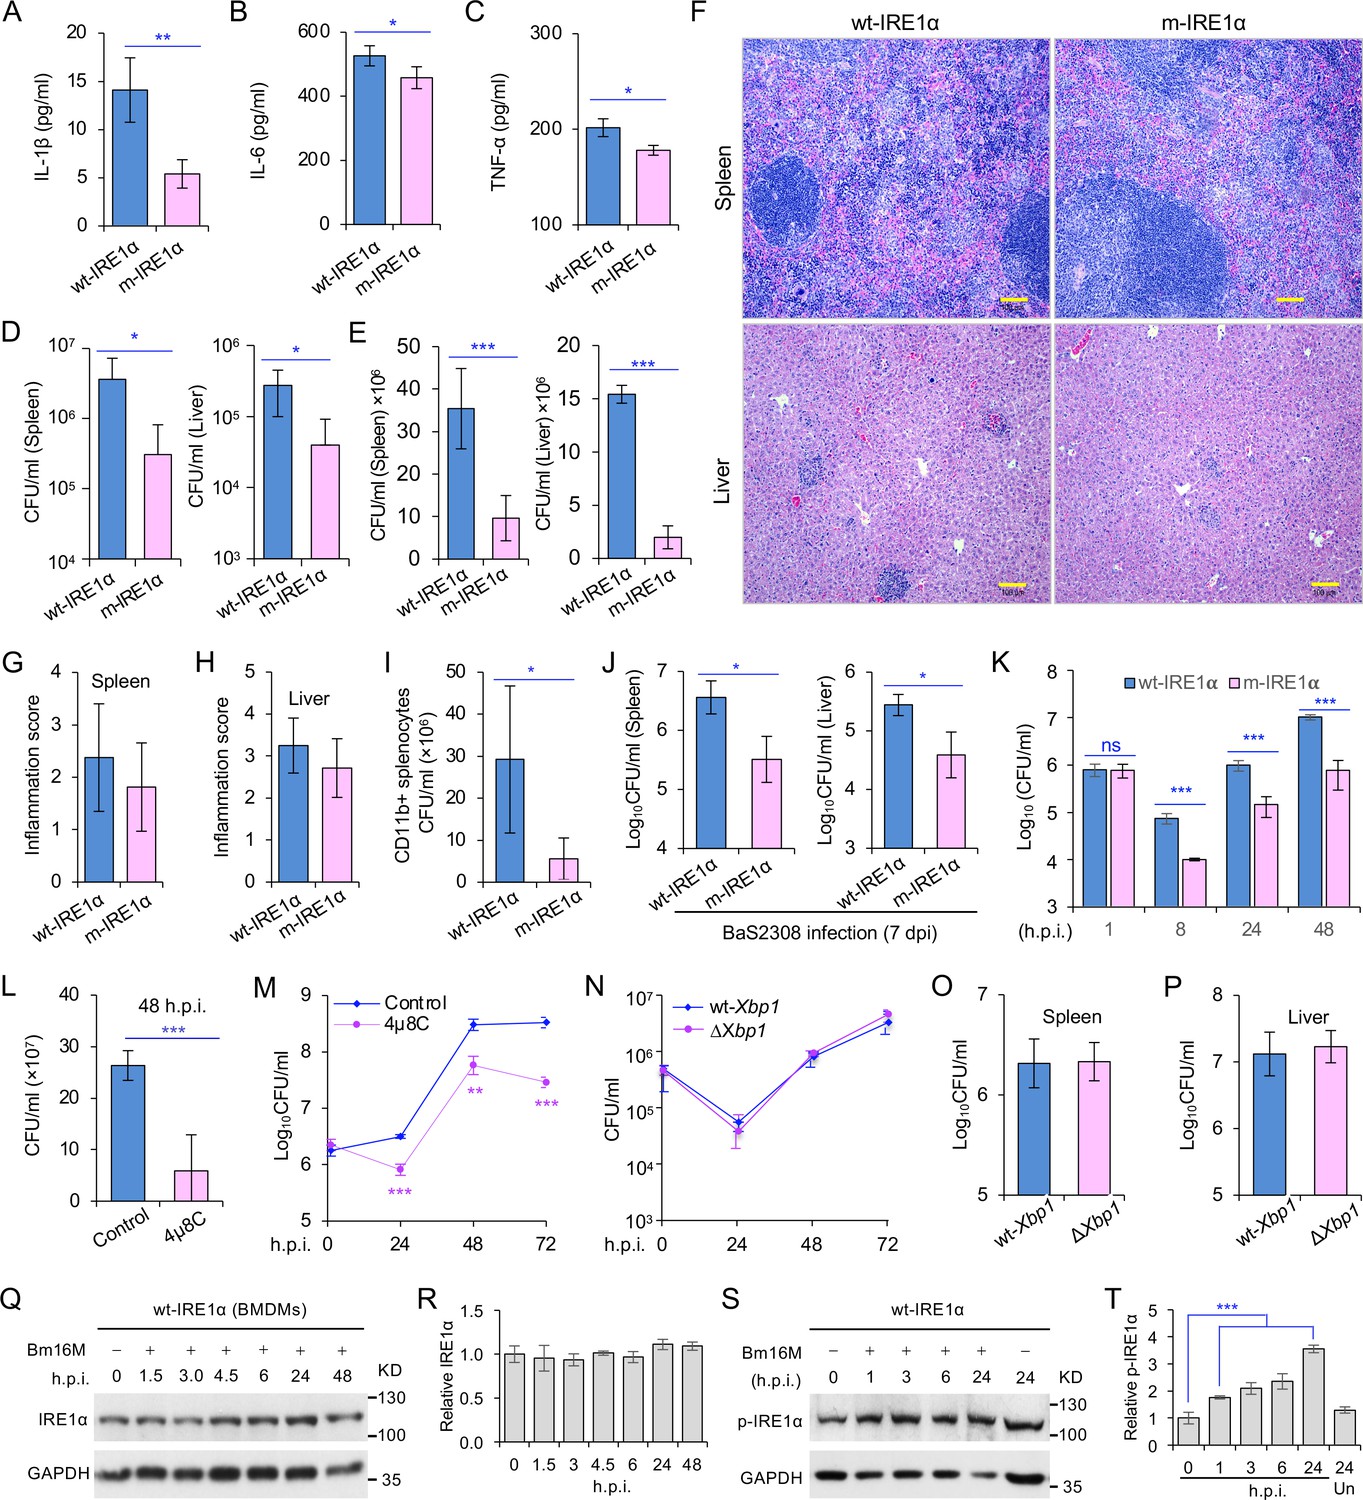
Host IRE1α is required for Brucella infection in vivo.
Innate cytokine production of IL-1β (A), IL-6 (B), and TNF-α (C) in bone marrow-derived macrophages (BMDMs) from the wild-type (WT, wt-IRE1α) control and Ern1 conditional knockout (CKO, m-IRE1α) mice. The BMDMs were stimulated with LPS (100 ng/ml) and at 6 hr poststimulation the cytokine production of the treated cells was determined. Colony-forming unit (CFU) assay for B. melitensis 16M (Bm16M) intracellular survival in spleens and livers of wt- and m-IRE1α mice at 7 (D) or 14 (E) days post infection (dpi). (F) Histopathology of representative hematoxylin and eosin (H&E) stained sections of spleen and liver from Bm16M-infected wt- and m-IRE1α mice at 14 dpi. Bar: 100 μm. Quantification of inflammation of spleens (G) or livers (H) at 14 dpi. (I) CFU assays of CD11b+ cells from Bm16M-infected wt- or m-IRE1α mice. (J) CFU assay for B. abortus S2308 (BaS2308) intracellular survival in spleens and livers in wt-IRE1α control or m-IRE1α mice at 7 dpi. (K) Bm16M invasion and intracellular replication in BMDMs from m-IRE1α and control mice. h.p.i.: hours post infection. CFU assays of Bm16M infection of WT BMDMs (L) or RAW264.7 macrophages (M). Host cells were pretreated with 4μ8C (50 μM) 1 hr before and during infection; CFUs of the infected cells were determined at the indicated h.p.i. (N) CFU assays for Bm16M infection of BMDMs from WT and Xbp1 knockout (ΔXbp1) mice at the indicated h.p.i. CFU assay for Bm16M intracellular survival in spleen (O) or liver (P) in WT or ΔXbp1 mice at 14 dpi. Immunoblotting assay for IRE1α expression (Q) and quantification of the expression levels (R) in BMDMs during a time course (48 hr) of Bm16M infection. Bm16M infection induces phosphorylation of host IRE1α (S) and quantification of the phosphorylated levels of IRE1α during a time course (24 hr) of infection (T). Images/blots are representative of three independent experiments. Statistical data represent the mean ± standard error of mean (SEM) from three independent experiments. *, **, and *** indicate significance at p < 0.05, 0.01, and 0.001, respectively.
Figure 1—figure supplement 1
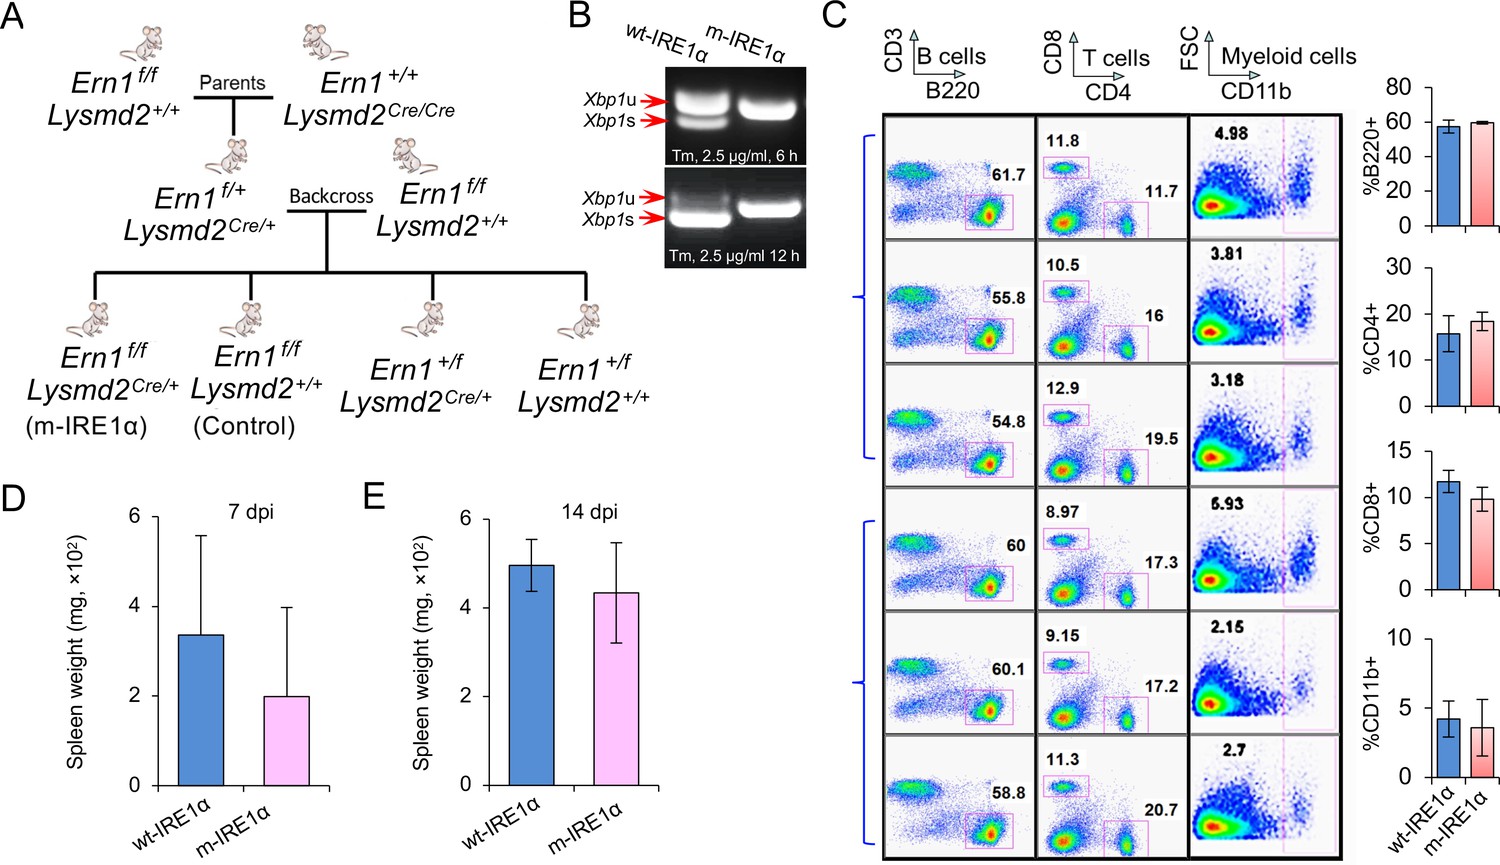
Characterization of Ern1 conditional knockout (CKO) and control mice.
(A) Strategy for generating Ern1 CKO (m-IRE1α) mice. (B) Bone marrow-derived macrophages (BMDMs) from m-IRE1α mice fail to induce Xbp1 splicing in the presence of ER stress inducer tunicamycin (Tm) at the indicated hours post treatment. wt-IRE1α: mice harboring the wild-type (WT) Ern1. (C) Comparison of the levels of lymphocytes and myeloid cells in the wt-IRE1α control and m-IRE1α mice. Spleen weight of Brucella melitensis Bm16M-infected mice at 7 (D) or 14 (E) days post infection (dpi). Data represent the mean ± standard error of mean (SEM) from three independent experiments.
Figure 1—figure supplement 2
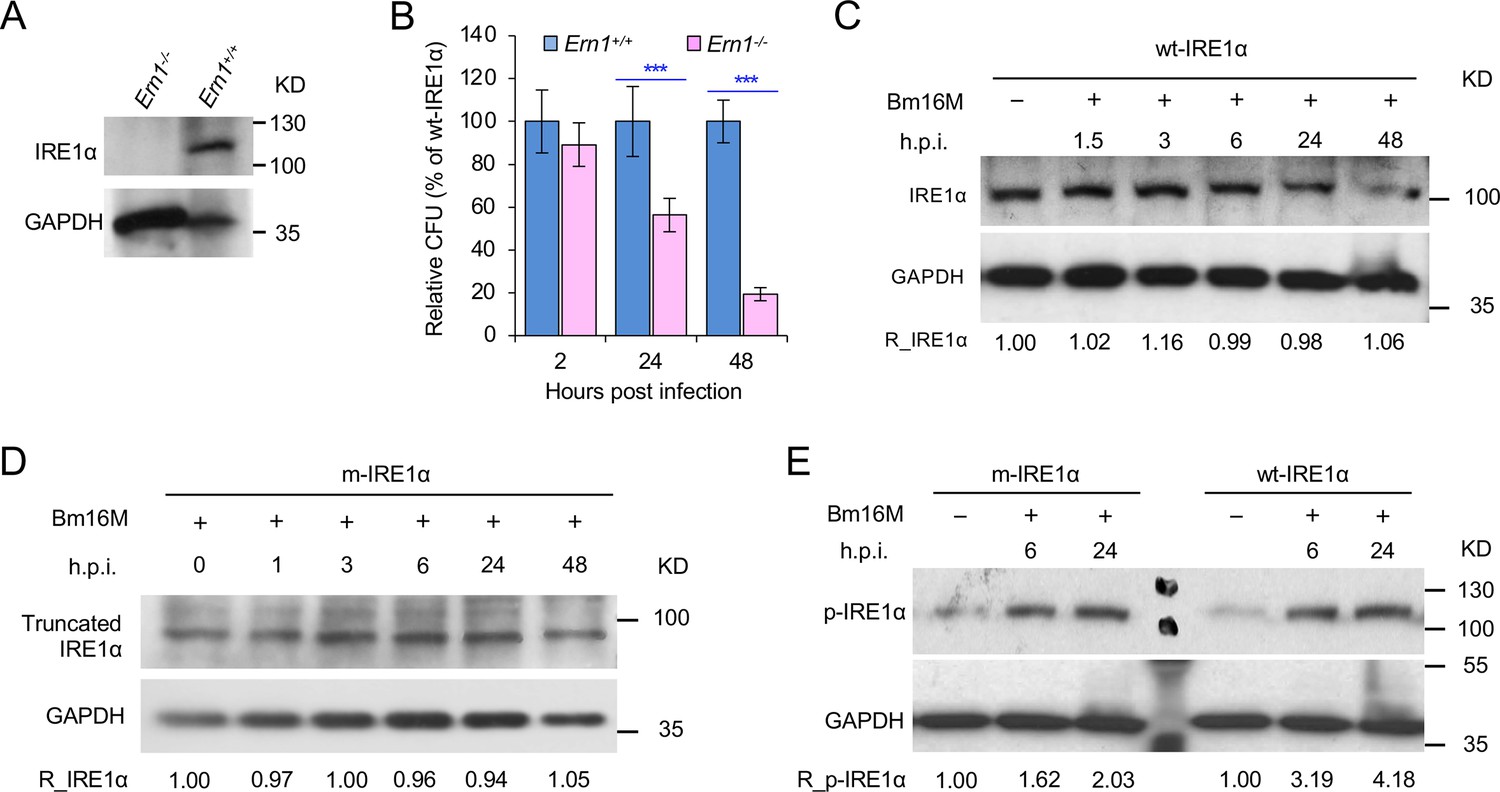
IRE1α is required for B. melitensis intracellular replication.
(A) Immunoblotting detection of IRE1α expression in the WT and Ern1 knockout (KO, Ern1−/−) murine embryonic fibroblasts (MEFs). Colony-forming unit (CFU) assay for Bm16M infection of WT and Ern1−/− MEFs (B) and IRE1α expression in these cells during a time course (48 hr) of Bm16M infection (C). (D) The expression levels of the truncated IRE1α in m-IRE1α BMDMs during Bm16M infection. (E) Disruption of the endonuclease domain of IRE1α does not impair its kinase activity in response to Bm16M infection. h.p.i.: hours post infection. Images are representative of three independent experiments. Data represent the mean ± standard error of mean (SEM) from three independent experiments. ***Significance at p < 0.001.
Figure 2 with 1 supplement
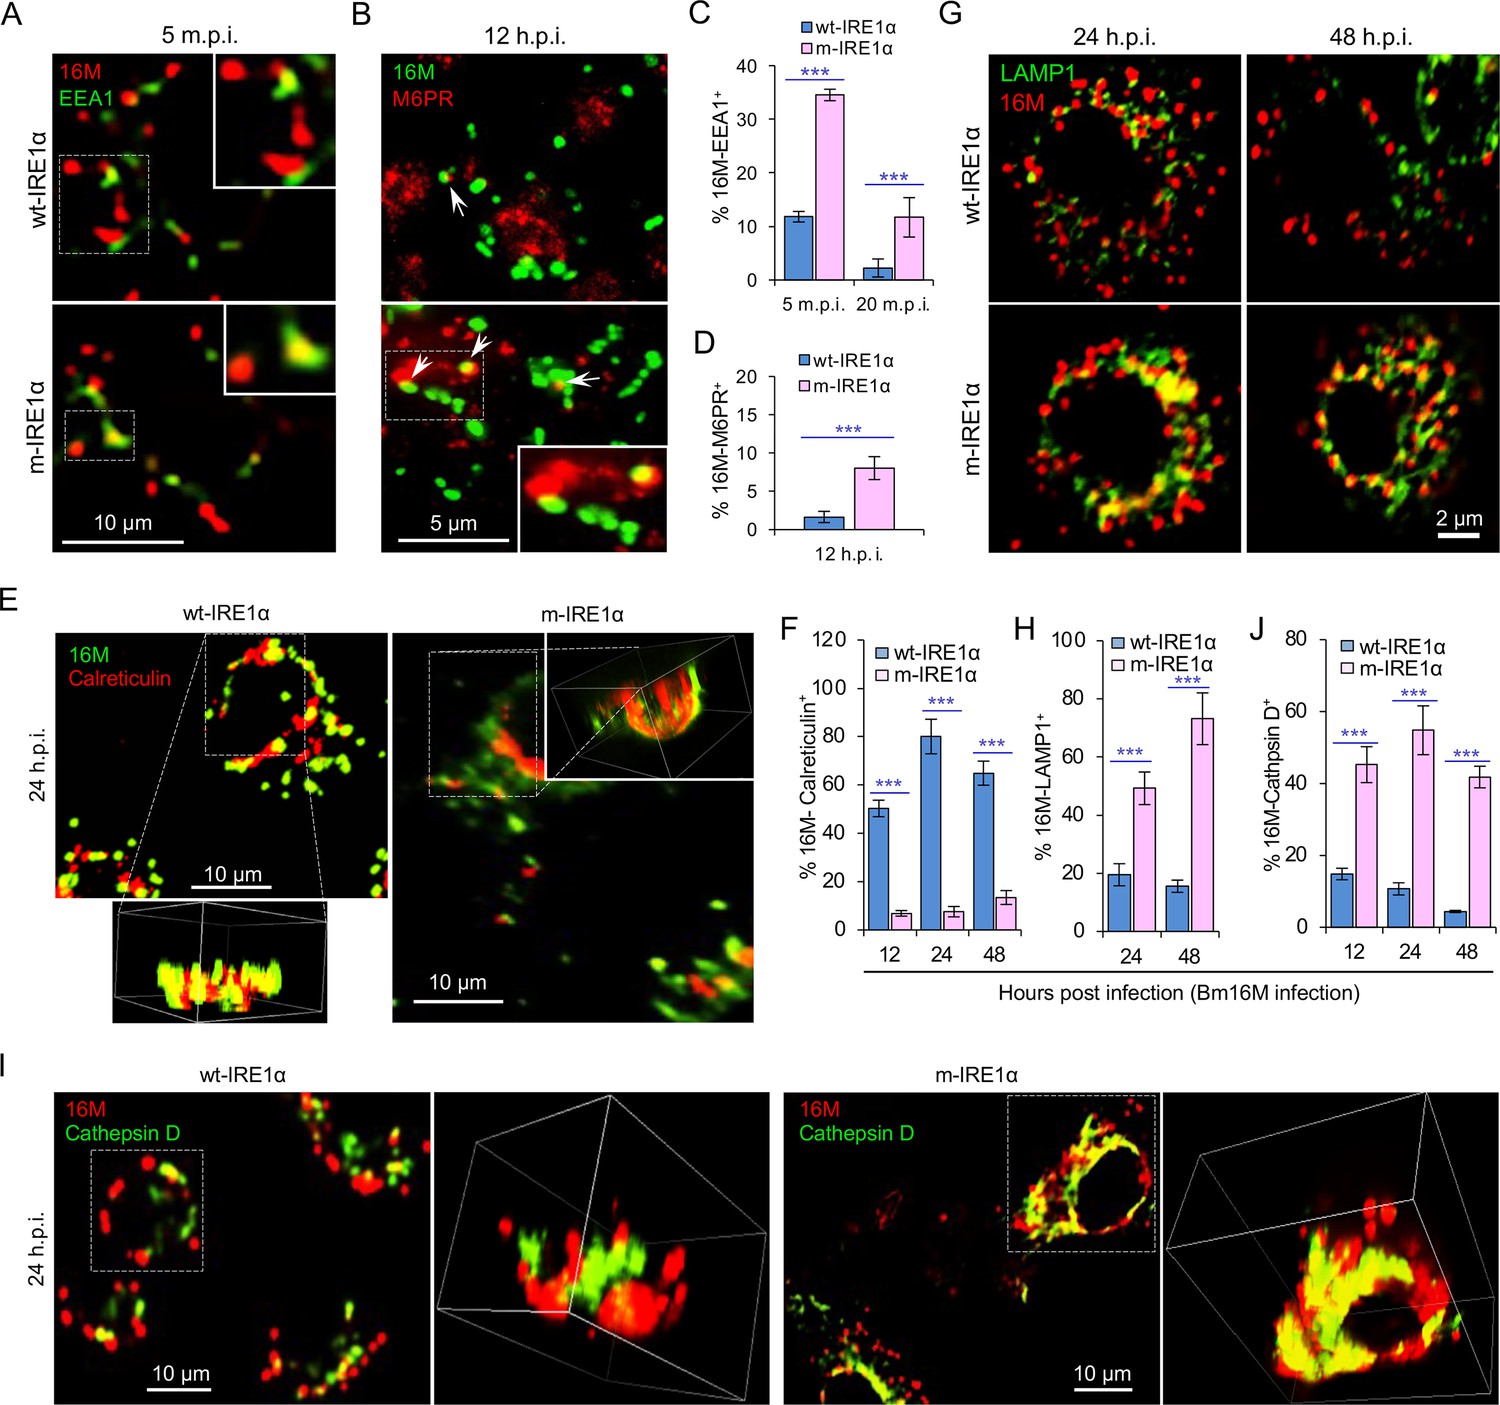
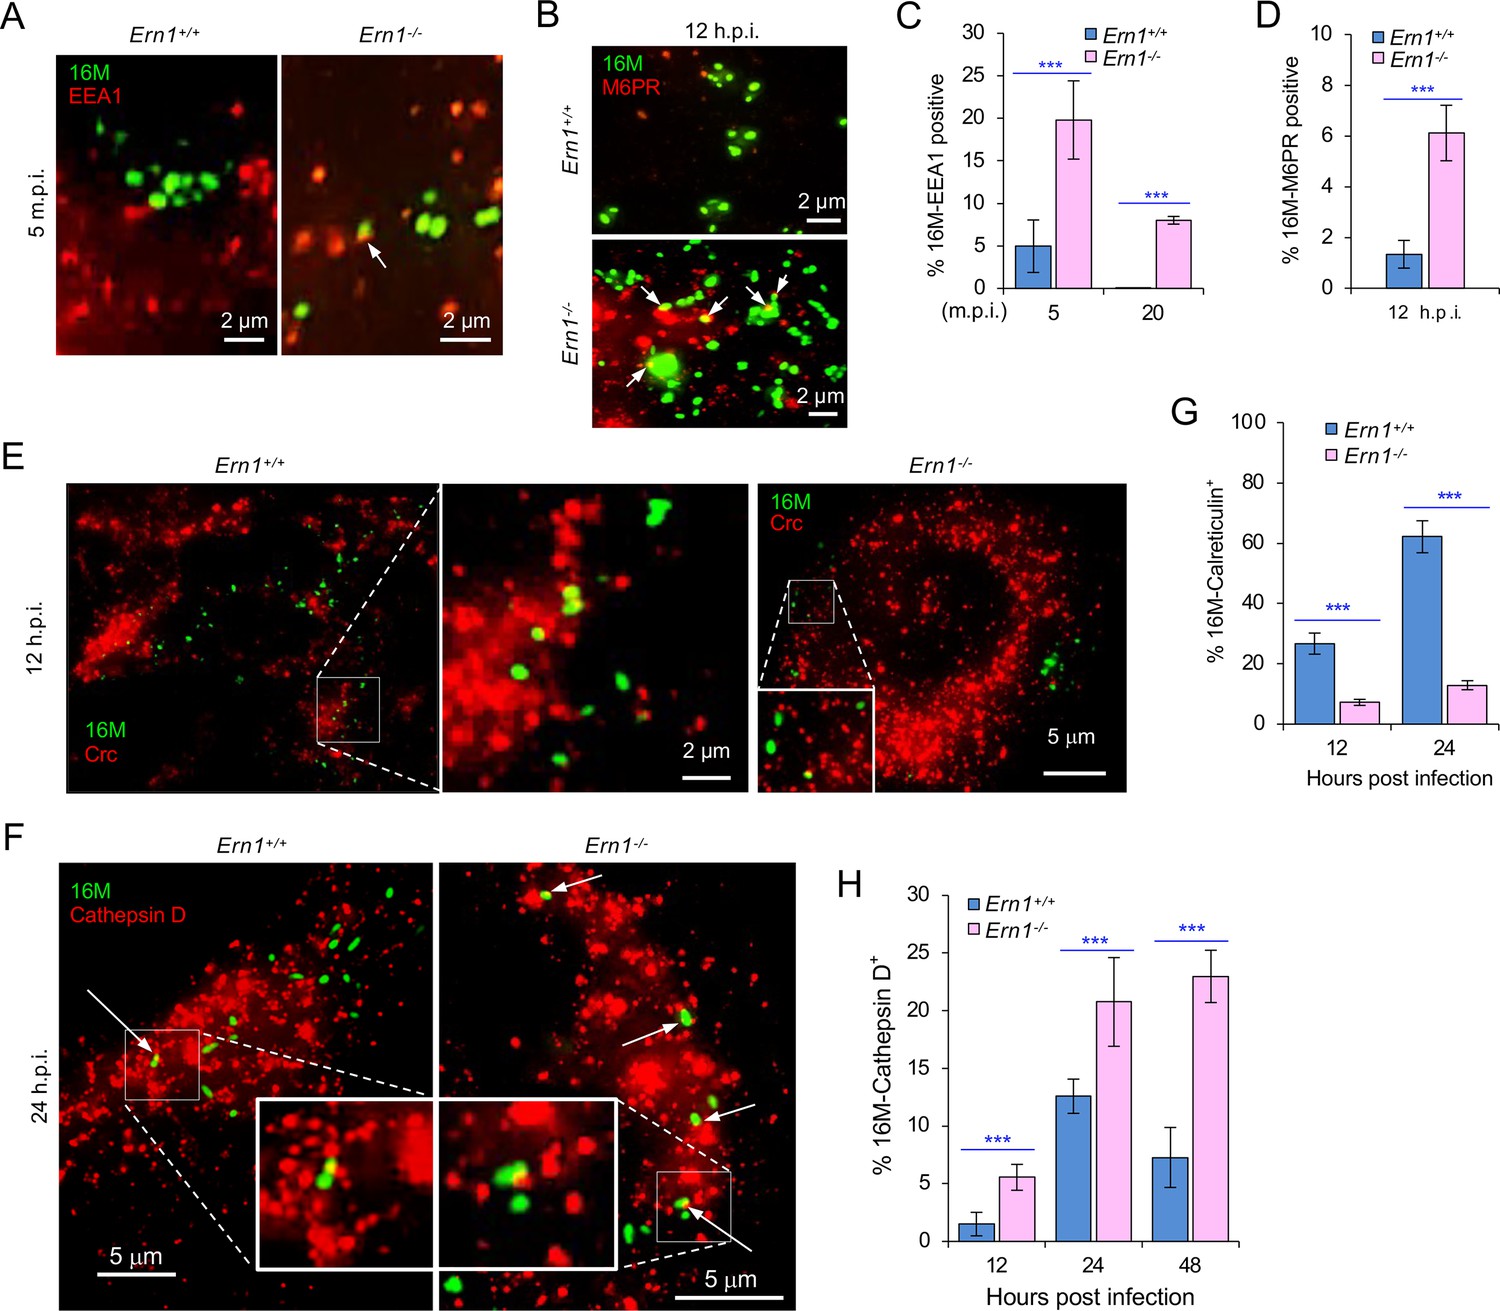
IRE1α regulates proper intracellular trafficking and replication of Brucella in a XBP1-independent fashion.
Colocalization analysis of Bm16M with host early endosomes (A) and late endosomes (B) of BMDMs from wt- and m-IRE1α mice at the indicated time points postinfection. m.p.i.: minutes post infection. EEA1: early endosomal antigen 1; M6PR: mannose-6-phosphate receptor. Arrows in panel B: M6PR+-BCVs. Quantification of Bm16M entry into early endosomes (C) or late endosomes (D) of the indicated host BMDMs at the indicated time points postinfection. Colocalization analysis of Bm16M and the ER marker calreticulin (E), and quantification of Bm16M-calreticulin+ (F) in wt- and m-IRE1α BMDMs at the indicated h.p.i. Colocalization of Bm16M and the lysosomal markers LAMP1 (G) or cathepsin D (I), and quantification of Bm16M-LAMP1+ (H) or -cathepsin D+ (J) in wt- and m-IRE1α BMDMs at the indicated h.p.i. Images are representative of three independent experiments. Statistical data express as mean ± standard error of mean (SEM) from three independent experiments. ***p < 0.001.
Figure 2—figure supplement 1
IRE1α is required for B. melitensis properly intracellular trafficking.
Colocalization analysis of Bm16M with host early endosomes (A) or late endosomes (B) of the WT and Ern1 KO MEFs at the indicated time points postinfection. EEA1: early endosomal antigen 1; M6PR: mannose-6-phosphate receptor. m.p.i.: minutes post infection. Quantitative analysis of Bm16M colocalization with host early endosomes (C) or late endosomes (D) of the indicated host MEFs at the indicated time points postinfection. Colocalization analysis of Bm16M with the host endoplasmic reticulum (ER) marker calreticulin (Crc) (E) or the lysosome marker cathepsin D (F) in WT or Ern1 KO MEFs. Quantification of colocalization of Bm16M with the ER marker calreticulin (G) and cathepsin D (H) in WT or Ern1 KO MEFs at the indicated h.p.i. Images are representative of three independent experiments. Statistical data represent the mean ± standard error of mean (SEM) from three independent experiments. ***Significance at p < 0.001.
Figure 3 with 3 supplements
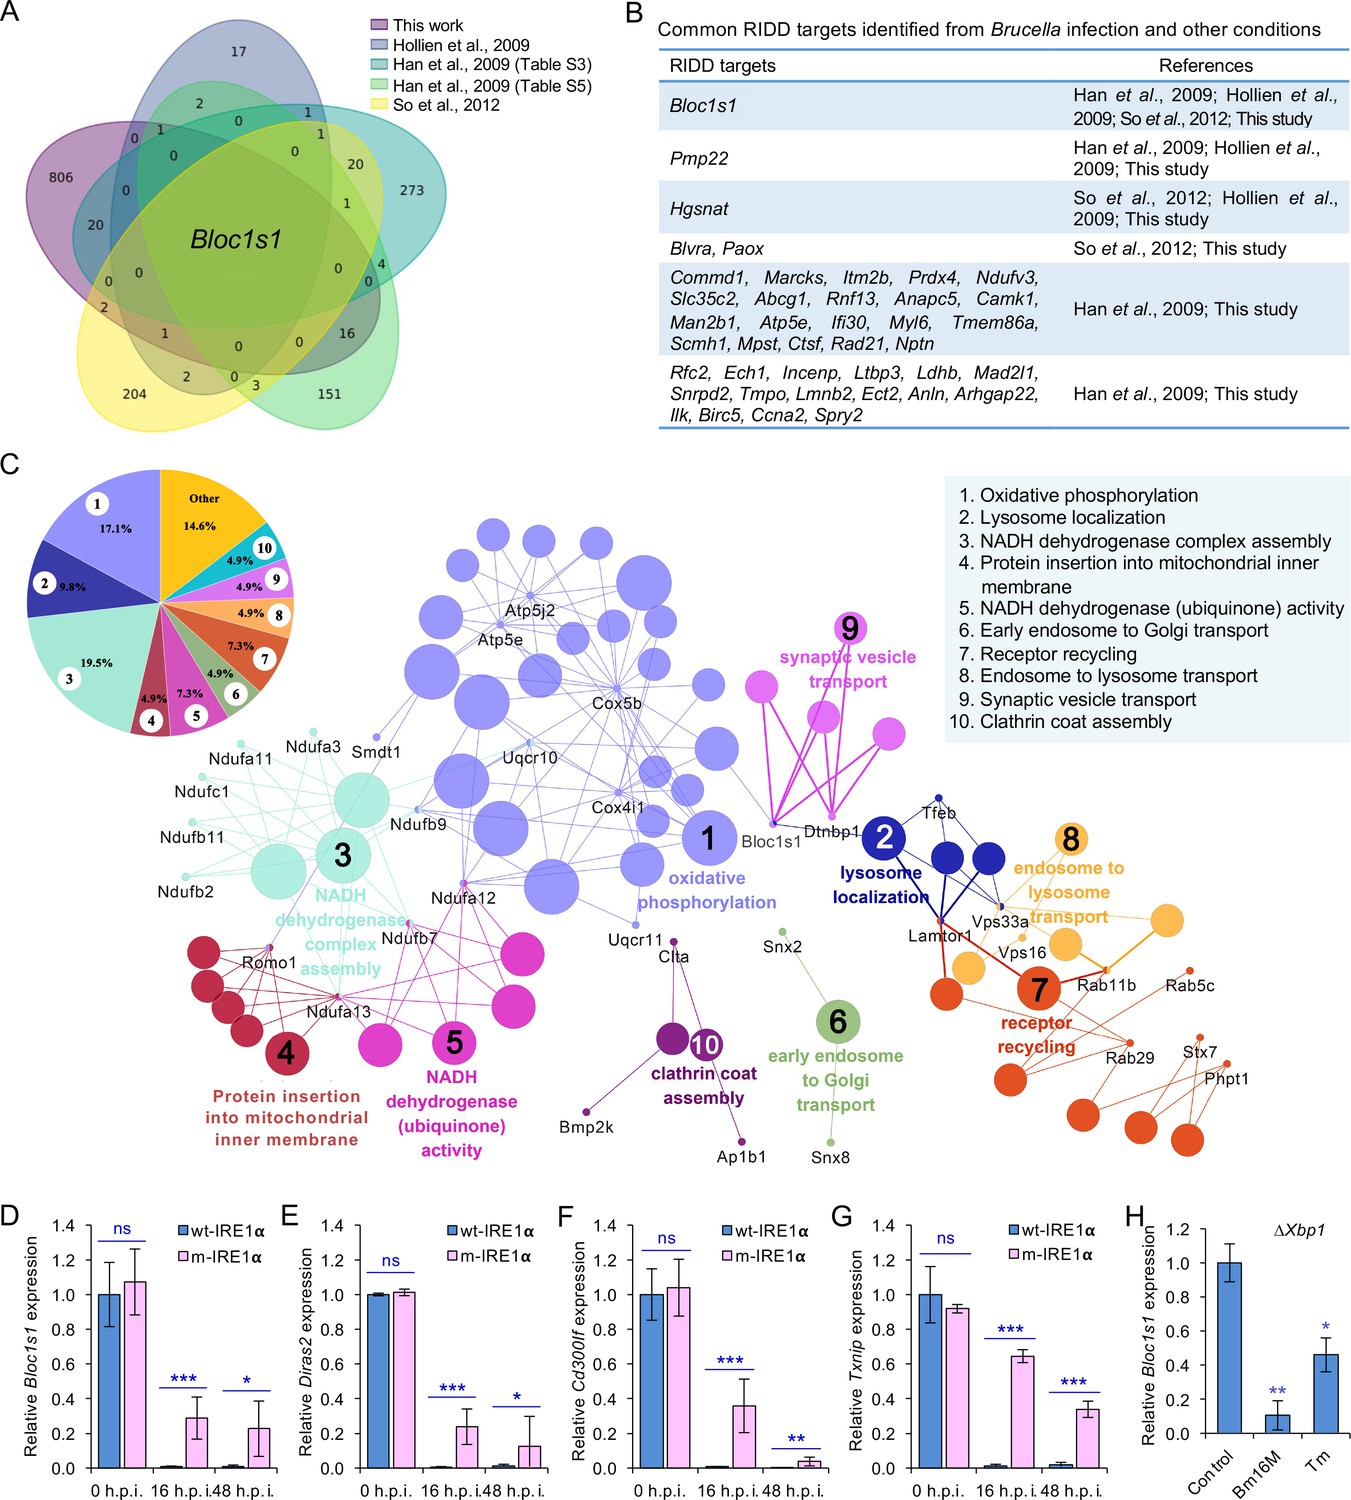
Identification of host RIDD targets during Brucella infection.
(A) Venn diagram showing numbers of candidate RIDD genes identified in the indicated datasets. (B) Common candidate RIDD genes identified in Bm16M-infected cells and other conditions in the indicated datasets. (C) Interaction network analysis of candidate RIDD genes (Bloc1s1 associated genes) identified in Brucella-infected cells and the corresponding enriched KEGG pathways. Different pathways are distinguished by different colors. Interacting genes are shown with the smallest sized of dot with gene names. The upper-left-corner panel: enriched KEGG pathways and interacting candidate RIDD genes (%). qRT-PCR validation of RIDD candidate genes Bloc1s1 (D), Diras2 (E), Cd300lf (F), and Txnip (G) identified from RNA-seq analysis. Relative mRNA expression levels in potential RIDD targets from control and m-IRE1α BMDMs infected with Bm16M at 16 and 48 h.p.i. were measured by qRT-PCR. (H) qRT-PCR analysis of expression levels of Bloc1s1 in ΔXbp1 BMDMs that were either uninfected (control), infected with Bm16M, or treated with tunicamycin (Tm, an UPR inducer, 5 μg/ml) at 4-hr post infection/treatment. Expression levels of the indicated genes were normalized to Gapdh expression. Statistical data represent the mean ± standard error of mean (SEM) from three independent experiments. *, **, and ***: significance at p < 0.05, 0.01, and 0.001, respectively.
-
Figure 3—source data 1
Candidate RIDD gene identified in host cells infected by Brucella melitensis Bm16M.
- https://cdn.elifesciences.org/articles/73625/elife-73625-fig3-data1-v1.xlsx
Figure 3—figure supplement 1
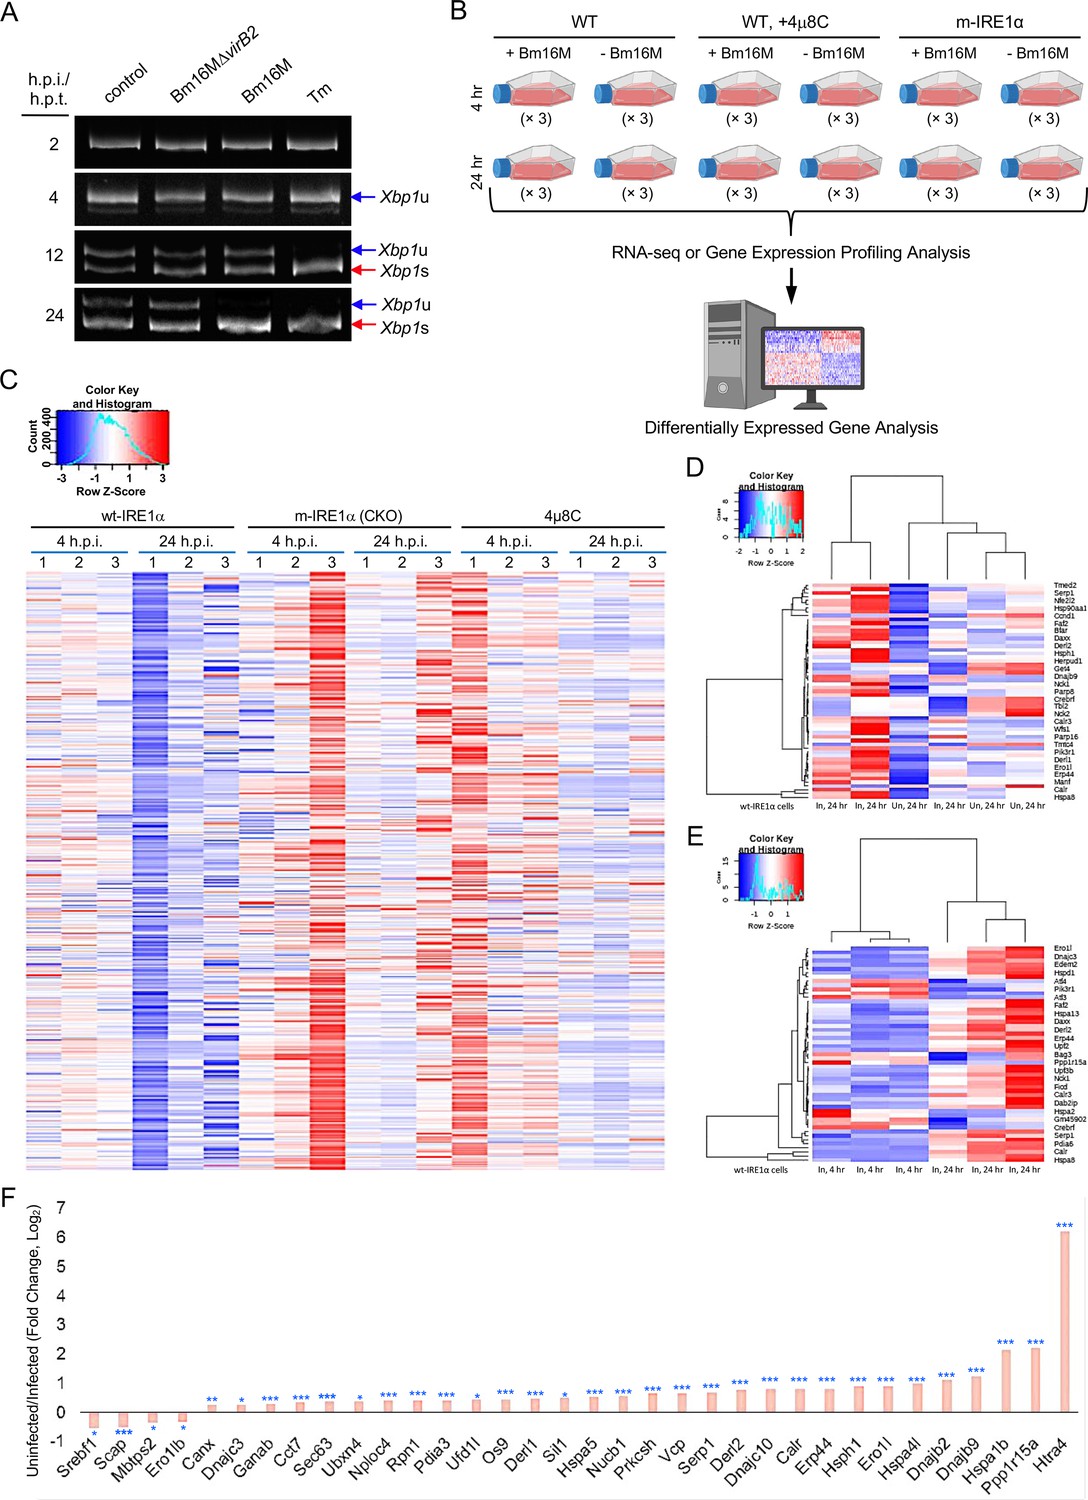
IRE1α activation is Brucella Type 4 secretion system (T4SS)-dependent and gene profiling of host cells infected by Brucella.
(A) Determination of IRE1α RNase activity in host cells via analysis of Xbp1 splicing. Murine J774.A1 macrophages were infected with Bm16M, Bm16MΔvirB2, or treated with Tm (2.5 μg/ml); at the indicated h.p.i. or treatment, the infected or drug-treated cells were harvested for Xbp1 splicing analysis. Representative images from one of three independent experiments are shown. (B) Strategy for gene profiling via RNA-seq analysis. (C) Heatmap of differentially expressed genes (DEGs) in the indicated host cells infected with Bm16M at 4 and 24 h.p.i. DEGs from triplicate samples are shown. (D) Heatmap of endoplasmic reticulum (ER)-associated DEGs in the wt-IRE1α (WT) host cells infected (In) and uninfected (Un) with Bm16M at 24 h.p.i. (upper panel) or at 4 and 24 h.p.i. (lower panel). (E) Fold changes of representative DEGs.
Figure 3—figure supplement 2
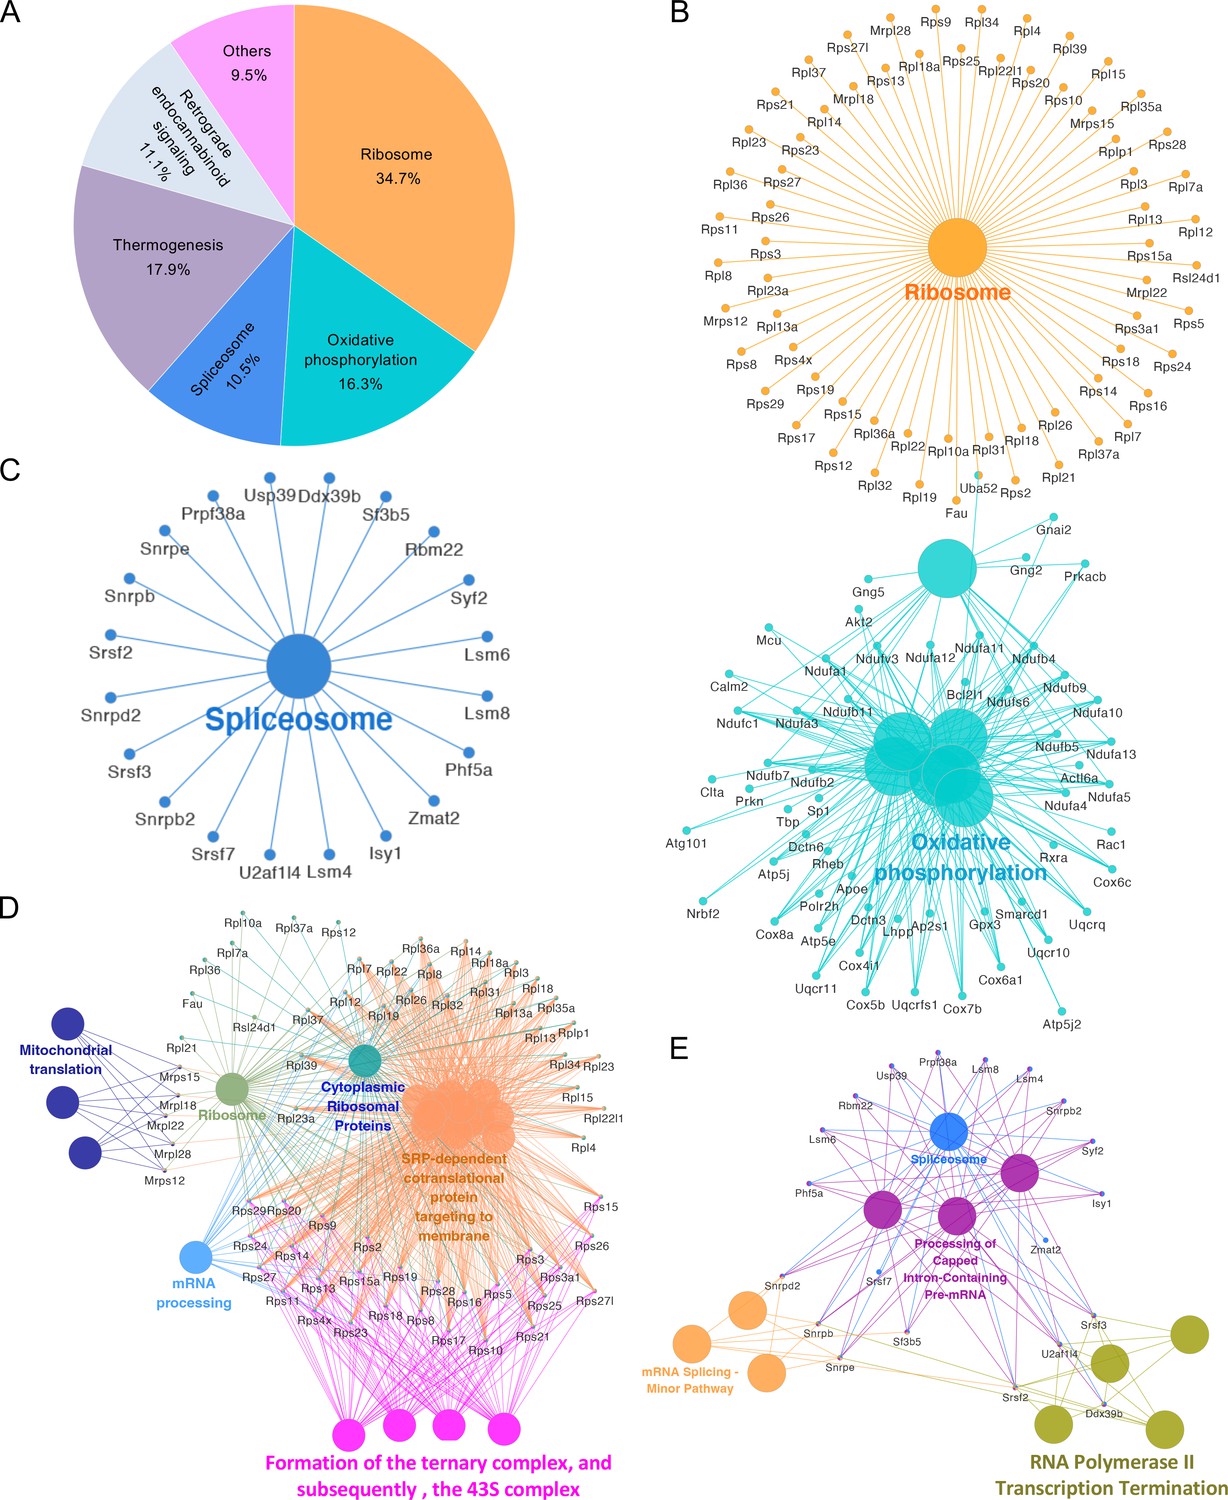
KEGG pathway network analysis of the candidate RIDD genes identified via RNA-seq analysis from host cells infected or uninfected with Bm16M and/or treated or untreated with 4μ8C at 4 and/or 24 h.p.i.
The functionally grouped network was visualized using Cytoscape (https://cytoscape.org/) based on the degree of connectivity (node size) between the KEGG pathways and RIDD genes (p < 0.05, nodes). Different KEGG pathways are distinguished by different colors. (A) The identified 847 candidate RIDD genes are mainly enriched in the KEGG pathways of ribosome (cellular component organization and biogenesis), spliceosome (RNA metabolism), oxidative phosphorylation, thermogenesis, and retrograde endocannabinoid signaling, etc., in which, a total of 142 RIDD candidate gene were enriched. Interaction networks of candidate RIDD genes enriched in the KEGG pathways of ribosome and oxidative phosphorylation (B), and spliceosome (C). KEGG pathway network analysis of the identified candidate RIDD genes (p < 0.05) involved in ribosome biogenesis and ribosomal RNA processing (D) or spliceosome associated factors (E).
Figure 3—figure supplement 3
Validation of RIDD target genes.
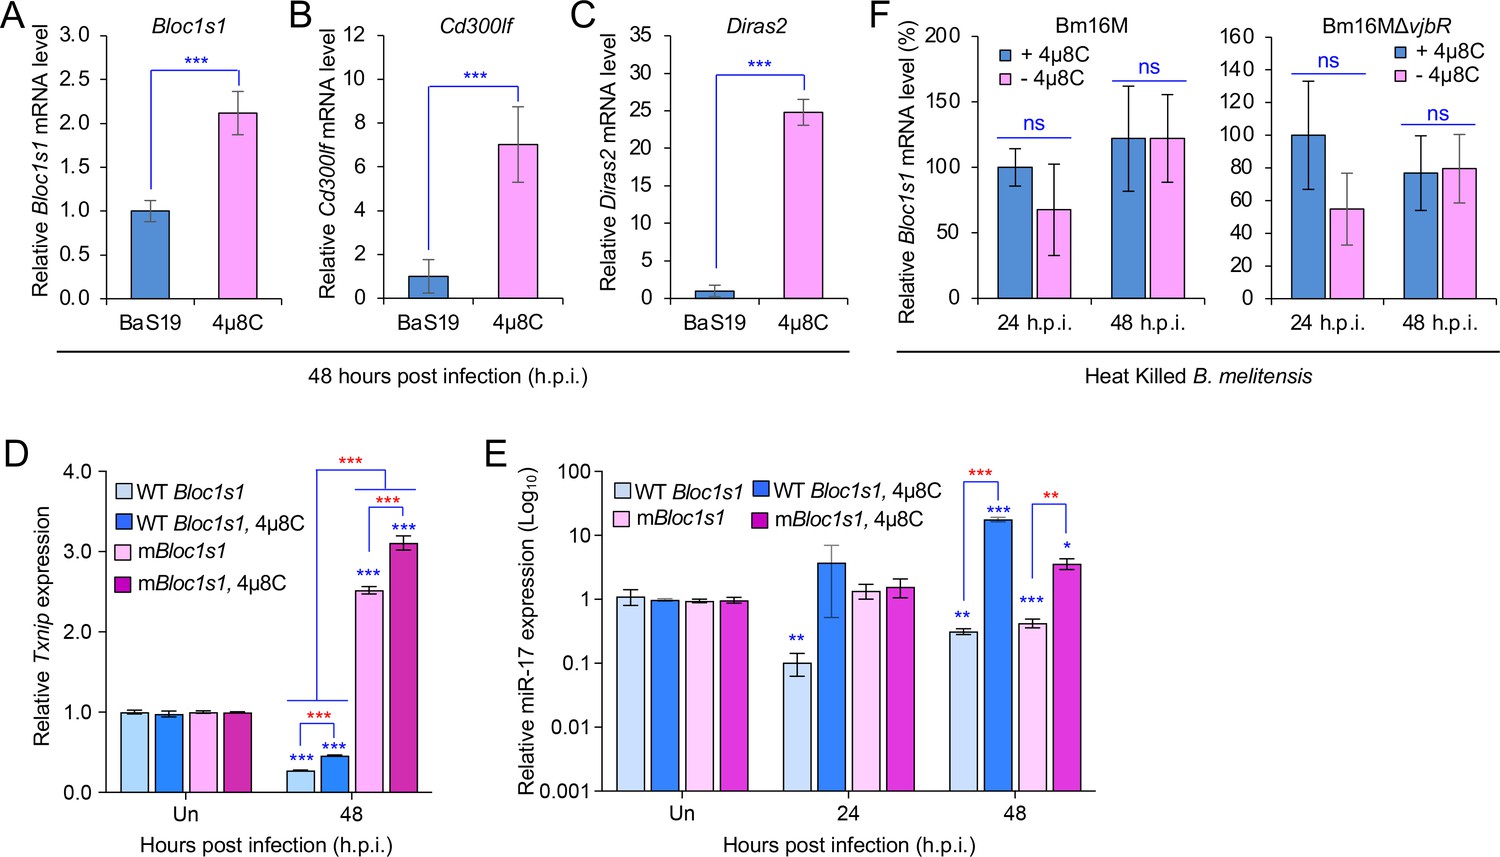
Real-time reverse transcription-PCR (qRT-PCR) assay for the expression levels of RIDD target genes Bloc1s1 (A), CD3300lf (B), Diras2 (C), and Txnip (D) in host cells infected with B. abortus strains S19 (BaS19) (A–C) or BaS2308 (D). Relative mRNA expression levels of the potential RIDD targets in RAW264.7 cells pretreated with 4μ8C (50 μM) or treated with tunicamycin (5 μg/ml) 1 hr before and during infection with the indicated Brucella strains. Gene expression was normalized to Gapdh. Un: uninfected cells. For information of WT Bloc1s1 and mBloc1s1 cells, please see the following Figure 4—figure supplement 1. (E) Relative microRNA miR-17-5p expression in the indicated cells untreated or treated with 4μ8C and infected with BaS2308. (F) The expression levels of Bloc1s1 in host cells treated with heat-killed B. melitensis (strains Bm16M or Bm16M∆Vjbr) determined by qRT-PCR. Data represent the means ± standard error of mean (SEM) from at least three independent experiments. *, **, and ***: significance at p < 0.05, 0.01, and 0.001, respectively.
Figure 4 with 3 supplements
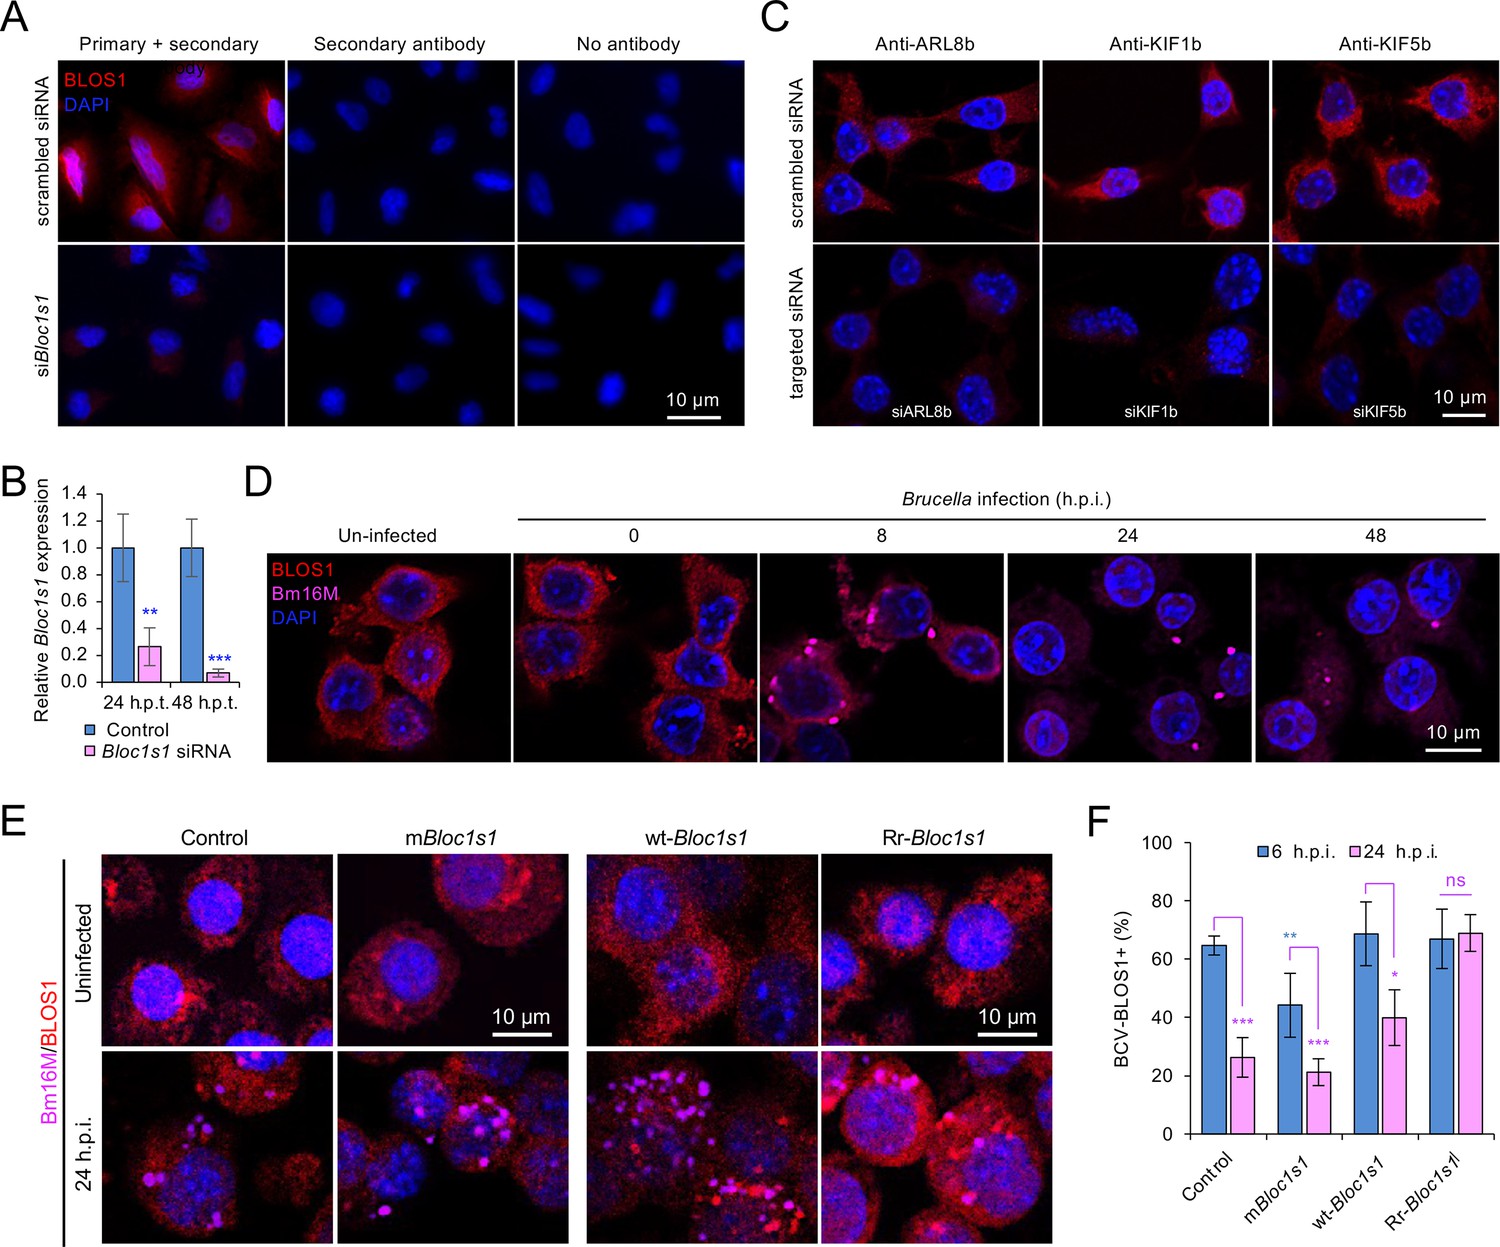
BLOS1 confers host cell susceptibility to Brucella infection and controls Brucella intracellular trafficking.
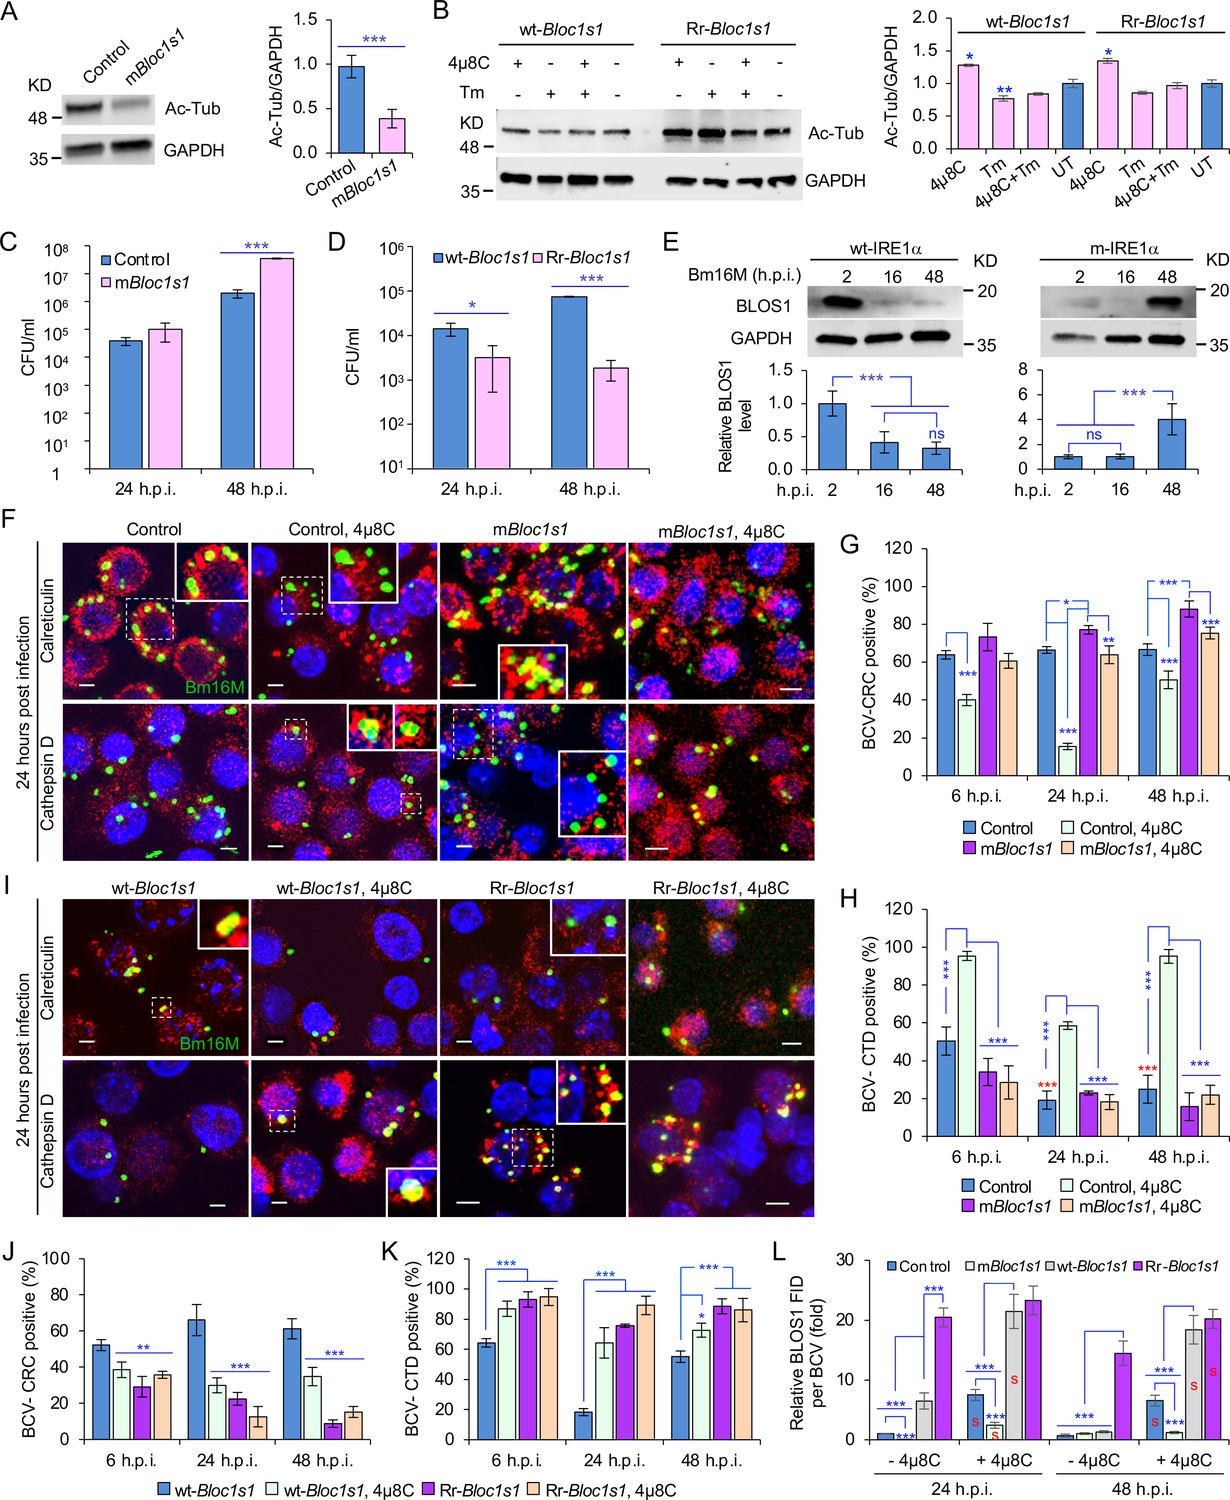
(A) Western blot analysis of α-tubulin acetylation (left) and quantification of α-tubulin acetylation level (right) in control containing Cas9 and a nonspecific gRNA and the nonfunctional Bloc1s1 mutant (mBloc1s1) in RAW 264.7 Cas9 cells. Ac-Tub: anti-acetylated antibody. (B) Western blot analysis of α-tubulin acetylation (left) and quantification of α-tubulin acetylation levels (right) in control (wt-Bloc1s1, overexpressing WT Bloc1s1) cells and cells that express the RIDD-resistant Bloc1s1 variant (Rr-Bloc1s1) treated or untreated with 4μ8C (50 μM), Tm (5 μg/ml), or both for 4 hr. CFU assays for Bm16M infection of RAW264.7 cells in which Bloc1s1 is nonfunctional (C), RIDD resistant (D) at the indicated h.p.i. (E) BLOS1 degradation assay during Brucella infection (upper panel) and quantification of the relative BLOS1 expression level (compared to the level of the loading control GAPDH) (lower panel) at the indicated h.p.i. ns: no significance. Colocalization of BCV with calreticulin (CRC) or cathepsin D (CTD) (F) and quantification of BCV-CRC+ (G) or BCV-CTD+ (H) in control and mBloc1s1 cells treated with or without 4μ8C (50 μM) at the indicated h.p.i. Red asterisks: significance (p < 0.001) compared to control cells at 6 h.p.i. Colocalization of BCV with CRC or CTD (I) and quantification of BCV-CRC+ (J) or BCV-CTD+ (K) in the wt-Bloc1s1 and Rr-Bloc1s1 cells treated with or without 4μ8C (50 μM) at the indicated h.p.i. (L) Quantification of BLOS1 fluorescence integrated density (FID) per BCV in the mBloc1s1, Rr-Bloc1s1, or their corresponding control cells treated with or without 4μ8C (50 μM) at the indicated h.p.i. S: significance (p < 0.01) compared to that without 4μ8C treatment. Host cells were infected with or without Bm16M, and at the indicated h.p.i., the cells were harvested for immunoblotting assays or fixed and subjected to confocal immunofluorescence assays. Blots/images are representative of three independent experiments. Statistical data represent the mean ± standard error of mean (SEM) from three independent experiment. *p < 0.05; **p < 0.01; ***p < 0.001.
Figure 4—figure supplement 1
Generation of nonfunctional and overexpression Bloc1s1 variants.
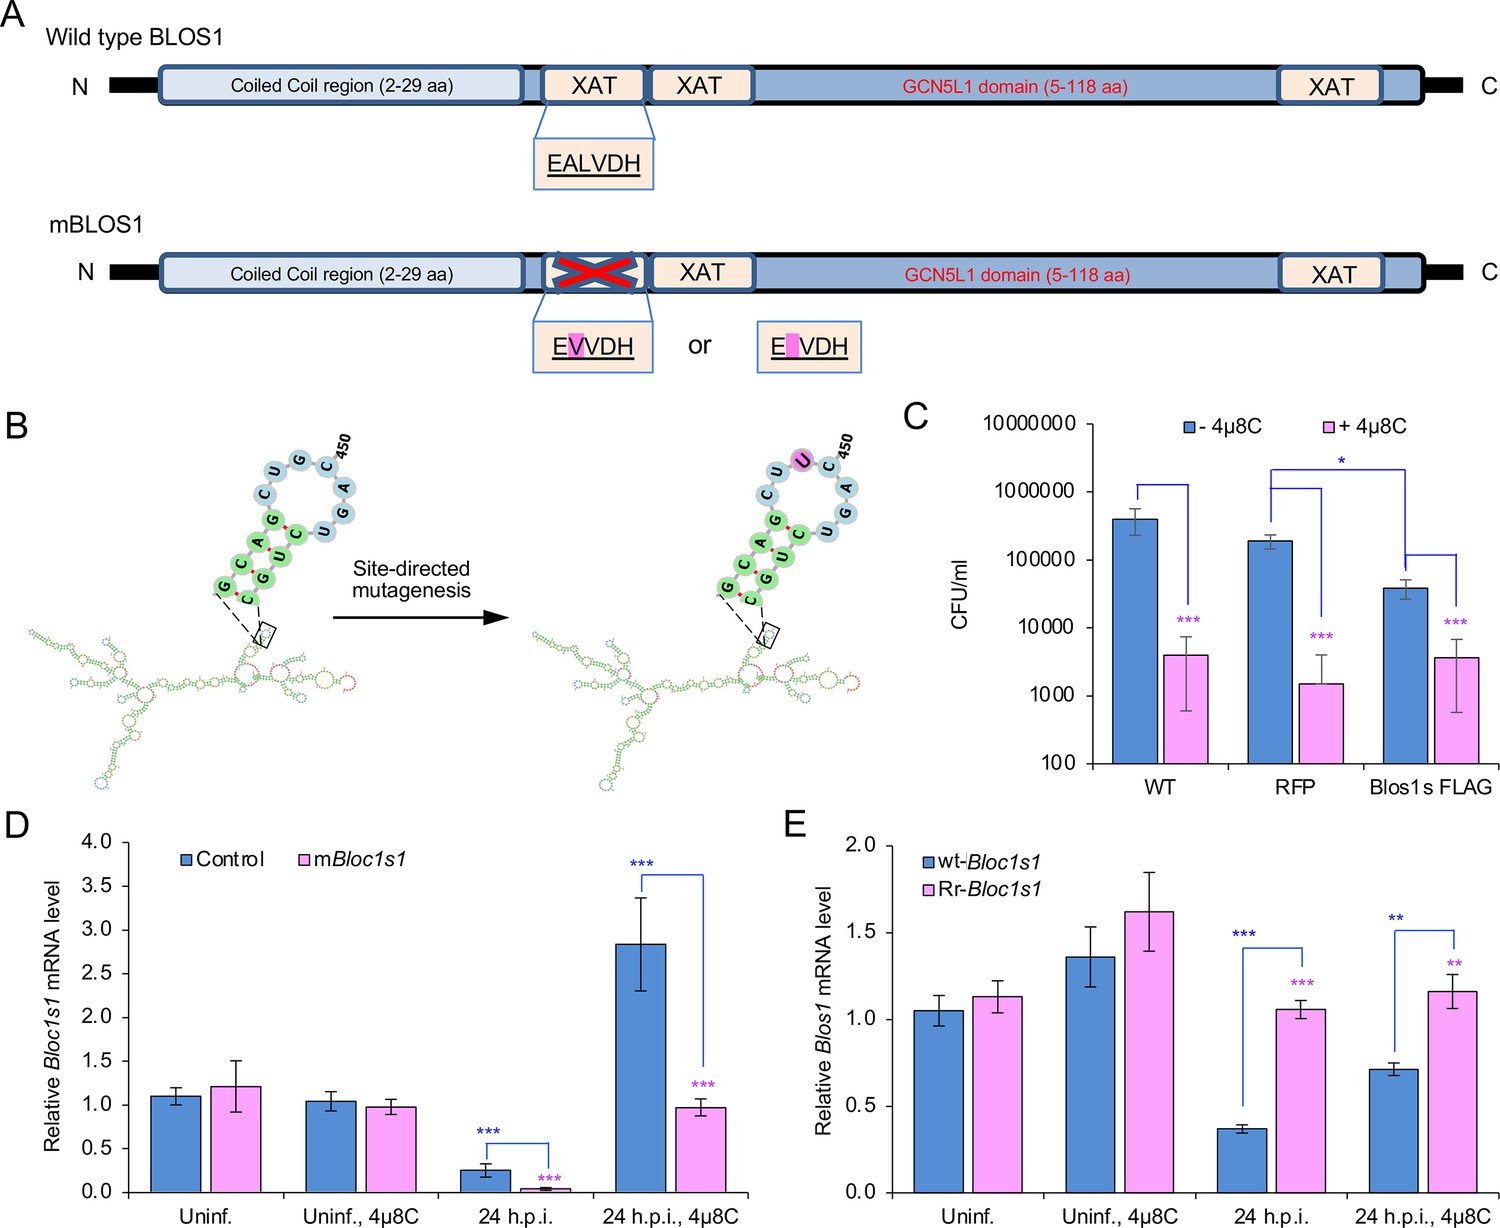
Strategies for generation of nonfunctional Bloc1s1 (mBloc1s1) (A) or RIDD-resistant Bloc1s1 (Rr-Bloc1s1) (B) constructs that are used to generate mBloc1s1 or Rr-Bloc1s1 mutant cells. (C) CFU analysis of Bm16M infection of the murine osteoblastic MC3T3-E1 wild-type (WT), MC3T3-E1-derived RFP-tagged WT (RFP-tagged WT), or RIDD-resistant Blos1(Blos1s) overexpression (Blos1s-FLAG) cell lines (Bae et al., 2019) (gift from the Hollien lab, and used as controls to compare the effect of the Rr-Bloc1s1 cells on Brucella intracellular replication). The indicated cell lines were pretreated with either 1× phosphate buffered saline (PBS) or 4μ8C (50 μM) 1 hr before infection. The pretreated cells were then infected with Bm16M and subjected to gentamicin protection analysis. At 48 h.p.i, the intracellular CFUs were determined. Bloc1s1 mRNA expression assays for the mBloc1s1 (D) or Rr-Bloc1s1 (E) and control cells infected with or without BaS2308 and treated with or without 4μ8C at the indicated h.p.i. via qRT-PCR. Blue asterisks: compared to the uninfected control without 4μ8C. Uninf.: uninfected cells. Data represent the means ± standard error of mean (SEM) from three independent experiments. *, **, and ***: significance at p < 0.05, 0.01, and 0.001, respectively.
Figure 4—figure supplement 2
Cells with BLOS1 deficiency or RIDD resistance differently control lysosome intracellular trafficking.
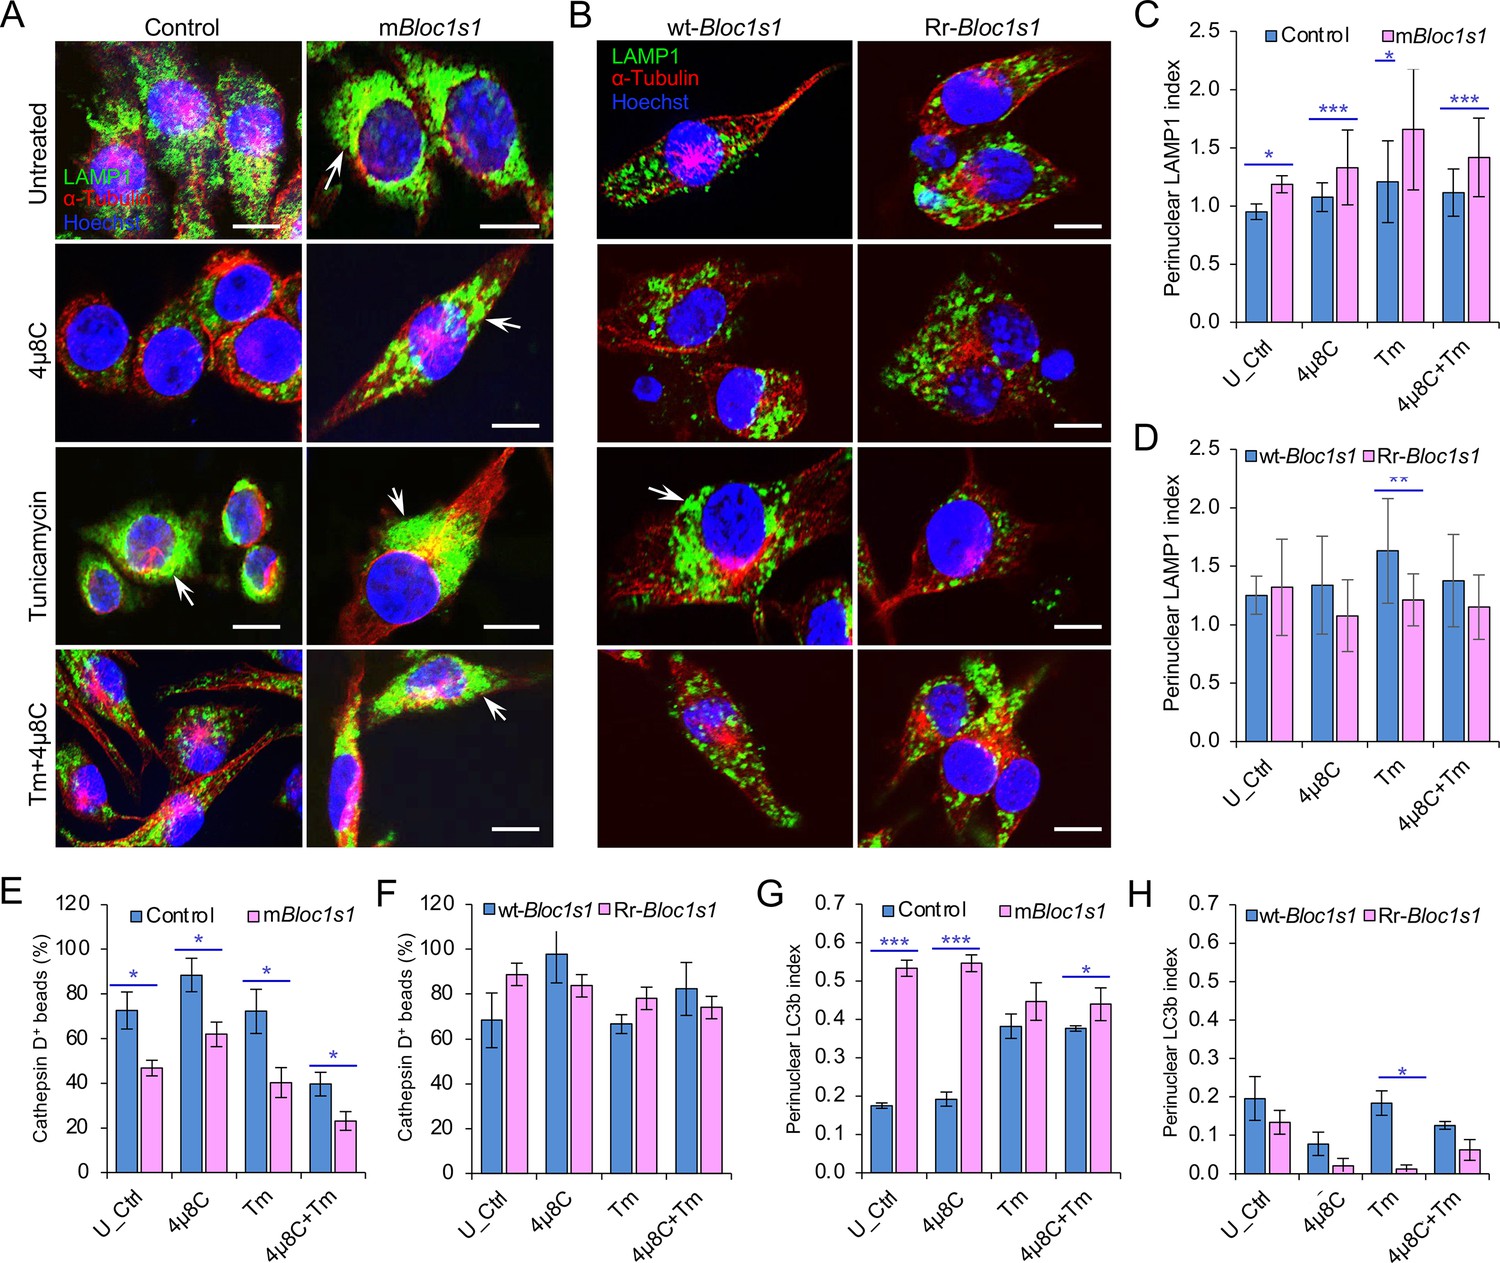
Host cells were treated with or without the indicated drugs and at 4 hr post treatment, drug-treated or untreated host cells were fixed and subjected to confocal immunofluorescence assays. Late endosome/lysosome (LE/Lys) trafficking in mBloc1s1 (A) or Rr-Bloc1s1 (B) and control cells in the presence of ER stress inducer tunicamycin (Tm) or IRE1α RNase inhibitor 4μ8C. The indicated cell lines were incubated with Tm, 4μ8C, or Tm + 4μ8C for 4 hr, the cells were then fixed and subjected to confocal immunofluorescence microcopy assay analysis. Bar: 10 μm. Quantification of LE/Lys retrograde trafficking in the mBloc1s1 (C) or Rr-Bloc1s1 (D) cells treated with Tm, 4μ8C, or Tm + 4μ8C at 4 hr. U_Ctrl: untreated control. Quantification of colocalization of latex beads with Cathepsin D in mBloc1s1 (E) or Rr-Bloc1s1 (F) cells treated with Tm, 4μ8C, or Tm +4μ8C for 4 hr. Quantification of autophagic flux (using LC3b as a marker) in mBloc1s1 (G) or Rr-Bloc1s1 (H) cells treated with Tm, 4μ8C, or Tm + 4μ8C for 4 hr. Images are representative of three independent experiments. Statistical data represent the mean ± standard error of mean (SEM) from three independent experiments. *p < 0.05; **p < 0.01; ***p < 0.001.
Figure 4—figure supplement 3
Host endogenous BLOS1 and the associated proteins are specifically recognized by the indicated homemade or commercial antibodies and differential interactions of Brucella and host BLOS1 during infection.
(A) siRNA-mediated depletion of host (A549 cells) endogenous BLOS1 reduces immunofluorescence intensity detected by the homemade chicken antihuman/mouse BLOS1 antibody. (B) qRT-PCR analysis of expression levels of Bloc1s1 in the indicated siRNA transfected A549 cells at 24 or 48 h.p.t. Expression levels of Bloc1s1 gene was normalized to Gapdh expression. (C) siRNA-mediated depletion of host (RAW264.7 macrophages) endogenous ARL8b, KIF1b, or KIF5b reduces immunofluorescence intensity detected by the corresponding antibodies. (D) Brucella infection indues host BLOS1 degradation. The wild-type RAW264.7 macrophages were infected with B. abortus BaS19 at an MOI of 50, at the indicated hours post infection (h.p.i.), the control and infected cells were fixed and performed immunofluorescence microscopy assay using antibodies as mentioned above. (E) Colocalization of BCVs and host BLOS1 in Bm16M uninfected or infected RAW264.7 cells at 24 h.p.i. (F) Quantification of BCV-BLOS1+ in Bm16M-infected mBloc1s1 or Rr-Bloc1s1and control cells at 6 and 24 h.p.i. Blue asterisks: compared to the control. Images are representative of three independent experiments. Statistical data represent the mean ± standard error of mean (SEM) from three independent experiments. *p < 0.05; **p < 0.01; ***p < 0.001.
Figure 5 with 1 supplement
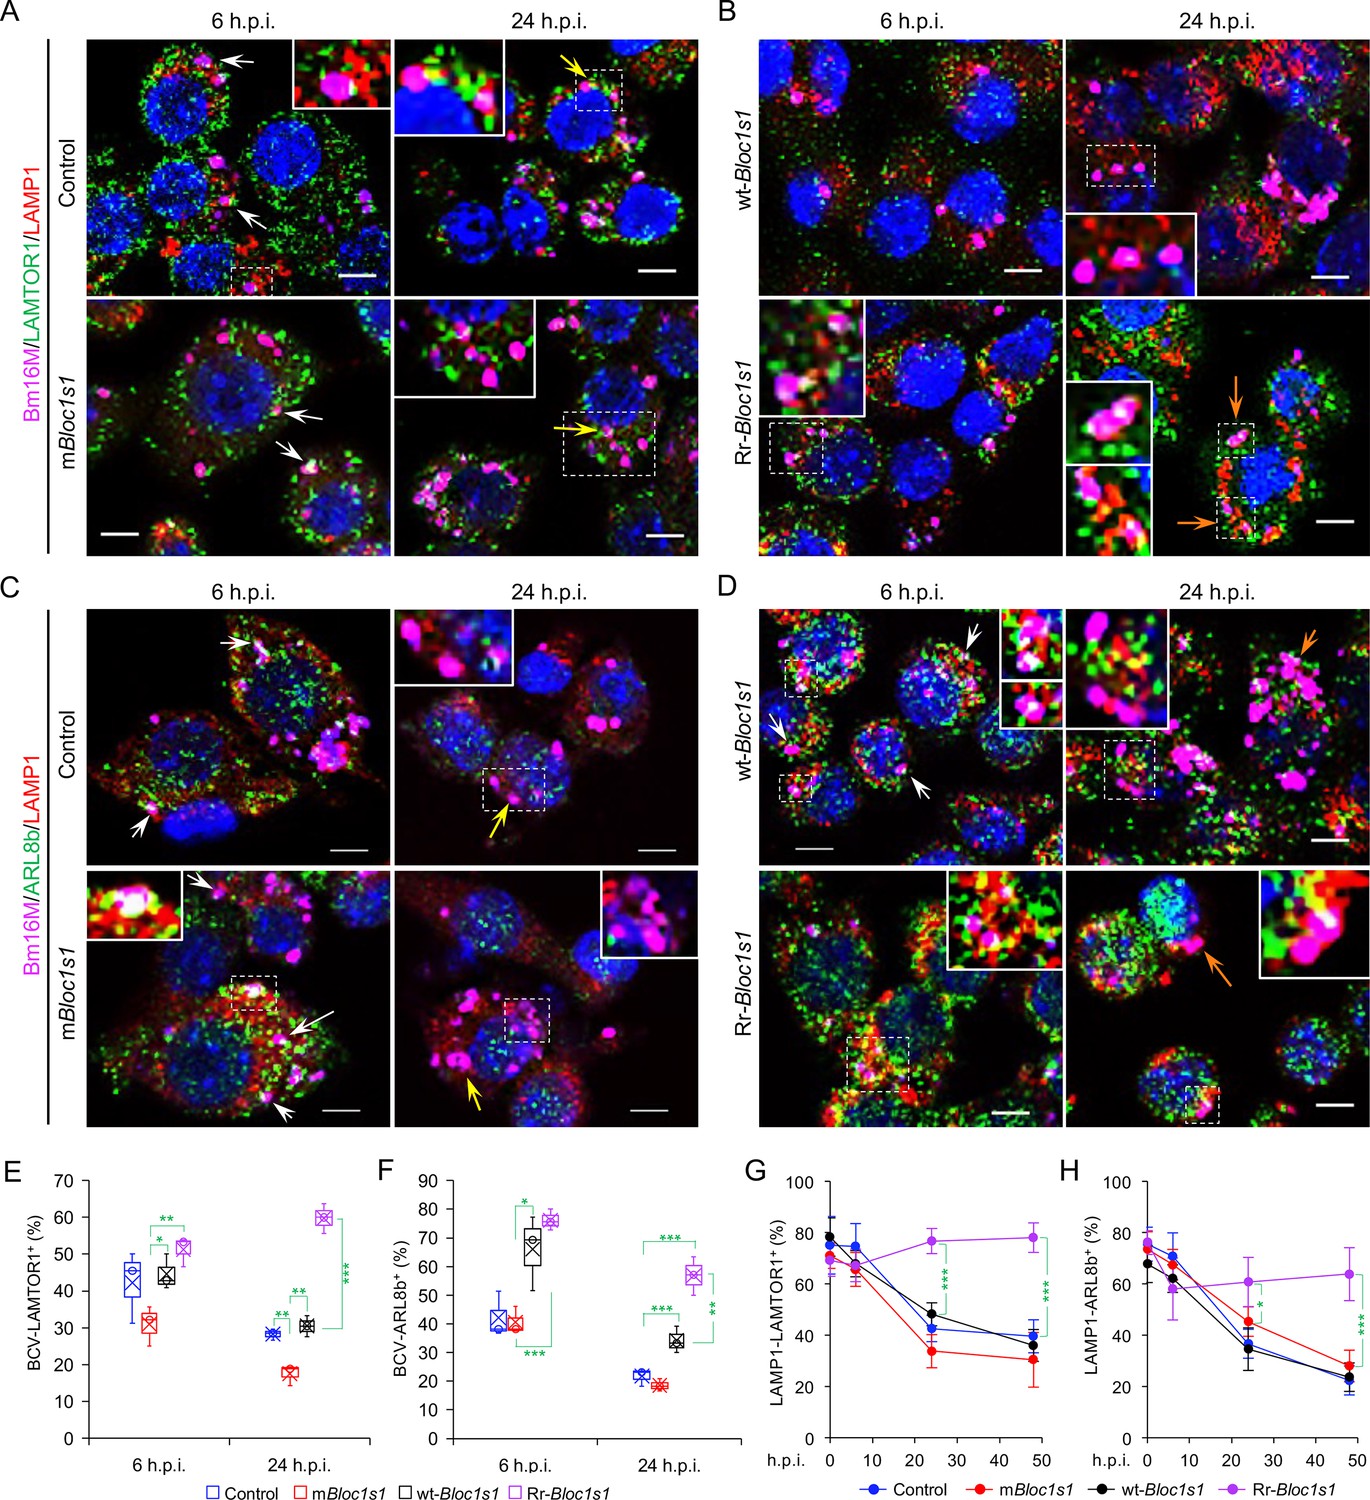
Brucella infection dissociates host BORC-related lysosome trafficking factor LAMTOR1 and ARL8b from lysosomes.
Colocalization of LAMTOR1 with BCVs or LAMP1 in the infected control and mBloc1s1 (A), or in wt-Bloc1s1 and Rr-Bloc1s1 (B) cells at the indicated h.p.i. Colocalization of ARL8b with BCVs or LAMP1 in the infected control and mBloc1s1 (C), or in wt-Bloc1s1 and Rr-Bloc1s1 (D) cells at the indicated h.p.i. White arrows: colocalization of BCVs with the indicated proteins. Insets: magnification of the selected areas (within windows with dash white lines). Yellow and orange arrows: the perinuclear and peripheral accumulation of BCVs-Lamp1, respectively. Bar: 5 μm. Quantification of BCV-LAMTOR1+ (E) and BCV-ARL8b+ (F) in Bm16M-infected cells at the indicated h.p.i. showing in A, B and C, D, respectively. (G, H) Dynamics of LAMP1-LAMTOR1+ (E) or LAMP1-ARL8b+ (H) in a time course (48 hr) of Bm16M infection at the indicated h.p.i. Host cells were infected with or without Bm16M, and at the indicated h.p.i., the cells were fixed and performed confocal immunofluorescence assays. Images are representative of three independent experiments. Statistical data expressed as mean ± standard error of mean (SEM) from three independent experiments. *p < 0.05; **p < 0.01; ***p < 0.001.
Figure 5—figure supplement 1
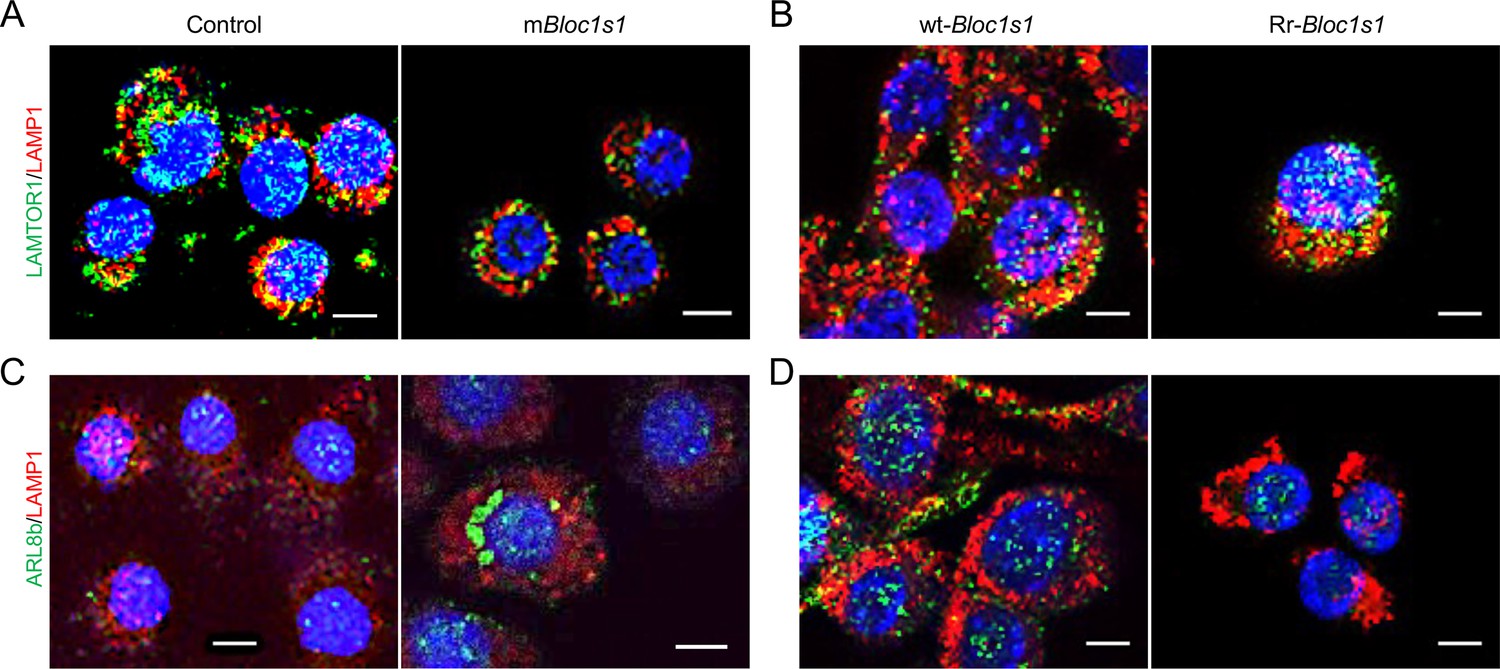
Association of the indicated BORC-related lysosome trafficking components in the indicated uninfected host cells.
The indicated nonfunctional Bloc1s1 (mBloc1s1) or RIDD-resistant Bloc1s1 (Rr-Bloc1s1) and control cell lines were overnight cultured, the cells were fixed and subjected to confocal immunofluorescence assay with the indicated antibodies. Colocalization of cell LAMP1 and LAMTOR1 in uninfected control and mBloc1s1 cells (A) or wt-Bloc1s1 and Rr-Bloc1s1 cells (B) after overnight culture. Colocalization of cell LAMP1 and ARL8b in uninfected control and mBloc1s1 cells (C) or wt-Bloc1s1 and Rr-Bloc1s1 cells (D) after overnight culture. Images are representative of three independent experiments.
Figure 6 with 1 supplement

Brucella infection dissociates BORC-related lysosome trafficking factor KIF1b but recruits KIF5b.
Colocalization of KIF1b with BCVs or LAMP1 in the infected control and mBloc1s1 (A), or in wt-Bloc1s1 and Rr-Bloc1s1 (B) cells at the indicated h.p.i. Colocalization of KIF5b with BCVs or LAMP1 in the infected control and mBloc1s1 (C), or in wt-Bloc1s1 and Rr-Bloc1s1 (D) cells at the indicated h.p.i. White arrows: colocalization of BCVs with the indicated proteins. Insets: magnification of the selected areas (within windows with dash white lines). Yellow and orange arrows: the perinuclear and peripheral accumulation of BCVs-Lamp1, respectively. Bar: 5 μm. Quantification of BCV-KIF1b+ (E) and BCV-KIF5b+ (F) in Bm16M-infected cells at the indicated h.p.i. showing in A, B and C, D, respectively. Dynamics of LAMP1-KIF1b+ (G) or LAMP1-KIF5b+ (H) in a time course (48 hr) of Bm16M infection at the indicated h.p.i. Host cells were infected with or without Bm16M, and at the indicated h.p.i., the cells were fixed and subjected to confocal immunofluorescence assays. Images are representative of three independent experiments. Statistical data represent means ± standard error of mean (SEM) from three independent experiments. *p < 0.05; **p < 0.01; ***p < 0.001.
Figure 6—figure supplement 1
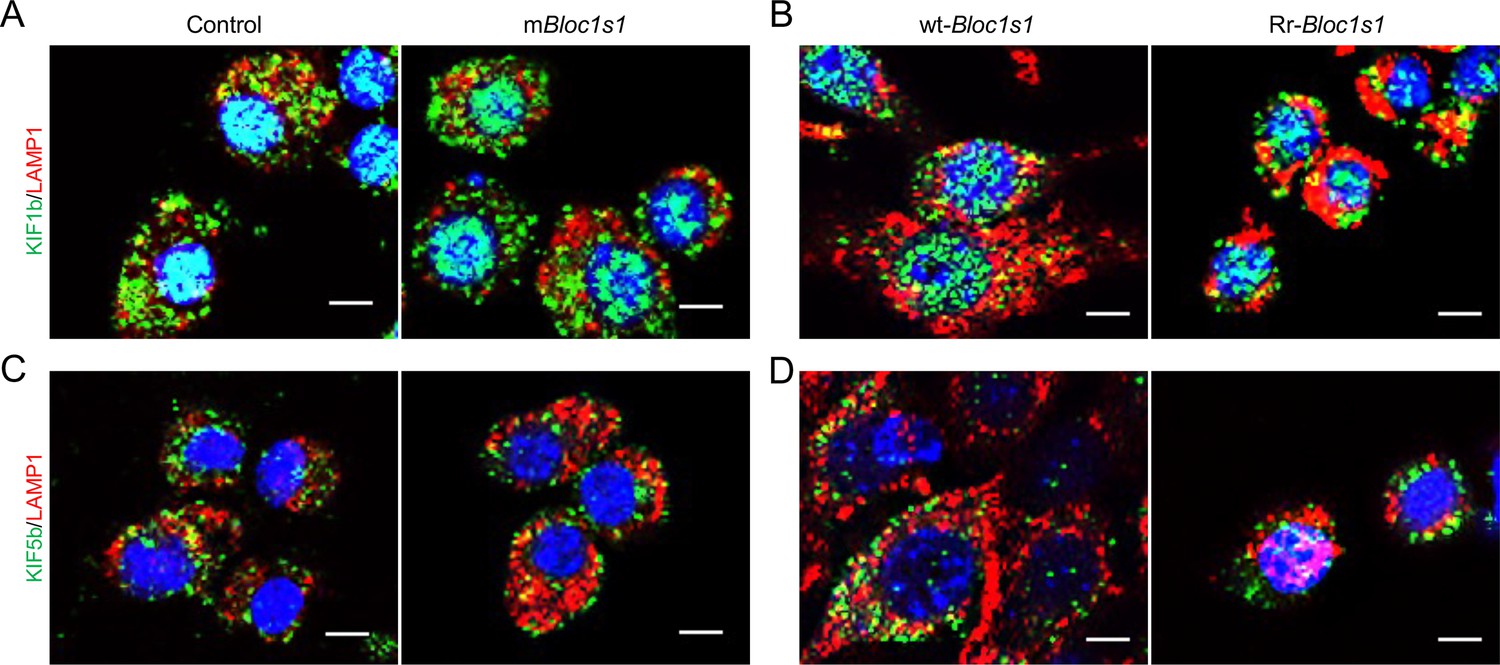
Association of the BORC-related lysosome trafficking components KIF1b, KIF5b, and LAMP1 in the indicated uninfected host cells.
Colocalization of cell LAMP1 and KIF1b in uninfected control and mBloc1s1 cells (A) or wt-Bloc1s1 and Rr-Bloc1s1 cells (B) after overnight culture. Colocalization of cell LAMP1 and KIF5b in uninfected control and mBloc1s1 cells (C) or wt-Bloc1s1 and Rr-Bloc1s1 cells (D) after overnight culture. Images are representative of three independent experiments.
Figure 7
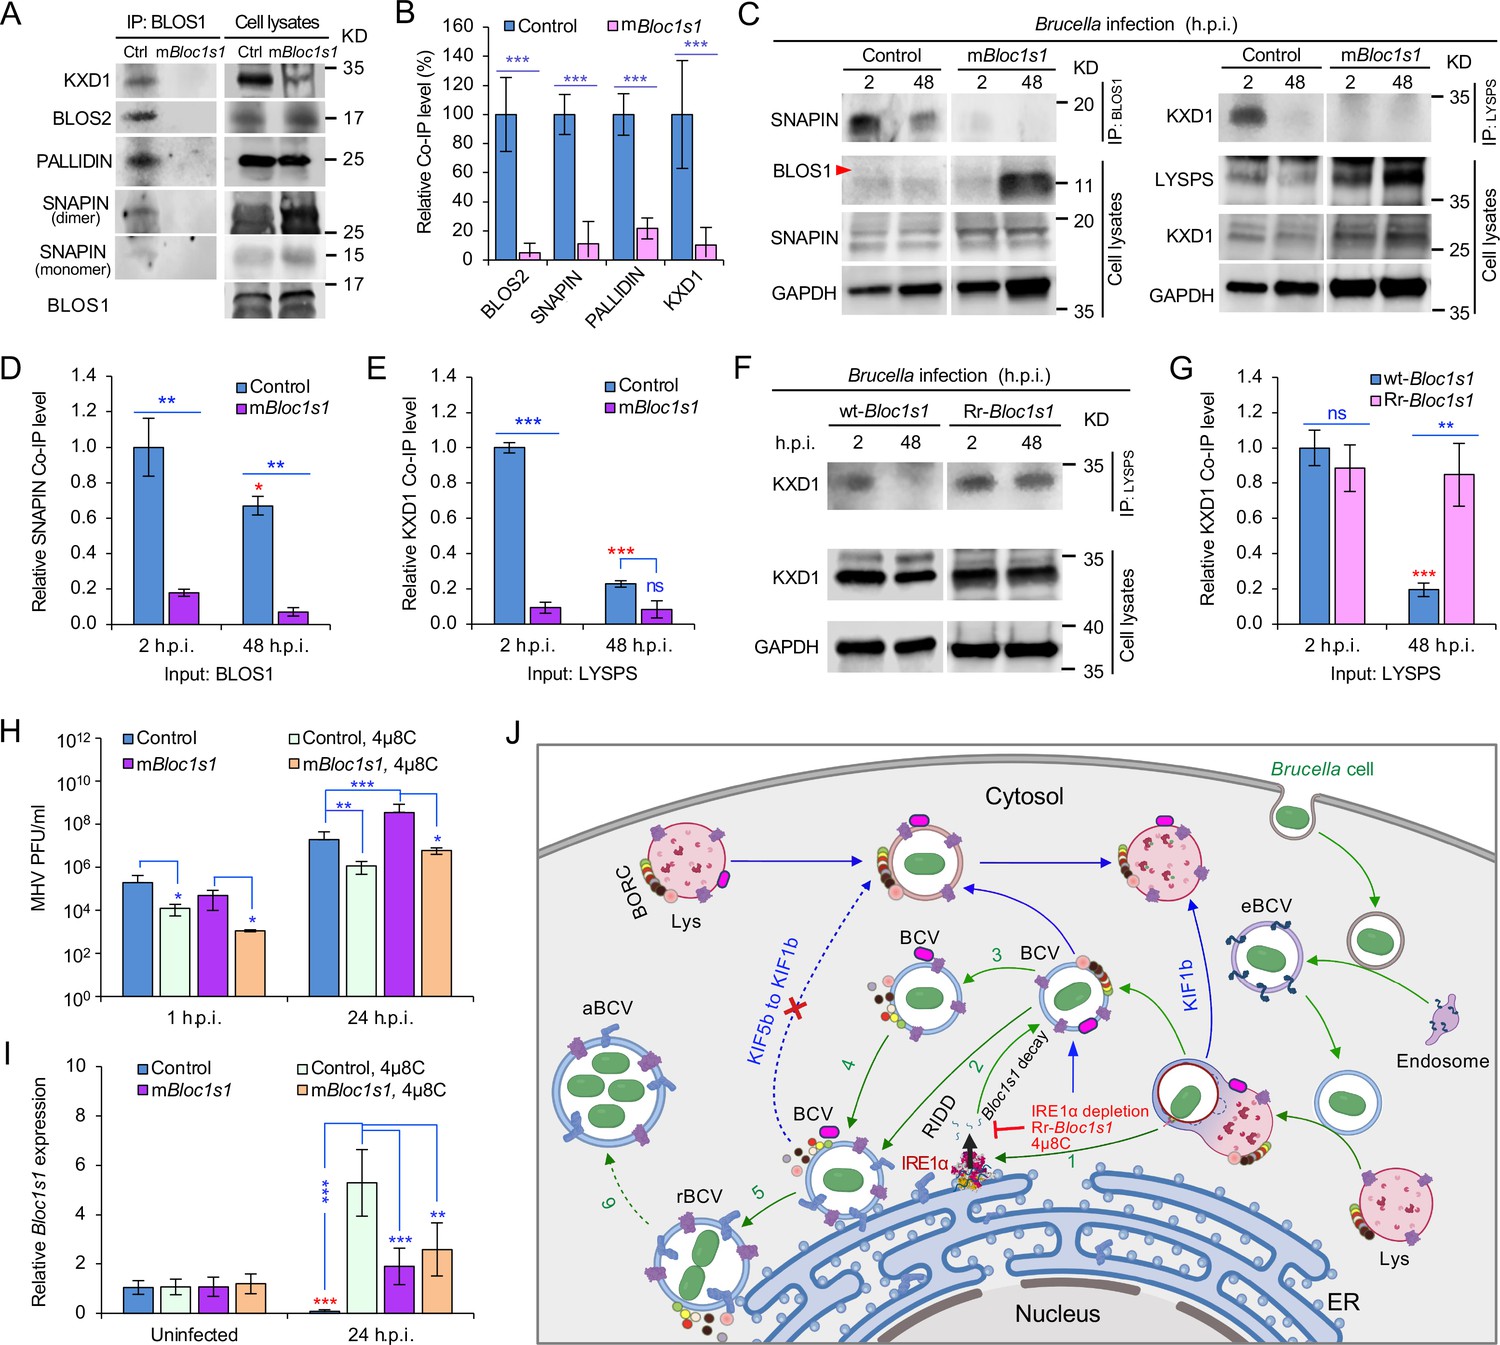
Brucella infection dissociates host BORC and degradation of Bloc1s1 mRNA supports coronavirus intracellular replication.
(A) Co-immunoprecipitation (Co-IP) analysis of the interactions of BLOS1 with other proteins that form the BLOC-1 (BLOS1, BLOS2, SNAPIN, and PALLIDIN) or BORC (BLOS1, BLOS2, SNAPIN, and KXD1) complex. The nonfunctional mBloc1s1 and control cells were cultured overnight before being subjected to Co-IP assays with BLOS1 as an input. (B) Quantification of the indicated pulled-down protein levels from overnight-cultured control and mBloc1s1 cell lysates using BLOS1 as an input. (C) Co-IP assays for Brucella-infected control and mBloc1s1 cells at the indicated h.p.i. using BLOS1 (left panel) or LYSPERSIN (LYSPS, right panel) as an input. Red arrow: BLOS1. Quantification of the indicated pulled-down protein levels of SNAPIN (D) or KXD1 (E) from Brucella-infected control and mBloc1s1 cell lysates using BLOS1 or LYSPS as an input. Red asterisks: significance when compared to the control at 2 h.p.i. (F) Co-IP assays for Brucella-infected wt- or Rr-Bloc1s1 cells at the indicated h.p.i. using LYSPERSIN as an input. (G) Quantification of the indicated pulled-down protein levels from Brucella-infected cell lysates of wt- or Rr-Bloc1s1. Red asterisk: significance when compared to the wt-Bloc1s1 control at 2 h.p.i. (H) PFU (plaque-forming units) assay of coronavirus MHV infection of the mBloc1s1 and control cells treated or untreated with 4μ8C (50 μM) at the indicated h.p.i. (I) Bloc1s1 mRNA expression assay of the indicated host cells infected with MHV via qRT-PCR. Red asterisk: significance when compared to the uninfected control. (J) A proposed model describing how Brucella subverts the host RIDD-BLOS1 pathway to support intracellular parasitism by disrupting BORC-directed lysosomal trafficking. BCV: Brucella-containing vacuole. eBCV, rBCV, and aBCV: endosomal BCV, replicative BCV, and autophagic BCV, respectively. BORC: the BLOC-1-related complex. Green arrows: BCV trafficking to the ER compartment and replication. Blue arrows: BCV trafficking to peripheral lysosome and lysosomal degradation. Host cells were infected with or without Brucella or MHV, and at the indicated h.p.i., the infected or uninfected host cells were harvested for Co-IP and immunoblotting assays, or qRT-PCR assays. Blots are representative of three independent experiments. Statistical data represent the mean ± standard error of mean (SEM) from three independent experiment. *p < 0.05; **p < 0.01; ***p < 0.001. Red asterisks: Compared to the same Brucella-infected cells at 2 h.p.i.
Author response image 1
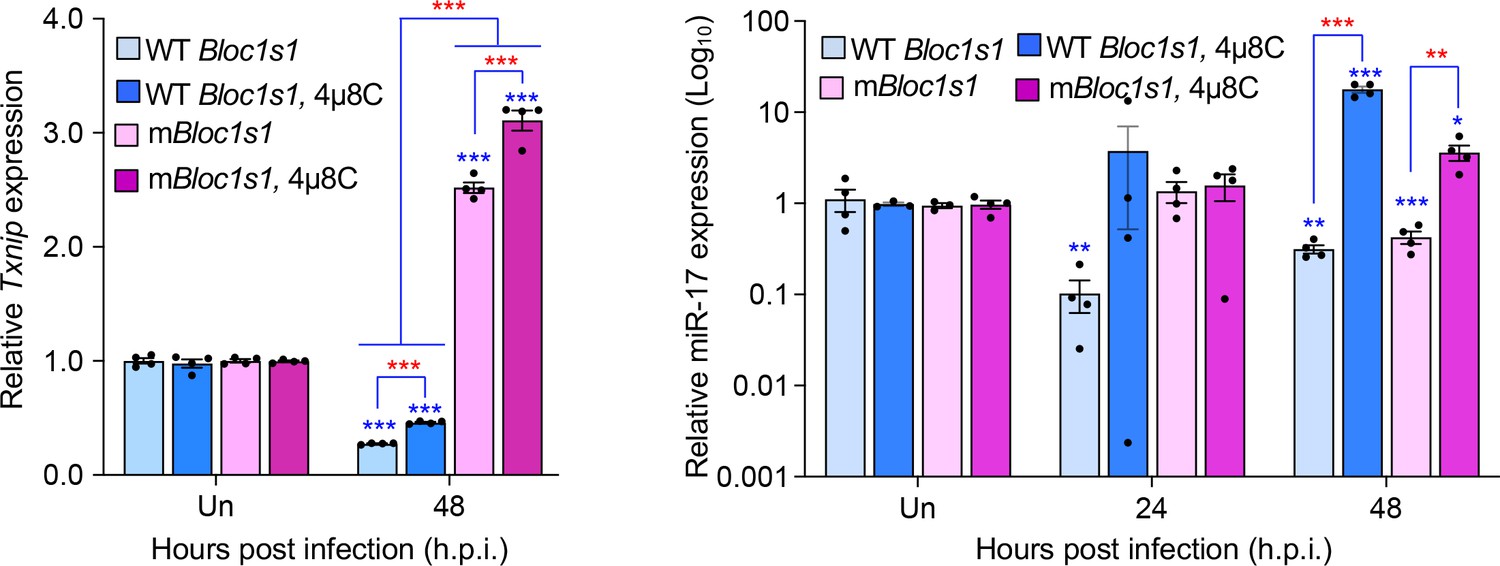
Brucella infection downregulates host Txnip (left panel) and miR-17 (right panel) expression.
RAW264.7 macrophages harboring the wild-type (WT) or non-functional Blos1 (mBlos1) were infected with B. abortus S2308 in the absence or presence of 4μ8C, an IRE1α RNAse and RIDD inhibitor, during infection. At the indicated hours post infection, the infected cells were harvested and performed real-time reverse transcription-PCR (qRT-PCR) assays to determine TXNIP mRNA and miR-17 expression. Un: uninfected cells. *, **, and ***: Significance at p < 0.05, 0.01 and 0.001, respectively. Data represent the mean ± standard error of means from at least 4 independent experiments were performed (expression levels of the indicated genes were normalized to Gapdh expression). Blue asterisks: comparison with those of uninfected control cells.
Tables
Key resources table
| Reagent type (species) or resource | Designation | Source or reference | Identifiers | Additional information |
|---|---|---|---|---|
| Strain, strain background (Brucella abortus) | Strain 2308 | Maintained by the de Figueiredo lab | WT strain | |
| Strain, strain background (B. abortus) | S19 | Maintained by the de Figueiredo lab | Smooth vaccine strain | |
| Strain, strain background (B. melitensis) | 16M | Maintained by the de Figueiredo lab | WT strain | |
| Strain, strain background (B. melitensis) | 16M ΔVirB2 | Maintained by the de Figueiredo lab | ΔVirB2 derived from 16M | |
| Strain, strain background (B. melitensis) | 16M ΔVjbR | Maintained by the de Figueiredo lab | ΔvjbR derived from 16M | |
| Strain, strain background (Mouse Hepatitis Virus) | A59 | Other | Gift from Leibowitz lab | |
| Strain, strain background (Lentivirus) | LLV-LentiGUIDE-Puro-Bloc1s1.1-gRNA | This paper | The de Figueiredo lab; see Methods and methods | |
| Strain, strain background (Lentivirus) | LLV-LentiGUIDE-Puro-Bloc1s1.2-gRNA | This paper | The de Figueiredo lab; see Methods and methods | |
| Strain, strain background (Lentivirus) | LLV-LentiGUIDE-Puro-Bloc1s1.3-gRNA | This paper | The de Figueiredo lab; see Methods and methods | |
| Strain, strain background (Lentivirus) | LLV-LentiGUIDE-Puro-Bloc1s1.4-gRNA | This paper | The de Figueiredo lab; see Methods and methods | |
| Strain, strain background (Lentivirus) | LLV-LentiGUIDE-Puro-Bloc1s1.5-gRNA | This paper | The de Figueiredo lab; see Methods and methods | |
| Strain, strain background (Lentivirus) | LLV-LentiGUIDE-Puro-GFP2 | Other | Gift from the Watson/Patrick lab; Replication incompetent lentivirus | |
| Strain, strain background (Lentivirus) | LLV-Lenti-CMV-Hygro-DEST (w117-1)-Bloc1s1-WT | This paper | The de Figueiredo lab; see Methods and methods | |
| Strain, strain background (Lentivirus) | LLV-Lenti-CMV-Hygro-DEST (w117-1)-Bloc1s1-G449T | This paper | The de Figueiredo lab; see Methods and methods | |
| Strain, strain background (Escherichia coli) | MAX Efficiency DH5α Competent Cells | Thermo Fisher Scientific | Cat# 18258012 | |
| Strain, strain background (Escherichia coli) | Stbl3 | Other | Gift from the Watson/Patrick lab; Chemically competent cells | |
| Strain, strain background (Escherichia coli) | XL10 Gold | Aligent Technologies | Cat# 210,518 | From QuikChange Lightning Site-Directed Mutagenesis Kit |
| Strain, strain background (Escherichia coli) | DB3.1 | Campeau et al., 2009 | Addgene plasmid #17,454 | Containing pLenti CMV Hygro Dest (w117-1) |
| Genetic reagent (Mus musculus) | Lyz2-Ern1wt/wt | Iwawaki et al., 2009 | Gift from the Iwawaki lab | |
| Genetic reagent (Mus musculus) | Ern1mut/mut; Lyz2-Cre (Ern1 CKO) | Iwawaki et al., 2009 | Gift from the Iwawaki lab | |
| Genetic reagent (Mus musculus) | Xbp1+/+ | Other | Gift from Dr. Laurie Glimcher | |
| Genetic reagent (Mus musculus) | Xbp1−/− | Other | Gift from Dr. Laurie Glimcher | |
| Cell line (Mus musculus) | J774A.1 | ATCC | Cat# TIB-67; RRID:CVCL_0358 | Cells tested negative for mycoplasma; cells were maintained in cell culture media containing penicillin/streptomycin to prevent mycoplasma contamination. The cells are maintained in the Fitch lab. |
| Cell line (Mus musculus) | Ern1+/+ MEFs | Other | Gift from the Kaufman Lab; cells tested negative for mycoplasma; cells were maintained in cell culture media containing penicillin/streptomycin to prevent mycoplasma contamination. | |
| Cell line (Mus musculus) | Ern1−/− MEFs | Other | Gift from the Kaufman Lab; cells tested negative for mycoplasma; cells were maintained in cell culture media containing penicillin/streptomycin to prevent mycoplasma contamination. | |
| Cell line (Mus musculus) | RAW 264.7 | ATCC | Cat# TIB-71; RRID:CVCL_0493 | Cells tested negative for mycoplasma; cells were maintained in cell culture media containing penicillin/streptomycin to prevent mycoplasma contamination. |
| Cell line (Mus musculus) | MC3T3-E1 | Bae et al., 2019 | Gift from the Hollien lab; cells tested negative for mycoplasma; cells were maintained in cell culture media containing penicillin/streptomycin to prevent mycoplasma contamination. | |
| Cell line (Mus musculus) | L2 | Other | Gift from the Leibowitz lab; this cell line is different from the L2 cell line in ATCC; this cell line can only be obtained from MHV researchers; cells tested negative for mycoplasma; cells were maintained in cell culture media containing penicillin/streptomycin to prevent mycoplasma contamination. | |
| Transfected construct (Mus musculus) | Raw 264.7 cell line: Cas9 | Other | Gift from the Watson/Patrick lab; cells tested negative for mycoplasma; cells were maintained in cell culture media containing penicillin/streptomycin to prevent mycoplasma contamination. | |
| Transfected construct (Mus musculus) | Raw 264.7 cell line: Cas9 mBloc1s1 | This paper | The de Figueiredo lab; see Methods and methods; cells were maintained in cell culture media containing penicillin/streptomycin to prevent mycoplasma contamination. | |
| Transfected construct (Mus musculus) | Raw 264.7 cell line: Cas9 Control | This paper | The de Figueiredo lab; see Methods and methods; cells were maintained in cell culture media containing penicillin/streptomycin to prevent mycoplasma contamination. | |
| Transfected construct (Mus musculus) | Raw 264.7 cell line: wt-Bloc1s1 | This paper | The de Figueiredo lab; see Methods and methods; cells were maintained in cell culture media containing penicillin/streptomycin to prevent mycoplasma contamination. | |
| Transfected construct (Mus musculus) | Raw 264.7 cell line: RIDD-resistant Bloc1s1 (Rr-Bloc1s1) | This paper | The de Figueiredo lab; see Methods and methods; cells were maintained in cell culture media containing penicillin/streptomycin to prevent mycoplasma contamination. | |
| Transfected construct (Mus musculus) | MC3T3-E1 cell line: RFP expressing | Bae et al., 2019 | Gift from the Hollien lab; cells tested negative for mycoplasma; cells were maintained in cell culture media containing penicillin/streptomycin to prevent mycoplasma contamination. | |
| Transfected construct (Mus musculus) | MC3T3-E1 cell line: Blos1s-Flag (similar to Rr-Bloc1s1) | Bae et al., 2019 | Gift from the Hollien lab; cells tested negative for mycoplasma; cells were maintained in cell culture media containing penicillin/streptomycin to prevent mycoplasma contamination. | |
| Biological sample (Mus musculus) | Bone marrow-derived macrophages | This paper | The de Figueiredo lab; see Methods and methods; cells were maintained in cell culture media containing penicillin/streptomycin to prevent mycoplasma contamination. | |
| Antibody | IRE1α antibody | Novus Biologicals; Thermo Fisher Scientific | Cat: NB100-2324; PA5-20189 | WB (1:500–1000) |
| Antibody | Phospho IRE1α antibody | GeneTex Inc; Thermo Fisher Scientific; Abcam | Cat #: GTX63722; PA1-16927; ab48187 | WB (1:500–1000) |
| Antibody | Rat polyclonal LAMP1 Antibody (1D4B) | Santa Cruz Biotechnology | Cat# sc-19992 | IF (1:500) |
| Antibody | Rabbit polyclonal MAP LC3β (H-50) | Santa Cruz Biotechnology | Cat# sc-28266 | IF (1:300) |
| Antibody | Goat polyclonal Cathepsin D Antibody (R-20) | Santa Cruz Biotechnology | Cat# sc-6487 | IF (1:200) |
| Antibody | Rabbit polyclonal Cathepsin D (H-75) | Santa Cruz Biotechnology | Cat# sc-10725 | IF (1:200) |
| Antibody | Goat polyclonal Calregulin (N-19) | Santa Cruz Biotechnology | Cat# sc-6468 | IF (1:300) |
| Antibody | Rabbit polyclonal Calregulin (H-170) | Santa Cruz Biotechnology | Cat# sc-11398 | IF (1:300) |
| Antibody | alpha Tubulin Rabbit Polyclonal Antibody | Thermo Fisher Scientific | Cat# PA5-29444 | IF (1:1000) |
| Antibody | Acetyl-α-Tubulin (Lys40) (D20G3) XP Rabbit mAb | Cell signaling technology | Cat# 5335 | WB (1:1000) |
| Antibody | Rabbit polyclonal GAPDH Antibody (FL-335) HRP | Santa Cruz Biotechnology | Cat# sc-25778 HRP | WB (1:500) |
| Antibody | Goat polyclonal anti-Brucella | BEI | Cat# DD-17 AB-G-BRU-M | IF (1:400) |
| Antibody | Brucella Rabbit Polyclonal Antibody | Bioss Antibodies | Cat# bs-2229R | IF (1:1000) |
| Antibody | Chicken serum anti-Blos1 | This paper | The de Figueiredo lab; Chicken Serum IF (1:300), WB (1:500) | |
| Antibody | Anti-SNAPIN Rabbit Polyclonal Antibody | Proteintech | Cat# 10055-1-AP | WB (1:700) |
| Antibody | Anti-PLDN Rabbit Polyclonal Antibody | Proteintech | Cat# 10891-2-AP | WB (1:800) |
| Antibody | Anti-KIF1B Rabbit Polyclonal Antibody | Proteintech | Cat# 15263-1-AP | IF (1:200) |
| Antibody | Anti-KIF5B Rabbit Polyclonal Antibody | Proteintech | Cat# 21632-1-AP | IF (1:200) |
| Antibody | Rabbit Polyclonal IHCPlus ARL8B Antibody aa72-121 Polyclonal IHC, WB LS-B5831 | LifeSpan Biosciences | Cat# LS-B5831-100 | 5 µg/ml dilution |
| Antibody | Rabbit polyclonal C17orf59 Antibody (aa186-215) LS-C167955 | LifeSpan Biosciences | Cat# LS-C167955-400 | WB (1:1000) |
| Antibody | Rabbit polyclonal mTOR Antibody | Cell Signaling Techology | Cat# 2972 S | IF (1:300) |
| Antibody | Rabbit polyclonal KxDL motif containing 1 Antibody | Novus Biologicals | Cat# NBP1-82055 | WB (1:500) |
| Antibody | Rabbit polyclonal BLOS2 Polyclonal Antibody | Thermo Fisher Scientific | Cat# PA525452 | WB (1:1000) |
| Antibody | Alexa Fluor 488 Donkey anti-Rat IgG (H + L) | Thermo Fisher Scientific | Cat# A21208 | IF (1:300) |
| Antibody | Alexa Fluor 488 Donkey anti-Rabbit IgG (H + L) | Thermo Fisher Scientific | Cat# A21206 | IF (1:500) |
| Antibody | Alexa Fluor 488 Chicken anti-Goat IgG (H + L) | Thermo Fisher Scientific | Cat# A21467 | IF (1:500) |
| Antibody | Alexa Fluor 488 Chicken anti-Rabbit IgG (H + L) | Thermo Fisher Scientific | Cat# A21441 | IF (1:300) |
| Antibody | Alexa Fluor 594 Donkey anti-Goat IgG (H + L) | Thermo Fisher Scientific | Cat# A11058 | IF (1:500) |
| Antibody | Donkey anti-Rabbit IgG (H + L) ReadyProbes Secondary Antibody, Alexa Fluor 594 | Thermo Fisher Scientific | Cat# R37119 | 1 drop |
| Antibody | Donkey Anti-Chicken IgY Antibody (Alexa Fluor 594) | Jackson ImmunoResearch | Cat# 703-585-155 | IF (1:600) |
| Antibody | Donkey anti Rat IgG (H + L) Secondary Antibody, Alexa Fluor 594, Invitrogen | Thermo Fisher Scientific | Cat# A21209 | IF (1:300) |
| Antibody | Alexa Fluor 594 Goat anti-Rabbit IgG (H + L) | Thermo Fisher Scientific | Cat# A11012 | IF (1:300) |
| Antibody | Alexa Fluor 647 Donkey anti-Goat IgG (H + L) | Thermo Fisher Scientific | Cat# A21447 | IF (1:500) |
| Antibody | Donkey anti Chicken IgY Secondary Antibody, HRP, Invitrogen | Thermo Fisher Scientific | Cat# SA172004 | WB (1:15000) |
| Antibody | Goat anti-Rabbit IgG HRP | Santa Cruz Biotechnology | Cat# sc-2004 | WB (1:2000) |
| Recombinant DNA reagent | (plasmids) See Supplementary file 1 | Other and this paper | See Supplementary file 1 Recombinant plasmids constructed in this work | |
| Sequence-based reagent | (oligonucleotides) See Supplementary file 2 | This paper | The de Figueiredo lab; See Supplementary file 2 | |
| Peptide, recombinant protein | Blos1 N-terminal biotinylated | Genscript | Cat# SC1848 | Peptide synthesized by Genscript, used to make the Chicken Serum Blos1 antibody |
| Commercial assay or kit | Phagocytosis Assay Kit (IgG FITC) | Cayman Chemical | Cat# 500,290 | |
| Commercial assay or kit | QuikChange Lightning Site-Directed Mutagenesis Kit | Aligent Technologies | Cat# 210,518 | |
| Commercial assay or kit | Thermo Scientific Pierce Co Immunoprecipitation Kit | Thermo Fisher Scientific | Cat# 26,149 | |
| Commercial assay or kit | iScript Select cDNA Synthesis Kit | Bio-Rad | Cat# 1708896 | |
| Commercial assay or kit | Applied Biosystems High-Capacity cDNA Reverse Transcription Kit | Thermo Fisher Scientific | Cat# 4368814 | |
| Commercial assay or kit | RNeasy Plus Mini Kit | Qiagen | Cat# 74,134 | |
| Commercial assay or kit | TOPO TA Cloning Kit for Subcloning, without competent cells | Thermo Fisher Scientific | Cat# 451,641 | |
| Commercial assay or kit | Gateway LR Clonase II Enzyme mix | Thermo Fisher Scientific | Cat# 11791020 | |
| Chemical compound, drug | 4µ8c | Sigma-Aldrich | Cat# SML0949 | 50 μM dose |
| Chemical compound, drug | Tunicamycin from Streptomyces | Sigma-Aldrich | Cat# T7765 | 5 μg/ml dose |
| Chemical compound, drug | SsoAdvanced Universal SYBR Green Supermix | BioRad | Cat# 1725274 | |
| Chemical compound, drug | SuperBlock T20 (TBS) Blocking Buffer | Thermo Fisher Scientific | Cat# 37,536 | |
| Chemical compound, drug | Western Blot Strip-It Buffer | Advansta | Cat# R-03722-D50 | |
| Chemical compound, drug | Tween 20 | Fisher scientific | Cat# BP337-500 | |
| Chemical compound, drug | 4% wt/vol Formaldehyde made from paraformaldehyde powder | Sigma-Aldrich | Cat# 158,127 | |
| Chemical compound, drug | Prestained Protein Ladder – Extra broad molecular weight (5–245 kDa) | Abcam | Cat# ab116029 | |
| Chemical compound, drug | SuperSignal West Femto Maximum Sensitivity Substrate | Thermo Fisher Scientific | Cat# 34,095 | |
| Chemical compound, drug | RIPA Buffer | Sigma-Aldrich | Cat# RO278 | |
| Chemical compound, drug | Phosphatase inhibitor cocktail 2 | Sigma-Aldrich | Cat# P5726 | |
| Chemical compound, drug | Phosphatase inhibitor cocktail 3 | Sigma-Aldrich | Cat# P0044 | |
| Chemical compound, drug | TaqMan Universal PCR Master Mix | Thermo Fisher Scientific | Cat# 1804045 | |
| Chemical compound, drug | Puromycin | Invivogen | Cat# ant-pr-1 | |
| Chemical compound, drug | Blasticidin | Invivogen | Cat# ant-bl-1 | |
| Chemical compound, drug | Hygromycin | Invivogen | Cat# ant-hg-1 | |
| Chemical compound, drug | Gram Crystal Violet | Becton Dickinson | Cat# 212,525 | |
| Chemical compound, drug | ProLong Glass Antifade Mountant with NucBlue Stain | Thermo Fisher Scientific | Cat# P36981 | |
| Software, algorithm | ImageJ | https://imagej.nih.gov/ij/ | RRID:SCR_003070 | Version 1.52t (64 bit) |
| Software, algorithm | Fiji | https://imagej.net/Fiji | RRID:SCR_002285 | Version 2.3.0/1.53f51 (64 bit) |
| Software, algorithm | Coloc2 | https://imagej.net/Coloc_2 | ||
| Software, algorithm | GraphPad Prism version 8.2.0 for Windows | GraphPad Software | RRID:SCR_002798 | https://www.graphpad.com/scientific-software/prism/ |
| Software, algorithm | Gen5 | BioTek | Version 3.05 | |
| Software, algorithm | ICE analysis | Synthego, (Synthego Performance Analysis, 2019) | ||
| Software, algorithm | RNAfold WebServer | University of Vienna | RRID:SCR_008550 | http://rna.tbi.univie.ac.at/cgi-bin/RNAWebSuite/RNAfold.cgi |
| Software, algorithm | SnapGene | GSL Biotech LLC | SCR_015052 | https://www.snapgene.com/ |
| Software, algorithm | STAR version 2.5.2a | Dobin et al., 2013 | RRID:SCR_004463 | STAR: ultrafast universal RNA-seq aligner; http://chagall.med.cornell.edu/RNASEQcourse/STARmanual.pdf |
| Software, algorithm | RSEM version 1.2.29 | Li and Dewey, 2011 | RRID:SCR_013027 | RSEM: accurate transcript quantification from RNA-Seq data with or without a reference genome; https://deweylab.github.io/RSEM/ |
| Software, algorithm | DESeq version 1.30.0 | Anders and Huber, 2010 | RRID:SCR_000154 | Differential expression analysis for sequence count data; https://www.bioconductor.org/packages//2.10/bioc/html/DESeq.html |
| Software, algorithm | WebGestalt-2013 | Wang et al., 2013 | RRID:SCR_006786 | WEB-based GEne SeT AnaLysis Toolkit (WebGestalt): update 2013; http://www.webgestalt.org |
| Software, algorithm | PANTHER version 7 | Gaudet et al., 2011; Mi et al., 2010 | RRID:SCR_004869 | Phylogenetic-based propagation of functional annotations within the Gene Ontology consortium; http://www.pantherdb.org |
| Software, algorithm | edgeR version 3.26.6 | McCarthy et al., 2012; Robinson et al., 2010 | RRID:SCR_012802 | https://www.bioconductor.org/packages/release/bioc/html/edgeR.html |
| Software, algorithm | Cytoscape | Zhao et al., 2017 | RRID:SCR_003032 | https://cytoscape.org/ |
| Software, algorithm | Biorender | Biorender | RRID:SCR_018361 | https://biorender.com/ |
| Other | SeaPlaqueTM Agarose | Lonza | Cat# 50,101 | Used for plaque assays |
| Other | Accell Mouse Kif5b siRNA SMARTpool 5 nmol | Horizon | Cat# E-040710-00-0005 | Used for validation |
| Other | Accell Mouse Kif1b siRNA SMARTpool 5 nmol | Horizon | Cat# E-040900-00-0005 | Used for validation |
| Other | Accell Mouse Arl8b siRNA SMARTpool 5 nmol | Horizon | Cat# E-056525-00-0005 | Used for validation |
| Other | Accell Non-targeting Control Pool 5 nmol | Horizon | Cat# D-001910-10-05 | Used for validation |
| Other | Accell siRNA Delivery Media | Horizon | Cat# B-005000-500 | Used for validation |
| Other | ON-TARGETplus Human BLOC1S1 (2647) siRNA - SMARTpool, 5 nmol | Dharmacon | L-012580-01-0005 | Used for validation |
| Other | 8–16% Mini-PROTEAN TGX Precast Protein Gels, 10-well, 30 µl | BioRad | 4561103 | |
| Other | DAPI | Sigma-Aldrich | Cat# D9542-10MG | 1 μg/ml |
Additional files
-
Supplementary file 1
Table S1.
Recombinant plasmids constructed in this work.
- https://cdn.elifesciences.org/articles/73625/elife-73625-supp1-v1.docx
-
Supplementary file 2
Table S3.
Primers used in this work.
- https://cdn.elifesciences.org/articles/73625/elife-73625-supp2-v1.docx
-
Transparent reporting form
- https://cdn.elifesciences.org/articles/73625/elife-73625-transrepform1-v1.pdf
-
Source data 1
Source Western blot and agrose gel images in PDF format.
- https://cdn.elifesciences.org/articles/73625/elife-73625-data1-v1.pdf
-
Source data 2
Original images of Western blots and agarose gels.
- https://cdn.elifesciences.org/articles/73625/elife-73625-data2-v1.zip
Download links
A two-part list of links to download the article, or parts of the article, in various formats.
Downloads (link to download the article as PDF)
Open citations (links to open the citations from this article in various online reference manager services)
Cite this article (links to download the citations from this article in formats compatible with various reference manager tools)
Brucella activates the host RIDD pathway to subvert BLOS1-directed immune defense
eLife 11:e73625.
https://doi.org/10.7554/eLife.73625


