Gene expression phylogenies and ancestral transcriptome reconstruction resolves major transitions in the origins of pregnancy
- Department of Human Genetics, University of Chicago, United States
- Department of Organismal Biology and Anatomy, University of Chicago, United States
- School of Life and Environmental Sciences, University of Sydney, Australia
- Charles Perkins Centre,University of Sydney, Australia
- Department of Biological Sciences, University at Buffalo, State University of New York, United States
Figures
Figure 1
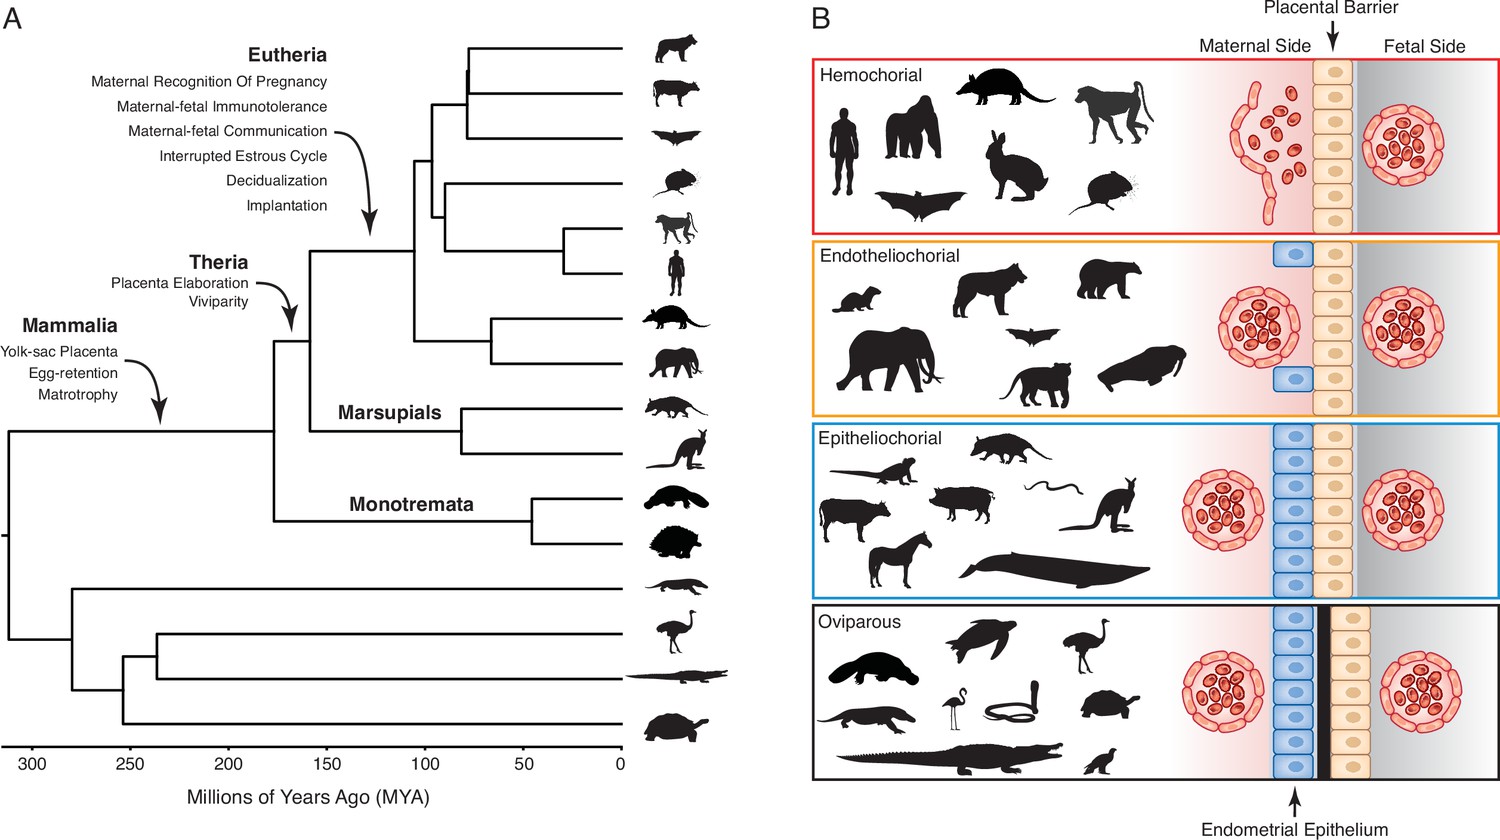
Evolution and arrangement of the maternal-fetal interface and degree of placental invasion in viviparous Amniotes.
(A) Phylogenetic relationships among amniote lineages, mammalian lineages labeled. Major evolutionary steps in the evolution of pregnancy are shown for Mammalia, Theria, and Eutheria. (B) Placenta classification based on the arraignment of the maternal-fetal interface and degree of invasiveness. Epitheliochorial placenta, in which placental invasion does not occur and the barrier between maternal blood and the chorion (tan cells) consists of maternal vascular endothelium (red cells) and uterine epithelium (blue cells). Endotheliochorial placenta, in which the placenta invades through the uterine epithelium and the barrier between maternal blood and the chorion consists of the maternal vascular endothelium. Hemochorial placenta, in which the placenta invades through both the uterine epithelium and vascular endothelium, and maternal blood directly bathes the chorionic villi. Examples of species with each type of placenta are also shown. While the egg passes through the glandular uterine portion of the oviduct in oviparous species, the immunologically inert shell (black) prevents direct contact between maternal and fetal tissues.
Figure 2
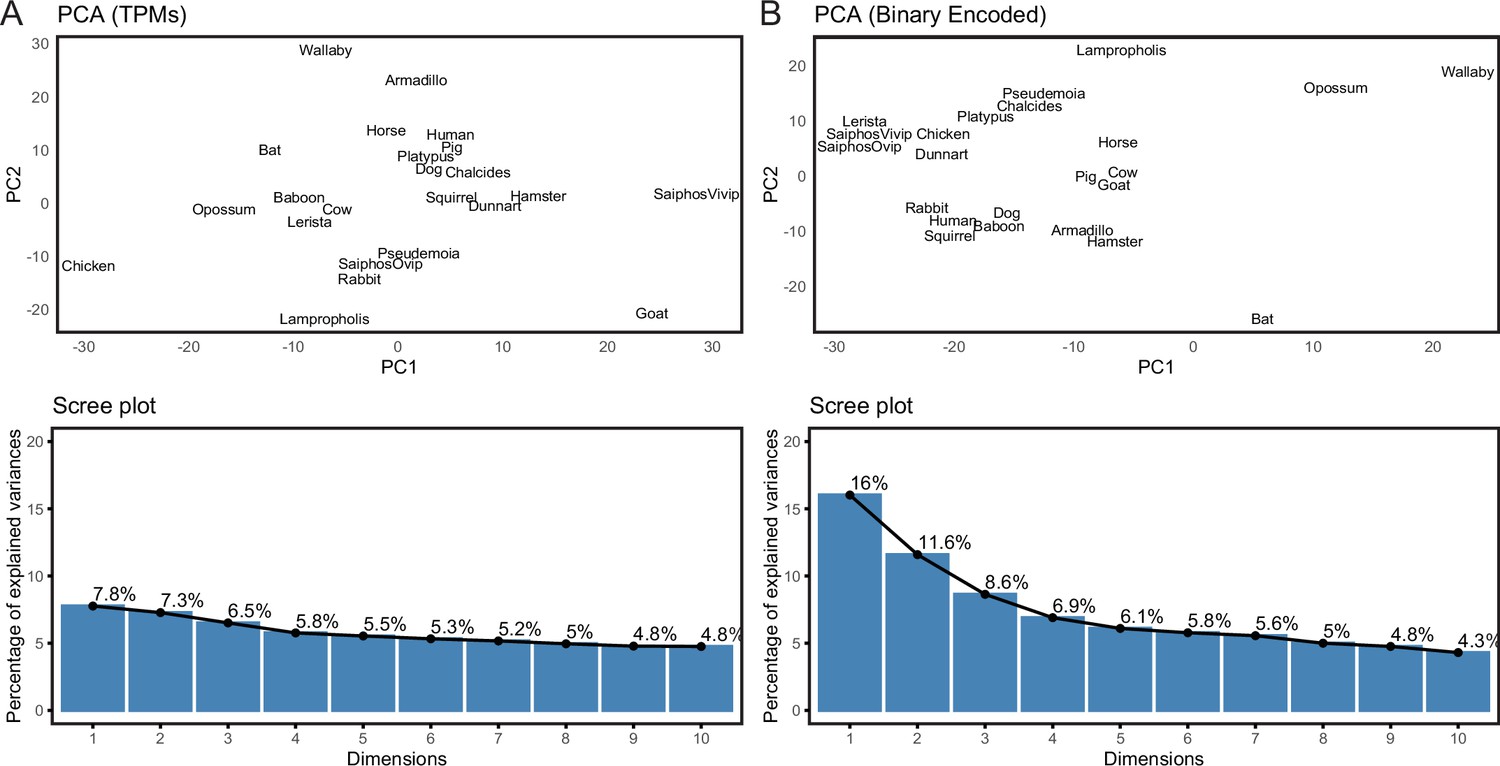
Binary encoding uncovers phylogenetic signal in transcriptome data.
(A) Upper, Principal Component Analysis (PCA) of gene expression levels (TPMs) grouped species randomly, consistent with significant noise. Lower, scree plot showing percent of variance explained by dimensions 1–10. Note that the flat curve of variance explained indicates there are no significant dimensions to the PCA. (B) Upper, logistic PCA of the binary encoded endometrial transcriptome dataset groups species by phylogenetic relatedness, indicating significant noise reduction in the binary encoded dataset. Lower, screen plot showing percent of variance explained by dimensions 1–10. Note that the ‘elbow’ of the graph is around dimension 4, suggesting that dimensions 1–4 of the PCA are significant.
-
Figure 2—source data 1
file 1.
Species names (common and binomial), genome annotations used for RNA-Seq analysis and parity mode.
- https://cdn.elifesciences.org/articles/74297/elife-74297-fig2-data1-v2.xlsx
Figure 3 with 1 supplement
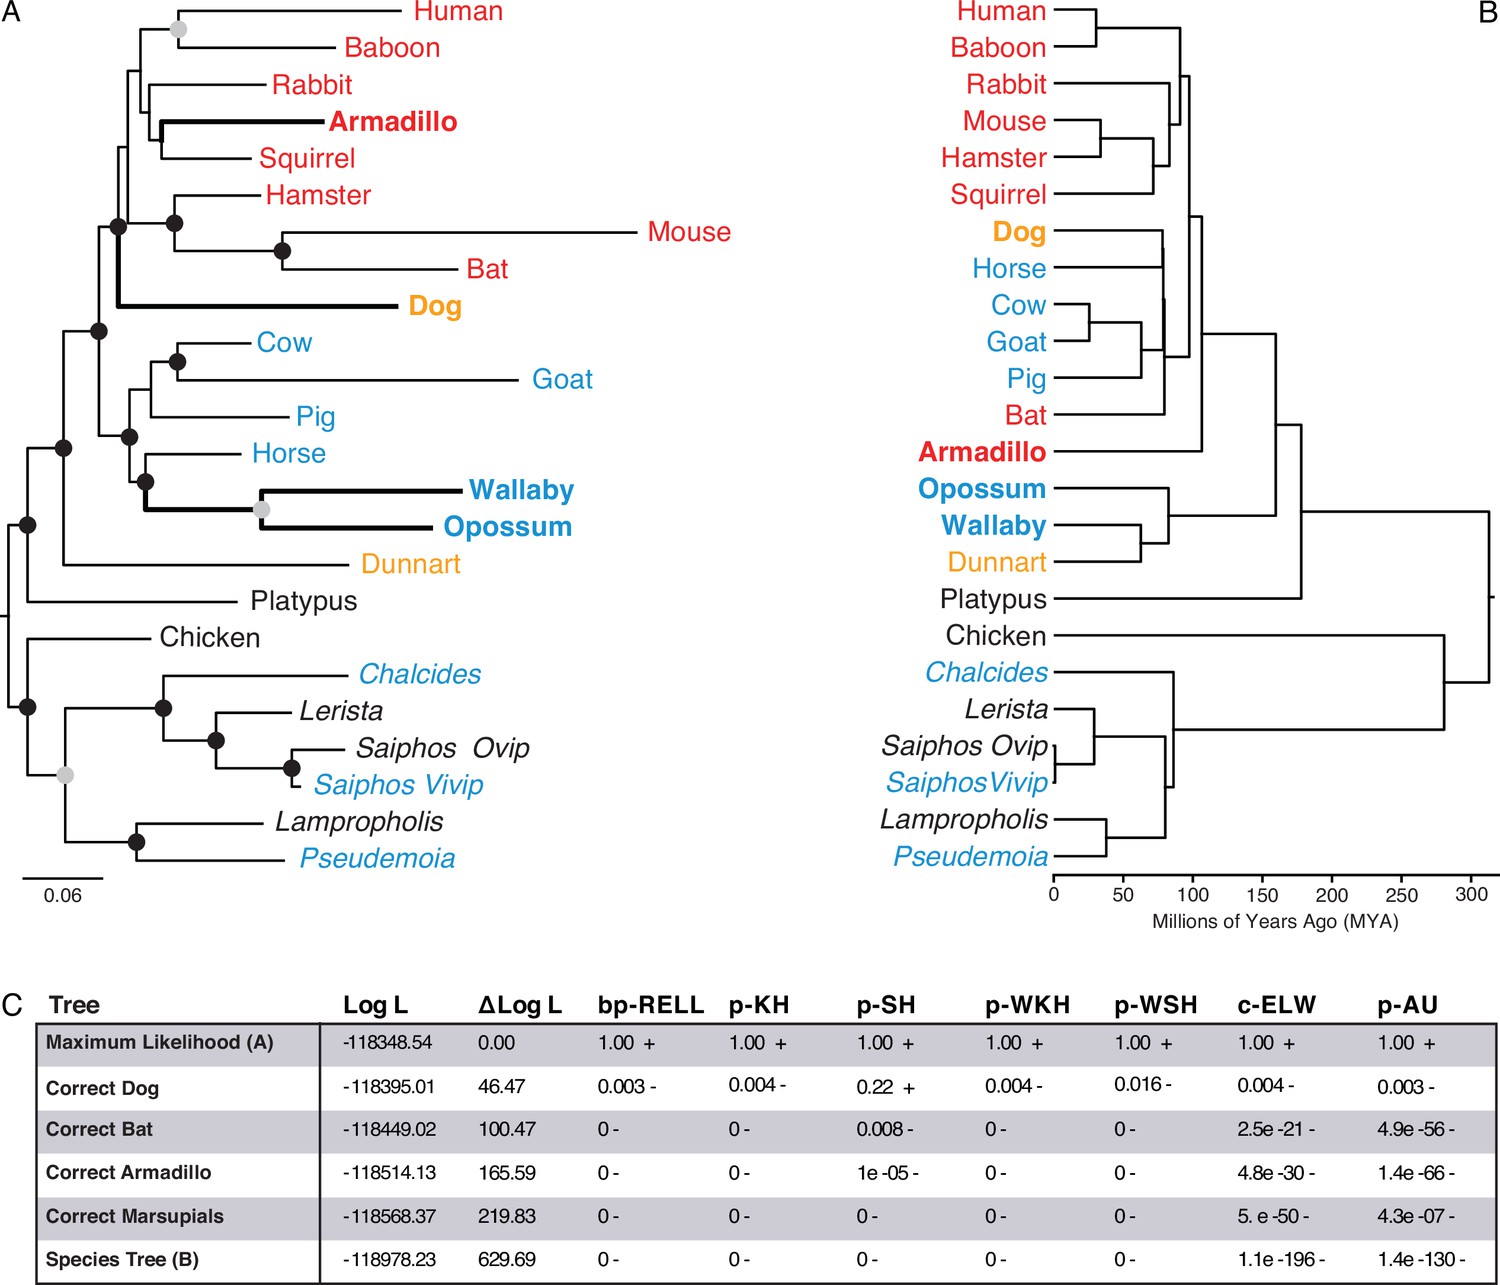
Maximum-likelihood (ML) phylogeny of binary encoded endometrial transcriptome data.
(A) ML phylogeny of binary encoded endometrial transcriptome data inferred by IQ-TREE under the GTR2 +FO + R3 model. Highly supported branch splits, i.e., those with SH-aLRT ≥80%, LBoot ≥90%, aBayes ≥0.90, UFboot ≥95%, StdBoot support ≥80%, and parametric aLRT ≥0.95, are shown with black circles. Branch splits that are highly-supported by at least 4 of 6 methods are shown with gray circles. Particularly discordant phylogenetic relationships are shown in bold. Oviparous species are in black, viviparous species with epitheliochorial placentas in blue, endotheliochorial placentas in orange, and hemochorial placentas in red. Lizard species are shown with genus names in italics. (B) Phylogenetic relationships of species in (A). Discordant phylogenetic relationships compared to the ML tree are shown in bold. (C) Tree topology tests comparing the maximum likelihood tree (GTR2 +FO + H4) shown in panel A to alternate trees that correct the phylogenetic placement of specific species or the species tree shown in panel B. Delta Log L: log L difference from the maximal Log L in the set (A). bp-RELL: bootstrap proportion using RELL method. p-KH: p-value of one sided Kishino-Hasegawa test. p-SH: p-value of Shimodaira-Hasegawa test. p-WKH: p-value of weighted KH test. p-WSH: p-value of weighted SH test. c-ELW: Expected Likelihood Weight. p-AU: p-value of approximately unbiased (AU) test. +indicates tree is within the 95% confidence sets, – significant exclusion of tree from the 95% confidence sets. All tests performed 100,000 resamplings using the RELL method.
Figure 3—figure supplement 1
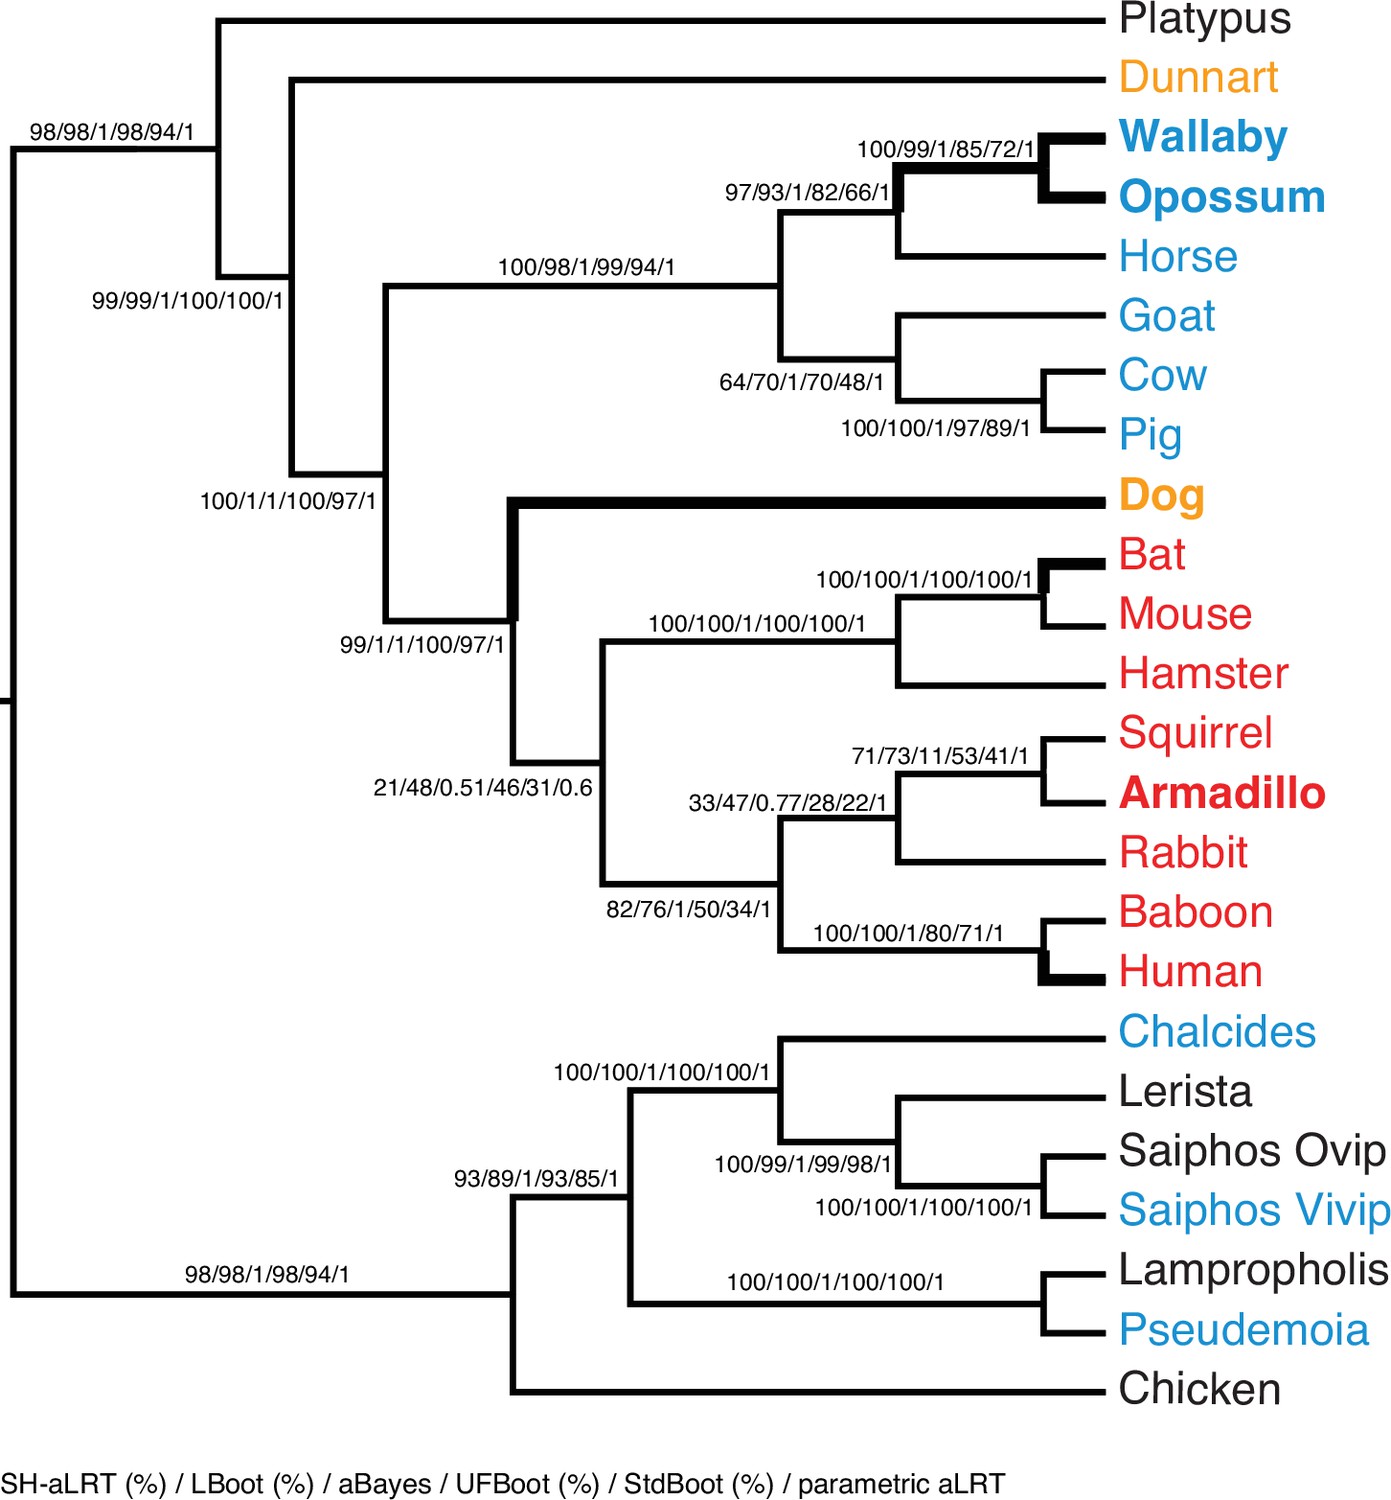
ML phylogeny of binary encoded endometrial transcriptome data inferred by IQ-TREE under the best-fitting GTR2 +FO + R3 model.
Branch supports are shown for SH-aLRT (%) / LBoot (%) / aBayes / UFBoot (%) / StdBoot (%) / parametric aLRT. Clades are considered highly-supported if its SH-aLRT ≥80%, LBoot ≥90%, aBayes ≥0.90, UFboot ≥95%, StdBoot support ≥80%, and parametric aLRT ≥0.95. Particularly discordant phylogenetic relationships are shown in bold. Oviparous species are in black, viviparous species with epitheliochorial placentas in blue, endotheliochorial placentas in orange, and hemochorial placentas in red. Lizard species are shown with genus names in italics.
Figure 4 with 2 supplements
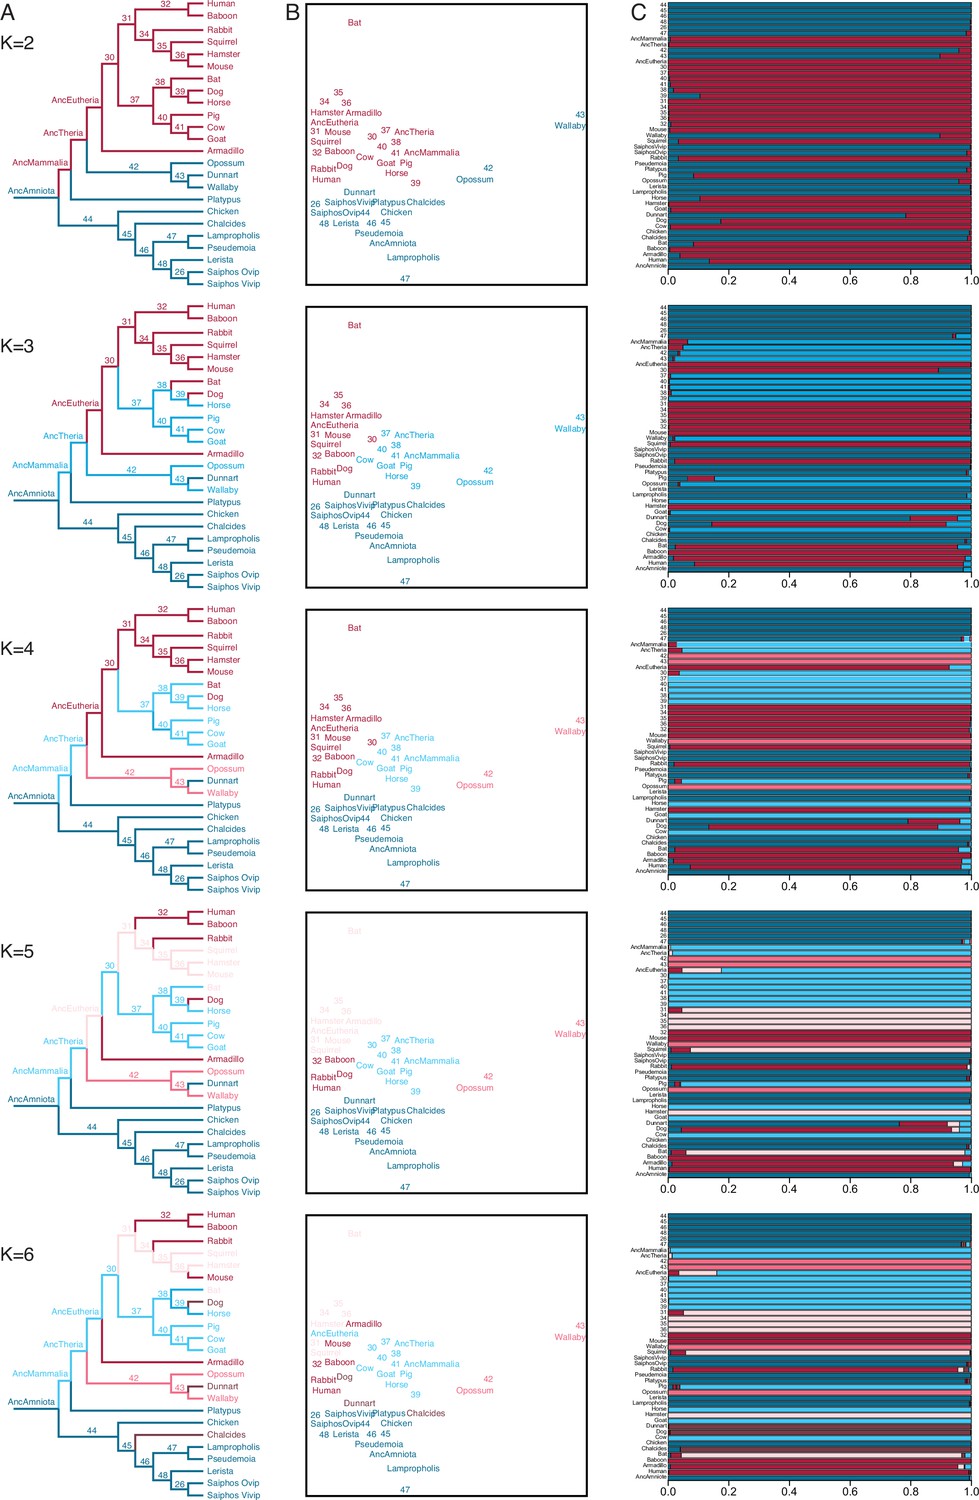
Fuzzy C-Means clustering of extant and ancestral transcriptomes.
(A) Species phylogeny with extant species and ancestral lineages colored according to Fuzzy C-Means cluster membership (K=2–6) shown in (B). Note that ancestral nodes are numbered. Lizard species are shown with genus names in italics. (B) Fuzzy C-Means clustering of extant and ancestral transcriptomes (K=2–6). Extant species and ancestral lineages colored according to maximum degree of cluster membership shown in (C). Lizard species are shown with genus names in italics. (C) Fuzzy C-Means cluster membership of extant and ancestral transcriptomes (K=2–6). Degree of cluster membership is shown as a 100% stacked bar and colored according to proportion of membership in each cluster. Lizard species are shown with genus names.
Figure 4—figure supplement 1
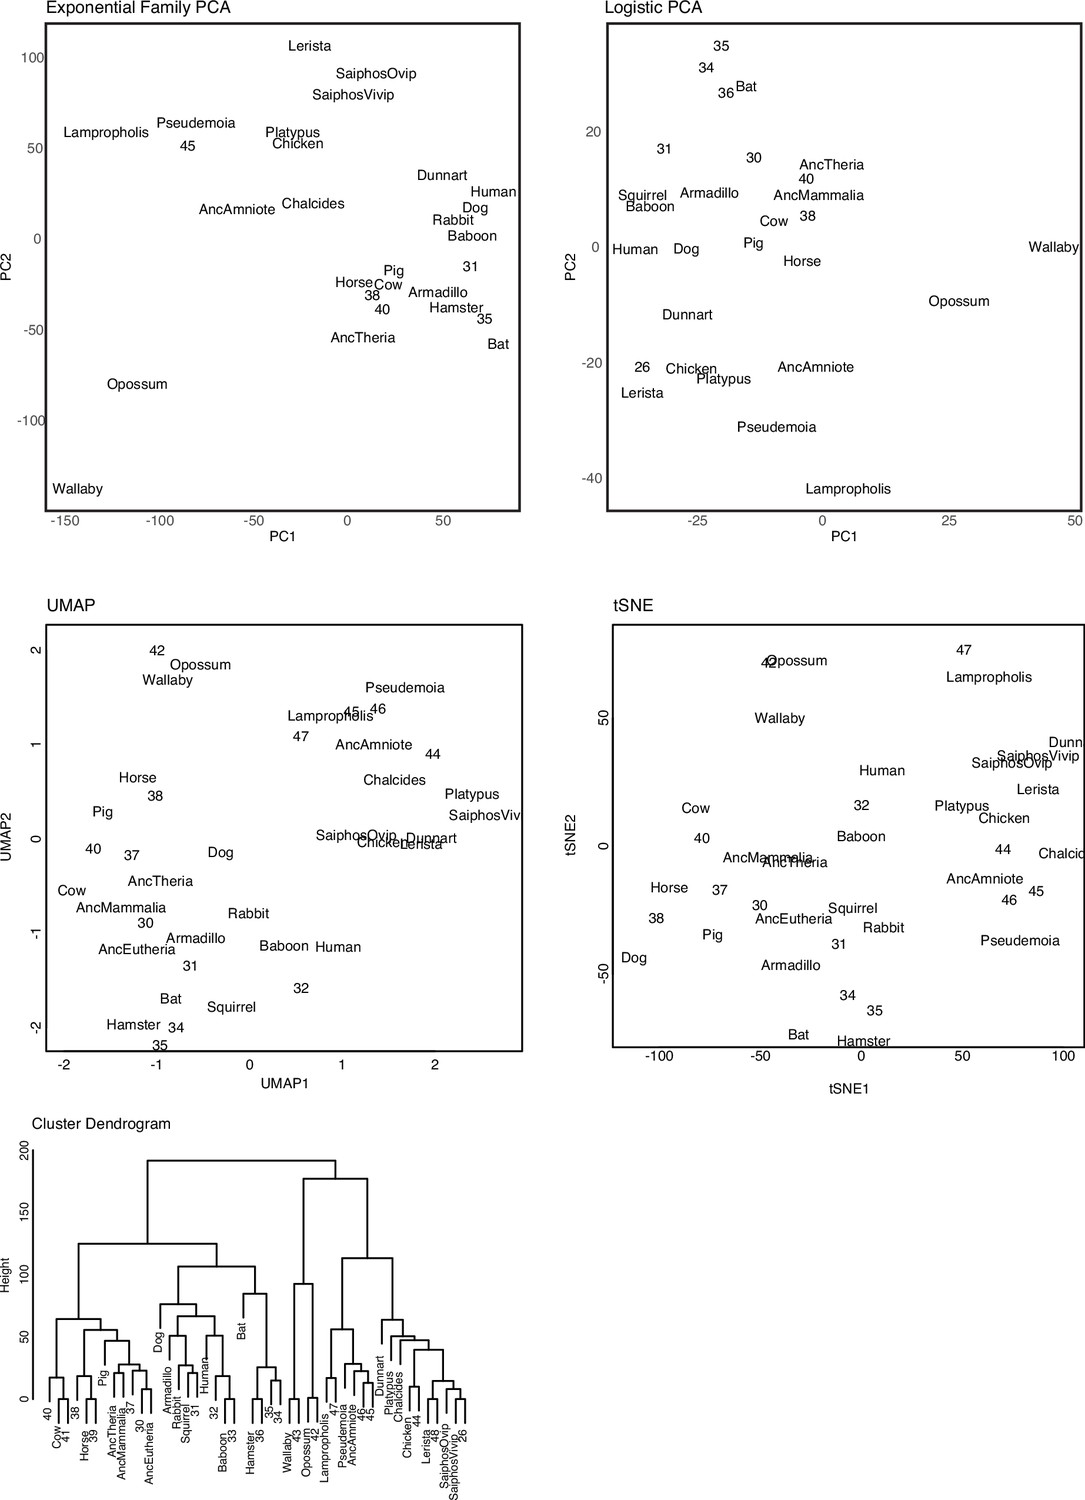
Exploratory clustering of extant and ancestral binary encoded transcriptomes.
Including: (1) Exponential Family Principal Component Analysis (PCA); (2) Logistic Principal Component Analysis (LPCA); (3) Uniform Manifold Approximation and Projection (UMAP); (4) t-distributed stochastic neighbor embedding (t-SNE); and (5) Hierarchical clustering (Manhattan distances).
Figure 4—figure supplement 2
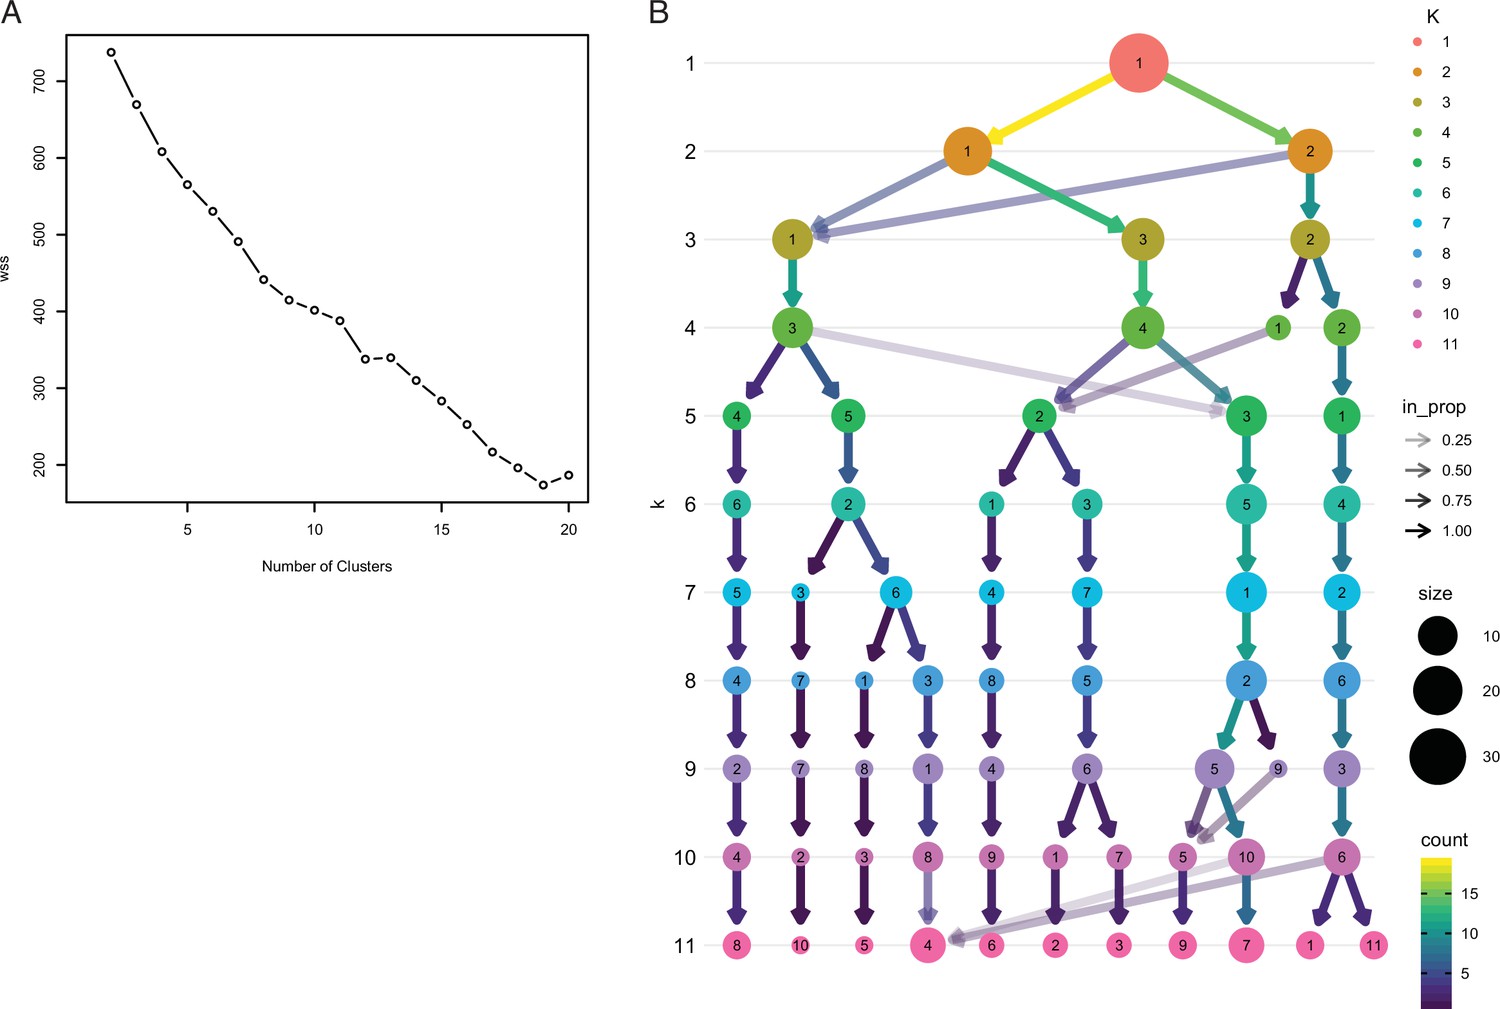
Exploratory analyses of Fuzzy C-Means cluster number.
(A) FCM cluster number estimate using the elbow plot method with K=1–20, which was uninformative in choosing the optimal number of clusters. (B) Exploratory analyses of Fuzzy C-Means cluster number using the clustree method with K=1–11. In this figure, the size of each node corresponds to the number of samples in each cluster, and the arrows colored according to the number of samples in each cluster. Transparent arrows (the incoming node proportion), show how samples from move between lower and higher cluster numbers and can be used as an indicator of cluster instability. In this graph samples switch clusters between K=1–5, are stable between K=6–9, and unstable with more than 9 clusters. These data indicate that 6 clusters is optimal for resolution, that is, more than 6 clusters no longer provides informative cluster memberships, while more than K≥9 is over-clustered.
Figure 5
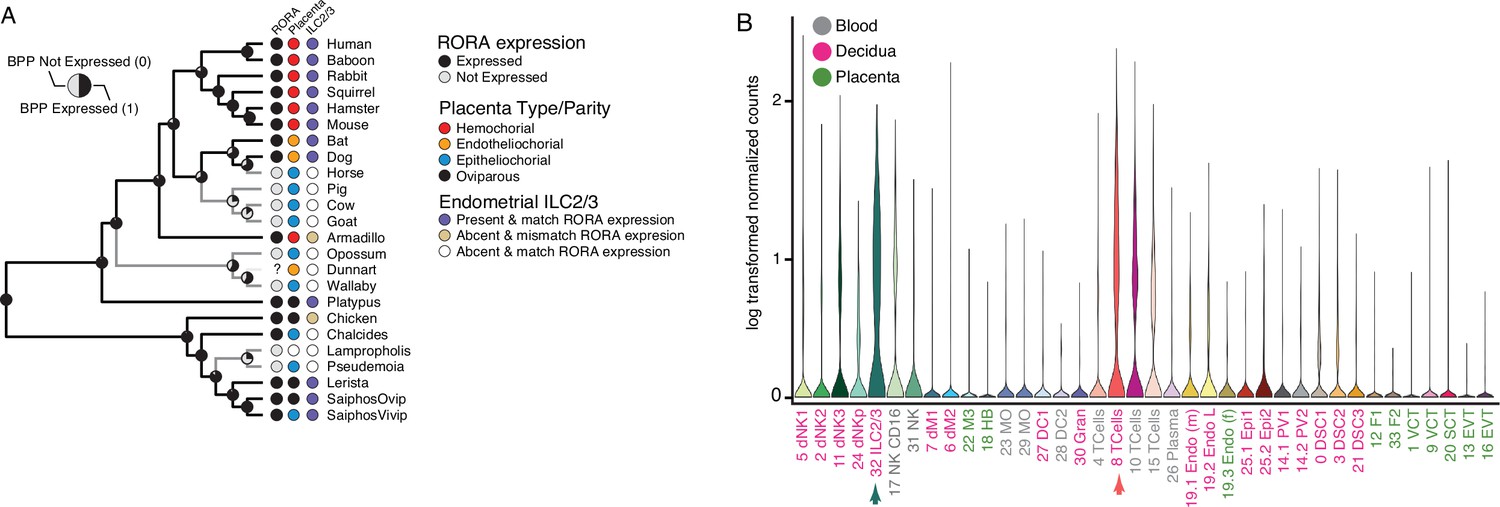
Convergent loss of RORA expression in species with epitheliochorial placentas.
(A) Ancestral reconstruction of RORA expression. Pie charts at each internal node indicate the Bayesian Posterior Probability (BPP) that RORA is expressed (state 1, black) or not expressed (state 0, gray) at that node. Extant species are colored according to RORA expression (TPM ≥2 = expressed, black; TPM <2 = not expressed, gray); note that the RORA is not annotated in the dunnart genome and is therefore indicated as ‘?’. Degree of placental invasiveness is shown for extant species: Hemochorial (red), endotheliochorial (orange), epitheliochorial (blue), oviparous (black). Inference of an endometrial population of ILC2/3 cells from deconvolution of bulk RNA-Seq datasets from each species is shown for extant species: Species with ILC2/3 cells and RORA expression (blue dots), species without ILC2/3 cells and RORA expression (yellow dots), and species without ILC2/3 cells and without RORA expression (white). (B) RORA expression in single-cell RNA-Seq data from cell-types at the first trimester human maternal-fetal interface. Expression data is shown as a violin plot of log transformed counts for each cell-type. Cell-types are color coded by their location at the maternal-fetal interface: Blood (grey), decidua (pink), placenta (embryonic chorion, green).
-
Figure 5—source data 1
Nexus file of the binary encoded endometrial transcriptome dataset with gene names and species phylogeny.
- https://cdn.elifesciences.org/articles/74297/elife-74297-fig5-data1-v2.txt
Tables
Table 1
Inferences of placental invasiveness in the eutherian ancestor 1880–2021.
Note that we follow Mossman, 1991, p. 156 and define a placenta as ‘any intimate apposition or fusion of the fetal organs to the maternal (or paternal) tissues for physiological exchange’.
| Study | Data | Method(s) | State |
|---|---|---|---|
| Turner, 1876 | – | Ontogeny | Epitheliochorial |
| Haeckel, 1883 | – | Ontogeny | “Non-Invasive” |
| Minot, 1891 | Ontogeny | Hemochorial | |
| Wislocki, 1929 | – | Implicit Parsimony? | Hemochorial |
| Hill, 1997 | – | Ontogeny | Epitheliochorial |
| Mossman, 1991 | Ontogeny | Endotheliochorial | |
| Portmann, 1938 | – | Ontogeny | Hemochorial |
| Martin, 1969 | – | Ontogeny / Implicit Parsimony | Endotheliochorial |
| Kihlström, 1972 | – | Gestation length / Placenta-type Correlation | (Endothelio/hemo)chorial |
| Luckett, 1976; Luckett, 1975; Luckett, 1974 | – | Ontogeny | Epitheliochorial |
| 14 taxa | Ontogeny / Implicit Parsimony | Endotheliochorial | |
| Vogel, 2005 | 22 taxa | Implicit Parsimony | Hemochorial |
| Elliot and Crespi, 2006 | 88 taxa | Maximum Likelihood | Hemochorial |
| Mess and Carter, 2006 | 36 taxa | Maximum Parsimony | (Endothelio/hemo)chorial |
| Wildman et al., 2006 | 44 taxa | Maximum Parsimony & Maximum Likelihood | Hemochorial |
| Martin, 2008 | 18 taxa | Parsimony | Endotheliochorial (ordered) or (Endothelio/hemo)chorial (unordered) |
| Elliot and Crespi, 2009 | 334 taxa | Maximum Parsimony & Maximum Likelihood | (Endothelio/hemo)chorial (MP) or Hemochorial (ML) |
| McGowen et al., 2014 | 66 taxa | Maximum Likelihood | (Superficial) Hemochorial |
Additional files
Download links
A two-part list of links to download the article, or parts of the article, in various formats.
Downloads (link to download the article as PDF)
Open citations (links to open the citations from this article in various online reference manager services)
Cite this article (links to download the citations from this article in formats compatible with various reference manager tools)
Gene expression phylogenies and ancestral transcriptome reconstruction resolves major transitions in the origins of pregnancy
eLife 11:e74297.
https://doi.org/10.7554/eLife.74297


