A plasma membrane-localized polycystin-1/polycystin-2 complex in endothelial cells elicits vasodilation
- Department of Physiology, University of Tennessee Health Science Center, United States
Figures
Figure 1 with 1 supplement
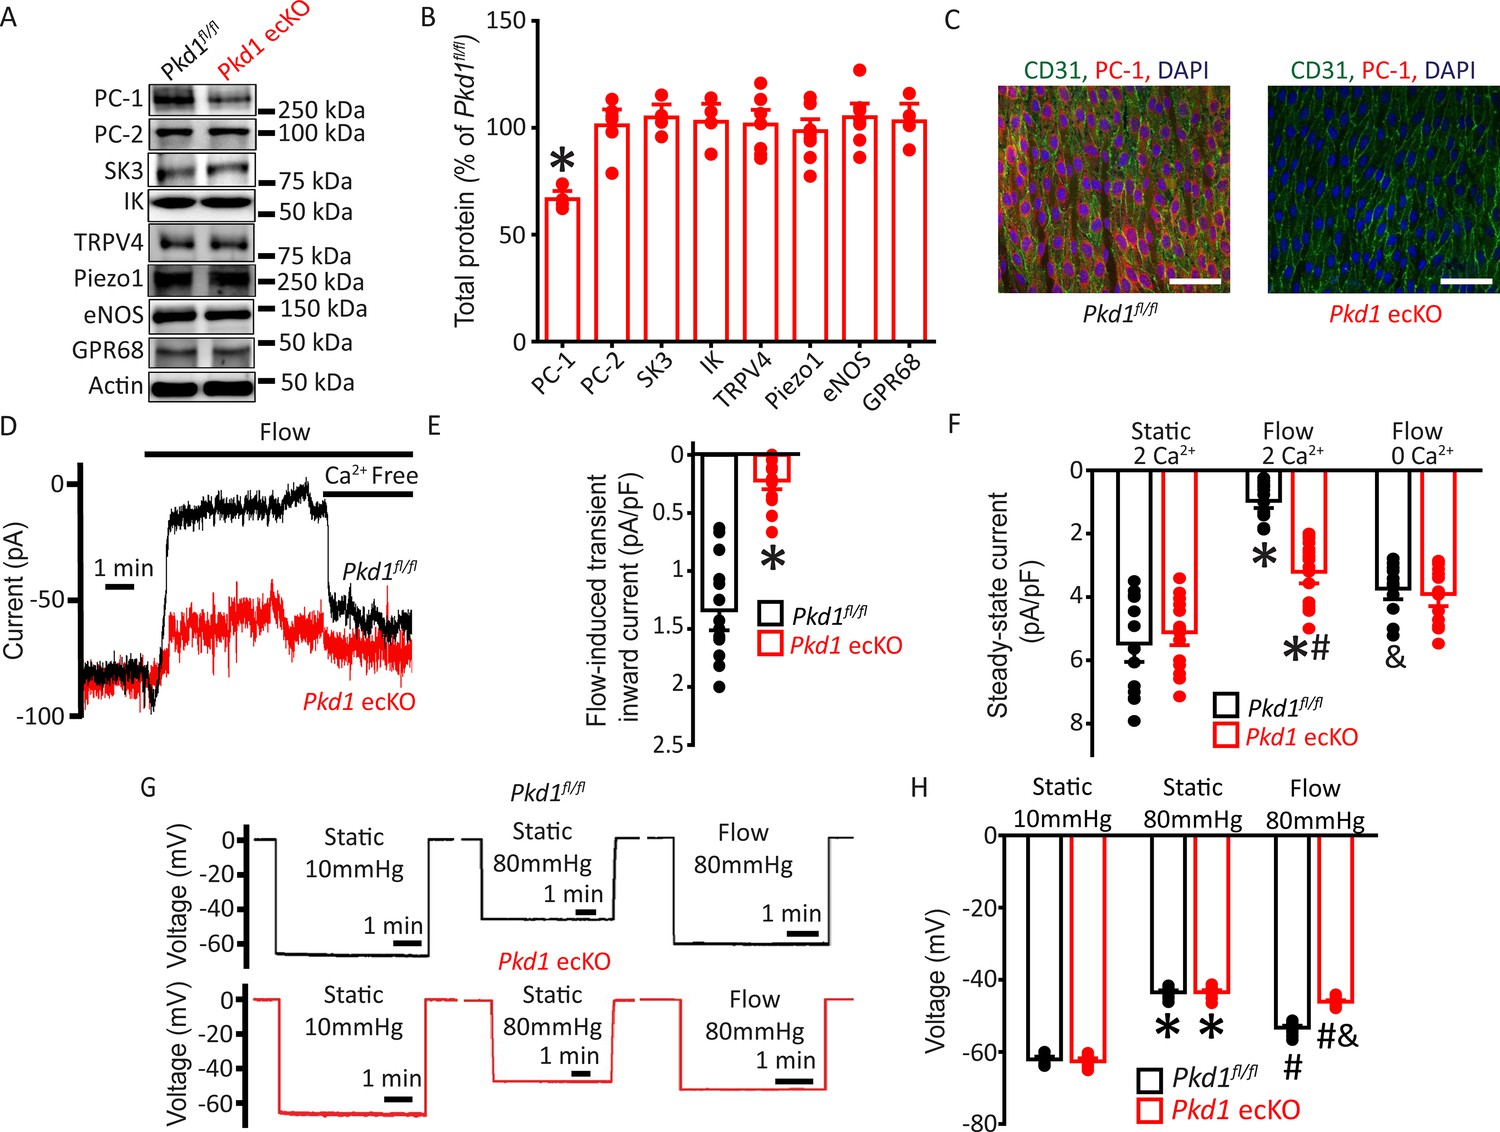
Flow stimulates PC-1-mediated, Ca2+-dependent currents in mesenteric artery endothelial cells (ECs) that elicit arterial hyperpolarization.
(A) Representative Western blots illustrating PC-1, PC-2, SK3, IK, TRPV4, Piezo1, eNOS, GPR68, and actin proteins in mesenteric arteries of Pkd1fl/fl and Pkd1 ecKO mice. (B) Mean data for PC-1, PC-2, SK3, IK, TRPV4, Piezo1, eNOS, and GPR68, with n = 4, 6, 4, 4, 7, 8, 7, and 4, respectively. * indicates p<0.05. (C) En-face immunofluorescence illustrating that PC-1 (Alexa Fluor 546) is abolished in ECs of Pkd1 ecKO mice mesenteric arteries (representative of eight arteries from Pkd1fl/fl and 7 Pkd1 ecKO mice, respectively). CD31 (Alexa Fluor 488) and DAPI are also shown. Scale bars=50 µm. (D) Original recordings of steady-state current modulation by flow (10 ml/min) and effect of removing bath Ca2+ in ECs of Pkd1fl/fl and Pkd1 ecKO mice voltage-clamped at −60 mV. (E) Mean data for flow-induced transient inward current density. n=15 for Pkd1fl/fl and n=16 for Pkd1 ecKO. * indicates p<0.05 versus Pkd1fl/fl. (F) Mean data for steady-state current density (Pkd1fl/fl: static+Ca2+, n=15; flow+Ca2+, n=15; flow with Ca2+ free bath solution, n=12 and Pkd1 ecKO: static+Ca2+, n=16; flow+Ca2+, n=16; flow with Ca2+ free bath, n=13). *p<0.05 versus static +2 mM Ca2+ in the same genotype, #p<0.05 versus Pkd1fl/fl under the same condition, &p<0.05 versus flow Ca2+ in the same genotype. (G) Original membrane potential recordings obtained using microelectrodes in pressurized (80 mmHg) mesenteric arteries of Pkd1fl/fl and Pkd1 ecKO mice in static or flow (15 dyn/cm2) conditions. (H) Mean data (Pkd1fl/fl: 10 mmHg, n=8; 80 mmHg, n=14; 80 mmHg+ flow, n=19; Pkd1 ecKO: 10 mmHg, n=9; 80 mmHg, n=14; 80 mmHg+ flow, n=18). *p<0.05 versus static at 10 mmHg in the same genotype. #p<0.05 for flow versus static at 80 mmHg in the same genotype. & indicates p<0.05 versus Pkd1fl/fl under the same condition.
Figure 1—figure supplement 1
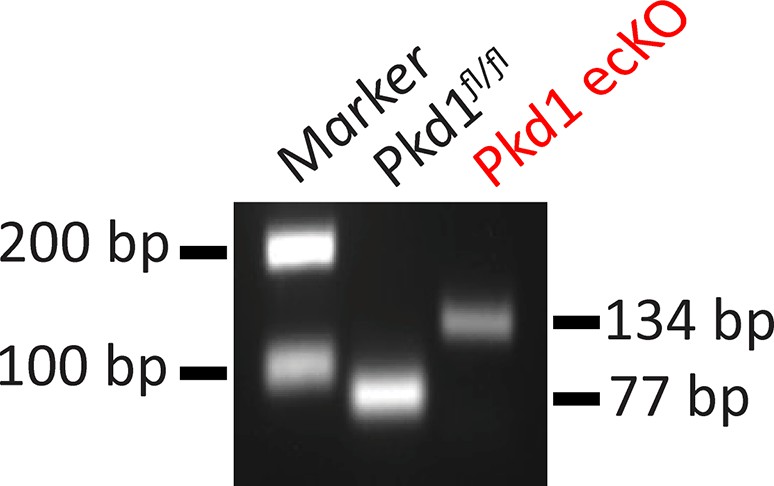
Genomic PCR indicating that tamoxifen stimulated Cre-recombination in mesenteric arteries of Pkd1fl/fl: Cdh5(PAC)-CreERT2 mice.
Representative of four separate experiments.
Figure 2 with 1 supplement
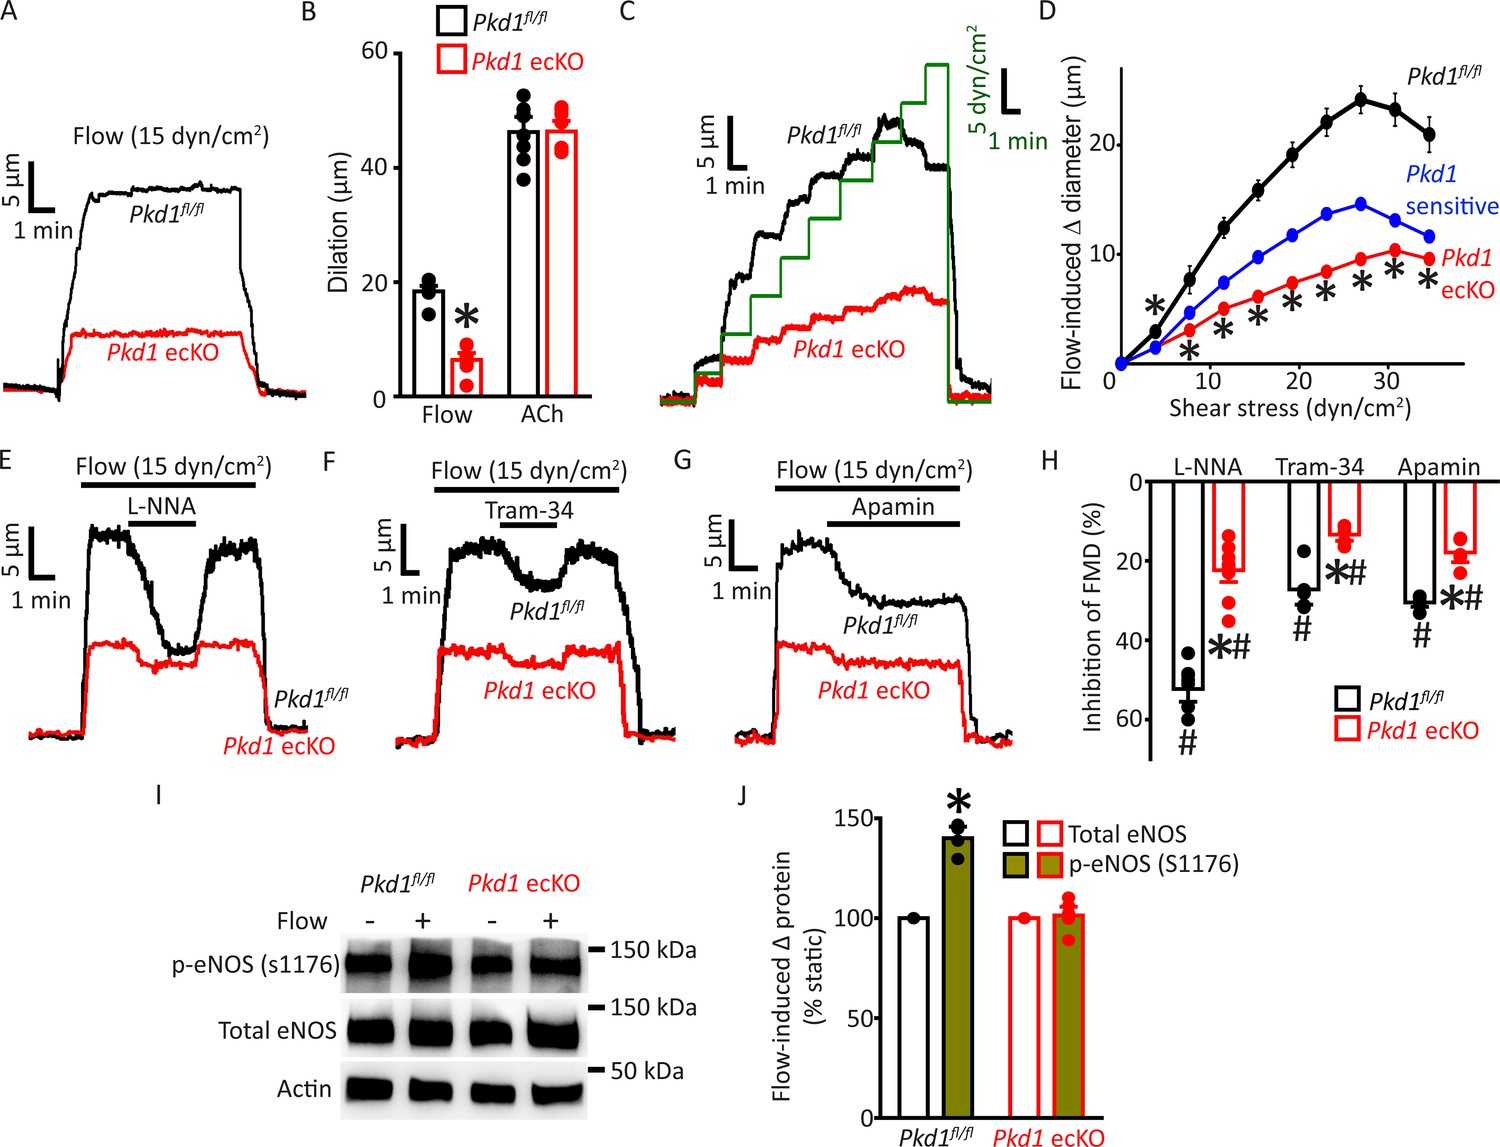
Endothelial cell PC-1 stimulates vasodilation via eNOS, IK channel, and SK channel activation.
(A) Representative traces illustrating reversible flow-mediated dilation in pressurized (80 mmHg) mesenteric arteries of Pkd1fl/fl and Pkd1 ecKO mice. (B) Mean dilation to flow (15 dyn/cm2) or ACh (10 µM). *p<0.05 versus Pkd1fl/fl. n=8 for each data set. (C) Representative diameter changes to stepwise increases in intravascular flow in pressurized (80 mmHg) mesenteric arteries from Pkd1fl/fl and Pkd1 ecKO mice. (D) Mean data. The Pkd1-sensitive component of flow-mediated vasodilation is shown in blue. n=4 each for Pkd1fl/fl and Pkd1 ecKO. *p<0.05 versus Pkd1fl/fl. (E–G) Regulation of flow (15 dyn/cm2)-mediated dilation by L-NNA (10 µM), apamin (300 nM), and Tram-34 (300 nM) in pressurized (80 mmHg) mesenteric arteries of Pkd1fl/fl and Pkd1 ecKO mice. (H) Mean data for inhibition of flow-mediated vasodilation (FMD) by L-NNA (Pkd1fl/fl n=8, Pkd1 ecKO n=10), Tram-34 (Pkd1fl/fl n=5, Pkd1 ecKO n=5), and apamin (Pkd1fl/fl n=5, Pkd1 ecKO n=5). Symbols illustrate #p<0.05 versus flow in the same genotype and *p<0.05 versus Pkd1fl/fl in the same condition. (I) Original Western blots illustrating effects of flow (15 dyn/cm2, 5 min, 37°C) on p-eNOS (S1176) and total eNOS proteins in Pkd1fl/fl and Pkd1 ecKO mesenteric arteries. (J) Mean data for flow-induced change (Δ) in proteins. Pkd1fl/fl n=4, Pkd1 ecKO n=6. * indicates p<0.05 versus static in the same genotype.
Figure 2—figure supplement 1
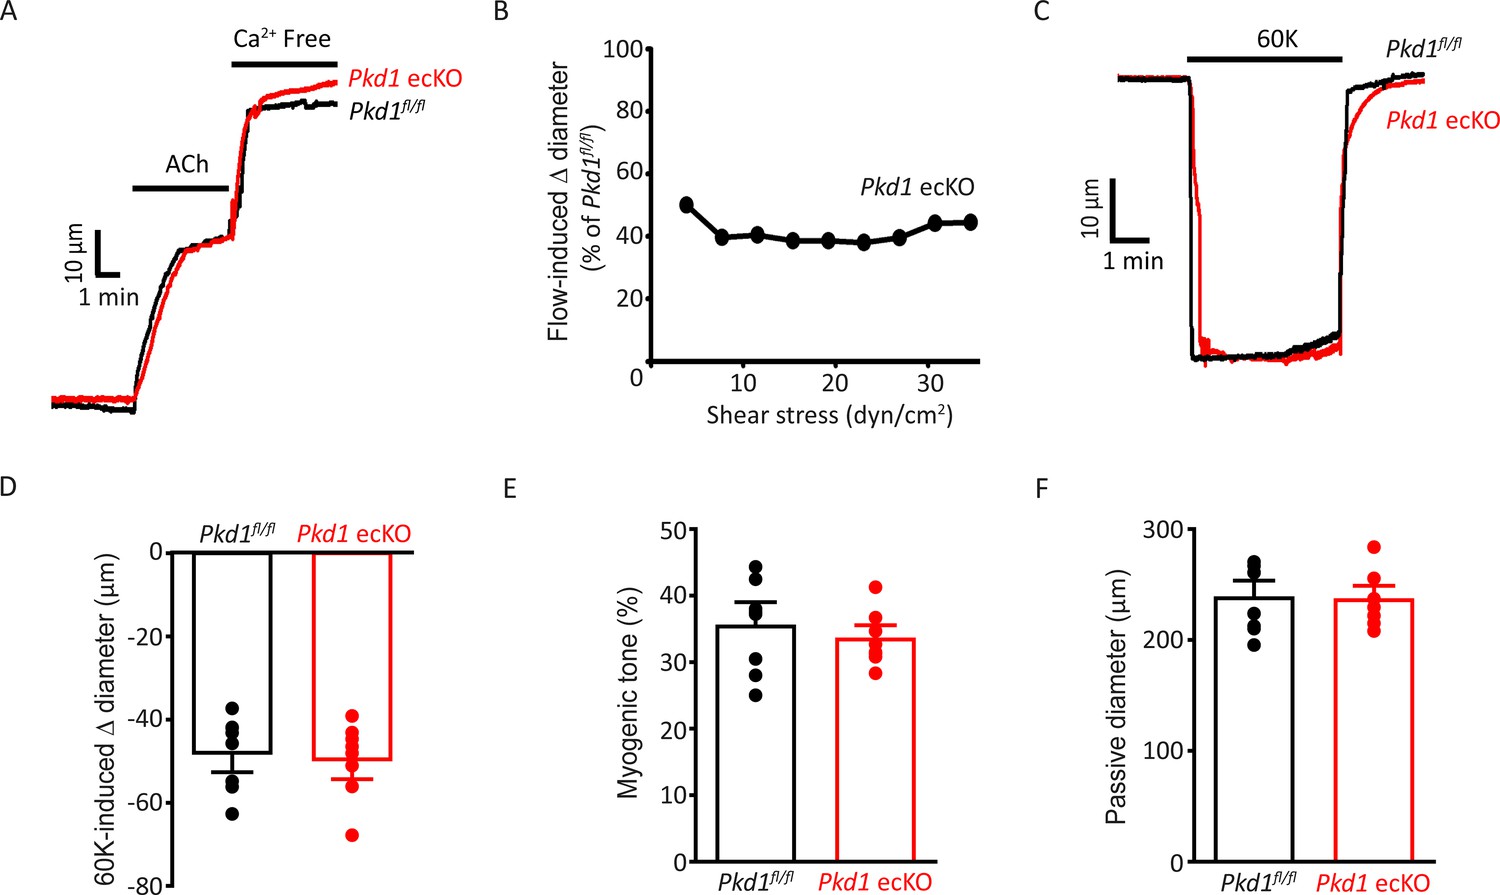
Depolarization-induced vasoconstriction and passive diameter are similar in Pkd1fl/fl and Pkd1 ecKO arteries.
(A) Representative traces illustrating dilations to ACh (10 µM) and Ca2+-free bath solution in pressurized (80 mmHg) Pkd1fl/fl and Pkd1 ecKO arteries. (B) PC-1 knockout attenuates flow-mediated dilation over a broad shear stress range in pressurized (80 mmHg) mesenteric arteries. n=4 for each shear stress value. (C) Representative traces illustrating constriction to 60 mM K+ in pressurized (10 mmHg) arteries. (D) Mean data for 60 mM K+-induced constriction. n=8 for each data set. (E) Mean myogenic tone at 80 mmHg. n=8 for each data set. (F) Mean data for passive diameter (Ca2+-free PSS) in pressurized (80 mmHg) arteries. n=8 for each.
Figure 3 with 1 supplement

Pkd1 ecKO mice are hypertensive with normal kidney anatomy.
(A) Blood pressure recordings obtained over 24 hr in a Pkd1fl/fl and Pkd1 ecKO mouse. (B) Mean arterial pressures (MAPs) in Pkd1fl/fl (n=5) and Pkd1 ecKO (n=7) mice. *p<0.05 versus Pkd1fl/fl. (C) Mean heart rate (HR). Pkd1fl/fl, n=5, Pkd1 ecKO, n=7. (D) Images of H&E-stained kidney cortex used for histological measurements. Scale bars=100 µm (E) Mean proximal tubule length. n=15 proximal tubules measured in each mouse, n=3 mice. (F) Mean glomeruli surface area. n=75 glomeruli measured from each mouse, n=3 mice. H&E, hematoxylin and eosin.
Figure 3—figure supplement 1
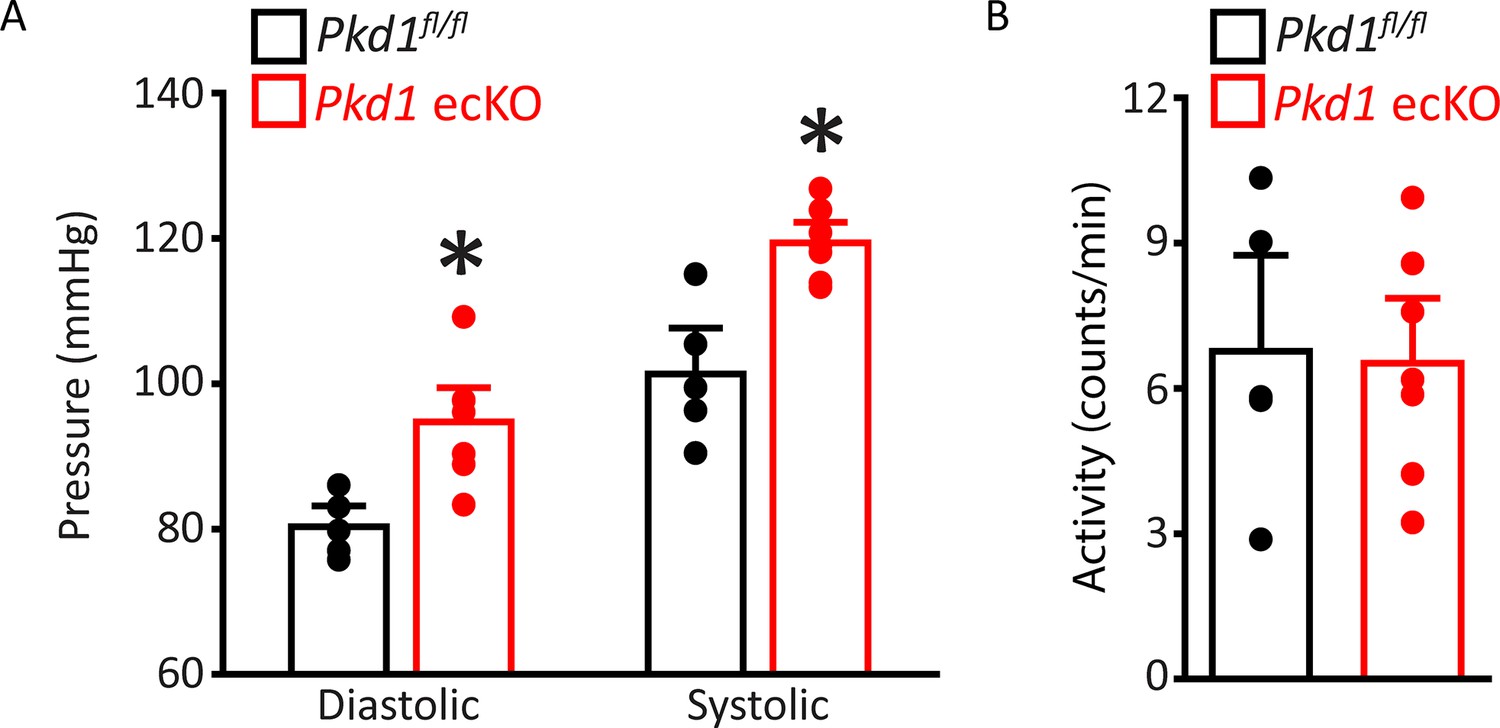
Diastolic and systolic blood pressures are higher in Pkd1 ecKO mice.
(A) Mean diastolic and systolic blood pressures for Pkd1fl/fl (n=5) and Pkd1 ecKO (n=7) mice. *=p<0.05 versus Pkd1fl/fl. (B) Mean data for Pkd1fl/fl (n=5) and Pkd1 ecKO (n=7) mouse activity.
Figure 4 with 1 supplement
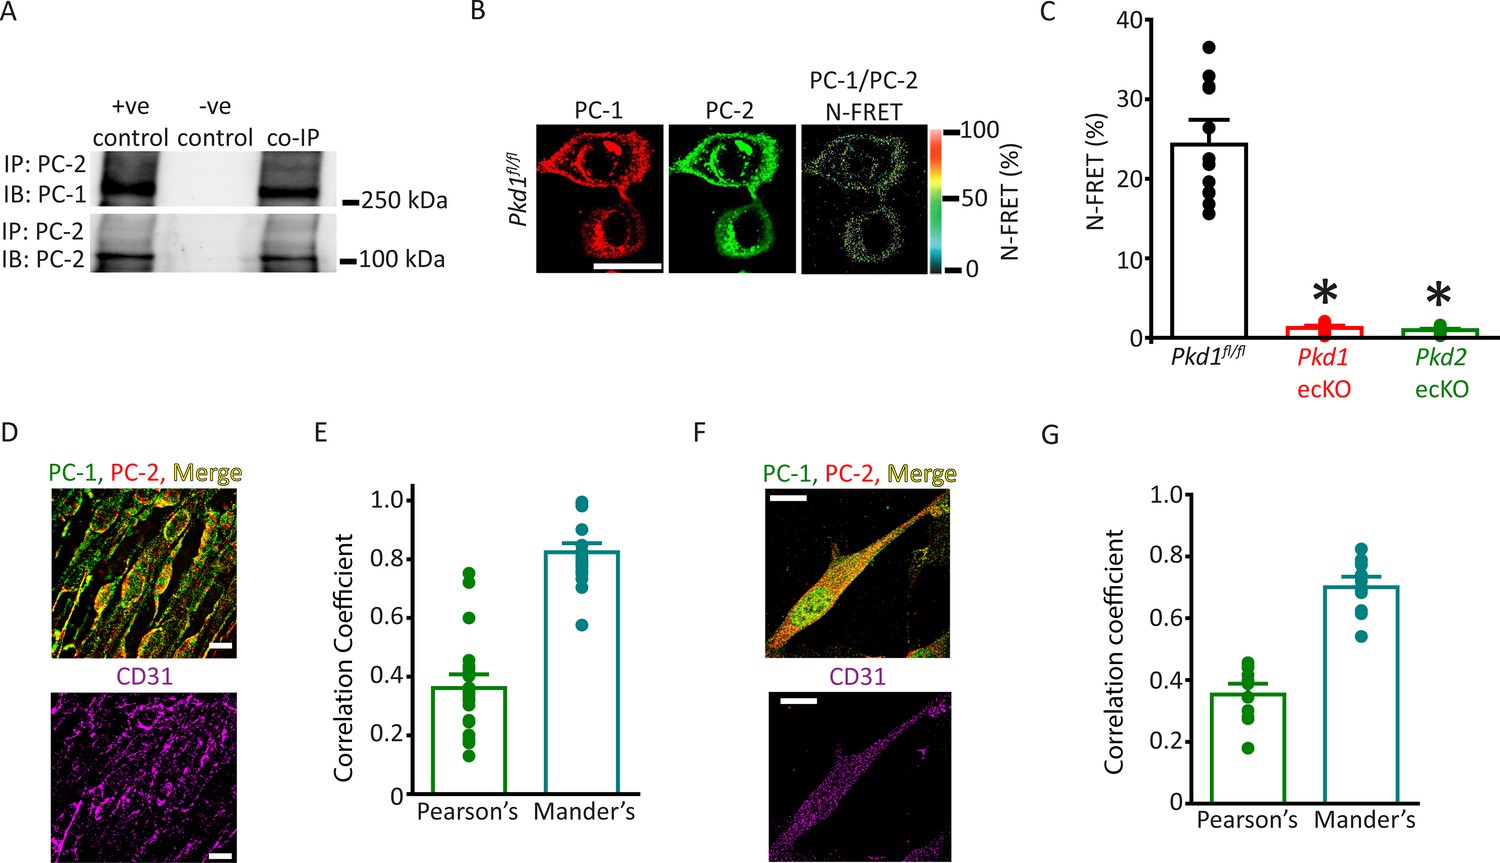
PC-1 and PC-2 coassemble and colocalize in endothelial cells (ECs).
(A) Representative Western blots illustrating the immunoblot (IB) detection of both PC-1 and PC-2 in PC-2 immunoprecipitate (IP) (n=5). (B) PC-1 (Alexa546) and PC-2 (Alexa488) antibody labeling generate FRET in mesenteric artery ECs of Pkd1fl/fl mice that are abolished in ECs of Pkd1 ecKO and Pkd2 ecKO mice. Scale bar=10 µm. (C) Mean data for immunoFRET experiments (Pkd1fl/fl n=12, Pkd1 ecKO n=10, Pkd2 ecKO n=10). *p<0.05 versus Pkd1fl/fl. (D) Lattice SIM images of PC-1, PC-2, and CD31 immunofluorescence in the same ECs of an en face mesenteric artery. The merged image is also shown with yellow pixels illustrating colocalization of PC-1 and PC-2. Scale bars=10 µm. (E) Mean data for PC-1 and PC-2 colocalization using both Pearson’s and Mander’s correlation coefficients. n=25 images, 12 arteries and 6 mice for each data set. (F) Lattice SIM image of PC-1 and PC-2 immunofluorescence in a mesenteric artery EC. Yellow pixels illustrate PC-1 to PC-2 colocalization. Scale bar=10 µm. (G) Mean data for PC-1 and PC-2 colocalization when using Pearson’s and Mander’s correlation coefficients. n=13, four mice for each data set. FRET, fluorescence energy transfer.
Figure 4—figure supplement 1
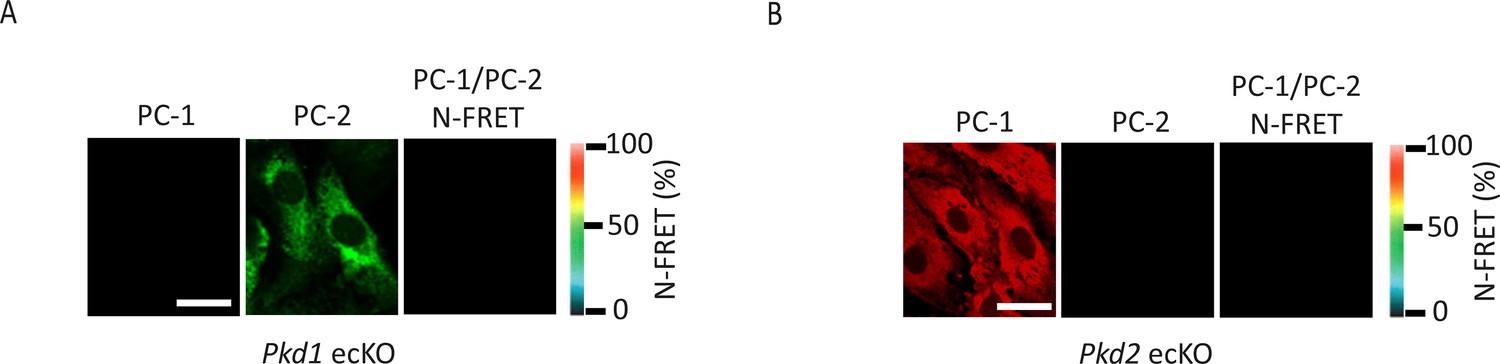
PC-1 or PC-2 knockout abolishes immunoFRET in endothelial cells (ECs).
PC-1 (Alexa546) and PC-2 (Alexa488) antibody labeling and FRET in mesenteric artery ECs of Pkd1 ecKO (A) and Pkd2 ecKO (B) mice. Scale bars=10 µm. immunoFRET, immunofluorescence energy transfer.
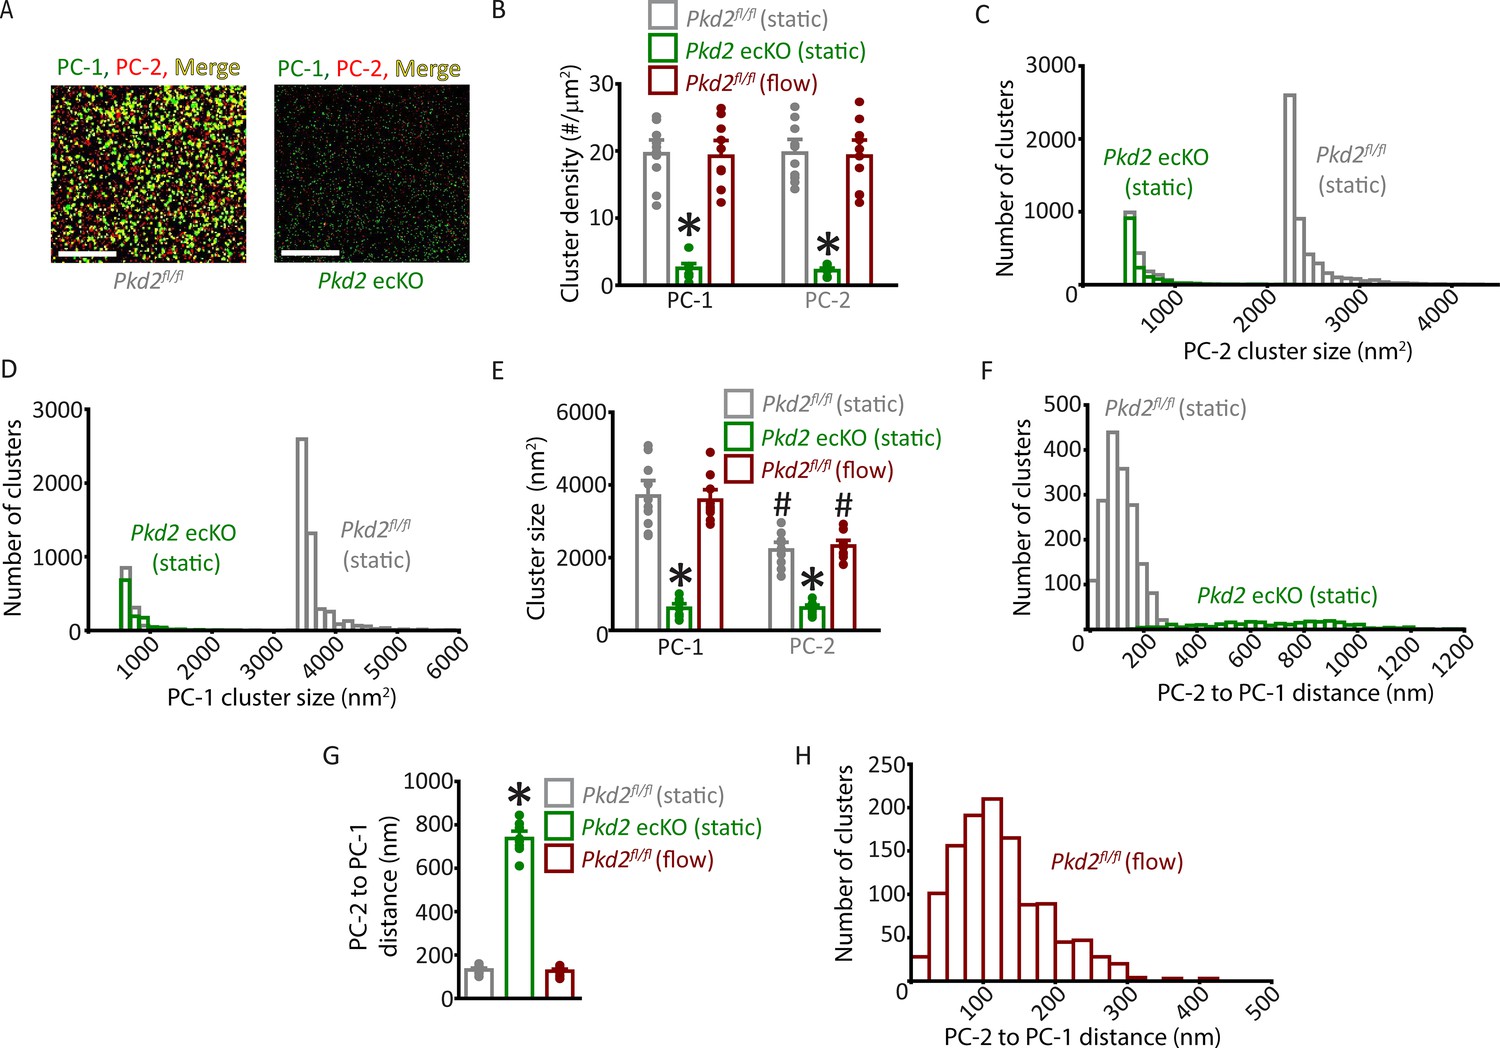
Figure 5 with 4 supplements
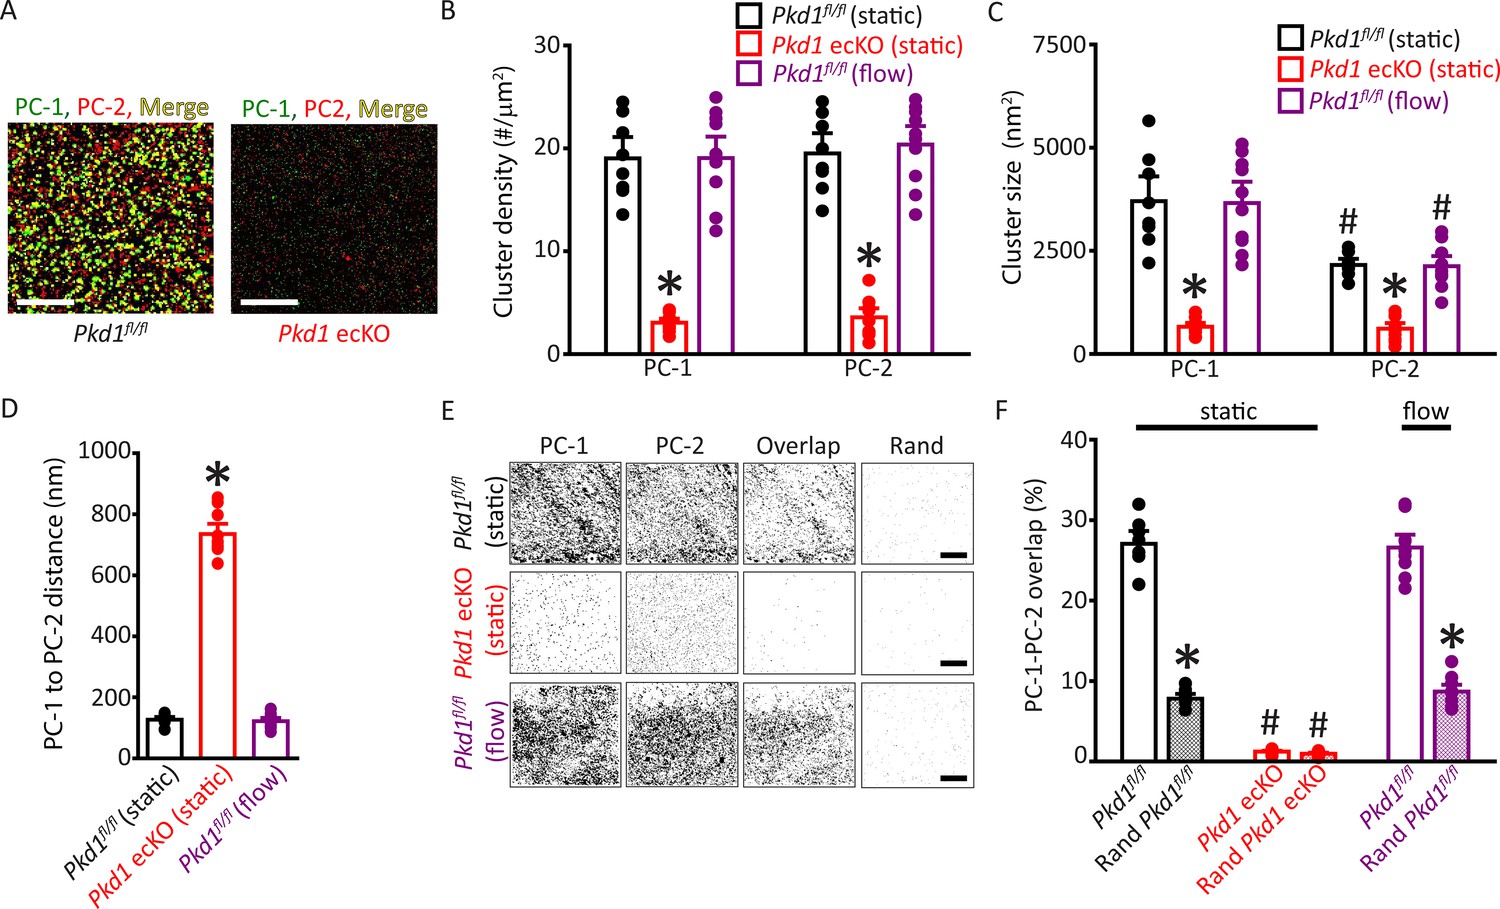
Plasma membrane PC-1 and PC-2 clusters colocalize in endothelial cells (ECs).
(A) TIRF-SMLM images of PC-1 and PC-2 surface clusters in a Pkd1fl/fl and Pkd1 ecKO EC. Scale bars=5 µm. (B) Mean data for PC-1 and PC-2 cluster density measured in Pkd1fl/fl and Pkd1 ecKO ECs under static and flow (10 ml/min) conditions. n=8 for Pkd1fl/fl (static), n=10 for Pkd1 ecKO (static), and n=10 for Pkd1fl/fl (flow). *p<0.05 versus Pkd1fl/fl (static). (C) Mean data for PC-1 and PC-2 cluster sizes measured in Pkd1fl/fl and Pkd1 ecKO ECs under static and flow (10 ml/min) conditions. n=8 for Pkd1fl/fl (static), n=10 for Pkd1 ecKO (static), and n=10 for Pkd1fl/fl (flow). *p<0.05 versus respective floxed control in static, #p<0.05 versus PC-1 cluster size in the same genotype under the same condition. (D) Mean data for PC-1 to PC-2 nearest-neighbor analysis. n=8 for Pkd1fl/fl (static), n=10 for Pkd1 ecKO (static) and n=10 for Pkd1fl/fl (flow). *p<0.05 versus Pkd1fl/fl static and Pkd1fl/fl flow. (E) TIRF-SMLM images of PC-1 and PC-2 clusters, overlap of PC-1 and PC-2 data and overlap of PC-1 and PC-2 data following Coste’s randomization (Rand) simulation in Pkd1fl/fl and Pkd1 ecKO cells. Scale bars=5 µm. (F) Mean experimental and Costes’ randomized (Rand) data for PC-1 to PC-2 overlap in Pkd1fl/fl cells in static and flow and Pkd1 ecKO cells in static. n=8 for Pkd1fl/fl (static), n=10 for Pkd1 ecKO (static), and n=10 for Pkd1fl/fl (flow). *p<0.05 versus respective floxed control in static condition, #p<0.05 versus Pkd1fl/fl static. SMLM, single-molecule localization microscopy; TIRF, total internal reflection fluorescence.
Figure 5—figure supplement 1
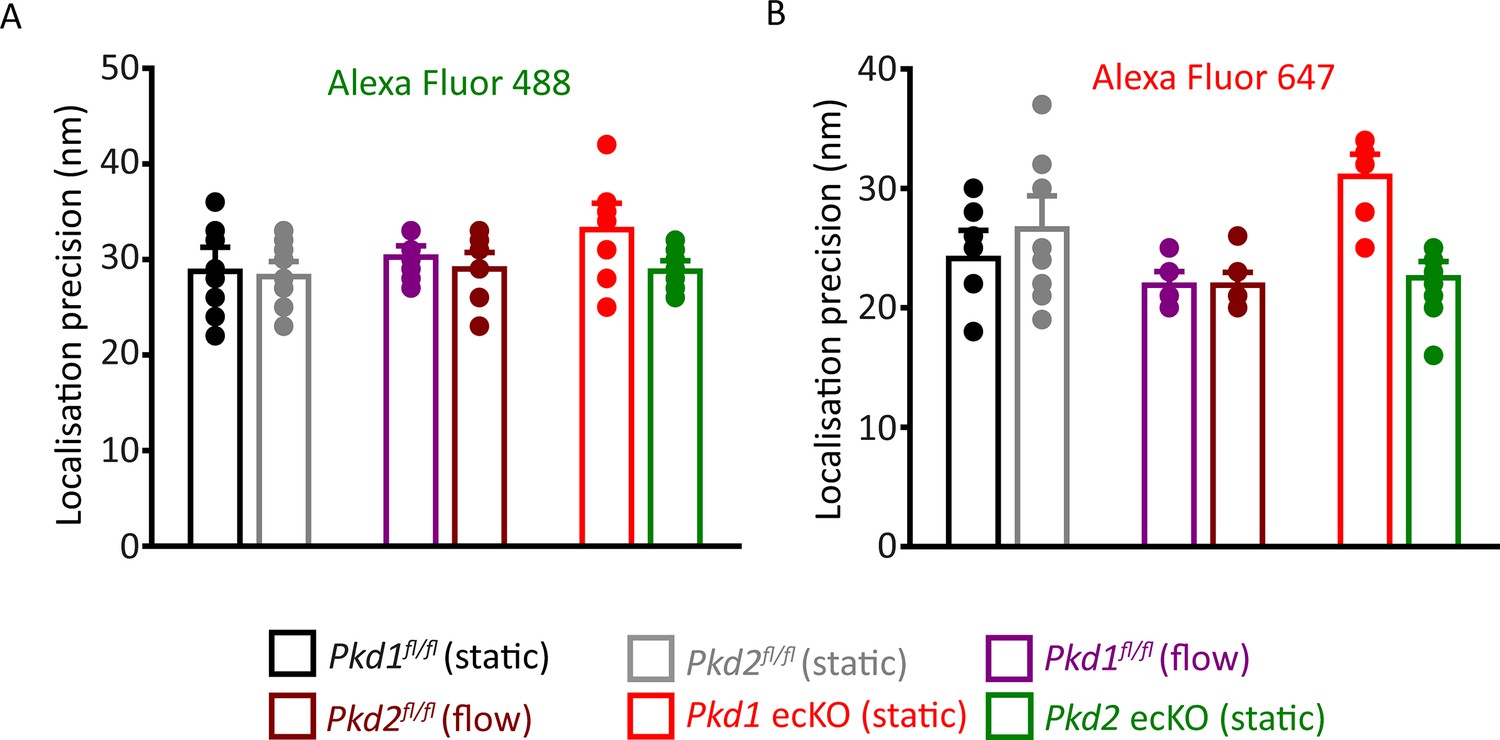
Localization precision of fluorophores used in SMLM experiments.
Mean data illustrating the localization precision (FWHM) of Alexa Fluor 488 (A)- and Alexa Fluor 647 (B)-tagged secondary antibodies in ECs under all conditions when imaged using SMLM. (A) Experimental numbers for Alexa Fluor 488 in Pkd1fl/fl (static), Pkd2fl/fl (static), Pkd1fl/fl (flow), Pkd2fl/fl (flow), Pkd1 ecKO (static), and Pkd2 ecKO (static) are 8, 10, 10, 10, 10, and 9, respectively. (B) Experimental numbers for Alexa Fluor 647 in Pkd1fl/fl (static), Pkd2fl/fl (static), Pkd1fl/fl (flow), Pkd2fl/fl (flow), Pkd1 ecKO (static), and Pkd2 ecKO (static) are 8, 10, 10, 10, 10, and 9, respectively. Numbers provided in the results are the combined means of all data collected for Alexa Fluor 488 and Alexa Fluor 647 in all genotypes in static and flow. SMLM, single-molecule localization microscopy.
Figure 5—figure supplement 2
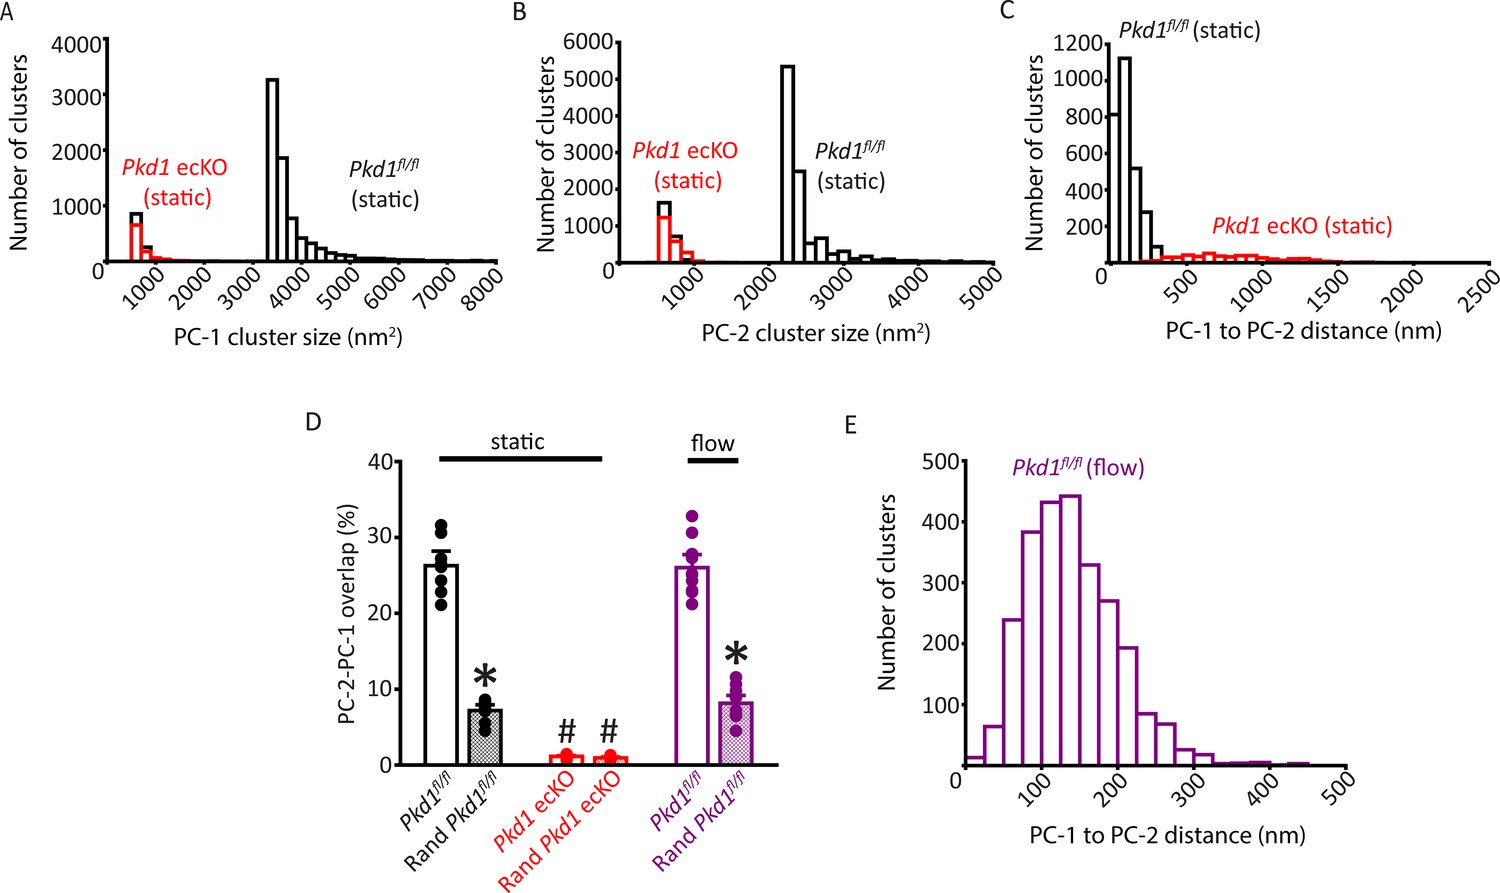
Properties of PC-1 and PC-2 clusters and their spatial proximity and overlap in Pkd1fl/fl and Pkd1 ecKO endothelial cells (ECs).
(A) Histogram illustrating PC-1 cluster size distribution in a Pkd1fl/fl (static) and Pkd1 ecKO (static) EC. (B) Histogram illustrating PC-2 cluster sizes in a Pkd1fl/fl (static) and Pkd1 ecKO (static) EC. (C) Histograms illustrating the distance from each PC-1 cluster to its nearest PC-2 neighbor in a Pkd1fl/fl and Pkd1 ecKO EC. (D) Mean experimental and randomized data for PC-2 to PC-1 overlap in Pkd1fl/fl cells in static and flow and Pkd1 ecKO cells in static. n=10 for Pkd2fl/fl (static), n=9 for Pkd2 ecKO (static), and n=10 for Pkd2fl/fl (flow). *p<0.05 versus respective floxed control in static condition, #p<0.05 versus Pkd1fl/f static. (E) Histogram illustrating the distance from each PC-1 cluster to its nearest PC-2 neighbor in a Pkd1fl/fl EC under flow (10 ml/min).
Figure 5—figure supplement 3
Properties of PC-1 and PC-2 surface clusters in endothelial cells (ECs) of Pkd2fl/fl and Pkd2 ecKO mice.
(A) TIRF-SMLM images of PC-1 and PC-2 surface clusters in a Pkd2fl/fl and Pkd2 ecKO EC. Scale bars = 5 µm. (B) Mean data for PC-1 and PC-2 cluster density measured in Pkd2fl/fl and Pkd2 ecKO ECs under static and flow conditions. Experimental numbers for Pkd2fl/fl static, Pkd2 ecKO static and Pkd2fl/fl flow are 10, 9 and 10 for PC-1 and PC-2. * P < 0.05 versus Pkd2fl/fl (static). (C) Histogram of individual PC-2 cluster sizes in a Pkd2fl/fl (static) and Pkd2 ecKO (static) EC. (D) Histogram of individual PC-1 cluster sizes in a Pkd2fl/fl (static) and Pkd2 ecKO (static) EC. (E) Mean data for PC-1 and PC-2 cluster sizes measured in Pkd2fl/fl and Pkd2 ecKO ECs under static and flow (10 ml/min) conditions. Experimental numbers for Pkd2fl/fl static, Pkd2 ecKO static, and Pkd2fl/fl flow are 10, 9, and 10 for PC-1 and PC-2. *p<0.05 versus same protein in Pkd2fl/fl static, #p<0.05 versus PC-1 in same condition. (F) Histogram illustrating the distance from each PC-2 cluster to its nearest PC-1 neighbor in a Pkd2fl/fl and Pkd2 ecKO EC. (G) Mean data for distance from each PC-2 cluster to its nearest PC-1 neighbor. n=10 for Pkd2fl/fl static, n=9 for Pkd2 ecKO static, n=10 for Pkd2fl/fl flow. *p<0.05 versus Pkd2fl/fl static and Pkd2fl/fl flow. (H) Histogram illustrating the distance from each PC-2 cluster to the nearest PC-1 neighbor in a Pkd2fl/fl EC under flow (10 ml/min). SMLM, single-molecule localization microscopy; TIRF, total internal reflection fluorescence.
Figure 5—figure supplement 4
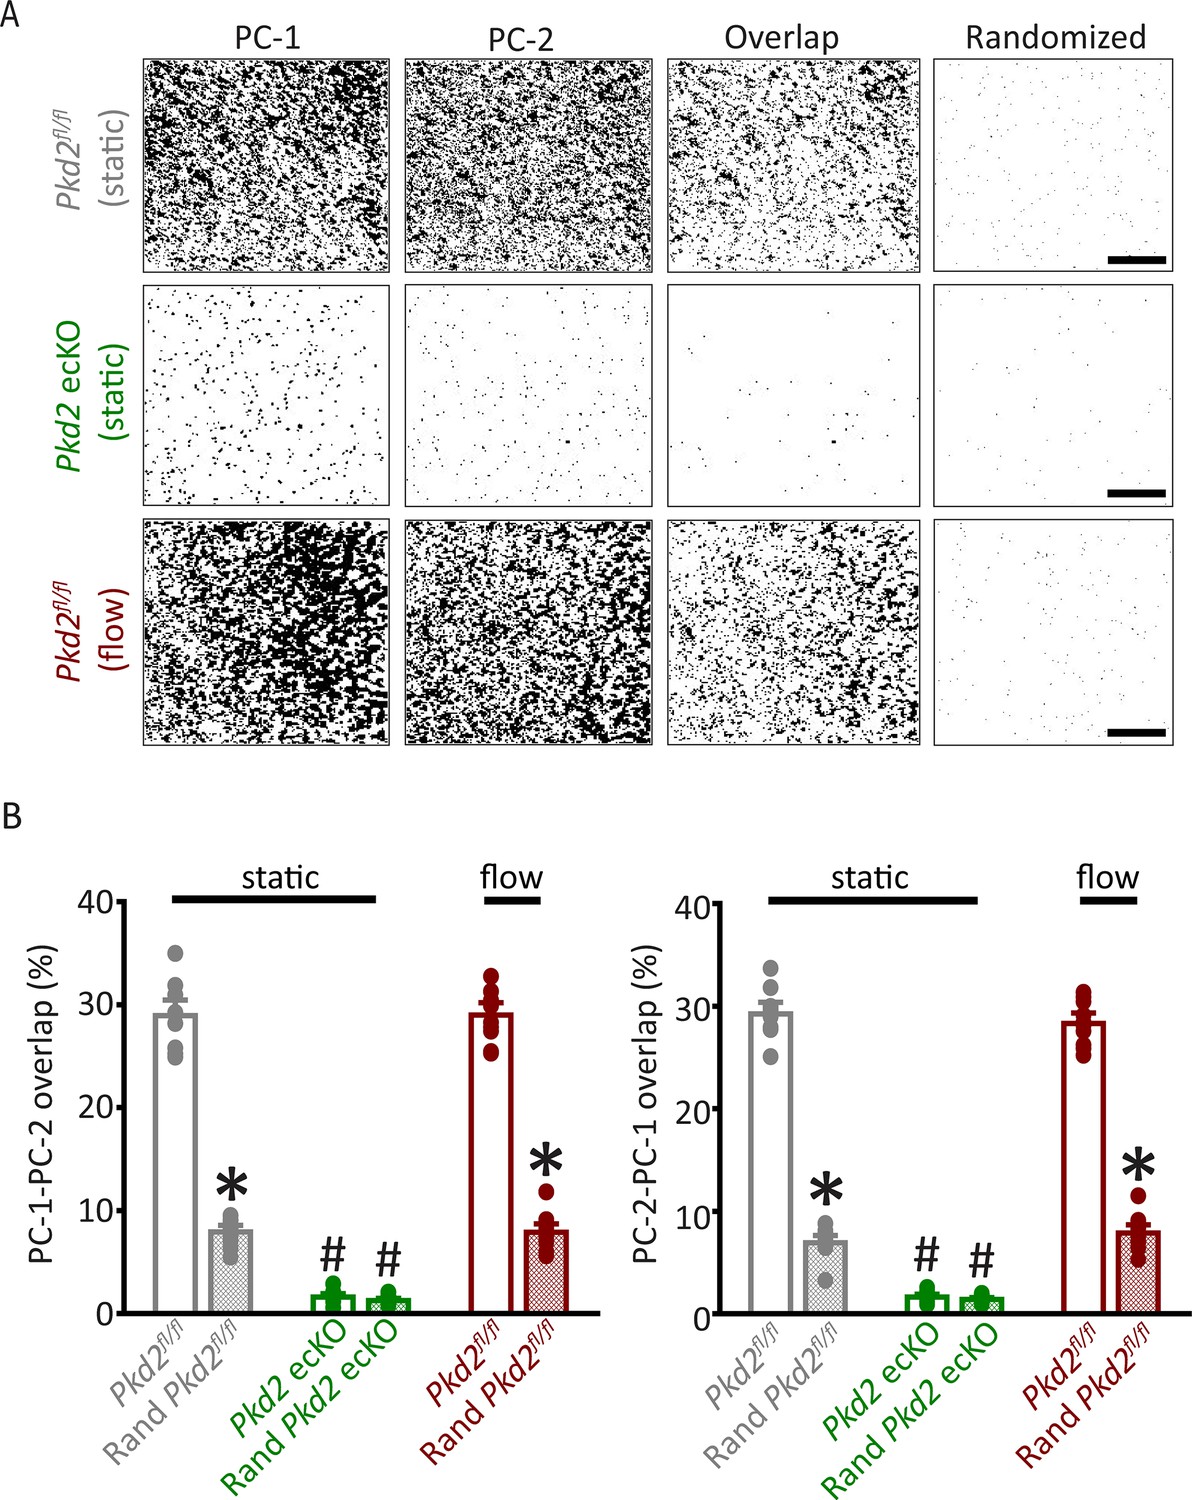
Analysis of PC-1 and PC-2 cluster overlap in endothelial cells of Pkd2fl/fl and Pkd2 ecKO mice.
(A) TIRF-SMLM images of PC-1 and PC-2 clusters, overlap of PC-1 and PC-2 data and overlap of PC-1 and PC-2 data following Costes’ randomization simulation. Scale bars = 5 µm. (B) Mean experimental and randomized overlap data for PC-1 to PC-2 and PC-2 to PC-1 in Pkd2fl/fl and Pkd2 ecKO cells. n=10 for Pkd2fl/fl static, n=9 for Pkd2 ecKO static, and n=10 for Pkd2fl/fl flow. *p<0.05 versus flox under the same condition, #p<0.05 versus Pkd2fl/fl static. SMLM, single-molecule localization microscopy; TIRF, total internal reflection fluorescence.
Figure 6 with 2 supplements
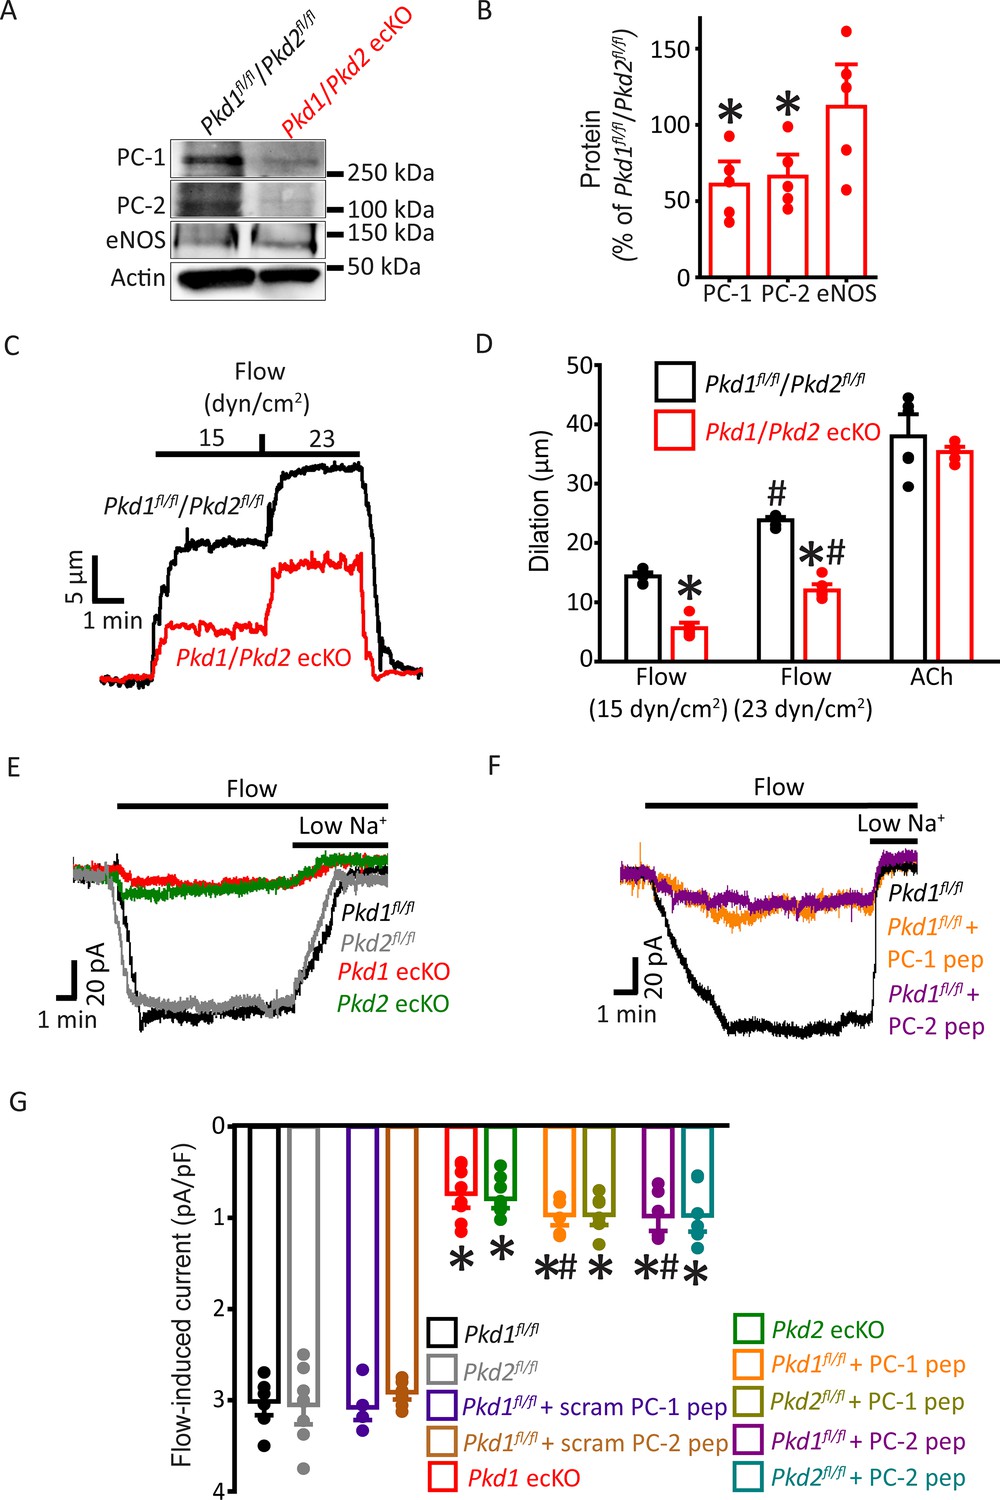
PC-1 and PC-2 are interdependent for flow-mediated vasodilation and ICat activation in mesenteric artery endothelial cells (ECs).
(A) Representative Western blots of PC-1, PC-2, and eNOS in mesenteric arteries of Pkd1fl/fl/Pkd2fl/fl and Pkd1/Pkd2 ecKO mice. (B) Mean data. *p<0.05 versus Pkd1fl/fl/Pkd2fl/fl. n=5 for each data set. (C) Representative traces illustrating flow-mediated dilation by 15 and 23 dyn/cm2 shear stress in pressurized (80 mmHg) mesenteric arteries of Pkd1fl/fl/Pkd2fl/fl and Pkd1/Pkd2 ecKO mice. (D) Mean dilation to flow (15 and 23 dyn/cm2) or ACh (10 µM). n=6 each for 15, 23 dyn/cm2, and ACh. *p<0.05 versus Pkd1fl/fl/Pkd2fl/fl. #p<0.05 versus 15 dyn/cm2 in the same genotype. (E) Original recordings illustrating that flow (10 ml/min) activates ICats in Pkd1fl/fl and Pkd2fl/fl ECs that are similarly attenuated in PC-1 ecKO and PC-2 ecKO ECs. (F) Intracellular introduction via the patch pipette of either a PC-1 or PC-2 C-terminus coiled-coil domain peptide reduces flow-induced ICats in Pkd1fl/fl ECs. Traces shown in (E) and (F) are recorded from different ECs. (G) Mean data. PC-1 pep and PC-2 pep indicate peptides corresponding to the coiled-coil domains in PC-1 and PC-2, respectively. Pkd1fl/fl n=7, Pkd2fl/fl n=8, Pkd1fl/fl+ scrambled (scram) PC-1 pep n=6, Pkd1fl/fl+ scram PC-2 pep n=7, Pkd1 ecKO n=8, Pkd2 ecKO n=9, Pkd1fl/fl+ PC-1 peptide n=6, Pkd2fl/fl+ PC-1 peptide n=7, Pkd1fl/fl+ PC-2 peptide n=6, and Pkd2fl/fl+ PC-2 peptide n=7. *p<0.05 versus no peptide in same genotype. #p<0.05 versus respective scrambled peptide in same genotype.
Figure 6—figure supplement 1
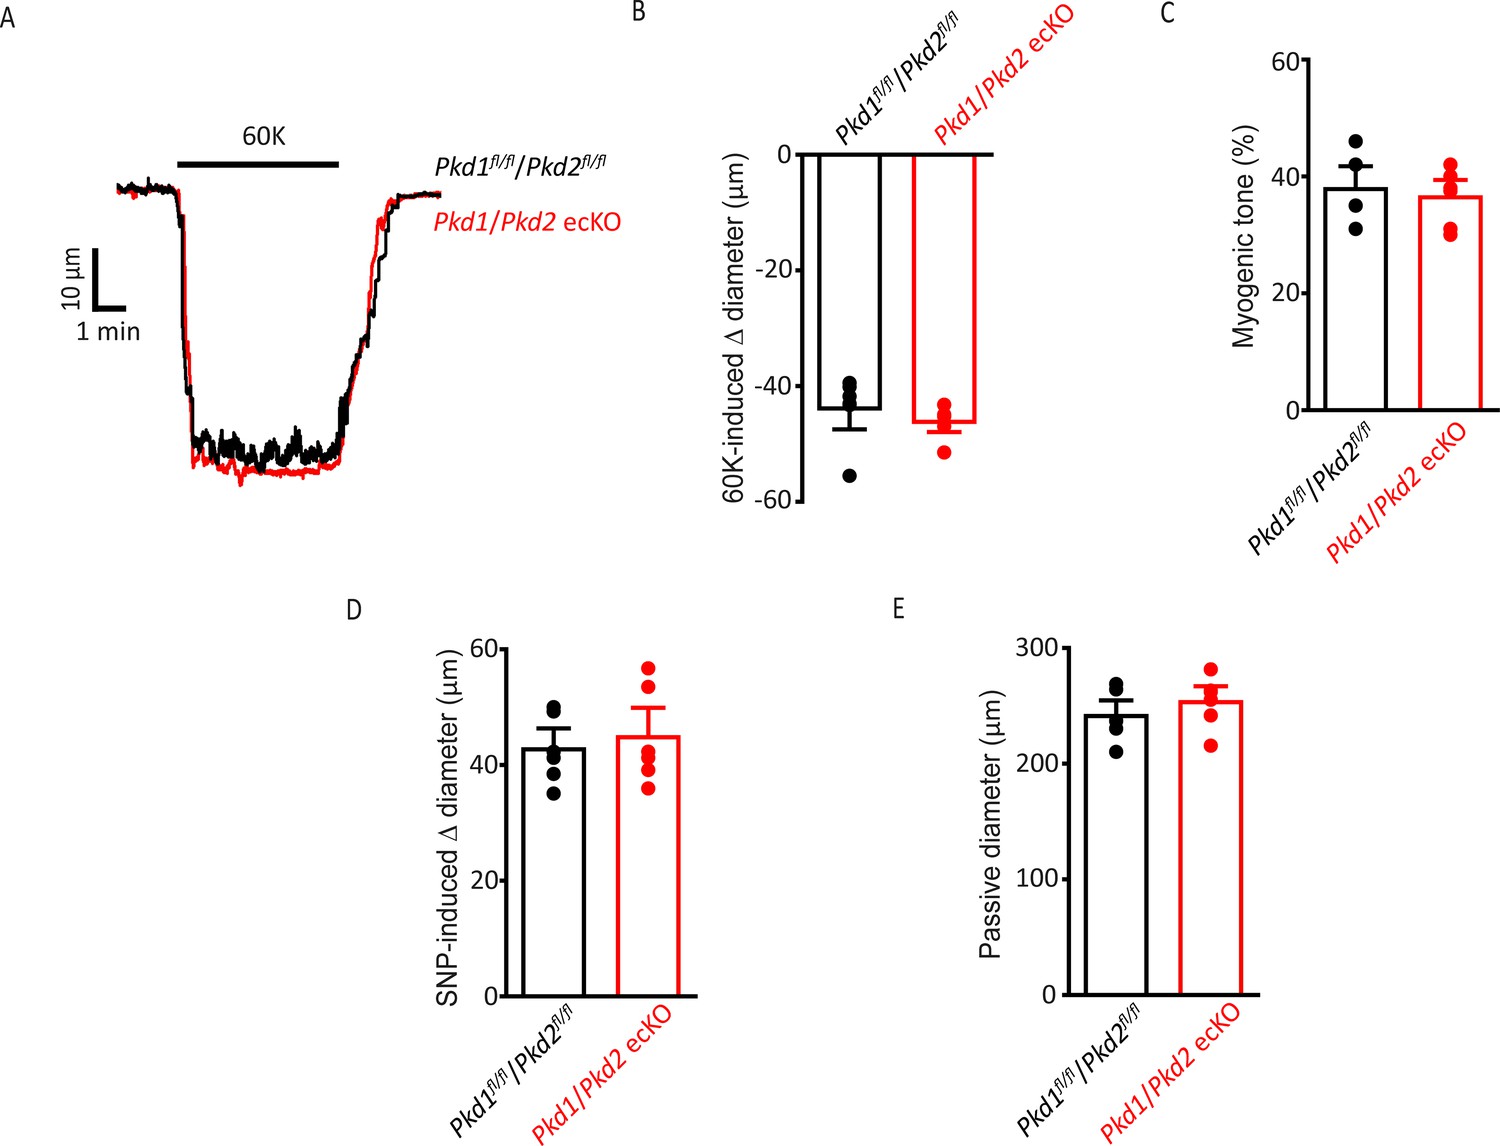
Smooth muscle-specific vasoconstriction and vasodilation and passive diameter are unaltered in Pkd1/Pkd2 ecKO mouse arteries.
(A) Representative traces illustrating 60 mM-induced K+ constriction in a pressurized (10 mmHg) Pkd1fl/fl/Pkd2fl/fl and Pkd1/Pkd2 ecKO artery. (B) Mean data for 60 mM K+-induced constriction. n=6 for each data set. (C) Mean myogenic tone in pressurized (80 mmHg) mesenteric arteries from Pkd1fl/fl/Pkd2fl/fl and Pkd1/Pkd2 ecKO mice. n=6 for each data set. (D) Mean data for SNP (10 µM)-induced dilation in pressurized (10 mmHg) Pkd1fl/fl/Pkd2fl/fl and Pkd1/Pkd2 ecKO arteries. n=6 for each data set. (E) Mean data for passive diameter in pressurized (80 mmHg) arteries. n=6 for each data set.
Figure 6—figure supplement 2

Scrambled PC-1 and PC-2 peptides do not alter flow-activated ICat in endothelial cells (ECs).
Original recordings illustrating that intracellular introduction via the patch pipette of either a PC-1 scrambled (scram) peptide or a PC-2 scrambled peptide does not alter flow (10 ml/min)-activated ICat in Pkd1fl/fl ECs. Each trace is recorded from a different EC.
Tables
Key resources table
| Reagent type (species) or resource | Designation | Source or reference | Identifiers | Additional information |
|---|---|---|---|---|
| Strain, strain background (Mus musculus) | Pkd1fl/fl | Baltimore PKD Core Center | PMID:15579506MGI: 3617325 | Mice with Pkd1 gene flanked by loxP regions. |
| Strain, strain background (M. musculus) | Pkd2fl/fl | Baltimore PKD Core Center | PMID:20862291MGI: 4843127 | Mice with Pkd2 gene flanked by loxP regions. |
| Strain, strain background (M. musculus) | Pkd1fl/fl /Pkd2fl/fl | This paper | Mouse line created in-house by mating Pkd1fl/fl with Pkd2fl/fl. Mice with Pkd1 and Pkd2 genes flanked by loxP regions. | |
| Strain, strain background (M. musculus) | Cdh5(PAC)-CreERT2 | Cancer Research UK | RRID: MGI: 3848982 | Mice with tamoxifen-inducible Cre recombinase that is expressed specifically in endothelial cells. |
| Strain, strain background (M. musculus) | Pkd1fl/fl: Cdh5(PAC)-CreERT2 | This paper | Mouse line created in-house by mating Pkd1fl/fl with Cdh5(PAC)-CreERT2. Mice with inducible endothelial cell-specific deletion of PC-1. | |
| Strain, strain background (M. musculus) | Pkd2fl/fl: Cdh5(PAC)-CreERT2 | PMID:32364494 | Mouse line created in-house by mating Pkd2fl/fl with Cdh5(PAC)-CreERT2. Mice with inducible endothelial cell-specific deletion of PC-2. | |
| Strain, strain background (M. musculus) | Pkd1fl/fl/Pkd2fl/fl: Cdh5(PAC)-CreERT2 | This paper | Mouse line created in-house by mating Pkd1fl/fl Cdh5(PAC)-CreERT2 with Pkd2fl/fl Cdh5(PAC)-CreERT2. Mice with inducible endothelial cell-specific deletion both PC-1 and PC-2. | |
| Antibody | Anti-PC-1 (mouse monoclonal) | Baltimore PKD Core | Mouse mAB SF4AZ E3 | IF (1:100)Lattice SIM (1:100)SMLM (1:100) |
| Antibody | Anti-PC-2 (rabbit monoclonal) | Baltimore PKD Core | Rabbit mAB 3374 CT-14/4 | IF (1:100)Lattice SIM (1:100)SMLM (1:100) |
| Antibody | Anti-CD31 (rat monoclonal) | Abcam | Cat. #: Ab7388RRID: AB_305905 | IF (1:100)Lattice SIM (1:100)SMLM (1:100) |
| Antibody | Anti-PC-1 (H-260)(rabbit polyclonal) | Santa Cruz Biotechnology | Cat. #: sc-25570, RRID: AB_2163357 | N-FRET (1:100) |
| Antibody | Anti-PC-2 (mouse monoclonal) | Santa Cruz Biotechnology | Cat. #: sc-28331, RRID: AB_672377 | N-FRET (1:100) |
| Antibody | Alexa 488-conjugated anti-rat IgG (donkey polyclonal) | Thermo Fisher Scientific | Cat. #: A-21208,RRID: AB_2535794 | IF (1:500) |
| Antibody | Alexa 546-conjugated anti-mouse IgG (donkey polyclonal) | Thermo Fisher Scientific | Cat. #: A-10036,RRID: AB_2534012 | IF (1:500) |
| Antibody | Alexa 488-conjugated anti-mouse IgG (donkey polyclonal) | Thermo Fisher Scientific | Cat. #: A-21202,RRID: AB_141607 | Lattice SIM (1:500) SMLM (1:500) |
| Antibody | Alexa 546-conjugated anti-rabbit IgG (donkey polyclonal) | Thermo Fisher Scientific | Cat. #: A-10040,RRID: AB_2534016 | Lattice SIM(1:500) |
| Antibody | Alexa 647-conjugated anti-rat IgG (goat polyclonal) | Thermo Fisher Scientific | Cat. #: A-21247,RRID: AB_141778 | Lattice SIM(1:500) |
| Antibody | Alexa 555-conjugated anti-rat IgG (goat polyclonal) | Thermo Fisher Scientific | Cat. #: A-21434,RRID: AB_2535855 | SMLM (1:500) |
| Antibody | Alexa 647-conjugated anti-rabbit IgG (donkey polyclonal) | Thermo Fisher Scientific | Cat. #: A-31573,RRID: AB_2536183 | SMLM (1:500) |
| Antibody | Alexa Fluor 488-conjugated anti-mouse (goat polyclonal) | Thermo Fisher Scientific | Cat. #: A-11001, RRID: AB_2534069 | N-FRET (1:100) |
| Antibody | Alexa Fluor 555-conjugated anti-rabbit (donkey polyclonal) | Thermo Fisher Scientific | Cat. #: A-31572, RRID: AB_162543 | N-FRET (1:100) |
| Antibody | Anti-PC-1 (mouse monoclonal) | Santa Cruz Biotechnology | Cat. #: sc-130554,RRID: AB_2163355 | WB (1:100) |
| Antibody | Anti-PC-2 (mouse monoclonal) | Santa Cruz Biotechnology | Cat. #: sc-47734,RRID: AB_672380 | WB (1:100)IP (1:20) |
| Antibody | Anti-IK1 (D-5) (mouse monoclonal) | Santa Cruz Biotechnology | Cat. #: sc-365265,RRID: AB_10841432 | WB (1:100) |
| Antibody | Anti-SK3(rabbit polyclonal) | Abcam | Cat. #: ab28631,RRID: AB_775888 | WB (1:100) |
| Antibody | Anti-eNOS [M221](mouse monoclonal) | Abcam | Cat. #: ab76198,RRID: AB_1310183 | WB (1:100) |
| Antibody | Anti-TRPV4(clone 1B2.6) (mouse monoclonal) | Millipore Sigma | Cat. #: MABS466 | WB (1:100) |
| Antibody | Anti-Actin (clone C4)(mouse monoclonal) | MilliporeSigma | Cat. #: MAB1501,RRID: AB_2223041 | WB (1:1000) |
| Antibody | Anti-p-eNOS (rabbit polyclonal) | Cell Signaling Technology | Cat. #: 9571,RRID: AB_329837 | WB (1:100) |
| Antibody | Anti-GPR68(rabbit polyclonal) | NOVUS Biologicals | Cat. #: NBP2-32747 | WB (1:100) |
| Antibody | Anti-Piezo1 (rabbit polyclonal) | ProteinTech | Cat. #: 15939-1-AP,RRID: AB_2231460 | WB (1:100) |
| Antibody | Mouse IgG control (mouse polyclonal) | MilliporeSigma | Cat. #: 12-371,RRID: AB_145840 | IP (1:20) |
| Peptide, recombinant protein | PC-1 coiled-coil domain peptide | Genscript | FDRLNQATE DVYQLEQQL | 1 µM |
| Peptide, recombinant protein | PC-1 scrambled peptide | Genscript | QLNDLFQTE VAEDLQRYQ | 1 µM |
| Peptide, recombinant protein | PC-2 coiled-coil domain peptide | Genscript | KRREVLGRLL | 1 µM |
| Peptide, recombinant protein | PC-2 scrambled peptide | Genscript | VLKLLRRRGE | 1 µM |
| Commercial assay or kit | Pierce crosslink magnetic IP/co-IP Kit | Thermo Fisher Scientific | Cat. #: 88805 | |
| Other | DAPI stain | Thermo FisherScientific | Cat. #: 3571RRID: AB_2307445 | 1:1000 |
Additional files
-
Transparent reporting form
- https://cdn.elifesciences.org/articles/74765/elife-74765-transrepform1-v2.docx
-
Source data 1
Unlabeled source data.
- https://cdn.elifesciences.org/articles/74765/elife-74765-data1-v2.zip
-
Source data 2
Labeled source data.
- https://cdn.elifesciences.org/articles/74765/elife-74765-data2-v2.zip
Download links
A two-part list of links to download the article, or parts of the article, in various formats.
Downloads (link to download the article as PDF)
Open citations (links to open the citations from this article in various online reference manager services)
Cite this article (links to download the citations from this article in formats compatible with various reference manager tools)
A plasma membrane-localized polycystin-1/polycystin-2 complex in endothelial cells elicits vasodilation
eLife 11:e74765.
https://doi.org/10.7554/eLife.74765


