Selective YAP activation in Procr cells is essential for ovarian stem/progenitor expansion and epithelium repair
- Children’s Hospital, Zhejiang University School of Medicine, National Clinical Research Center for Child Health, National Children’s Regional Medical Center, China
- State Key Laboratory of Cell Biology, CAS Center for Excellence in Molecular Cell Science, Institute of Biochemistry and Cell Biology, Chinese Academy of Sciences, University of Chinese Academy of Sciences, China
- Human Anatomy & Histoembryology, School of Basic Medical Sciences, Shanghai Medical College, Fudan University, China
- School of Life Science, Hangzhou Institute for Advanced Study, University of Chinese Academy of Sciences, Chinese Academy of Sciences, China
- School of Life Science and Technology, ShanghaiTech University, China
Figures
Figure 1 with 2 supplements
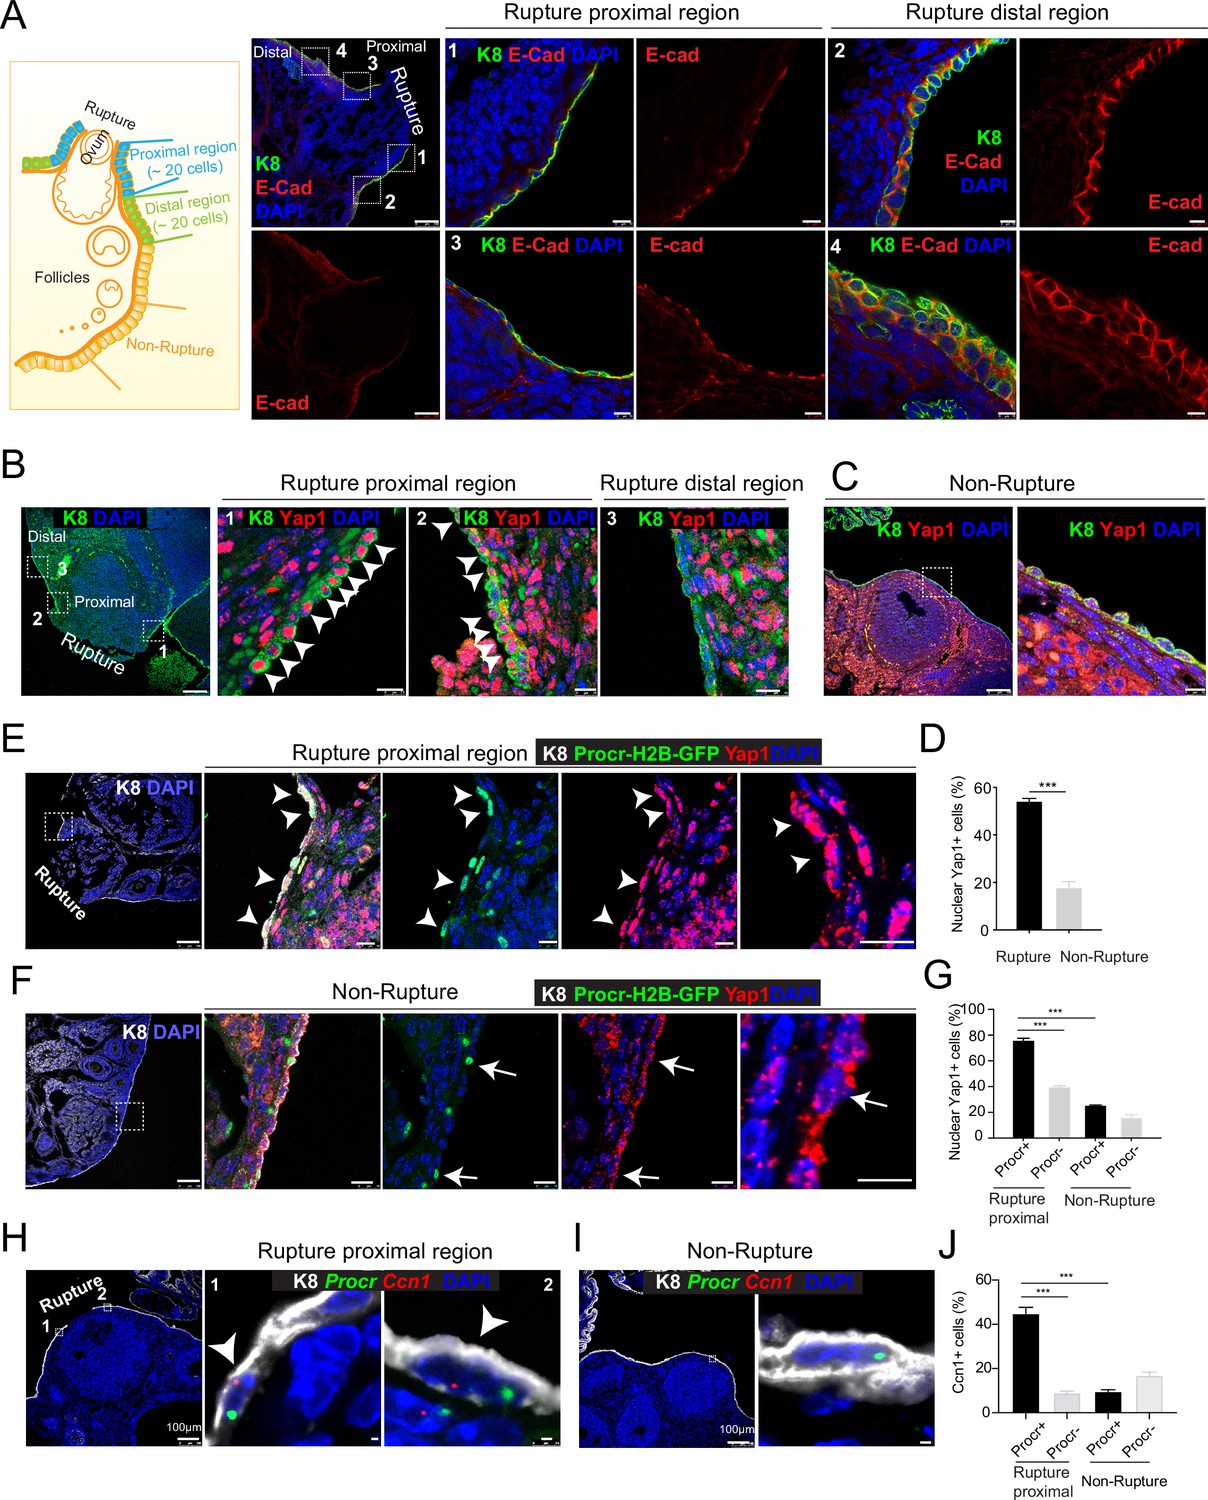
Rupture-induced YAP signaling activation is preferentially activated in Procr+ progenitors at the rupture sites.
(A) Sections from wild-type ovaries at ovulation stage were stained with Krt8 (K8) and E-cadherin (E-cad). Confocal images showed less E-cad in the ovarian surface epithelium (OSE) of proximal regions surrounding the rupture sites (views #1, #3 in A) compared with distal regions (views #2, #4 in A). Scale bar, 100 μm for zoom out and 10 μm for zoom in. n = 3 mice and 15 images. (B–D) Sections from wild-type ovaries at ovulation stage were stained with K8 and Yap1. Confocal images (B, C) and quantification (D) showed Yap1 nuclear localization in the OSE was only observed in the proximal regions surrounding the rupture sites (B, D), but not in the distal regions (B, D) or the nonrupture sites (C, D). Scale bar, 100 μm for zoom out and 20 μm for zoom in. n = 3 mice and 15 images. Unpaired two-tailed t-test is used for comparison. ***p < 0.001. (E–G) Procr-rtTA;TetO-H2B-GFP+/− mice were fed with doxycycline for 3 days and harvested at ovulation stage. Confocal images of ovarian sections with K8 and Yap1 staining (E, F) and quantification (G) were showed. Nuclear Yap1 staining is preferentially detected in Procr+ (histone 2B-GFP+) cells in rupture proximal region (arrowheads in E), whereas at the nonrupture site, Yap1 staining was cytoplasmic regardless in Procr+ (arrows in F) or Procr− cells (F). Scale bar, 100 μm for zoom out and 10 μm for zoom in. n = 3 mice and 15 images. One-way analysis of variance (ANOVA) with Tukey test is used for comparison of multiple groups. ***p < 0.001. (H–J) Combination of Procr and Ccn1 double fluorescent in situ with K8 antibody immunohistochemistry staining (H–I). Confocal images showed colocalization of Procr and Ccn1 in the OSE at the rupture sites (arrowhead in H), while at nonrupture regions, both Procr+ and Procr− cells had low incidence of Ccn1 expression (I). Quantification showed increased Ccn1 expression in Procr+ cells at rupture sites compared with Procr− cells at rupture sites or Procr+ cells at nonrupture regions (J). Scale bar, 100 μm for zoom out and 1 μm for zoom in. n = 3 mice and 15 images. One-way ANOVA with Tukey test is used for comparison of multiple groups. ***p < 0.001.
-
Figure 1—source data 1
Numeric data for Figure 1D, G, J.
- https://cdn.elifesciences.org/articles/75449/elife-75449-fig1-data1-v1.xlsx
Figure 1—figure supplement 1
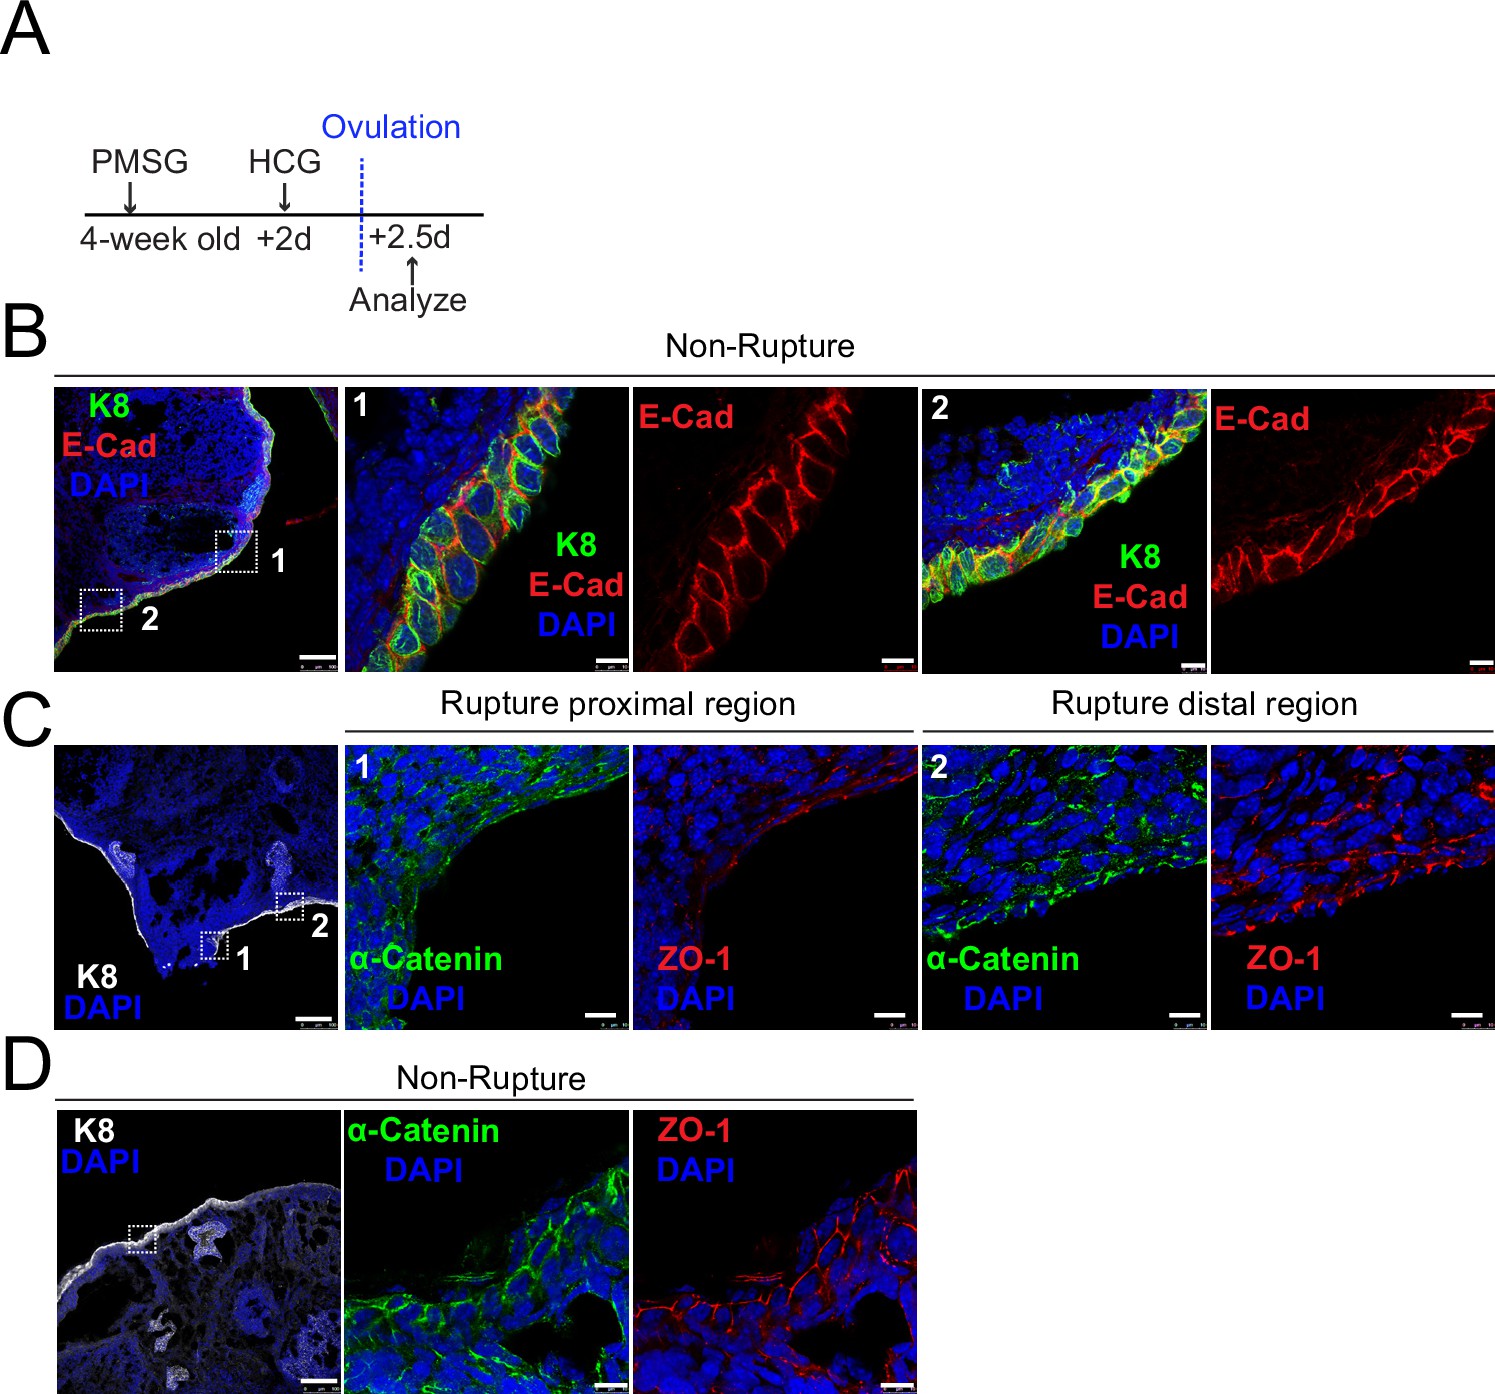
Decreased adherent junctions at ovarian surface epithelium (OSE) of rupture sites.
(A) Illustration of superovulation strategy. Four-week-old mice were administrated with pregnant mare serum gonadotropin (PMSG), following by human chorionic gonadotropin (HCG) 2 days later. The ovaries were harvested 0.5 day after HCG injection (ovulation). (B) Confocal images showed abundant E-cad expression in the OSE of nonrupture sites. Scale bar, 100 μm for zoom out and 10 μm for zoom in. n = 3 mice and more than 15 images. (C-D) Confocal images showed lower levels of α-catenin and ZO-1 in the OSE of proximal regions surrounding the rupture sites (view #1 in C) compared with those in distal regions (view #2 in C) and nonrupture regions (D). Scale bar, 100 μm for zoom out and 10 μm for zoom in. n = 3 mice and 15 images.
Figure 1—figure supplement 2
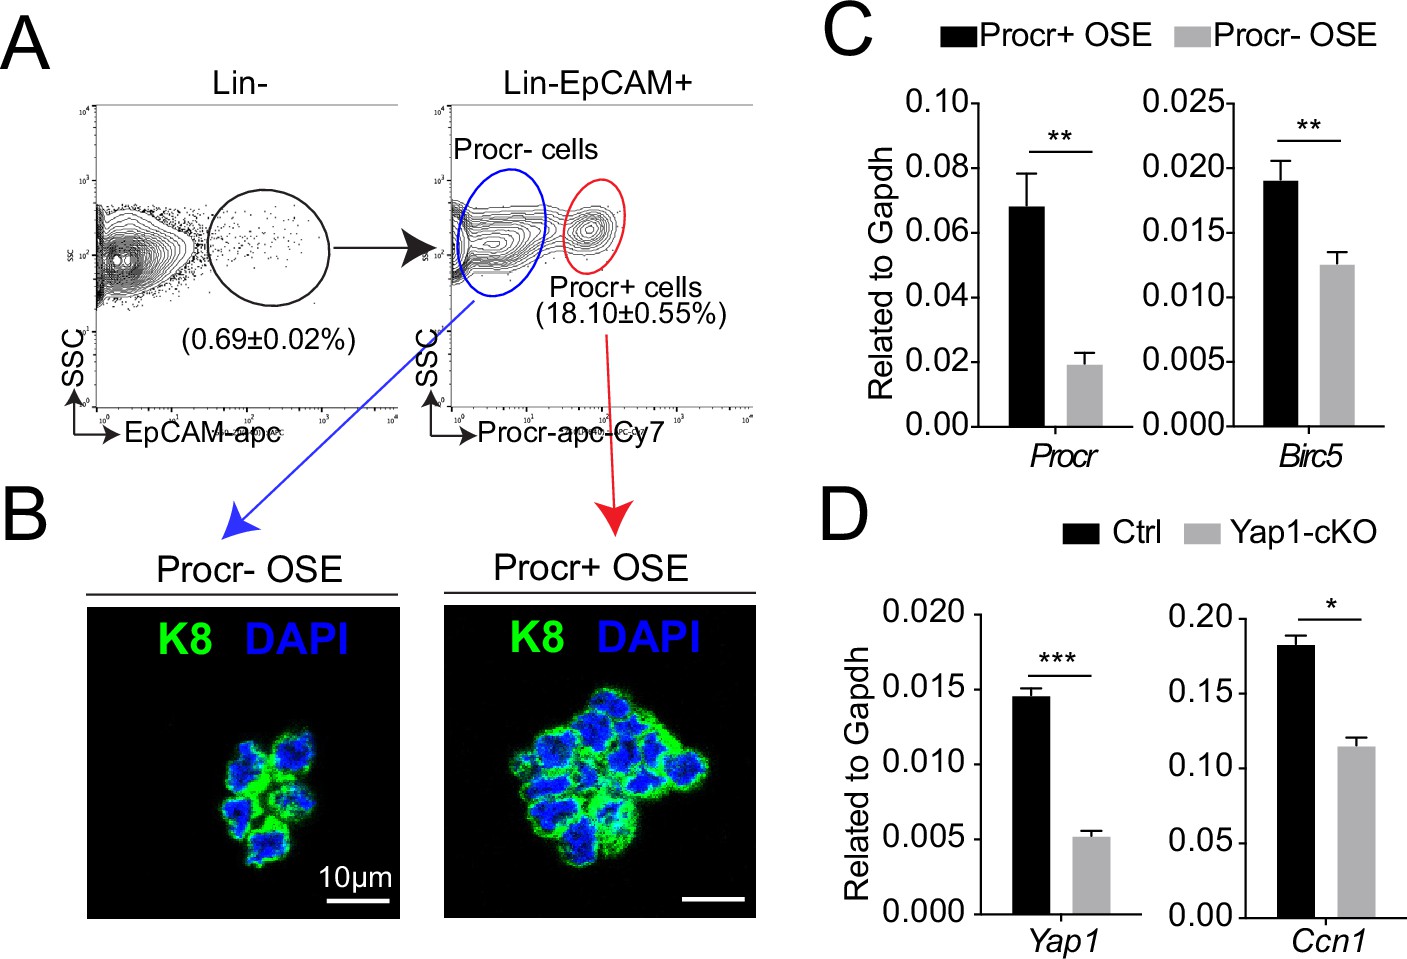
Increased YAP signaling activity in Procr+ ovarian surface epithelium (OSE) cells at rupture sites.
At ovulation stage, Procr+ and Procr− OSE cells (Lin−, EpCAM+) were FACS isolated (A). Immunostaining showed that Procr+ and Procr− OSE cells expressed similar levels of K8 (B). Scale bar, 10 μm. n = 3 mice. (C) qPCR analysis showed the higher Birc5 level in Procr+ cells. Data are pooled from four independent experiments and presented as mean ± standard error of the mean (SEM). Unpaired two-tailed t-test is used for comparison. **p < 0.01. (D) qPCR analysis validated the deletion efficiency of Yap1 and the downregulation of the expression of YAP target Ccn1 in total OSE cells of Yap1-cKO mice compared with Ctrl mice. Data are pooled from three independent experiments and displayed as mean ± SEM. Unpaired two-tailed t-test is used for comparison. ***p < 0.001, *p < 0.05.
-
Figure 1—figure supplement 2—source data 1
Numeric data for Figure 1—figure supplement 2C, D.
- https://cdn.elifesciences.org/articles/75449/elife-75449-fig1-figsupp2-data1-v1.xlsx
Figure 2
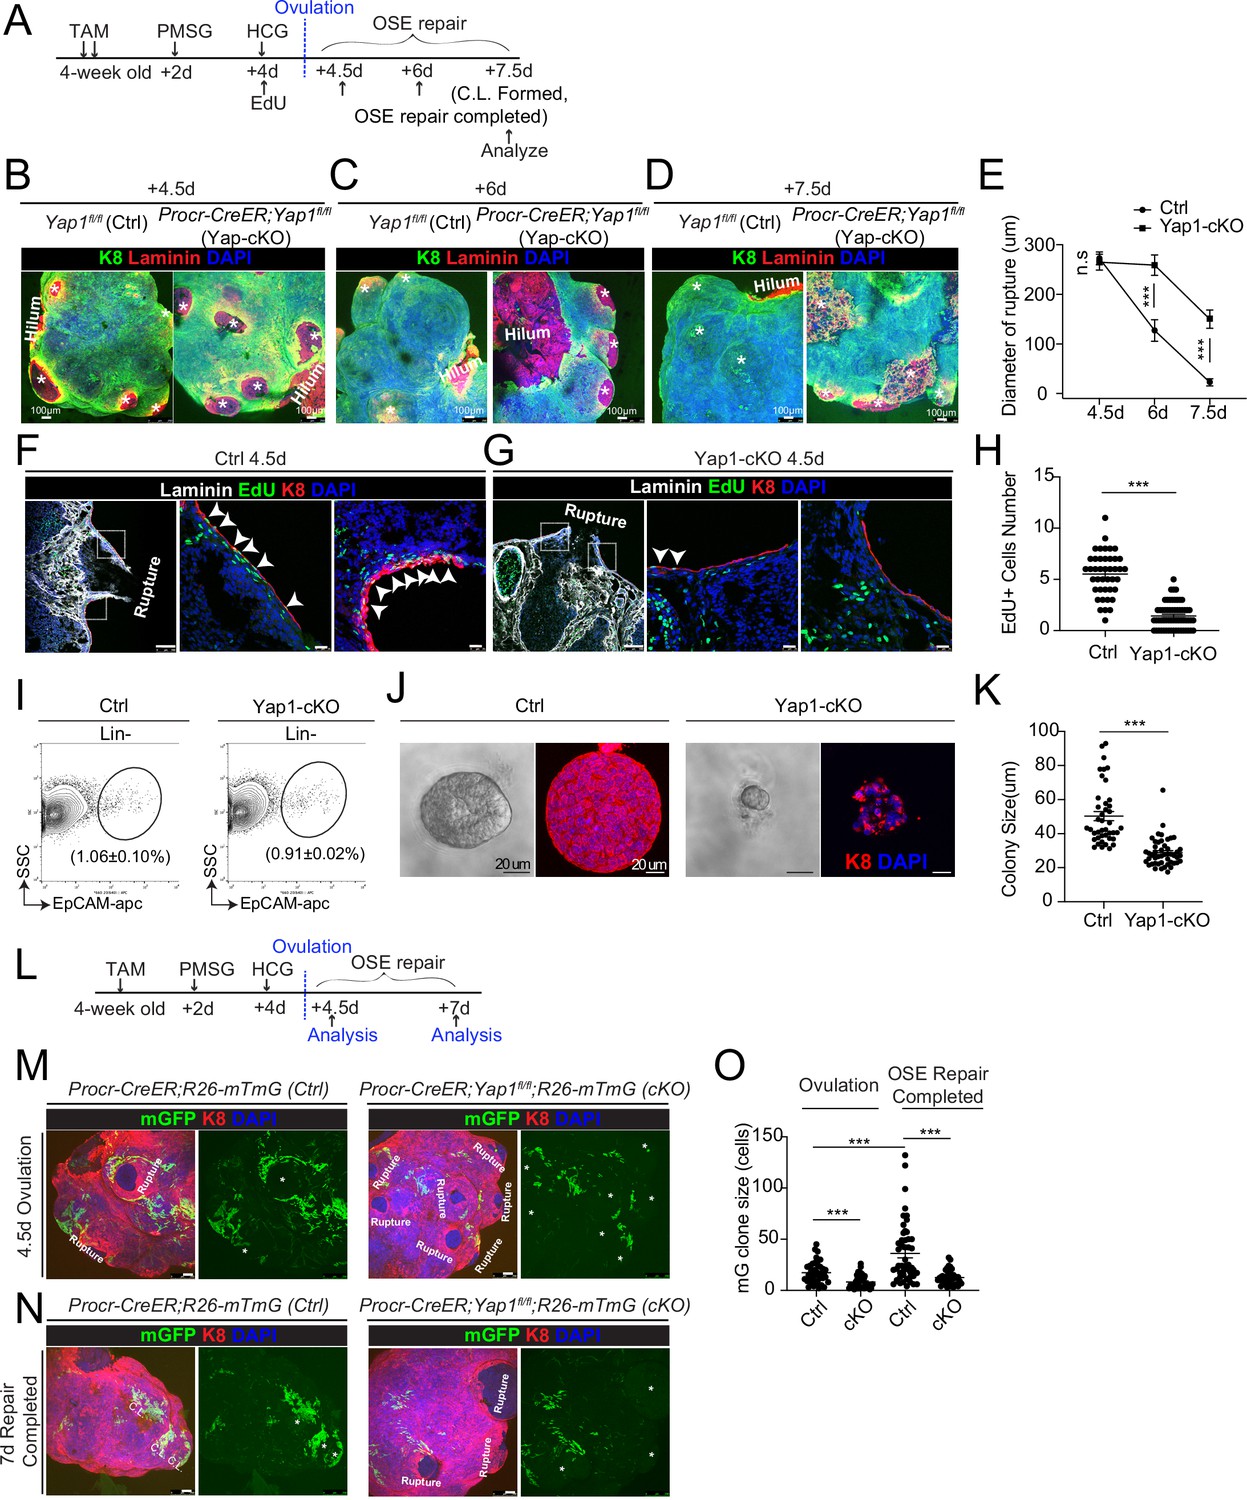
Deletion of Yap1 in Procr+ cells hinders ovarian surface epithelium (OSE) rupture repair and progenitor proliferation.
(A) Illustration of TAM induction and superovulation strategy. (B–E) Yap1 was deleted in Procr+ cells using Procr-CreER;Yap1fl/flmice (Yap1-cKO), and Yap1fl/fl mice was used as control (Ctrl). Ovary whole-mount staining with K8 and Laminin was performed (B–D) and the wound size in diameter was quantified (E). At 4.5 days (ovulation) Ctrl and Yap1-cKO ovaries had comparable wound size (* in B). At 6 days (OSE repair ongoing), the wounds in Ctrl ovary were significantly smaller than those in Yap1-cKO ovary ( * in C). At 7.5 days (repair completed), the wound was completely repaired in Ctrl, while the Yap1-cKO ovary still showed obvious wounds ( * in D). Scale bar, 100 μm. n = 3 pairs of mice. (F–H) Ctrl and Yap1-cKO mice were subjected to 12-hr 5-ethynyl-29-deoxyuridine (EdU) incorporation and were harvested at 4.5 days (ovulation stage). Representative images (F–G) and quantification (H) were showed. Out of 20 cells next to the rupture on one side, the numbers of EdU+ cells (arrowhead) in the OSE of rupture site decreased from 5.5 ± 0.3 cells in Ctrl to 1.4 ± 0.2 cells in Yap1-cKO. Scale bar, 100 μm for zoom out and 20 μm for zoom in. n = 3 pairs of mice. Unpaired two-tailed t-test is used for comparison. ***p < 0.001. (I–K) Total OSE cells from Procr-CreER;Yap1fl/fl mice (Yap1-cKO), and Yapfl/fl mice (Ctrl) were isolated by FACS at 4.5 days (ovulation stage) (I), followed by culture in 3D Matrigel for 7 days. Representative brightfield and confocal images of K8 staining were shown (J). Colony sizes in diameter were measured (K). Scale bar, 20 μm. Data are pooled from three independent experiments and displayed as mean ± standard error of the mean (SEM). Unpaired two-tailed t-test is used for comparison. ***p < 0.001. (L) Illustration of lineage tracing, deletion of Yap1 and superovulation strategy. (M–O) Procr-CreER;Yap1fl/fl;R26-mTmG (Yap1-cKO) and Procr-CreER;R26-mTmG (Ctrl) mice were used. At 4.5 pi (ovulation), ovary whole-mount confocal imaging showed zones of concentrated GFP+ cells surrounding the rupture site in Ctrl, while fewer GFP+ cells were seen in Yap1-cKO ovary (M). At 7 pi (repair completed), ovary whole-mount confocal imaging showed large GFP+ patches located at corpus luteum (CL) in Ctrl, while rare GFP+ cells surrounding the unrepaired wound in Yap1-cKO ovary (N). Quantification showed significantly fewer GFP+ cells in Yap1-cKO compared with Ctrl in both ovulation stage and repair completed stage (O). Quantification showed an expansion of GFP+ cell numbers in Ctrl mice during the tracing and no expansion in Yap1-cKO (O). Scale bar, 100 μm. n = 3 pairs of mice. ***p < 0.001.
-
Figure 2—source data 1
Numeric data for Figure 2E, H, K, O.
- https://cdn.elifesciences.org/articles/75449/elife-75449-fig2-data1-v1.xlsx
Figure 3 with 1 supplement

An intrinsic lower level of Vgll4 in Procr+ cells is essential for Procr+ cells’ stemness and ovarian surface epithelium (OSE) rupture repair.
At ovulation stage, Procr+ and Procr− OSE cells (Lin−, EpCAM+) were FACS isolated (A). qPCR analysis showed the lower Vgll4 level in Procr+ cells (B). Data are pooled from three independent experiments and presented as mean ± standard error of the mean (SEM). ***p < 0.001. (C–E) Procr-rtTA;TetO-H2B-GFP mice were administered with pregnant mare serum gonadotropin (PMSG) and human chorionic gonadotropin (HCG) to induce superovulation, and fed with doxycycline for 3 days before harvest. Ovarian sections were stained with Vgll4 and K8. Representative images showed that at both rupture proximal region (C) and nonrupture region (D), H2B-GFP− (Procr−) OSE cells have high Vgll4 expression (arrows in C, D), while H2B-GFP+ (Procr+) OSE cells have no Vgll4 expression (arrowheads in C, D). Scale bar, 20 μm for zoom out and 5 μm for zoom in. Quantification of the staining was shown in (E). n = 3 mice and 15 images. Unpaired two-tailed t-test is used for comparison. ***p < 0.001. Targeting strategy and validation of TetO-Vgll4 knock-in mouse (F, G). A cassette of TetO-Vgll4-Flag-wpre-polyA was knocked in behind 3′UTR of Col1a1 gene (F). Immunohistochemistry staining of Vgll4 in the ovaries indicated more Vgll4+ OSE cells at the rupture sites (G). Scale bar, 10 μm. n = 3 pairs of mice. Illustration of superovulation and overexpression of Vgll4 in Procr+ cells (H). Ovary whole-mount confocal images of K8 and Laminin showed that at 4.5 days (ovulation), Ctrl (TetO-Vgll4) and Vgll4-OE (Procr-rtTA;TetO-Vgll4) ovaries have similar wound sizes (* in I). At 6 days (repair ongoing), the wound sizes in Ctrl mice were smaller than those in Vgll4-OE (* in J). At 7.5 days (repair completed), Ctrl ovary had completely repaired, while Vgll4-OE mice had obvious opening (* in K). Scale bar, 100 μm. The sizes of the wound in diameter were quantified (L). n = 3 pairs of mice. The mice were harvested at 4.5 days (ovulation) after 12-hr 5-ethynyl-29-deoxyuridine (EdU) incorporation. Representative images (M, N) and quantification (O) showed the number of EdU+ cells in the OSE surrounding the rupture site (arrowheads in M) decreased from 3.7 ± 0.3 in Ctrl to 1.0 ± 0.2 in Vgll4-OE (arrowheads in N). Scale bar, 100 μm for zoom out and 20 μm for zoom in. n = 3 pairs of mice. Unpaired two-tailed t-test is used for comparison. ***p < 0.001. Total OSE cells were isolated by FACS from Ctrl and Vgll4-OE at 4.5 days (ovulation) (P), and cultured in 3D Matrigel. At day 7 in culture, colony sizes were measured in diameter (Q), and representative images were shown (R) out of 15 images in each group. Scale bar, 20 μm. Data are pooled from three independent experiments and displayed as mean ± SEM. Unpaired two-tailed t-test is used for comparison. ***p < 0.001.
-
Figure 3—source data 1
Numeric data for Figure 3B, E, L, O, Q.
- https://cdn.elifesciences.org/articles/75449/elife-75449-fig3-data1-v1.xlsx
Figure 3—figure supplement 1
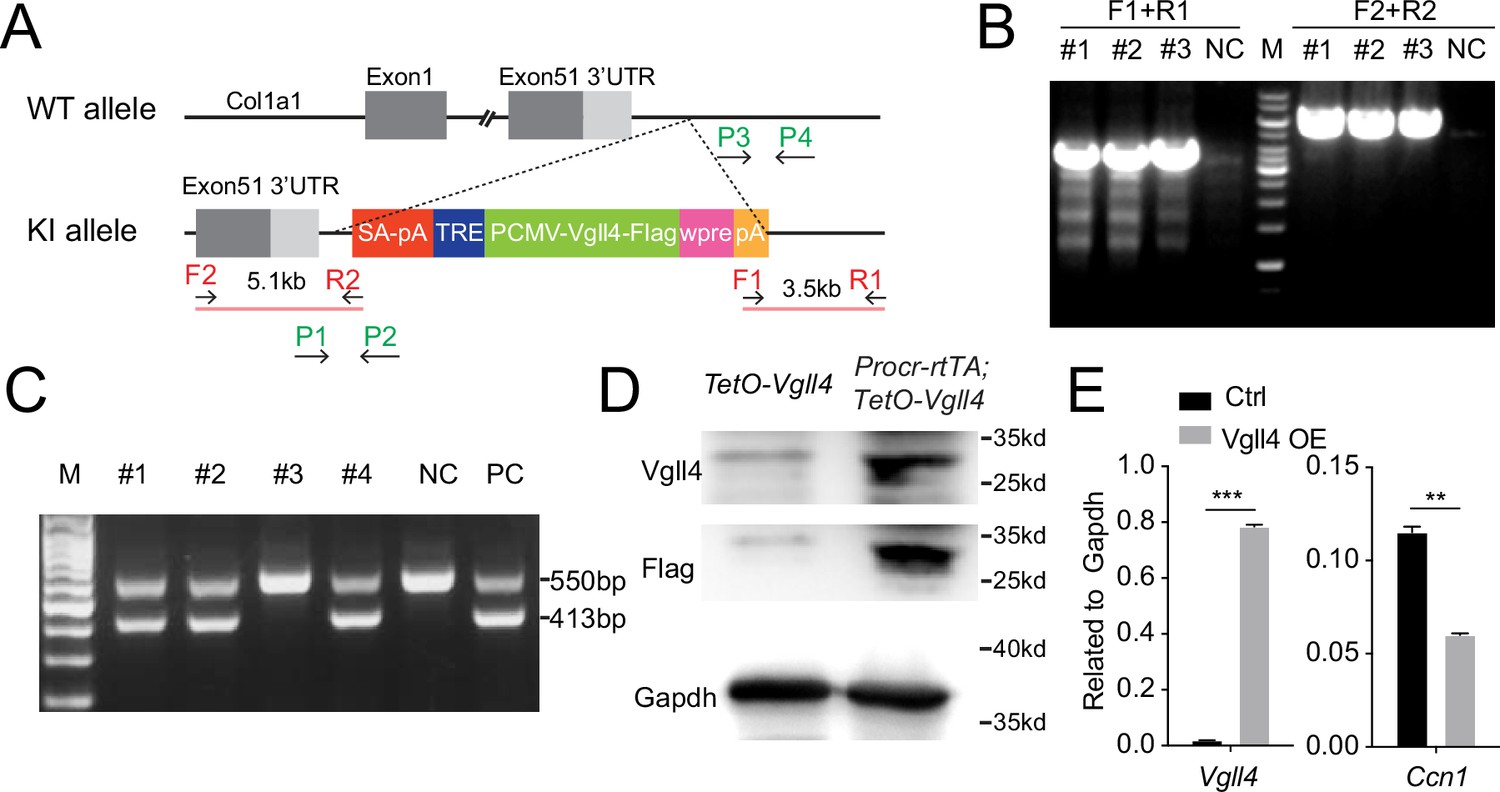
Construction of TetO-Vgll4 mouse model.
(A) Targeting strategy for the generation of TetO-Vgll4 knock-in mouse. Designs of ES clone genotyping primers (red) and mouse genotyping primers (green) are as indicated. (B) ES clone genotyping PCR indicating three successful knock-in (KI) clones. NC, negative control with no DNA input; M, marker. (C) Genotyping PCR results indicate pup #1, 2, 4 are heterozygotes, #3 is wild type. A wild-type mouse was used as negative control (NC) and a positive ES clone was used as positive control (PC). (D) Western blotting validated the overexpression of Flag and Vgll4 in the cells of Vgll4-OE mice compared with Ctrl mice. One of three independent experiments is shown. (E) qPCR analysis validated the overexpression of Vgll4 and downregulation of Ccn1 in total OSE cells of Vgll4 OE mice compared with Ctrl mice. Data are pooled from three independent experiments and displayed as mean ± standard error of the mean (SEM). Unpaired two-tailed t-test is used for comparison. ***p < 0.001, **p < 0.01.
-
Figure 3—figure supplement 1—source data 1
Numeric data for Figure 3—figure supplement 1E.
- https://cdn.elifesciences.org/articles/75449/elife-75449-fig3-figsupp1-data1-v1.xlsx
-
Figure 3—figure supplement 1—source data 2
Whole blot image for Figure 3—figure supplement 1B–D.
- https://cdn.elifesciences.org/articles/75449/elife-75449-fig3-figsupp1-data2-v1.zip
Figure 4 with 2 supplements
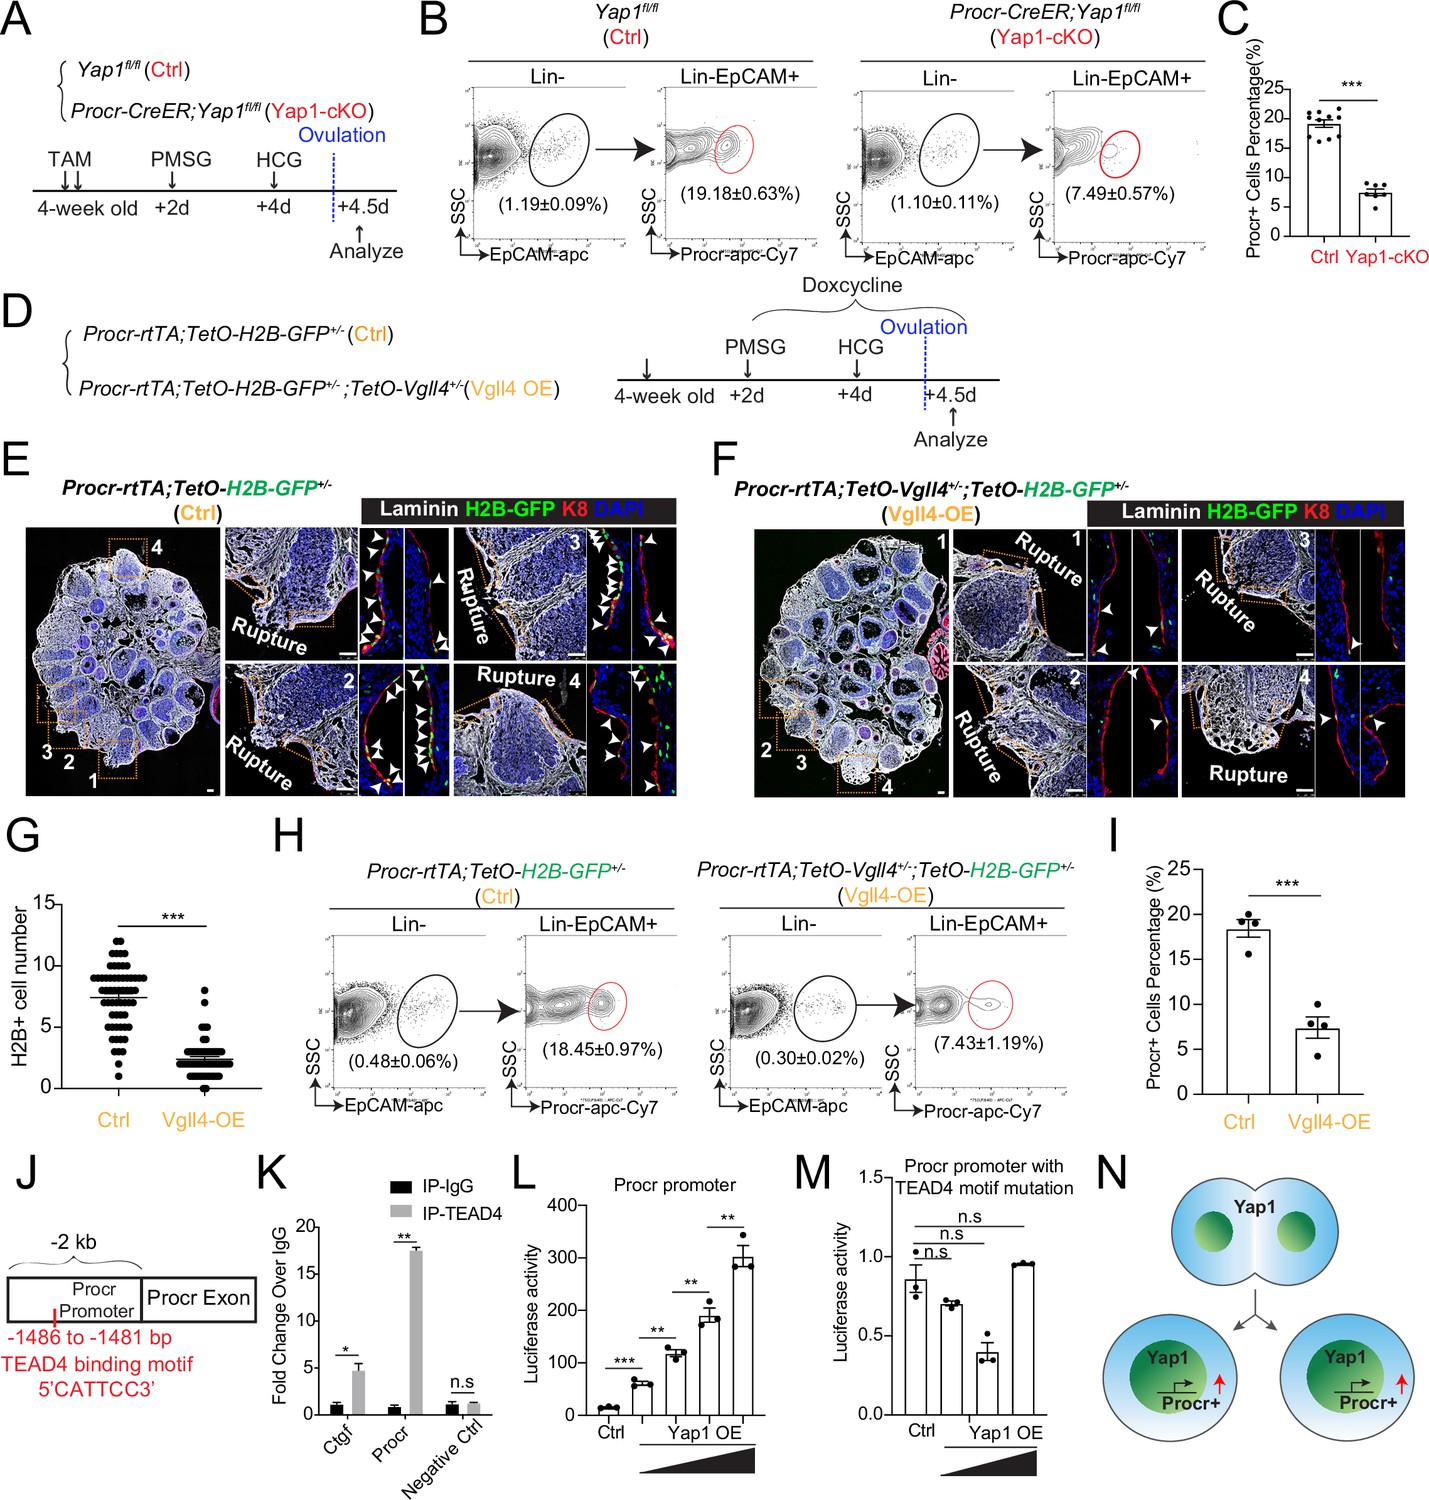
YAP signaling promotes Procr+ cells expansion at rupture sites through a combination of promoting cell division and enhancing Procr expression.
Illustration of superovulation and analysis strategy as indicated using Yap1fl/fl (Ctrl) and Procr-CreER;Yap1fl/fl (Yap1-cKO) mice (A). At ovulation stage, the percentage of Procr+ ovarian surface epithelium (OSE) cells in Ctrl and Yap1-cKO were FACS analyzed (B) and quantified (C). n = at least three mice in each group and displayed as mean ± standard error of the mean (SEM). Unpaired two-tailed t-test is used for comparison. ***p < 0.001. Illustration of superovulation and analysis strategy as indicated using Procr-rtTA;TetO-H2B-GFP+/− (Ctrl) and Procr-rtTA;TetO-H2B-GFP+/−;TetO-Vgll4+/− (Vgll4-OE) mice (D). At ovulation stage, ovary section imaging showed that at the rupture sites, the number of H2B-GFP+ (Procr+) cells in Ctrl (arrowheads in E) is higher than those in Vgll4-OE (arrowheads in F). Scale bar, 100 μm. Quantification was shown in (G). n = 3 pairs of mice and 15 images in each group. Unpaired two-tailed t-test is used for comparison. ***p < 0.001. The percentage of Procr+ OSE cells were analyzed by FACS at ovulation stage (H). The percentage of Procr+ cells in Ctrl are higher than that in Vgll4-OE (H, I). n = at least 3 mice and displayed as mean ± SEM. Unpaired two-tailed t-test is used for comparison. ***p < 0.001. Illustration of Tead4 motif in Procr promoter region (J). TEAD4 chromatin immunoprecipitation-qPCR (ChIP-qPCR) analysis using cultured primary OSE cells showed the enrichment of Procr promoter, and Ctgf promoter was used as positive control (K). n = 2 biological repeats. Unpaired two-tailed t-test is used for comparison. **p < 0.01, *p < 0.05, n.s., not significant. Analysis of luciferase reporter activity driven by WT (L) and Tead4 motif (−1486 to −1481 bp) deleted Procr promoter (M) in HEK293T cells transfected with increased amount of Yap1 overexpression plasmids. Data are pooled from three independent experiments and displayed as mean ± SEM. Unpaired two-tailed t-test is used for comparison. ***p < 0.001, **p < 0.01, n.s., not significant. (N) A proposed model of which YAP signaling promotes Procr+ cells expansion at rupture site through a combination of promoting cell division and enhancing Procr expression.
-
Figure 4—source data 1
Numeric data for Figure 4C, G, I, and K–M.
- https://cdn.elifesciences.org/articles/75449/elife-75449-fig4-data1-v1.xlsx
Figure 4—figure supplement 1
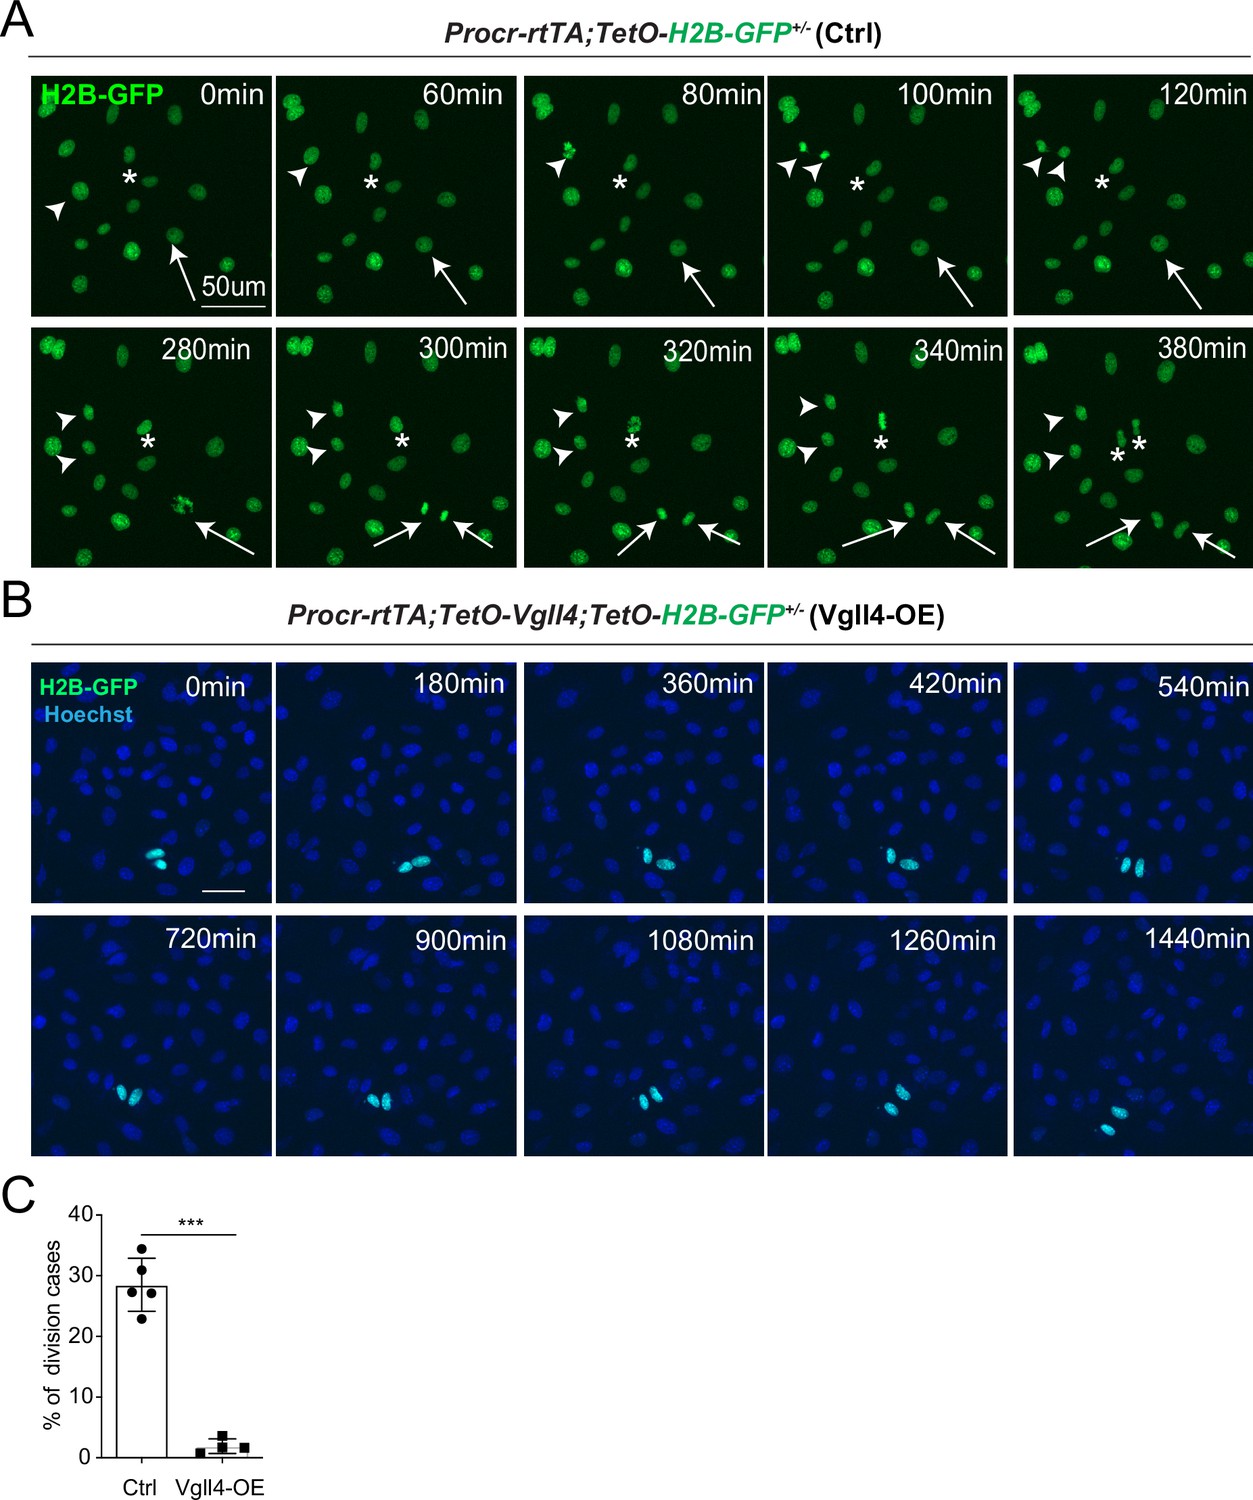
YAP promotes Procr+ cells expansion.
(A, B) Ovarian surface epithelium (OSE) cells were isolated from Procr-rtTA;TetO-H2B-GFP+/− (Ctrl) or Procr-rtTA;TetO-Vgll4+/-;TetO-H2B-GFP+/− (Vgll4-OE) mice and cultured on the glass. In control, almost all cells are H2B-GFP+ (Procr+) in such stiff culture condition (A). Living images for 6 hr showed many cases of H2B-GFP+ (Procr+) cells (A) (examples in *, arrow, arrowhead in A). In Vgll4-OE cells, there were drastically less H2B-GFP+ (Procr+) cells, and living imaging of 24 hr showed few or no incidence of cell division (B). Scale bar, 50 μm. n = at least 3 views. (C) Quantification of the percentage of the division cases in Ctrl (A) and Vgll4-OE (B). n = at least 3 views and presented as mean ± standard error of the mean (SEM). Unpaired two-tailed t-test is used for comparison. ***p < 0.001.
-
Figure 4—figure supplement 1—source data 1
Numeric data for Figure 4—figure supplement 1C.
- https://cdn.elifesciences.org/articles/75449/elife-75449-fig4-figsupp1-data1-v1.xlsx
Figure 4—figure supplement 2
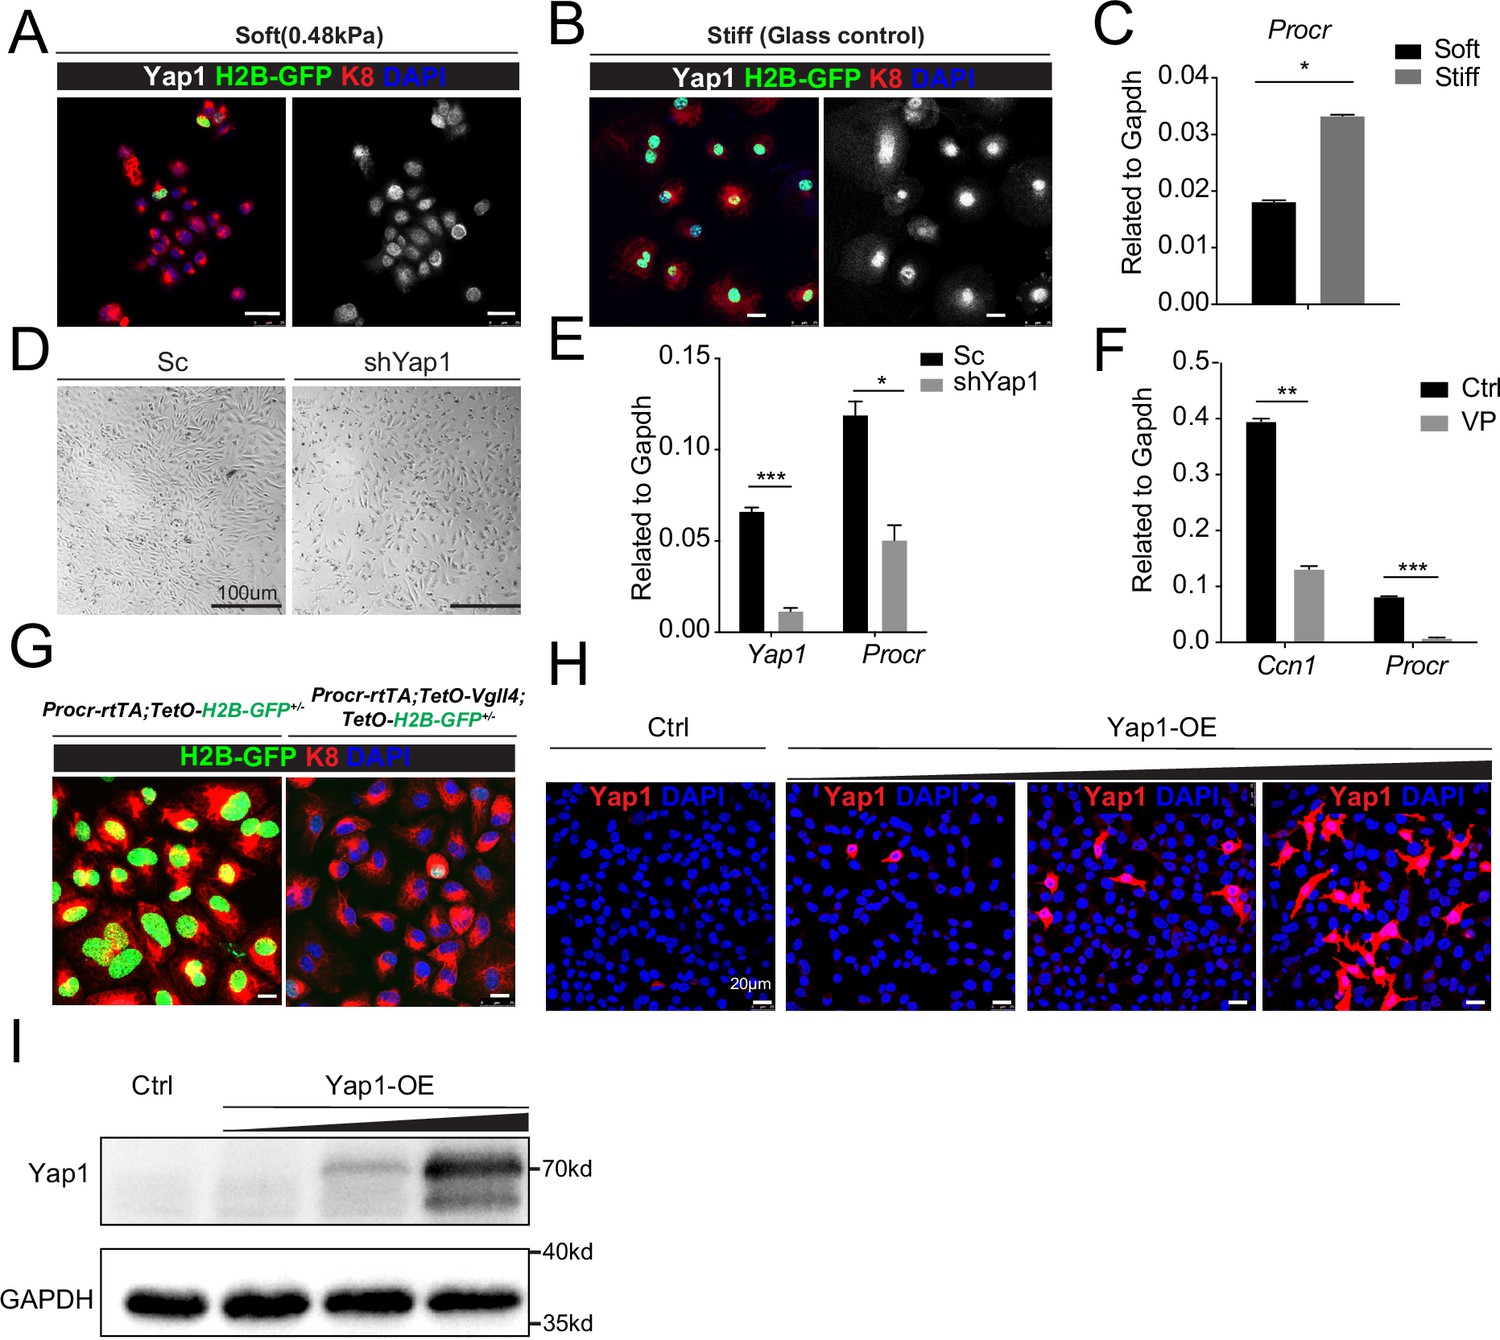
YAP induces Procr expression.
Ovarian surface epithelium (OSE) cells were isolated from Procr-rtTA;TetO-H2B-GFP+/− mice and cultured upon the soft hydrogel (A) or glass (B). Confocal images showed nuclear localized Yap1 and more H2B-GFP+ cells upon glass compared with soft hydrogel (A–B). Scale bar, 20 μm, n = 15 images. qPCR indicated Procr expression was upregulated upon glass culture (C). (D, E) OSE cells isolated from wild-type mice were infected with Scramble (Sc) or Yap1 shRNA (shYap1) virus and then cultured on glass. OSE cells were harvested on culture day 4 (D). qPCR showed knockdown of Yap1 repressed Procr expression (E). Scale bar, 100 μm, n = 15 images. (F) OSE cells were isolated from wild-type mice and cultured on glass. Verteporfin (VP) was added into the medium before harvest. qPCR showed that VP treatment inhibits Ccn1 and Procr expression. (G) OSE cells were isolated from Procr-rtTA;TetO-H2B-GFP+/− (Ctrl) and Procr-rtTA;TetO-Vgll4+/−;TetO-H2B-GFP+/− (Vgll4-OE) mice and cultured on the glass. Confocal images showed dimmer H2B-GFP expression in Vgll4-OE compared to Ctrl. Scale bar, 10 μm, n = 15 images. Immunostaining (H) and western blotting (I) validated the gradient overexpression of Yap1. Scale bar, 20 μm. One of three independent experiments is shown. For all qPCR results, data are pooled from at least three independent experiments and presented as mean ± standard error of the mean (SEM). Unpaired two-tailed t-test is used for comparison. ***p < 0.001, **p < 0.01, *p < 0.05.
-
Figure 4—figure supplement 2—source data 1
Numeric data for Figure 4—figure supplement 2C, E, F.
- https://cdn.elifesciences.org/articles/75449/elife-75449-fig4-figsupp2-data1-v1.xlsx
-
Figure 4—figure supplement 2—source data 2
Whole blot image for Figure 4—figure supplement 2K.
- https://cdn.elifesciences.org/articles/75449/elife-75449-fig4-figsupp2-data2-v1.zip
Figure 5
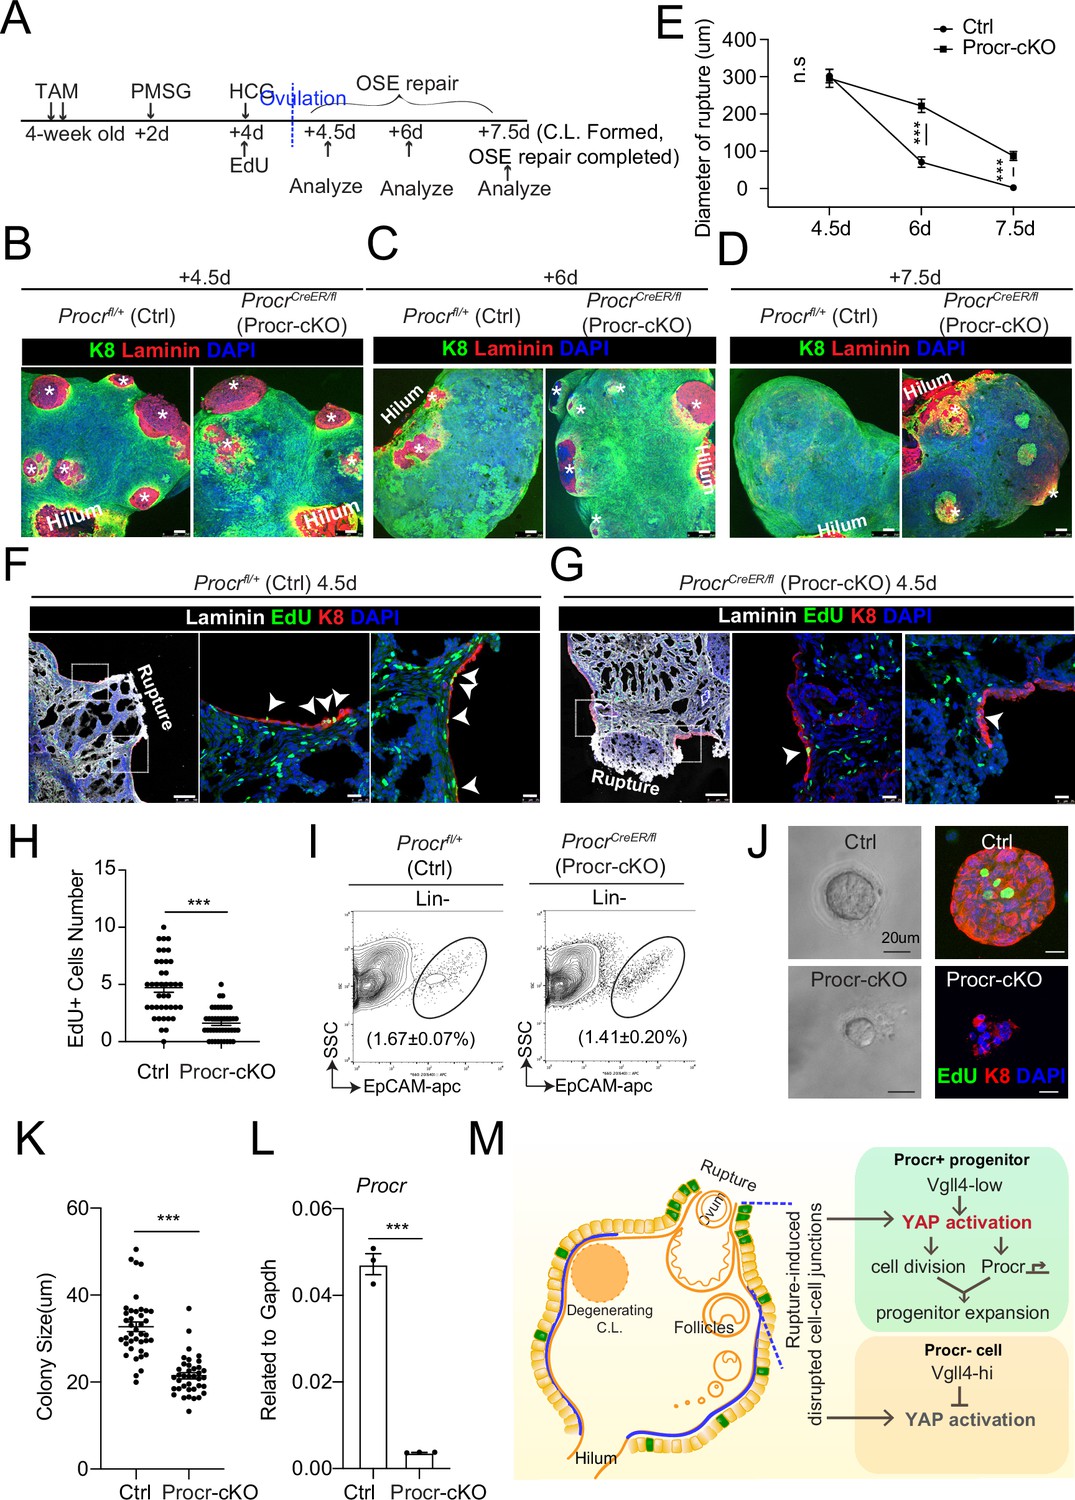
Procr is essential for the progenitor property.
(A–E) Illustration of superovulation and deletion of Procr in Procr+ cells using ProcrCreER/fl mice (Procr-cKO), and Procrfl/+ mice (Ctrl) (A). Ovary whole-mount confocal imaging of K8 and Laminin showed that at 4.5 days (ovulation), Ctrl and Procr-cKO have similar wound sizes (* in B). At 6 days (ovarian surface epithelium [OSE] repair ongoing), the wound sizes in Ctrl mice were smaller than those in Procr-cKO (* in C). At 7.5 days (repair completed), Ctrl ovary had completely repaired, while Procr-cKO remained obvious opening (* in D). Scale bar, 100 μm. Quantification of the wound size in diameter was shown in (E). n = 3 pairs of mice. Unpaired two-tailed t-test is used for comparison. ***p < 0.001. n.s., not significant. (F–H) Post 12-hr 5-ethynyl-29-deoxyuridine (EdU) incorporation, the mice were harvested at 4.5 days (ovulation) (A). Representative images showed the number of EdU+ cells (arrowhead) in the OSE surrounding the rupture site decreased from 4.7 ± 0.4 in Ctrl (arrowheads in F) to 1.6 ± 0.2 in Procr-cKO (arrowheads in G). Scale bar, 100 μm for zoom out and 20 μm for zoom in. Quantification of was shown in (H). n = 3 pairs of mice. Unpaired two-tailed t-test is used for comparison. ***p<0.001. Total OSE cells from Ctrl andProcr-cKO were isolated by FACS (I), followed by culture in 3D Matrigel. At culture day 7, representative brightfield and confocal images with K8 staining showed that OSE cells with Procr-cKO form markedly smaller colonies compared to Ctrl (J). Colony sizes were quantified in (K). qPCR analysis validated the deletion efficiency of Procr in OSE cells of Procr-cKO (L). Data are pooled from three independent experiments and displayed as mean ± standard error of the mean (SEM). Unpaired two-tailed t-test is used for comparison. ***p < 0.001. Scale bar, 20 μm. (M) A proposed model of YAP activation in Procr+ cells promoting OSE progenitor cell expansion. Procr+ OSE progenitors have intrinsically lower level of Vgll4 compared to Procr− OSE cells. At ovulation, cell–cell junctions at rupture site were disrupted, which induces the possibility of YAP activation in all OSE cells surrounding the rupture. However, the lower expression of Vgll4 in Procr+ cells allowed YAP activation in the progenitor cells at this area. YAP activation in Procr+ cells promoted cell division, and importantly, it directly upregulates Procr expression in the dividing cells, resulting in expansion of Procr+ progenitors around the wound.
-
Figure 5—source data 1
Numeric data for Figure 5E, H, K, L.
- https://cdn.elifesciences.org/articles/75449/elife-75449-fig5-data1-v1.xlsx
Author response image 1
Tables
Appendix 1—key resources table
| Reagent type (species) or resource | Designation | Source or reference | Identifiers | Additional information |
|---|---|---|---|---|
| Genetic reagent (M. musculus) | Mouse: Procr-CreER | ProcrCreER | N/A | Wang et al., 2015 |
| Genetic reagent (M. musculus) | Mouse: Procr-rtTA | ProcrrtTA | N/A | Wang et al., 2019 |
| Genetic reagent (M. musculus) | Mouse: R26-mTmG | The Jackson Laboratory | Jax: 007576 | |
| Genetic reagent (M. musculus) | Mouse: TetO-H2B-GFP | The Jackson Laboratory | Jax: 005104 | |
| Genetic reagent (M. musculus) | Mouse: Yap1fl/+ | Yap1fl/+ | N/A | Feng et al., 2019 |
| Genetic reagent (M. musculus) | Mouse: Procrfl/+ | Liu and Zeng, unpublished | N/A | Liu and Zeng, unpublished |
| Genetic reagent (M. musculus) | Mouse: ICR | SLAC | N/A | Female |
| Genetic reagent (M. musculus) | Mouse: C57BL/6 | SLAC | N/A | Female |
| Genetic reagent (M. musculus) | Mouse: TetO-Vgll4-Flag | This paper | N/A | See Materials and methods |
| Cell line (Homo-sapiens) | Human: HEK 293T cells | ATCC | Cat# CRL-3126 | |
| Antibody | anti-CD31, Biotin (Rat monoclonal) | BD | Cat# 553371; RRID:AB_394817 | FACS (1:200) |
| Antibody | anti-CD45, Biotin (Rat monoclonal) | BD | Cat# 553080; RRID:AB_394610 | FACS (1:200) |
| Antibody | anti-Ter119, Biotin (Rat monoclonal) | BD | Cat# 553672; RRID:AB_394985 | FACS (1:200) |
| Antibody | anti-CD31, FITC (Rat monoclonal) | BD | Cat# 553372; RRID:AB_394818 | FACS (1:200) |
| Antibody | anti-CD45, FITC (Rat monoclonal) | BD | Cat# 553079; RRID:AB_394609 | FACS (1:200) |
| Antibody | anti-Ter119, FITC (Rat monoclonal) | BD | Cat# 557915; RRID:AB_396936 | FACS (1:200) |
| Antibody | anti-EpCAM, APC (Rat monoclonal) | Thermo Fisher | Cat# 17-5791-82; RRID:AB_2716944 | FACS (1:200) |
| Antibody | Streptavidin-apc-Cy7 | BioLegend | Cat# 405208; RRID:N/A | FACS (1:500) |
| Antibody | Streptavidin-V450 | BD | Cat# 560797; RRID:AB_2033992 | FACS (1:500) |
| Antibody | anti Procr, Biotin (Rat monoclonal) | Thermo Fisher | Cat# 13-2012-82; RRID:AB_657694 | FACS (1:200) |
| Antibody | anti Procr, PE (Rat monoclonal) | Thermo Fisher | Cat# 12-2012-82; RRID:AB_914317 | FACS (1:200) |
| Antibody | anti-Krt8 (Rat monoclonal) | DSHB | Cat# TROMA-I; RRID:AB_531826 | IHC (1:250) |
| Antibody | anti-E-Cadherin (Mouse monoclonal) | BD | Cat# 610181; RRID:AB_397581 | IHC (1:100) |
| Antibody | anti-Yap1 (Rabbit monoclonal) | CST | Cat# 14074; RRID:AB_2650491 | IHC (1:100) |
| Antibody | anti-Yap1 (Rabbitpolyclonal) | ABclonal | Cat# A1002; RRID:AB_2757539 | IHC (1:200)WB (1:200) |
| Antibody | anti-GFP (Chicken polyclonal) | Thermo fisher | Cat# A10262; RRID:AB_2534023 | IHC (1:500) |
| Antibody | anti-Vgll4 (Rabbit polyclonal) | Self-made | Cat# N/A; RRID:N/A | IHC (1:100) |
| Antibody | anti-Flag (Mouse monoclonal) | Sigma | Cat# F1804; RRID:AB_262044 | WB (1:100) |
| Antibody | anti-Vgll4 (Rabbitpolyclonal) | ABclonal | Cat# A18248; RRID:AB_2862024 | IHC (1:100)WB (1:100) |
| Antibody | anti-Laminin (Rabbit polyclonal) | Sigma | Cat# L9393; RRID:AB_477163 | IHC (1:500) |
| Antibody | anti-a-E-catenin (Rabbit polyclonal) | Proteintech | Cat# 12831-1-AP; RRID:AB_2087822 | IHC (1:200) |
| Antibody | anti-ZO-1 (Mouse monoclonal) | Thermo Fisher | Cat# 33-9100; RRID:AB_2533147 | IHC (1:100) |
| Antibody | Normal mouse IgG | Santa cruz | Cat# sc-2025; RRID:AB_737182 | ChIP (1:100) |
| Antibody | anti-TEAD4 (Mouse monoclonal) | Abcam | Cat# ab58310; RRID:AB_945789 | ChIP (1:100) |
| Recombinant DNA reagent | pLKO.1-EGFP-shYap1 | This paper | Plasmid | Pol III-based shRNA backbone |
| Recombinant DNA reagent | pcDNA3.1-Yap1 | This paper | Plasmid | pcDNA3.1 backbone |
| Recombinant DNA reagent | PGL3.1 Procr promoter | This paper | Plasmid | PGL3.1 Promoter backbone |
| Recombinant DNA reagent | PGL3.1 Procr promoter TEAD4-binding motif mutation | This paper | Plasmid | Deletion of 5′CATTCC3′ at the −1486 to −1481 bp in Procr Promoter region |
| Sequence-based reagent | Procr-F | This paper | qPCR primers | 5′CTCTCTGGGA AAACTCCTGACA3′ |
| Sequence-based reagent | Procr-R | This paper | qPCR primers | 5′CAGGGAGCAGCT AACAGTGA3′ |
| Sequence-based reagent | Vgll4-F | This paper | qPCR primers | 5′ATGAACAACAATA TCGGCGTTCT3′ |
| Sequence-based reagent | Vgll4-R | This paper | qPCR primers | 5′GGGCTCCATGCT GAATTTCC3′ |
| Sequence-based reagent | Yap1-F | This paper | qPCR primers | 5′GCCATGCTTTCG CAACTGAA3′ |
| Sequence-based reagent | Yap1-R | This paper | qPCR primers | 5′CAAAACGAGGGT CCAGCCTT3′ |
| Sequence-based reagent | Ccn1-F | This paper | qPCR primers | 5′TCGCAATTGGAA AAGGCAGC3′ |
| Sequence-based reagent | Ccn1-R | This paper | qPCR primers | 5’CCAAGACGTGG TCTGAACGA3’ |
| Sequence-based reagent | Birc5-F | This paper | qPCR primers | 5′AGAACAAAATTG CAAAGGAGACCA3′ |
| Sequence-based reagent | Birc5-R | This paper | qPCR primers | 5′GGCATGTCAC TCAGGTCCAA3′ |
| Commercial assay or kit | Click-iTTMEdU Cell Proliferation Kit for Imaging | Thermo Fisher | Cat# C10337 | |
| Commercial assay or kit | Dual-Luciferase Reporter Assay System Technical Manual | Promega | Cat# E1910 | |
| Commercial assay or kit | Opal 4-Color Automation IHC Kit | PerkinElmer | Cat# NEL8200001KT | |
| Commercial assay or kit | RNAscope Multiplex Fluorescent Detection Kit v2 | ACD | Cat# 323,110 | |
| Commercial assay or kit | SYBR green Mix | Roche | Cat# 04913914001 | |
| Commercial assay or kit | PrimeScript RT master Mix | Takara | Cat# RR036A | |
| Chemical compound, drug | Hoechst33342 | Thermo Fisher | Cat# H21492 | |
| Chemical compound, drug | Tamoxifen | Sigma-Aldrich | Cat# T5648 | |
| Chemical compound, drug | Doxcyclinehyclate | Sigma-Aldrich | Cat# D9891 | |
| Chemical compound, drug | Verteporfin | MCE | Cat# HY-B0146 | |
| Software, algorithm | Flow Jo vX | Flow Jo | https://www.flowjo.com | |
| Software, algorithm | GraphPad Prism 6 | GraphPad software | https://www.graphpad.com | |
| Other | DNase I | Sigma-Aldrich | Cat# D4263 | |
| Other | Type IV collagenase | Worthington | Cat# LS004189 | |
| Other | Matrigel | BD | Cat# 354,230 | |
| Other | Dispase | BD | Cat# 354,235 | |
| Other | DAPI | Thermo Fisher | Cat# D1306 | |
| Other | MEM Non-Essential Amino Acids Solution | Thermo Fisher | Cat# 11140050 | |
| Other | L-Glutamine | Thermo Fisher | Cat# 25030081 | |
| Other | ITS | Thermo Fisher | Cat# 41,440 | |
| Other | 2-Mercaptoethanol | Millipore | Cat# ES-007-E | |
| Other | Hydrocortisone | Sigma-Aldrich | Cat# 614,517 | |
| Other | Sodium pyruvate | Thermo Fisher | Cat# 11360070 |
Additional files
Download links
A two-part list of links to download the article, or parts of the article, in various formats.
Downloads (link to download the article as PDF)
Open citations (links to open the citations from this article in various online reference manager services)
Cite this article (links to download the citations from this article in formats compatible with various reference manager tools)
Selective YAP activation in Procr cells is essential for ovarian stem/progenitor expansion and epithelium repair
eLife 11:e75449.
https://doi.org/10.7554/eLife.75449


