The organic cation transporter 2 regulates dopamine D1 receptor signaling at the Golgi apparatus
- Department of Biochemistry & Biophysics, University of California, San Francisco, United States
- Biochemistry Department, Weill Cornell Medicine, United States
- Cardiovascular Research Institute, University of California, San Francisco, United States
Figures
Figure 1 with 8 supplements

Conformational biosensor detects activated D1DR at the plasma membrane and the Golgi upon dopamine (DA) stimulation.
(a) Nb6B9 binds to the receptor exclusively in its active conformation. We fused Nb6B9 to GFP and used it as a conformational biosensor for D1DR. (b) Confocal images of representative D1DR-expressing HeLa (top panel) and HEK293 cells (lower panel) with Nb6B9-GFP and GalT-mRFP expression before and after 10 µM DA addition. Stimulation with 10 µM DA results in recruitment of Nb6B9 to active D1DR at the plasma membrane and the Golgi in HeLa cells (n = 37 cells, Pearson’s coefficient = 0.62, respectively, nine biological replicates); 10 µM DA treatment only activates plasma membrane-localized D1DR in HEK293 cells (n = 17 cells, Pearson’s coefficient = 0.15, five biological replicates). Lower panels show zoomed images of insets for Snap-D1DR, Nb6BP, and the Golgi marker. Arrows indicate active D1DR at plasma membrane; arrowhead indicates active D1DR at Golgi membrane; Scale bar = 10 µm. (c) Quantification of D1DR activation at the Golgi in HeLa cells upon addition of increasing concentrations of DA; normalized fluorescence intensity of Nb6B9 at Golgi relative to Snap-tagged-D1DR at Golgi. Quantifications were baseline corrected after addition of each dose (n = 27 cells, four biological replicates). (d) Quantification of D1DR activity at Golgi in HeLa and HEK293 cells; normalized fluorescence intensity of Nb6B9 at Golgi relative to D1DR at Golgi labeled with Snap-tagged-D1DR.
Figure 1—figure supplement 1
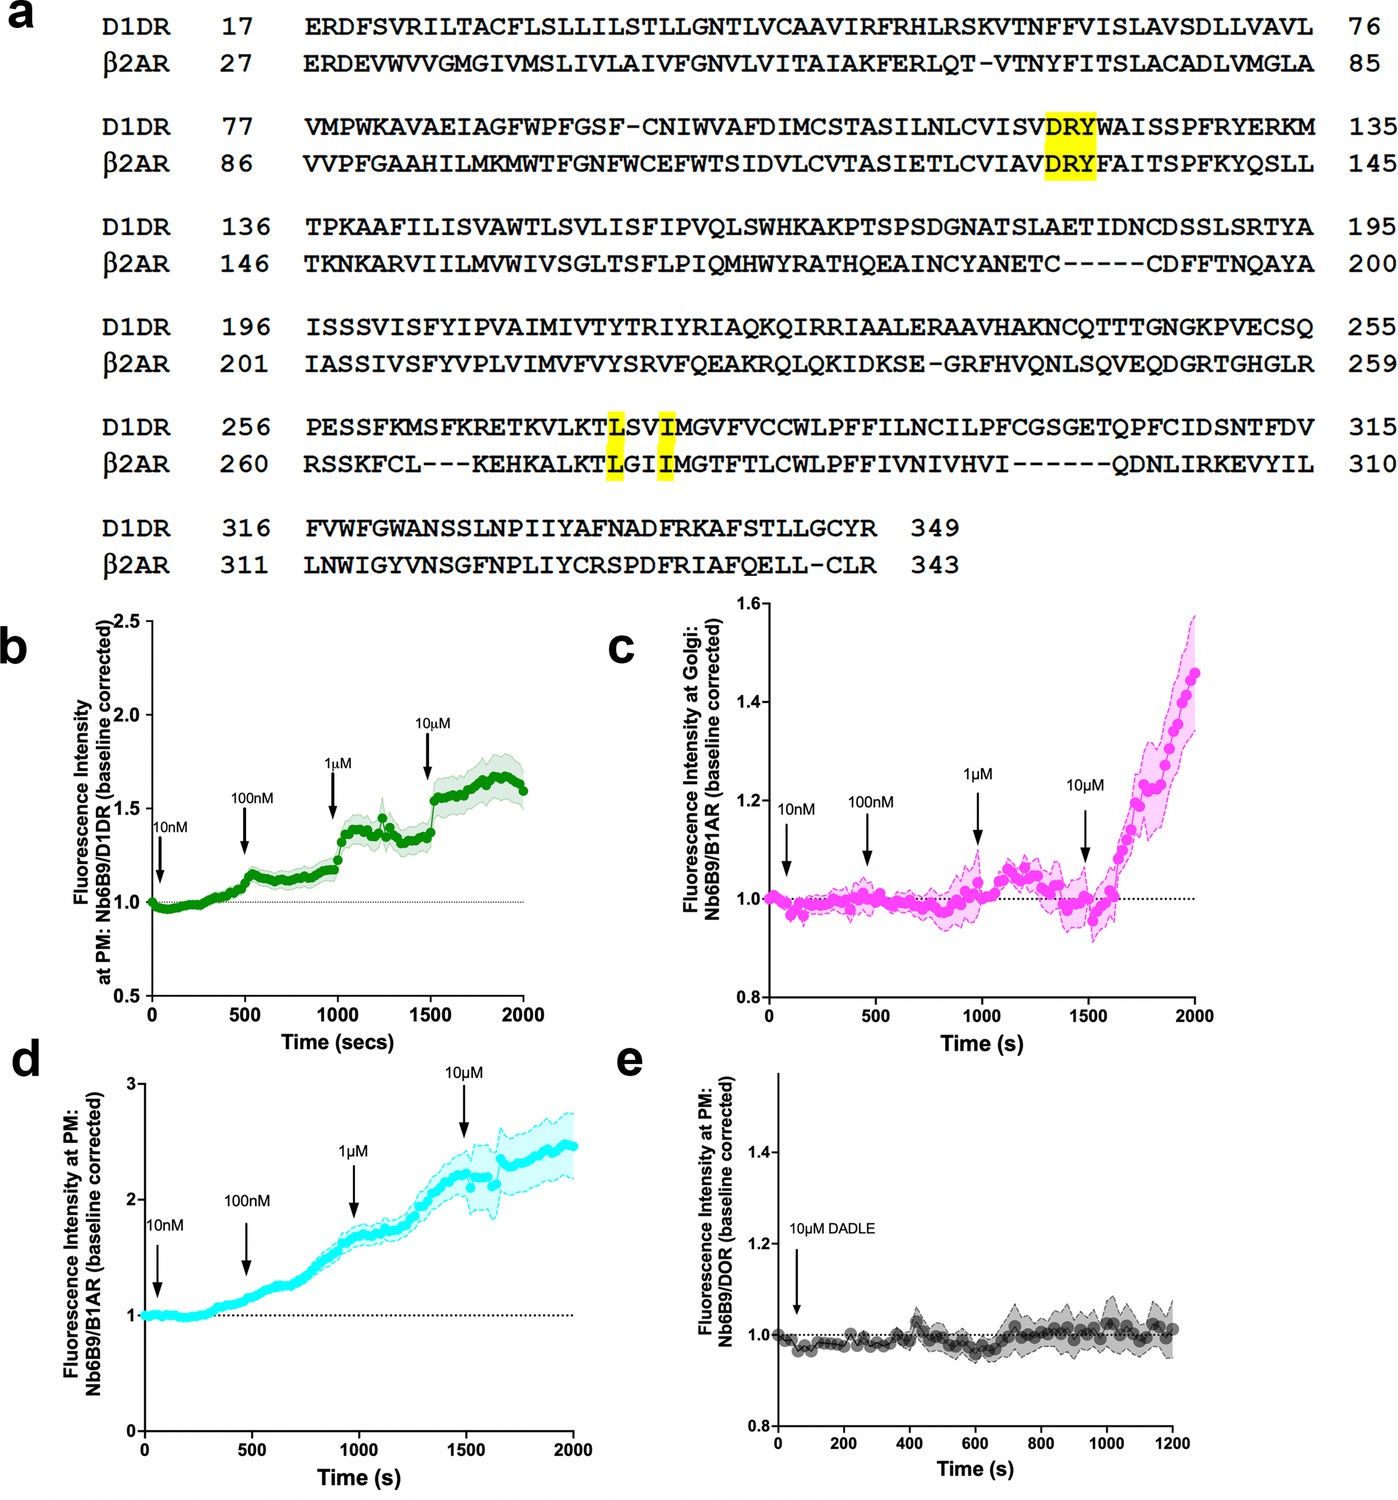
Nb6B9 detects activated D1DR and β1AR at the plasma membrane and the Golgi in a dose-dependent manner, but not delta opioid receptors.
(a) Nanobody binding motifs are conserved between β2AR and D1DR. (b) Quantification of D1DR activation at the plasma membrane (PM) in HeLa cells upon addition of increasing dopamine (DA) concentrations; normalized fluorescence intensity of Nb6B9 at PM relative to Snap-tagged-D1DR at PM (n = 26, three biological replicates). (c) Quantification of β1AR activation at the Golgi in HeLa cells upon addition of increasing epinephrine concentrations; normalized fluorescence intensity of Nb6B9 at Golgi relative to Snap-tagged- β1AR at Golgi (n = 27, three biological replicates). (d) Quantification of β1AR activation at the PM in HeLa cells upon addition of increasing epinephrine concentrations; normalized fluorescence intensity of Nb6B9 at PM relative to Snap-tagged- β1AR at PM (n = 33, three biological replicates). Quantifications were baseline corrected after addition of each dose. (e) Quantification of delta opioid receptor (DOR) activation at the PM in HeLa cells upon addition of 10 μM D-Ala2-D-Leu2-Enkephalin (DADLE). Normalized fluorescence intensity of Nb6B9 at PM relative to GFP-DOR at the PM (n = 14, two biological replicates).
Figure 1—figure supplement 2
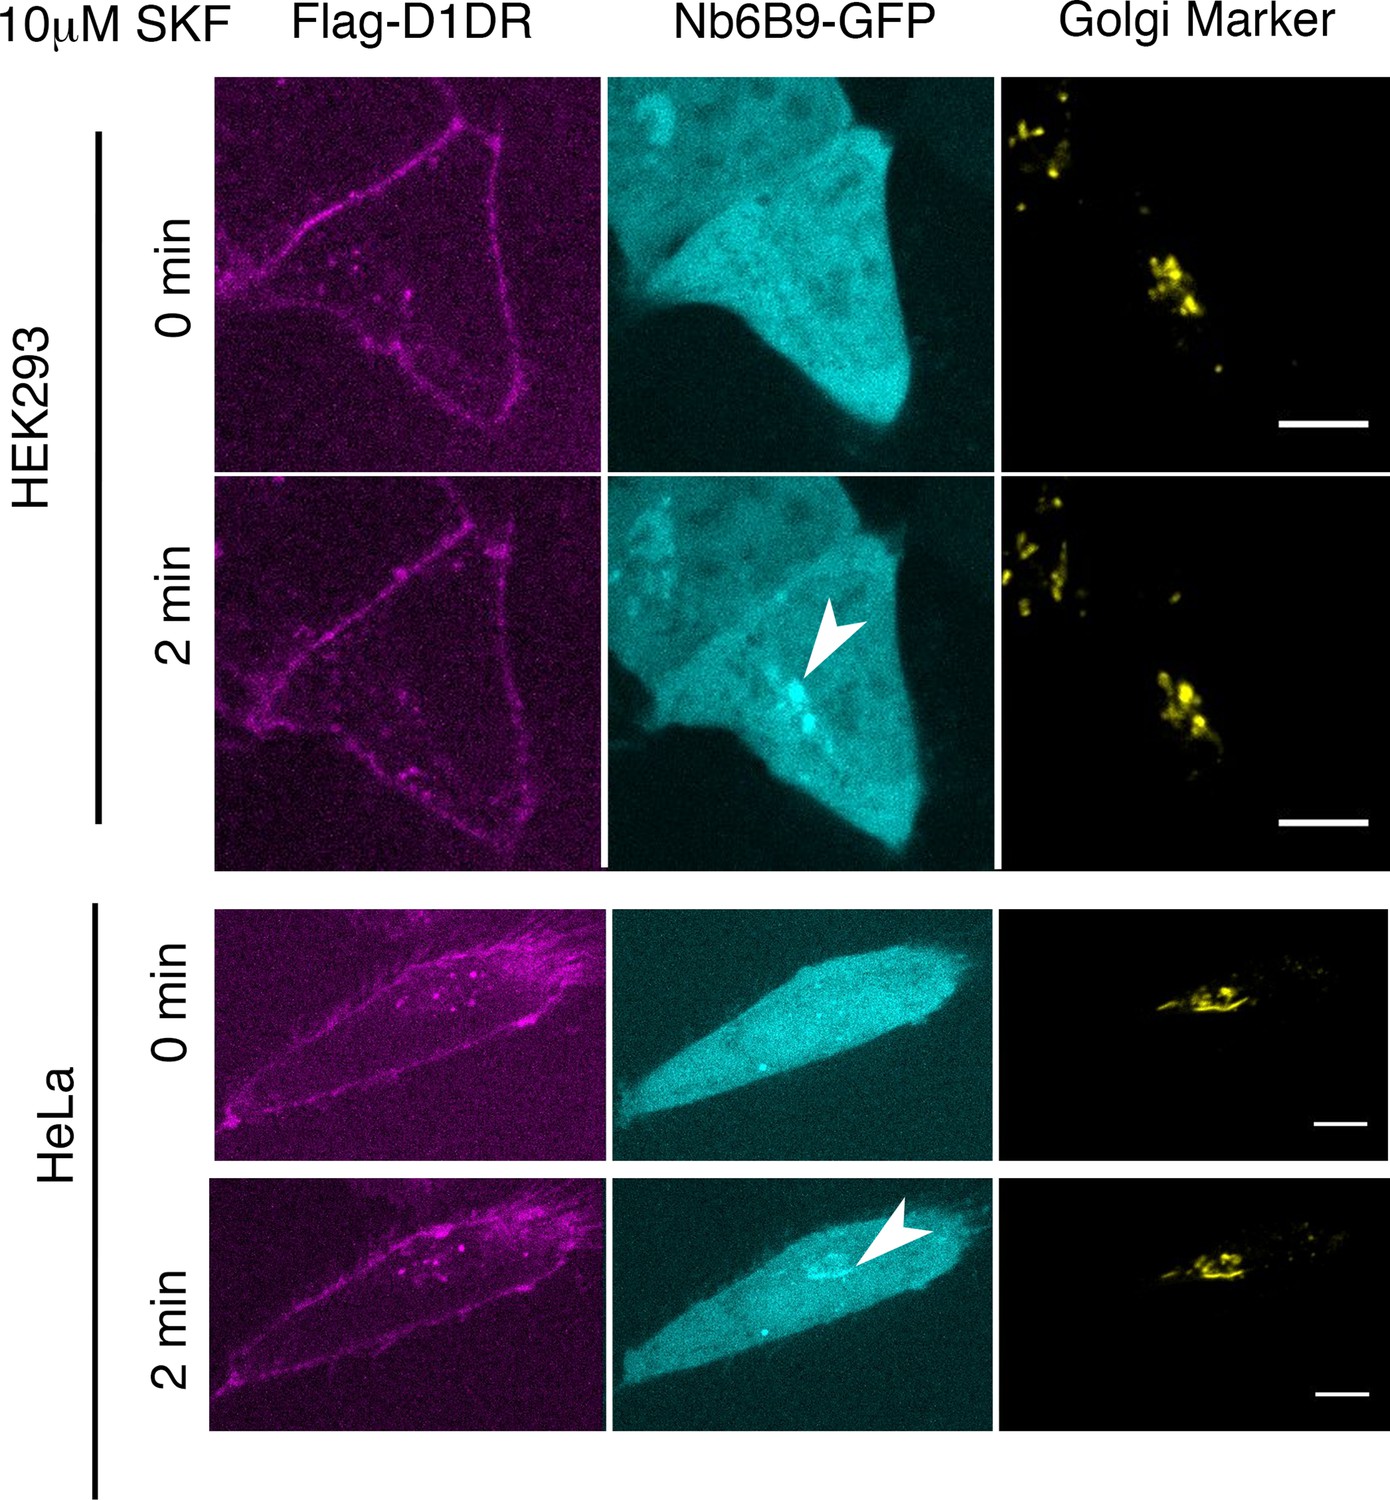
Conformational biosensor detects activated D1DR at the plasma membrane and the Golgi upon SKF81297 stimulation.
Representative Flag-D1DR-expressing HEK293 and HeLa cells with Nb6B9-GFP and GalT-mRFP localization at indicated times after 10 µM SKF81297 addition. Stimulation with 10 µM SKF81297 results in recruitment of Nb6B9 to active D1DR at the plasma membrane and the Golgi in both HEK293 and HeLa cells. Arrowheads indicate active D1DR at Golgi membrane; Scale bar = 10 µm.
Figure 1—figure supplement 3
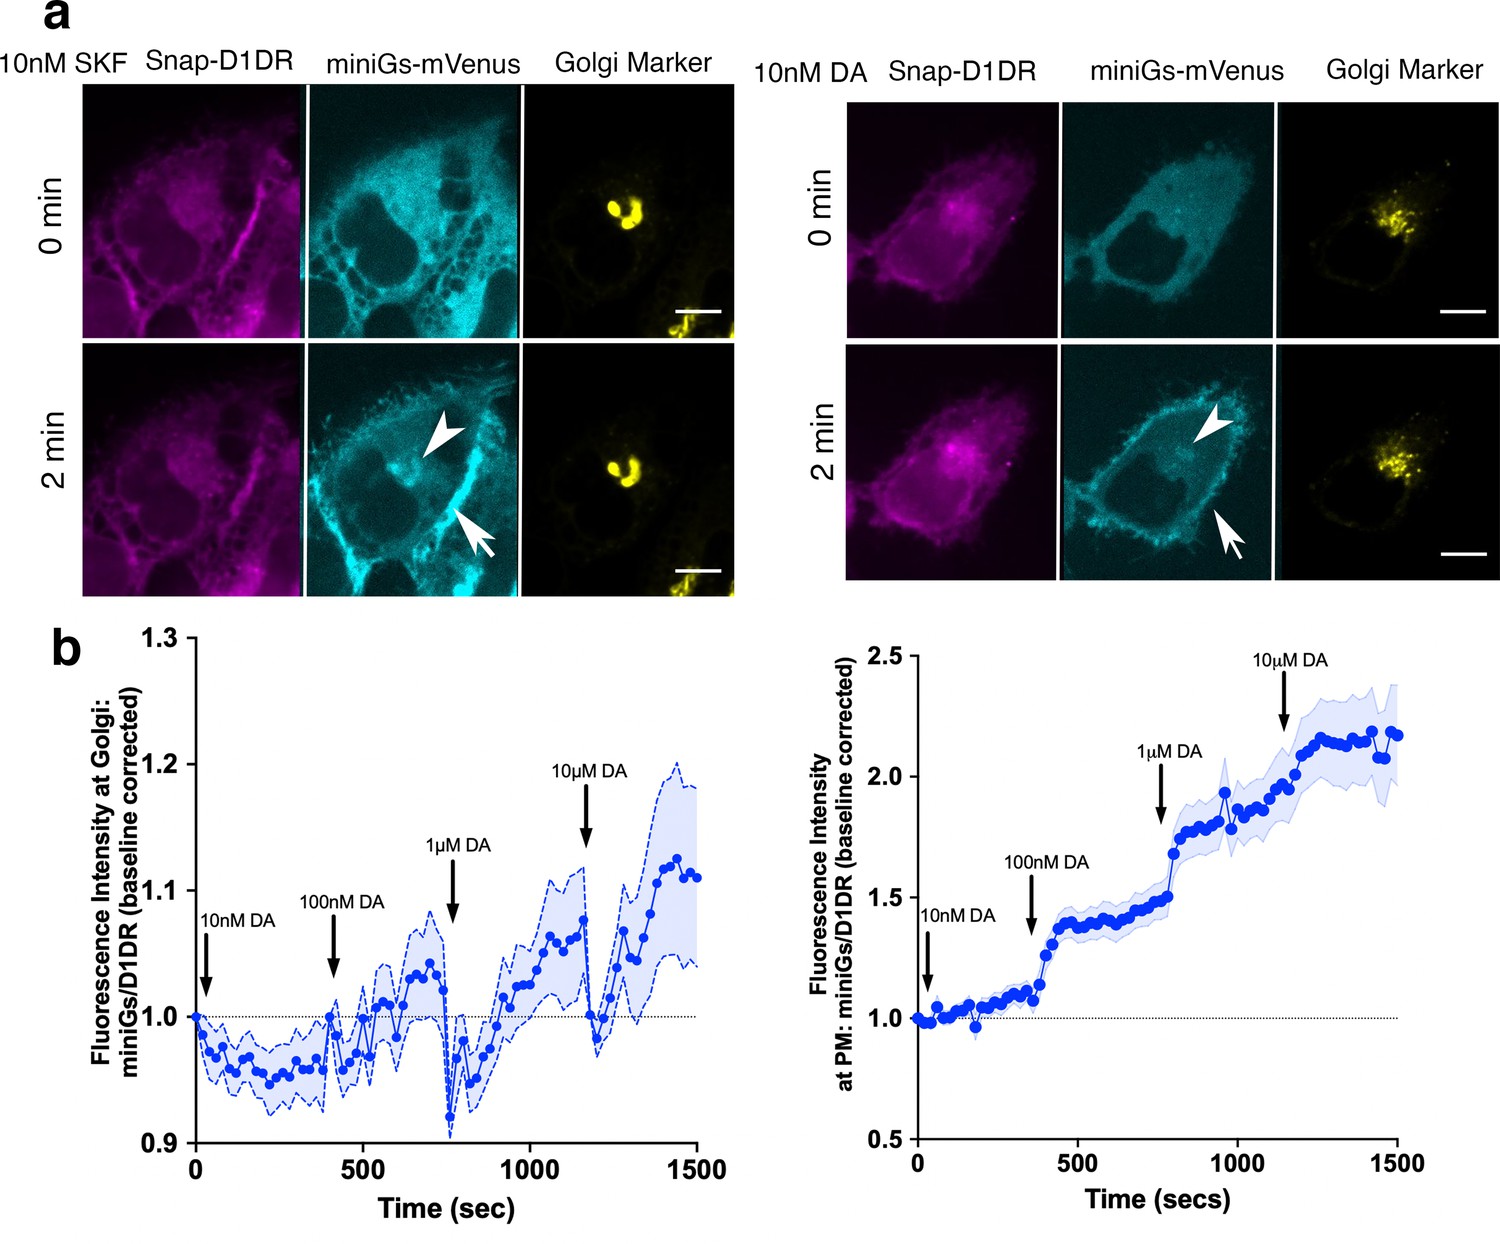
MiniGαs protein biosensor detects active D1DR at the plasma membrane and the Golgi.
(a) Representative Snap-D1DR-expressing HeLa cell with miniGs-mVenus and GalT-mRFP localizations at indicated times after 10 nM SKF81297 (left panels) and dopamine (DA) (right panels) addition. Arrows indicate active D1DR at plasma membrane; Arrowheads indicate active D1DR at Golgi membrane; Scale bar = 10 µm. (b) Quantification of D1DR activation at the Golgi in HeLa cells upon addition of increasing DA concentrations; normalized fluorescence intensity of miniGs-mVenus relative to Snap-tagged-D1DR at Golgi (left) or the plasma membrane (right). Quantifications were baseline corrected after addition of each dose (n = 30, three biological replicates).
Figure 1—figure supplement 4
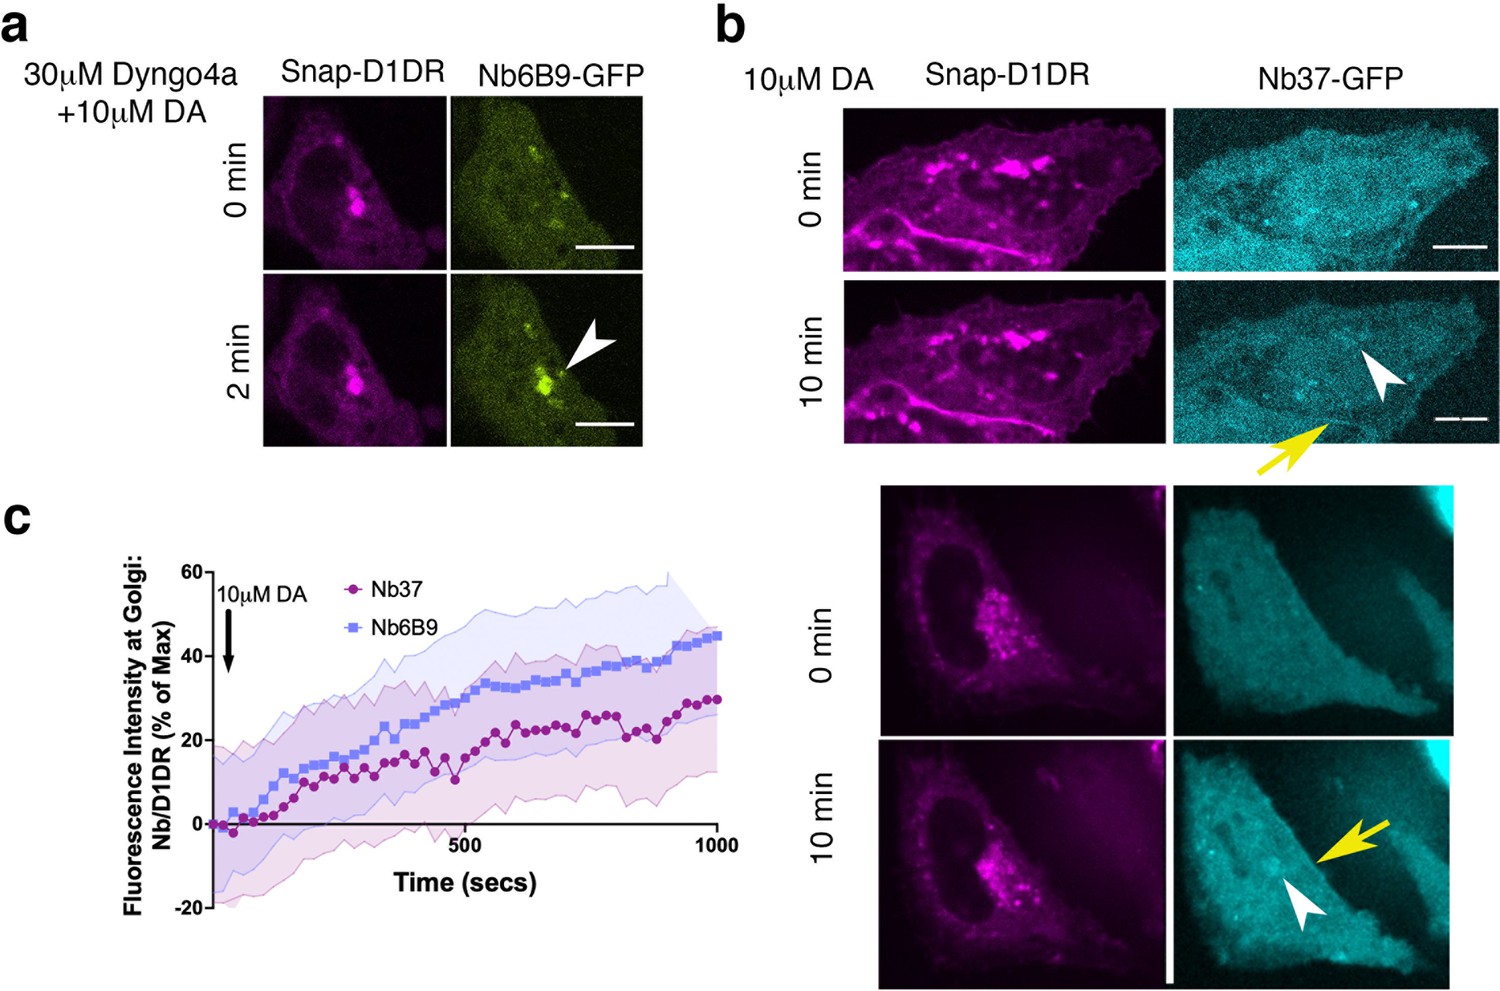
Conformational biosensors detect activated D1DR and Gs at the plasma membrane and the Golgi.
(a) Representative HeLa cell expressing Snap-D1DR and Nb6B9-GFP. Cells were incubated with 30 µM Dyngo-4a, a dynamin inhibitor that blocks endocytosis, stimulated with 10 µM dopamine (DA) at indicated times. Golgi-localized D1DR is activated when endocytosis is blocked, suggesting that activation of the Golgi pool is not dependent on D1DR internalization. White arrowhead indicates active D1DR at Golgi membrane; Scale bar = 10µm (b) Representative HeLa cell expressing Snap-D1DR and Nb37-GFP at indicated times after 10 µM DA addition. Nb37 binds to the GPCR-Gs protein complex in the nucleotide-free state. White arrowheads indicate active D1DR-Gs protein complex at the Golgi; yellow arrows indicate active D1DR-Gs complex at the plasma membrane; Scale bar = 10µm. (c) Quantification of Nb37-GFP and Nb6B9-GFP intensity at Golgi, normalized to Golgi-D1DR. Both nanobodies show similar kinetics of Golgi-localized D1DR activation after addition of 10 µM DA.
Figure 1—video 1
Confocal image series of D1DR-expressing HeLa cells (magenta), Nb6B9-GFP (cyan), and the Golgi marker (yellow), incubated with 10 μM dopamine.
Figure 1—video 2
Confocal image series of D1DR-expressing HEK293 cells (magenta), Nb6B9-GFP (cyan), and the Golgi marker (yellow), incubated with 10 μM dopamine.
Figure 1—video 3
Confocal image series of D1DR-expressing HeLa cells (magenta), Nb6B9-GFP (cyan), and the Golgi marker (yellow), incubated with 10 μM SKF81927.
Figure 1—video 4
Confocal image series of D1DR-expressing HEK293 cells (magenta), Nb6B9-GFP (cyan), and the Golgi marker (yellow), incubated with 10 μM SKF81927.
Figure 2 with 5 supplements

OCT2 facilitated dopamine (DA) transport to the Golgi-localized D1DR.
(a) Representative HeLa cell expressing Snap-D1DR, Nb6B9-GFP, and GalT-mRFP expression pretreated with 100 μM imipramine for 15 min, before and after 10 μM DA addition. Inhibition of OCT2 blocks Golgi-localized D1DR activation but SKF81297 can still reach the Golgi membranes and activate D1DR Golgi pool (n = 30 cells, Pearson’s coefficient = 0.2 and 0.68 after DA and SKF addition, respectively, three biological replicates). Arrow indicates active D1DR at plasma membrane; arrowhead indicates active D1DR at Golgi membrane; Scale bar = 10 µm. (b) Quantification of Nb6B9-GFP recruitment at Golgi upon 10 μM DA stimulation in HeLa cells pretreated with 10 and 100 μM imipramine, 10 μM corticosterone, and (c) after 10 μM SKF81297 addition; normalized fluorescence intensity of Nb6B9-GFP relative to Snap D1DR at Golgi (n = 30, three biological replicates). (d) Representative HeLa cell expressing Snap-D1DR, miniGs-mApple, and SLC22A2 shRNA-B-GFP, before and after 10 μM DA addition. SLC22A2 shRNA blocks Golgi-localized D1DR activation. 10 μM SKF81297 addition activates D1DR at the Golgi (n = 16 cells, Pearson’s coefficient = –0.05 and 0.74 after DA and SKF addition, respectively, three biological replicates). (e) Detection of OCT2 expression in HeLa cells expressing different shRNAs by Western blot. (f) Quantification of D1DR activation at the Golgi in HeLa cells expressing scramble or SLC22A2 shRNAs upon addition of 10 μM DA; normalized fluorescence intensity of Nb6B9 at Golgi relative to Snap-tagged-D1DR at Golgi. (g) Quantification of D1DR activation at the Golgi in HeLa cells expressing SLC22A2 shRNA-B and D upon addition of 10 μM SKF81297.
Figure 2—figure supplement 1
OCT2 expression is required for facilitated transport of DA to the Golgi-localized D1DR.
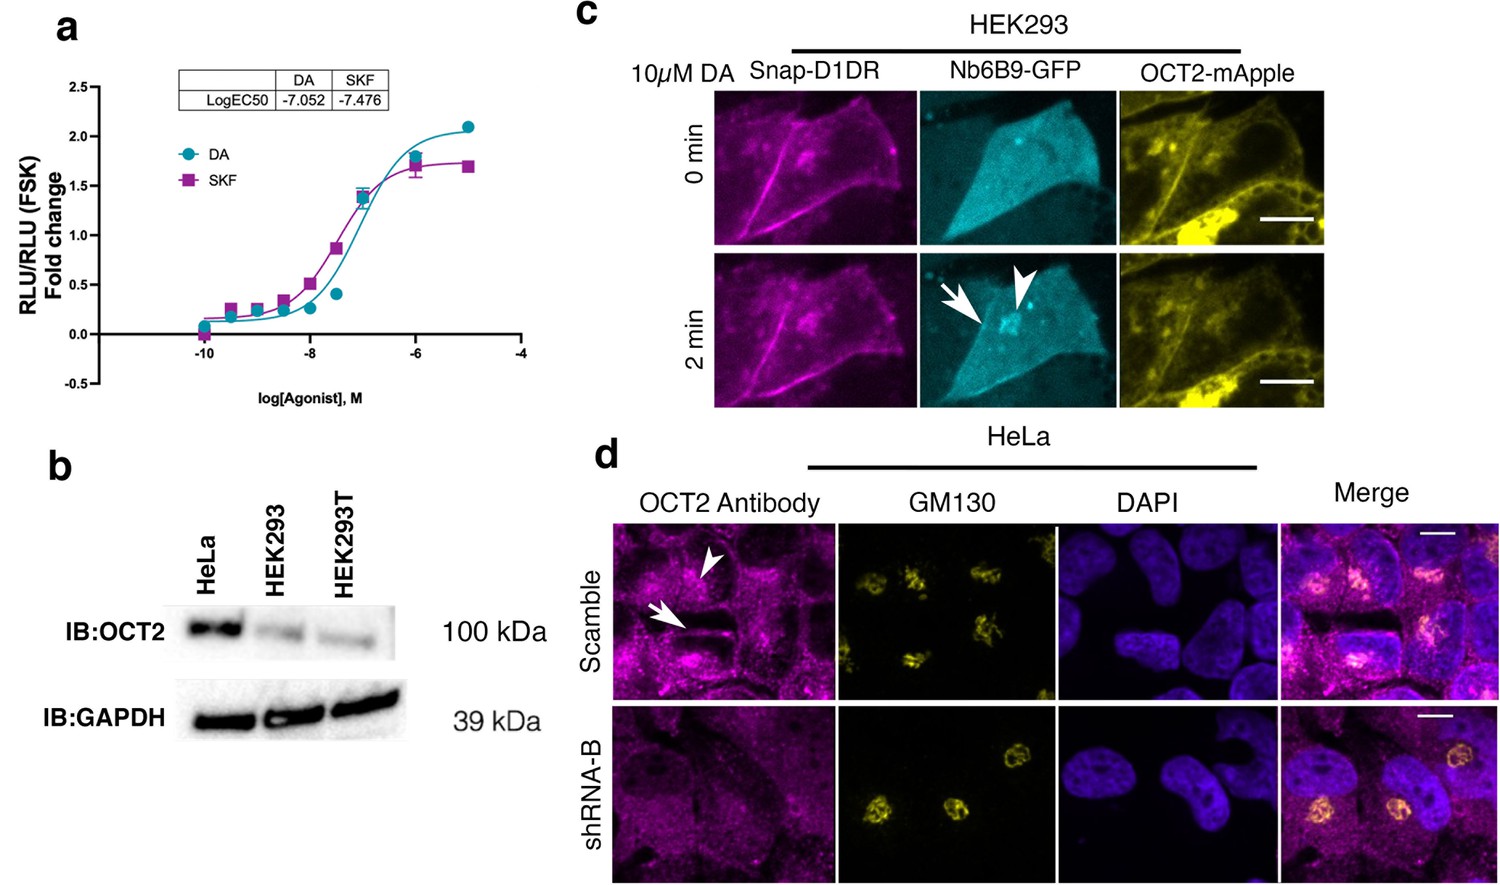
(a) Dose–response curve of forskolin-normalized D1DR-mediated cAMP response in HEK293 cells treated with SKF81297 or dopamine (DA); SKF and DA have similar potency and efficacy, thus differences in signaling at Golgi in HEK293 cells are not due to differences in drug potency or efficacy (mean ± SEM, n = 3 biological replicates). (b) Detection of OCT2 expression by Western blot. HeLa cells express OCT2, while HEK293 cells do not. (c) Representative HEK293 cell expressing Snap-D1DR, Nb6B9-GFP, and OCT2-mApple at indicated times after 10 µM DA addition. Overexpression of OCT2 in HEK293 cells rescues Golgi-localized D1DR activation (n = 16 cells, Pearson’s coefficient = 0.67, six biological replicates). Arrow indicates active D1DR at plasma membrane; arrowhead indicates active D1DR at Golgi membrane; Scale bar = 10 µm. (d) Endogenous localization of OCT2 at the plasma membrane and the Golgi membranes. HeLa cells are labeled with OCT2-specific antibody and the Golgi antibody (GM130) (top panels). Antibody staining of OCT2 is not detectable in SLC22A2 shRNA expressing cells; n = 25 cells, Pearson’s coefficient = 0.64, three biological replicates. Arrow indicates active OCT2 at plasma membrane; arrowhead indicates active OCT2 at Golgi membrane; Scale bar = 10 µm.
Figure 2—figure supplement 2
OCT2, but not OCT3, is required for DA-mediated D1DR activation at the Golgi.
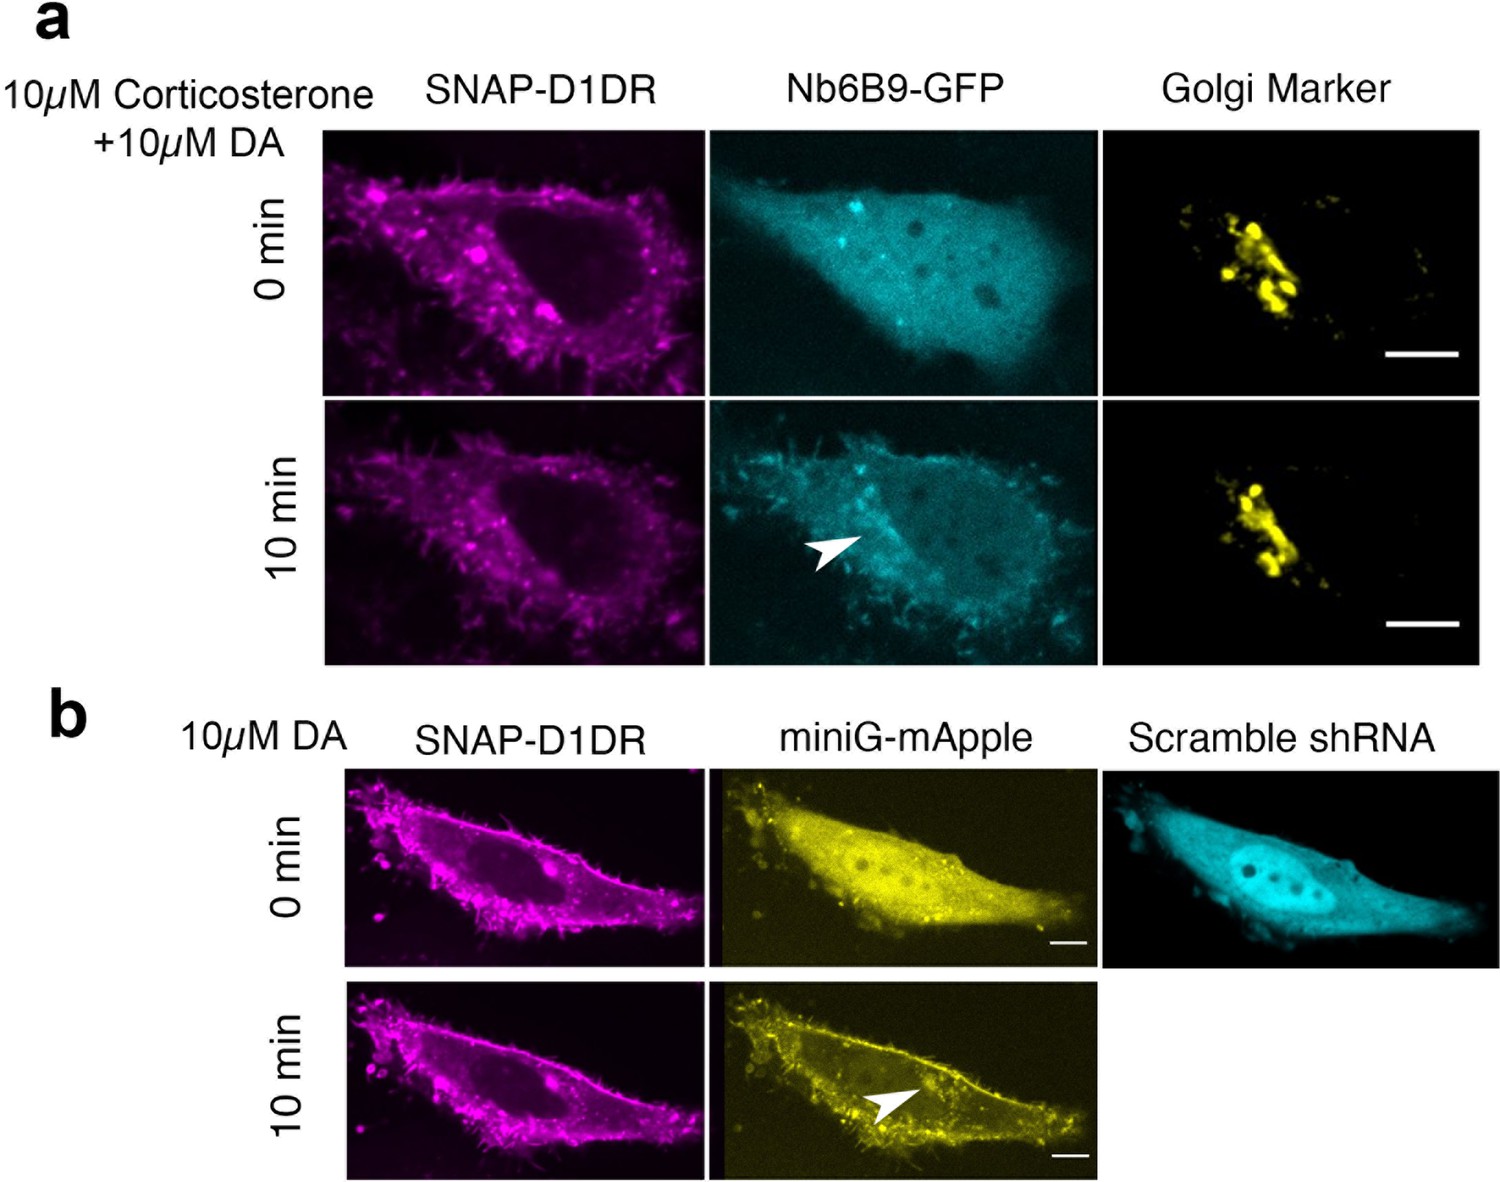
(a) Representative HeLa cell expressing Snap-D1DR, Nb6B9-GFP, and GalT-mRFP pretreated with 10 μM corticosterone, an OCT3-selective inhibitor, for 15 min, before and after 10 µM dopamine addition. Inhibition of OCT3 does not block Golgi-localized D1DR activation (n = 18 cells, Pearson’s coefficient = 0.72, two biological replicates). (b) Representative HeLa cell expressing Snap-D1DR, miniGs-mApple, and scramble shRNA-GFP, before and after 10 µM dopamine addition. Scramble shRNA does not block Golgi-localized D1DR activation (n = 10 cells, Pearson’s coefficient = 0.6, four biological replicates). Arrowheads indicate active D1DR at the Golgi; Scale bar = 10 µm.
Figure 2—video 1
Confocal image series of D1DR-expressing HeLa cells (magenta), Nb6B9-GFP (cyan), and Galt-mApple (yellow), pretreated with 100 μM imipramine and incubated with 10 μM dopamine and SKF81297.
Figure 2—video 2
Confocal image series of D1DR-expressing HEK293 cells (magenta), Nb6B9-GFP (cyan), and OCT2-mApple (yellow), incubated with 10 μM dopamine.
Figure 2—video 3
Confocal image series of D1DR-expressing HeLa cells (magenta), miniGs-mApple (yellow), expressing SLC22A2 shRNA-B and incubated with 10 μM Dopamine for 20 min and then 10 μM SKF81297.
Figure 3 with 3 supplements

Regulation of dopamine (DA)-mediated activation of the Golgi-localized D1DR in striatal neurons by OCT2.
(a) Representative medium spiny neurons (MSN) expressing Snap-D1DR and Nb6B9-GFP at indicated times after 10 µM DA addition. DA stimulates D1DR activation at the Golgi in MSNs (n = 22 cells, Pearson’s coefficient = 0.67, six biological replicates). Arrow indicates active D1DR at plasma membrane; Arrowhead indicates active D1DR at Golgi membrane; Scale bar = 10 µm. (b) Representative MSN cell expressing Snap-D1DR and Nb6B9-GFP, pretreated with 100 μM imipramine for 15 min, before and after 10 µM DA addition. Inhibition of OCT2 blocks Golgi-localized D1DR activation at MSN n = 18 cells, Pearson’s coefficient = 0.38, six biological replicates but SKF81297 can still reach the Golgi membranes and activate D1DR Golgi pool (n = 6 cells, Pearson’s coefficient = 0.75, four biological replicates). Arrow indicates active D1DR at plasma membrane; Arrowhead indicates active D1DR at Golgi membrane; scale bar = 10 μm. (c) Quantification of Nb6B9-GFP recruitment at Golgi upon 10 μM DA stimulation in MSNs cells pretreated with OCT2 inhibitor; normalized fluorescence intensity of Nb6B9-GFP relative to Snap D1DR at Golgi (n = 12 and 7, respectively, five biological replicates). (d) Representative MSN expressing Snap-D1DR and Nb37-GFP before and after 10 µM DA addition. DA stimulates G protein activation at the Golgi in D1DR-expressing MSNs (n = 10 cells, Pearson’s coefficient = 0.34 and 0.62 before and after 10 µM DA stimulation, six biological replicates). Arrowhead indicates active Gs at Golgi membrane; right panels show zoomed images of insets for Snap-D1DR, Nb37-GFP, and the Golgi marker (GM130). Scale bar = 10 μm.
Figure 3—figure supplement 1
Medium spiny neurons endogenously express OCT2 and D1DR at the plasma membrane and the Golgi.
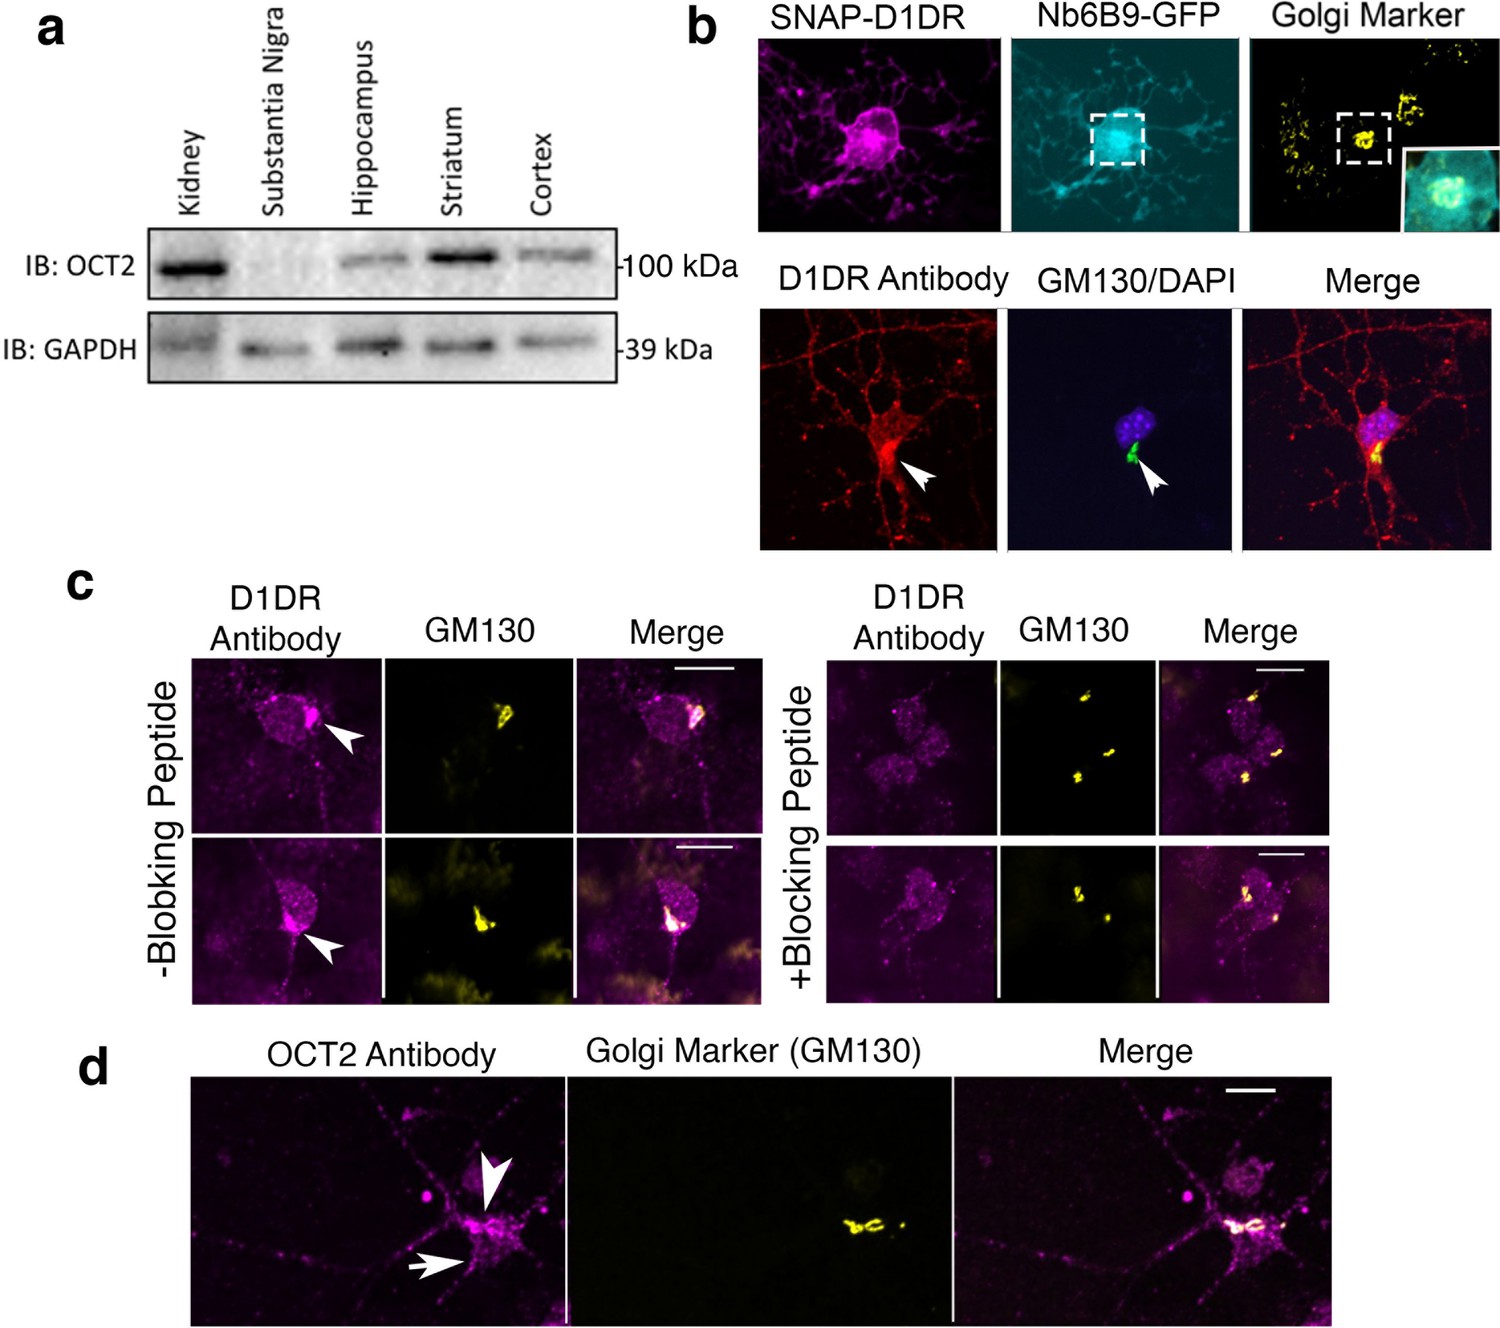
(a) Detection of OCT2 expression in different tissue extracts and brain slices by Western blot. (b) Top panel: colocalization of Nb6B9-GFP at the Golgi after 10 μM dopamine (DA) stimulation for 10 min. Lower panel: endogenous localization of D1DR at the plasma membrane and the Golgi membranes. Medium spiny neuron (MSN) cells were labeled with D1DR-specific antibody and the Golgi antibody (GM130). Arrowhead indicates Golgi localizations. (c) Endogenous localization of D1DR at the plasma membrane and the Golgi membranes in the presence or absence of blocking peptide. MSN cells were labeled with D1DR-specific antibody and the Golgi antibody (GM130) (n = 36 cells, Pearson’s coefficient = 0.67, three biological replicates). Arrowhead indicates active D1DR at Golgi membrane; scale bar = 10 µm. (d) Endogenous localization of OCT2 at the plasma membrane and the Golgi membranes. MSN cells were labeled with OCT2-specific antibody and the Golgi antibody (GM130) (n = 34 cells, Pearson’s coefficient = 0.6, three biological replicates).
Figure 3—video 1
Confocal image series of D1DR-expressing medium spiny neurons (MSNs) (magenta) and Nb6B9-GFP (cyan), incubated with 10 μM dopamine.
Figure 3—video 2
Confocal image series of D1DR-expressing medium spiny neurons (MSNs) (magenta) and Nb6B9-GFP (cyan), pretreated with 100 μM imipramine and incubated with 10 μM dopamine and SKF81297.
Figure 4
Both plasma membrane and Golgi-localized D1DR promote cAMP production.
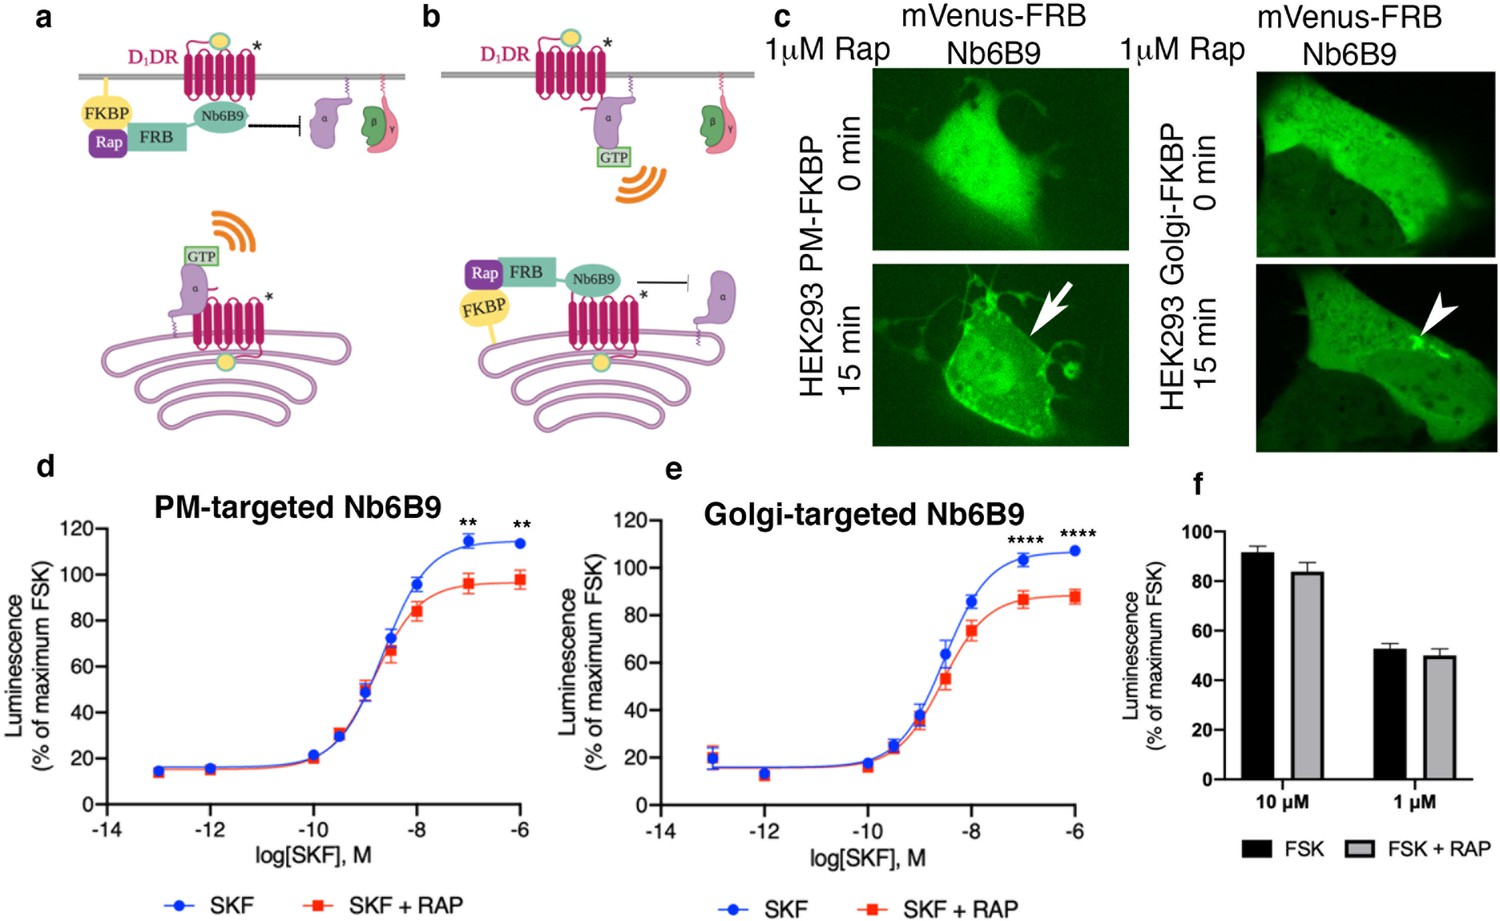
Model of blocking D1DR-Gs coupling at the plasma membrane (PM) (a) and the Golgi membrane (b) after recruitment of mVenus-FRB-Nb6B9. FKBP was targeted to either the PM (a) or the Golgi membrane (b), and its binding partner FRB-mVenus was fused to Nb6B9. Upon addition of rapalog (rapamycin analog), FKBP and FRB heterodimerize and sequester Nb6B9 to either membrane, disrupting G protein coupling to the receptor and thus blocking signaling from each respective location. (c) Representative confocal images of HEK293 cells expressing either PM or Golgi targeted FKBP showing mVenus-FRB Nb6B9 localization at indicated times after rapalog addition. Representative cells confirm inducible sequestration of Nb6B9 to either PM or Golgi. Arrow indicates PM; arrowhead indicates Golgi. (d) Forskolin-normalized D1DR-mediated cAMP response with and without rapalog pretreatment (1 µM, 15 min) and SKF81297 at indicated concentrations in HEK293-expressing PM-FKBP (mean ± SEM, n = 6 biological replicates, p-values of 0.0021 and 0.0015 at 10–7 and 10–6, respectively). (e) Forskolin-normalized D1DR-mediated cAMP response with and without rapalog pretreatment (1 µM, 15 min) and SKF81297 at indicated concentrations in HEK293-expressing Golgi-FKBP (mean ± SEM, n = 6 biological replicates, p-values of <0.0001 at 10–7 and 10–6). (f) Effect of 1 and 10 µM rapalog on forskolin-mediated cAMP response (n = 3 biological replicates).
Figure 5 with 1 supplement
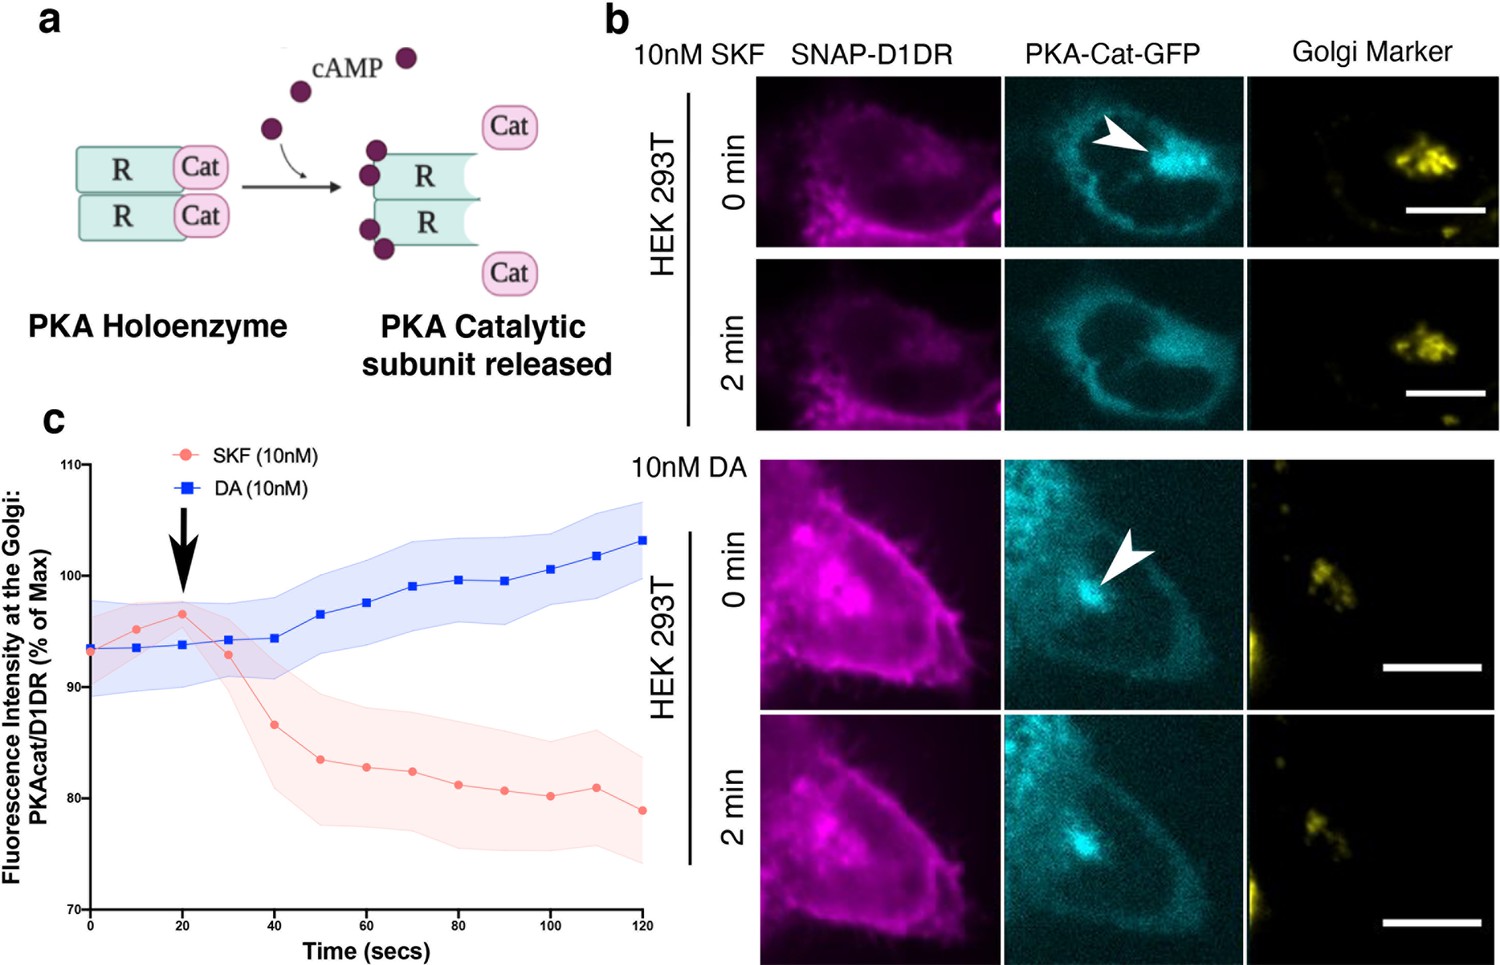
Golgi-localized protein kinase A (PKA) is activated by D1DR at the Golgi.
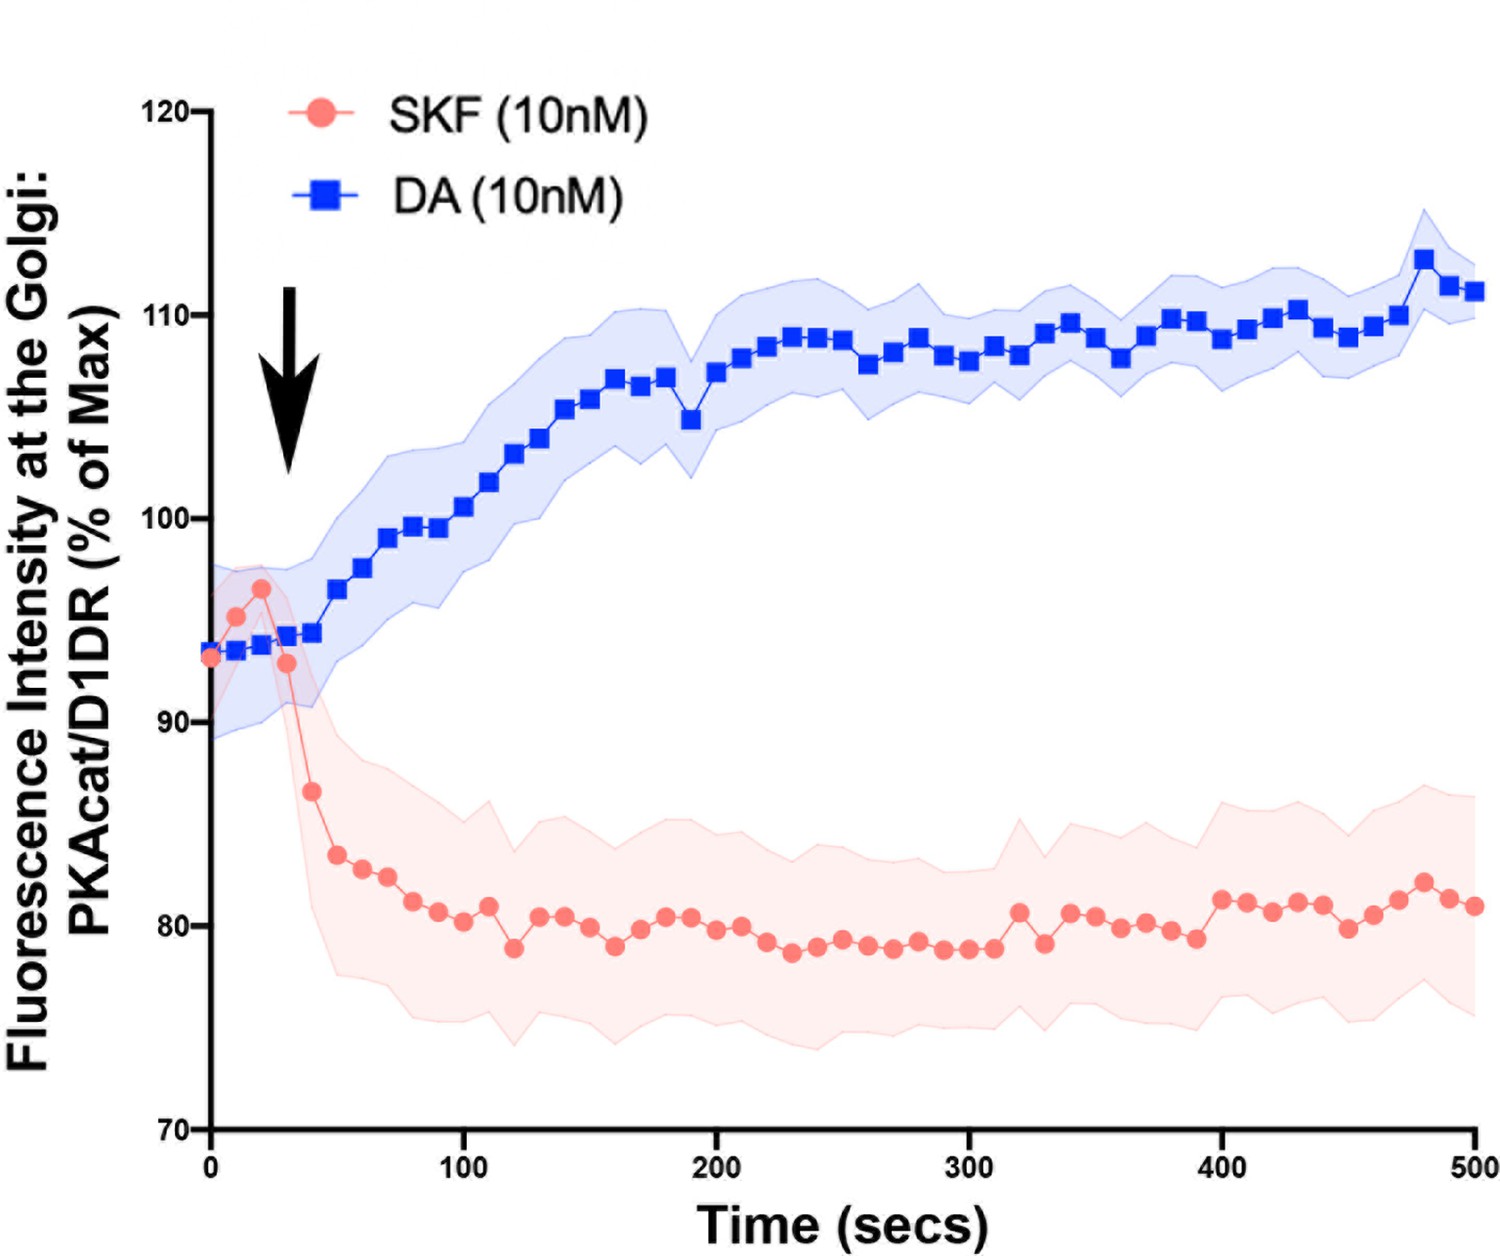
(a) Model of PKA activation; cAMP binds PKA regulatory subunit (R), rendering PKA catalytic subunit (PKA-cat) dissociation. (b) Confocal images of representative D1DR-expressing HEK293 cells with endogenous PKA-cat-GFP and GalT-mRFP expression at indicated times after 10 nM SKF81927 (top panels; n = 11 cells, Pearson’s coefficient 0.53, three biological replicates) or 10 nM dopamine (DA) (lower panels, n = 12 cells, Pearson’s coefficient = 0.64, three biological replicates). Arrowhead indicates PKAcat at Golgi membrane; scale bar = 10 µm. (c) Normalized fluorescence intensity of PKAcat relative to Golgi-D1DR after treatment with 10 nM DA or 10 nM SKF81927.
Figure 5—figure supplement 1
Kinetics of PKAcat-GFP dissociation from the Golgi membrane upon activation of the D1DR Golgi pools.
Figure 6 with 1 supplement

Rapid activation of Golgi-localized D1DR and protein kinase A (PKA) by photo-release of dopamine.
(a) Dopamine is uncaged from (N)–1-(2 nitrophenyl) ethylcarboxy-3,4-dihydroxyphenethylamine (NPEC) upon blue light (UV) exposure. (b) Confocal images of representative D1DR-expressing HEK293 cells with endogenous PKA-cat-GFP and Nb6B9-mApple expression, incubated with 1 μM NPEC-caged dopamine and at indicated times after blue light exposure (n = 46 cells, four biological replicates). Arrowhead indicates Nb6B9 recruitment to the Golgi membrane; scale bar = 10 µm. (c) Normalized fluorescence intensity of Nb6B9-mApple and PKAcat relative to Golgi-D1DR after blue light exposure.
Figure 6—video 1
Confocal image series of D1DR-expressing (magenta) HEK293 cells with endogenous PKA-cat-GFP (cyan) and Nb6B9-mApple (orange), incubated with 1 μM (N)–1-(2 nitrophenyl) ethylcarboxy-3,4-dihydroxyphenethylamine (NPEC)-caged dopamine.
Tables
Key resources table
| Reagent type (species) or resource | Designation | Source or reference | Identifiers | Additional information | |
|---|---|---|---|---|---|
| Cell line (Homo sapiens) | HEK293 | ATCC | CRL-1573.3 | Mycoplasma tested negative | |
| Cell line (H. sapiens) | HEK293T | ATCC | ACS-4500 | Mycoplasma tested negative | |
| Cell line (H. sapiens) | HeLa | ATCC | CRM-CCL-2 | Mycoplasma tested negative | |
| Antibody | Anti-dopamine receptor D1(rabbit polyclonal) | Abcam | ab216644 | IF (1:100) | |
| Antibody | Anti-GM130 (mouse monoclonal) | BD Biosciences | 610822 | IF (1:1000) | |
| Antibody | Anti-SLC22A2 (rabbit polyclonal) | Abcam | ab170871 | WB (1:1000) | |
| Antibody | Anti-SLC22A2 (rabbit polyclonal) | ABclonal | A14061 | IF (1:100) | |
| Antibody | Anti-GAPDH (mouse monoclonal) | Proteintech | 60004-1 | WB (1:10,000) | |
| Antibody | Anti-HRP-conjugated IgG (rabbit polyclonal) | GE Healthcare | P132460 | WB (1:10000) | |
| Antibody | Anti-mouse IgG (donkey polyclonal) | Thermo Fisher | A32766 | IF (1:10,000) | |
| Antibody | Anti-rabbit IgG (donkey polyclonal) | Thermo Fisher | A32794 | IF (1:10,000) | |
| Antibody | Anti-dopamine receptor D1 (rabbit polyclonal) | Proteintech | 17934-1-AP | IF (1:100) | |
| Peptide, recombinant protein | D1DR blocking peptide | Proteintech | Ag12366 | IF (1:25) | |
| Chemical compound, drug | Snap-Cell 647 | NEB | S9102S | ||
| Chemical compound, drug | Dopamine hydrochloride | Sigma | 200-527-8 | ||
| Chemical compound, drug | SKF81297 hydrobromide | Tocris | 1447 | ||
| Chemical compound, drug | NPEC-caged-dopamine | Tocris | 3992 | ||
| Chemical compound, drug | A/C heterodimerizer | Takara | 635056 | ||
| Chemical compound, drug | Dyngo | Abcam | ab120689 | ||
| Chemical compound, drug | Forskolin | Sigma | F6886-10MG | ||
| Chemical compound, drug | Imipramine | Sigma | 113-52-0 | ||
| Chemical compound, drug | Corticosterone | Sigma | 200-019-6 | ||
| Software, algorithm | Prism | GraphPad | |||
| Software, algorithm | ImageJ | Imagej.net/contributors | |||
| Software, algorithm | MATLAB R2014b | MathWorks | DOI:10.5281/zenodo.5146169 | Bakr et al., 2021 | |
| Recombinant DNA reagent | pGloSensor-20F | Promega | E1171 | ||
| Recombinant DNA reagent | Signal sequence Snap-D1DR | This study | pCDNA3 backbone; snap vector, see Materials and methods | ||
| Recombinant DNA reagent | pVenus-FRB-Nb6B9 | This study | pVenus-C1 vector, see Materials and methods | ||
| Recombinant DNA reagent | FKBP-GalT-mApple | This study | pm-Apple-M1 vector, see Materials and methods | ||
| Recombinant DNA reagent | Lyn-2xFKBP-CFP | Addgene | 20149 | ||
| Recombinant DNA reagent | pCAG-Snap-D1DR | This study | pCAG vector, see Materials and methods | ||
| Recombinant DNA reagent | pCAG-Nb6B9-GFP pCAG-Nb37-GFP | This study | pCAG vector, see Materials and methods | ||
| Sequence-based reagent | SLC22A2 shRNAs | OriGene | TL517269 | pGFP-C-shLenti | |
| Sequence-based reagent | Scamble shRNAs | OriGene | TR30021 | pGFP-C-shLenti | |
| Biological sample (Mus musculus, male and female) | CD1 | Charles Rivers | Crl:CD1(ICR) | Isolated medium spiny neurons from neonatal mouse striatal, see Material and methods | |
Additional files
-
Transparent reporting form
- https://cdn.elifesciences.org/articles/75468/elife-75468-transrepform1-v2.pdf
-
Source data 1
Source data of all figures and figure supplements are combined in one file, separated and labeled accordingly in each tab.
- https://cdn.elifesciences.org/articles/75468/elife-75468-data1-v2.xlsx
Download links
A two-part list of links to download the article, or parts of the article, in various formats.
Downloads (link to download the article as PDF)
Open citations (links to open the citations from this article in various online reference manager services)
Cite this article (links to download the citations from this article in formats compatible with various reference manager tools)
The organic cation transporter 2 regulates dopamine D1 receptor signaling at the Golgi apparatus
eLife 11:e75468.
https://doi.org/10.7554/eLife.75468


