Response to comment on 'Unexpected plasticity in the life cycle of Trypanosoma Brucei'
- Department of Cell and Developmental Biology, University of Würzburg, Germany
Figures
Figure 1

Data from Figure 5 in Schuster et al., 2021.
Slender trypanosomes in a continuously dividing population activate the PAD1 pathway in vivo upon uptake by the tsetse fly. Tsetse flies were infected with either slender or stumpy trypanosomes. Flies were dissected at different timepoints after infection. Living trypanosomes were microscopically analysed in the explanted tsetse midguts and scored for the expression of the fluorescent stumpy reporter GFP:PAD1UTR in the nucleus. Slender cells (n = 1845) are shown in dark grey bars, and stumpy cells (n = 1237) are shown in light grey bars. Slender cell populations continuously divide while turning on the PAD1 pathway, seamlessly transitioning into the first fly form. Total dividing slender population are seen as a green/blue dot. Total PAD1 positive (+) dividing slender populations are shown with a green dotted line. Total PAD1 negative (-) dividing slender populations are shown as a dotted blue line. Stumpy cell populations do not start to divide until 48 after uptake, after they have started to become the first fly form. Total dividing stumpy populations are shown as a dotted gray line.
Figure 2
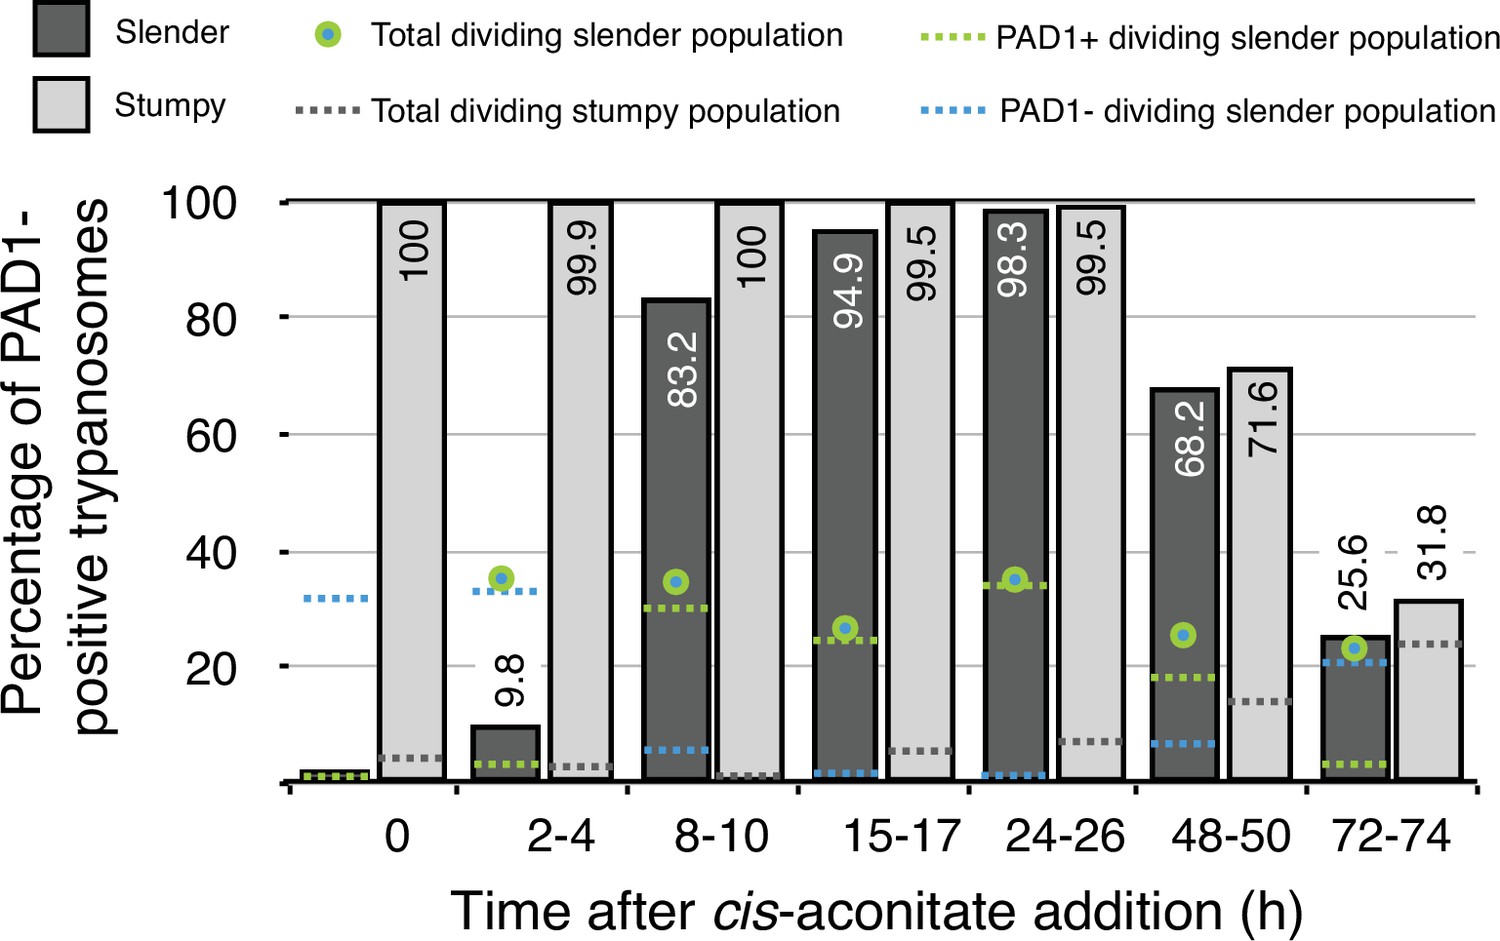
Data from Figure 7 in Schuster et al., 2021.
Slender trypanosomes activate the PAD1 pathway in vitro in a continuously dividing population. Cultured slender or stumpy trypanosomes were differentiated to procyclic cells in vitro by the addition of cis-aconitate and a temperature reduction to 27 °C. At the times indicated, trypanosomes were analysed for the expression of the fluorescent reporter GFP:PAD1UTR. Slender cells (n = 1653) are shown in dark grey and stumpy cells (n = 1798) in light gray. Slender cell populations continuously divided while transiently turning on the PAD1 pathway, showing no cell cycle arrest. Stumpy cell populations did not start to divide as procyclic forms until 48 after cis-aconitate addition. Total dividing slender population are shown as a green/blue dot. Total PAD1 positive (+) dividing slender populations are shown as a green dotted line. Total PAD1 negative (-) dividing slender populations are shown as a dotted blue line. Total dividing stumpy populations are shown as a dotted grey line.
Download links
A two-part list of links to download the article, or parts of the article, in various formats.
Downloads (link to download the article as PDF)
Open citations (links to open the citations from this article in various online reference manager services)
Cite this article (links to download the citations from this article in formats compatible with various reference manager tools)
Response to comment on 'Unexpected plasticity in the life cycle of Trypanosoma Brucei'
eLife 11:e75922.
https://doi.org/10.7554/eLife.75922


