Structural basis of dynamic P5CS filaments
- School of Life Science and Technology, ShanghaiTech University, China
Figures
Figure 1 with 6 supplements
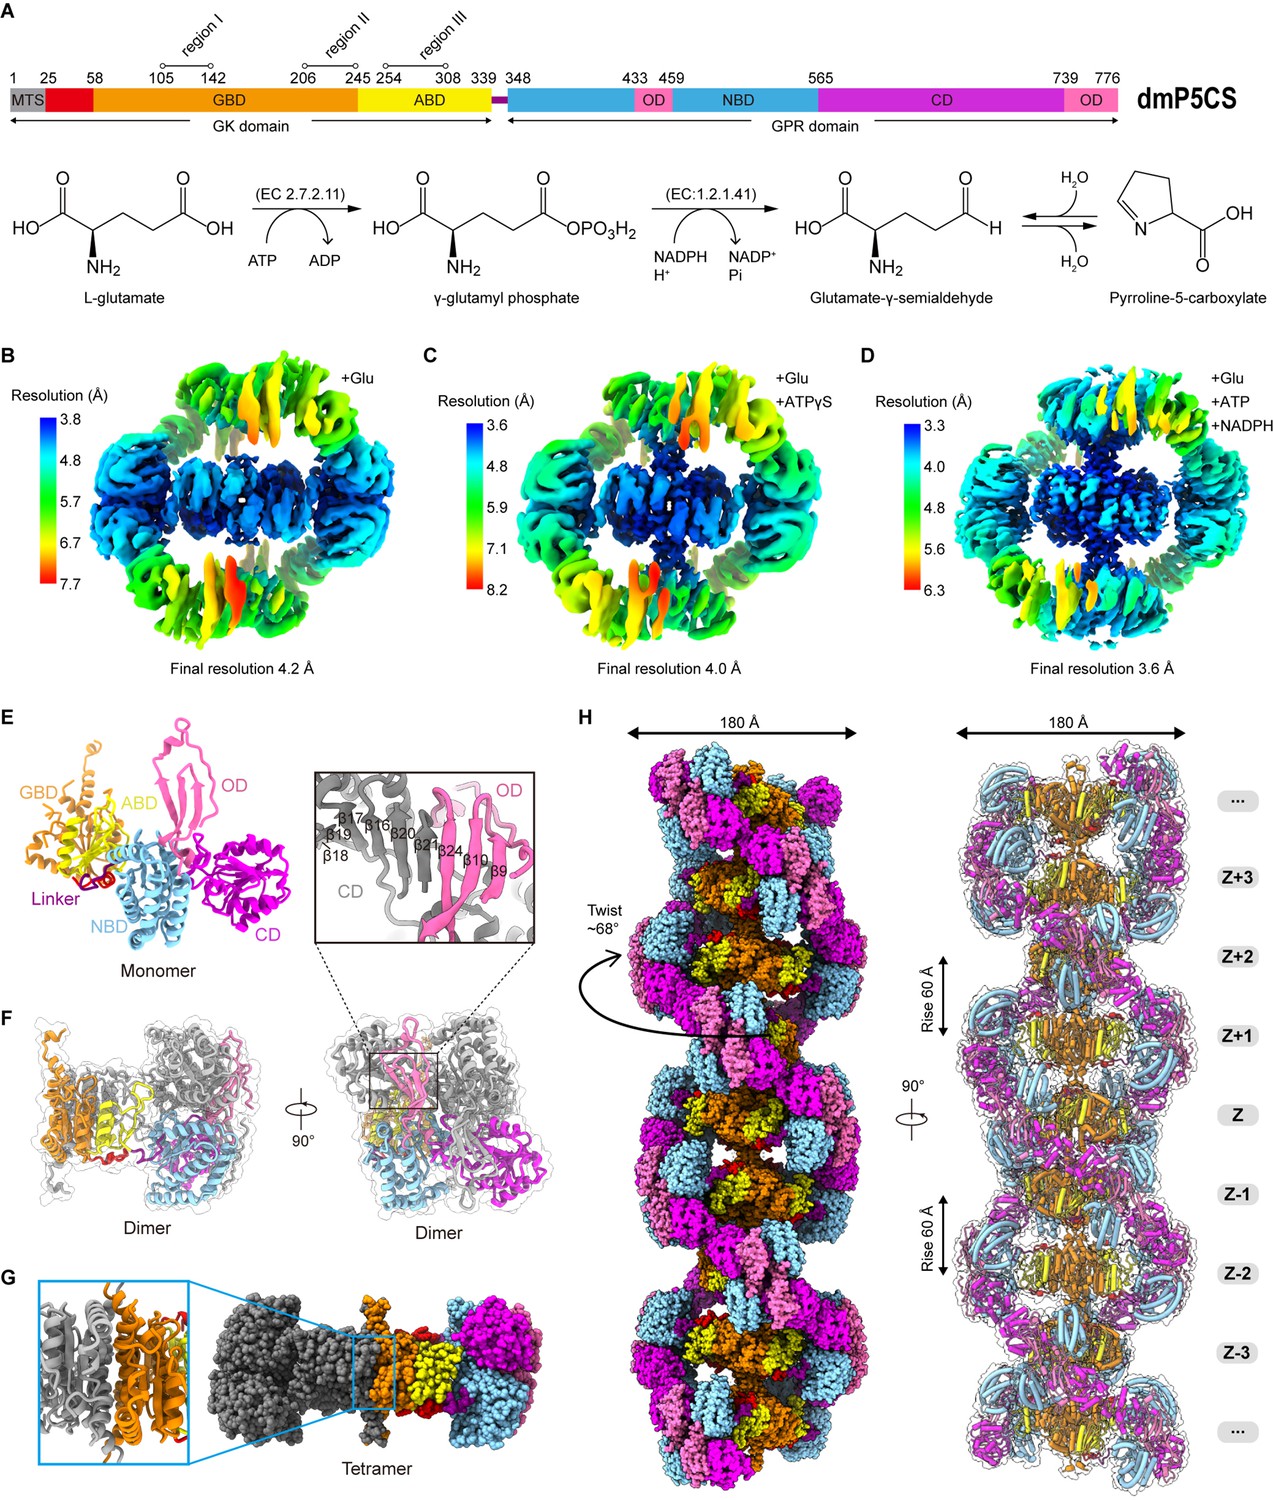
Bifunctional enzyme properties and cryo-electron microscopy (cryo-EM) analysis of P5CS filaments.
(A) Domain organization of Drosophila melanogaster P5CS, which consists of two domains, N-terminal glutamate kinase (GK) domain and C-terminal γ-glutamyl phosphate reductase (GPR) domain. Putative mitochondrial targeting sequence (MTS) is labeled in gray; the glutamate-binding domain (GBD) and the ATP-binding domain (ABD) of the GK domain are respectively shown in orange and yellow; the NADPH-binding domain (NBD), the catalytic domain (CD), and the oligomerization domain (OD) of the GPR domain are shown in cyan, purple, and pink, respectively. Bifunctional P5CS enzyme catalytic reaction and residue numbers for domain boundaries are shown. (B–D) Single-particle analysis for 3D reconstruction of P5CS filaments, three cryo-EM maps of P5CSGlu filament, P5CSGlu/ATPγS filament, and P5CSMix filament are colored by local resolution estimations. (E) The structures of the P5CS monomer and color codes for P5CS models are indicated. (F) The P5CS dimer. Two monomers (gray or color coded by domain) interact via GPR domain hairpins contact. (G) The P5CS tetramer (sphere representation) is formed via GK domain interaction (cartoon representation) between two P5CS dimers (gray or color coded by domain). (H) The sphere and cartoon representation of P5CS filaments. P5CS filaments are modeled by the cryo-EM map. The rotated view is shown in the right panel; its rise, twist, and width are indicated.
Figure 1—figure supplement 1
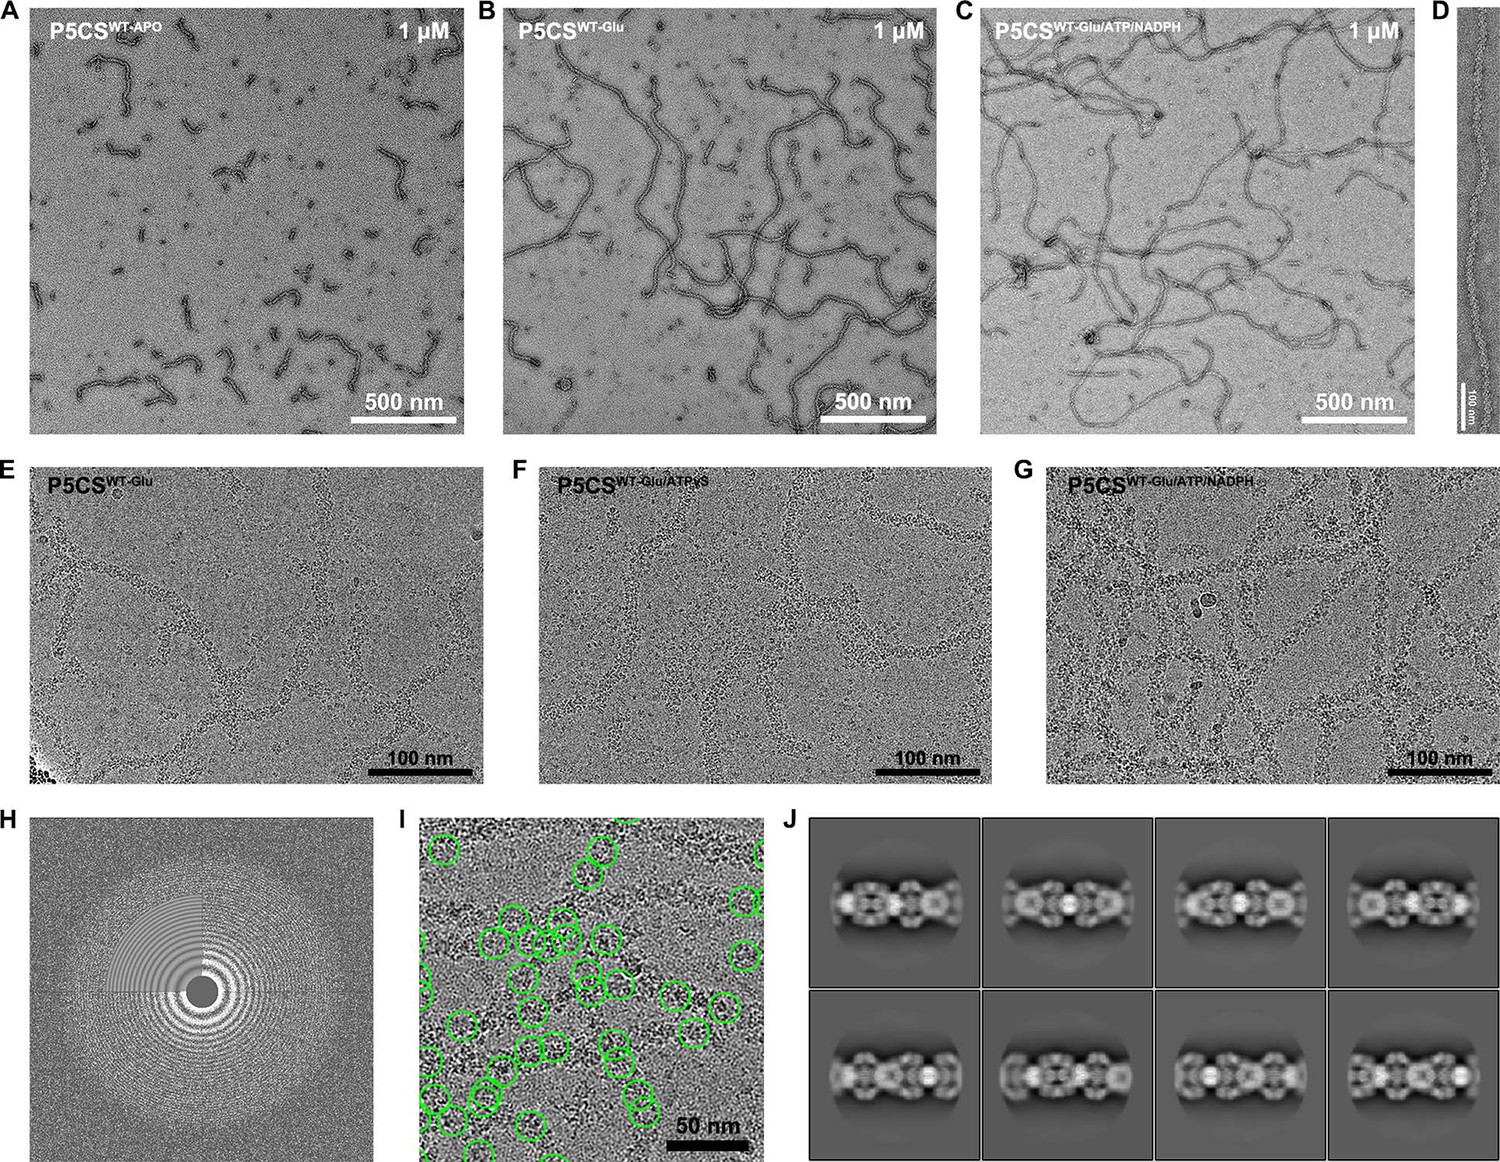
Substrates can significantly extend the P5CS filament.
(A) Negative stain electron microscopy micrograph of P5CS protein in the APO state. P5CS protein in the APO state can self-assemble into filaments of various lengths. (B) When glutamate was added to the P5CSAPO protein, the extension of P5CS filament was observed compared to P5CSAPO filament. (C) When all substrates (MgSO4, ATP, NADPH, and glutamate) were added to induce the reaction, the long P5CSMix filaments were observed, which is similar to the P5CSGlu filaments. (D) Representative negative stain electron microscopy micrographs of a single P5CSMix filament. (E–G) Representative cryo-EM micrograph of P5CS filaments in three ligand states. (H) The power spectrum of a micrograph showing simulated contrast transfer function rings. (I) The green circles represent single particles of the picked P5CSMix filaments. (J) Representative 2D class averages of the P5CSMix filament; several classes of P5CS filament particles with less curvature were selected.
Figure 1—figure supplement 2
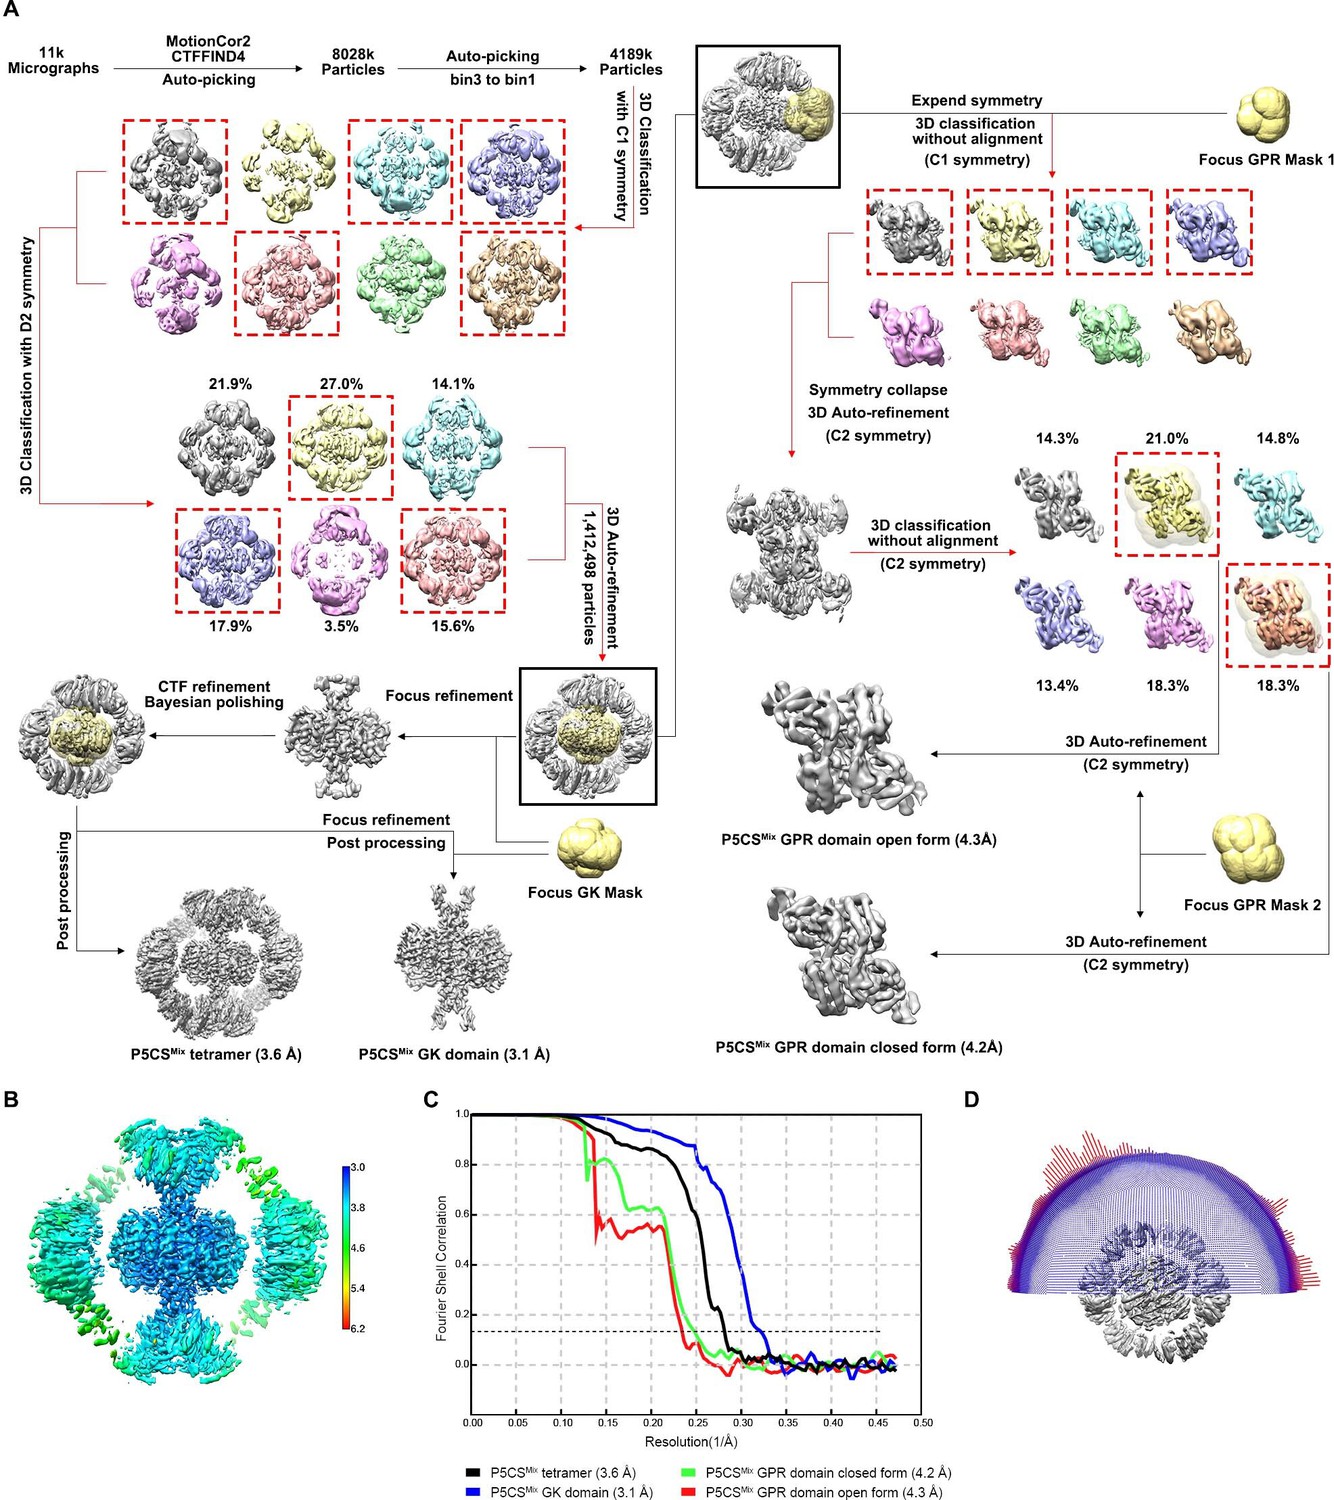
Cryo-electron microscopy (cryo-EM) analysis of the P5CSMix filament.
(A) Flow chart for the cryo-EM reconstruction of the P5CSMix filament. The same processing scheme was used for the P5CSGlu and P5CSGlu/ATPγS filaments. Detailed procedures are described in Materials and methods. (B) Local resolution map (postprocessing) of the P5CSMix tetramer form of filament. (C) The gold-standard Fourier shell correlation (FSC) curves for four refined maps. The resolution calculated at FSC = 0.143 is indicated. (D) Angular distribution of the particles used for the final reconstruction of the P5CSMix filament.
Figure 1—figure supplement 3
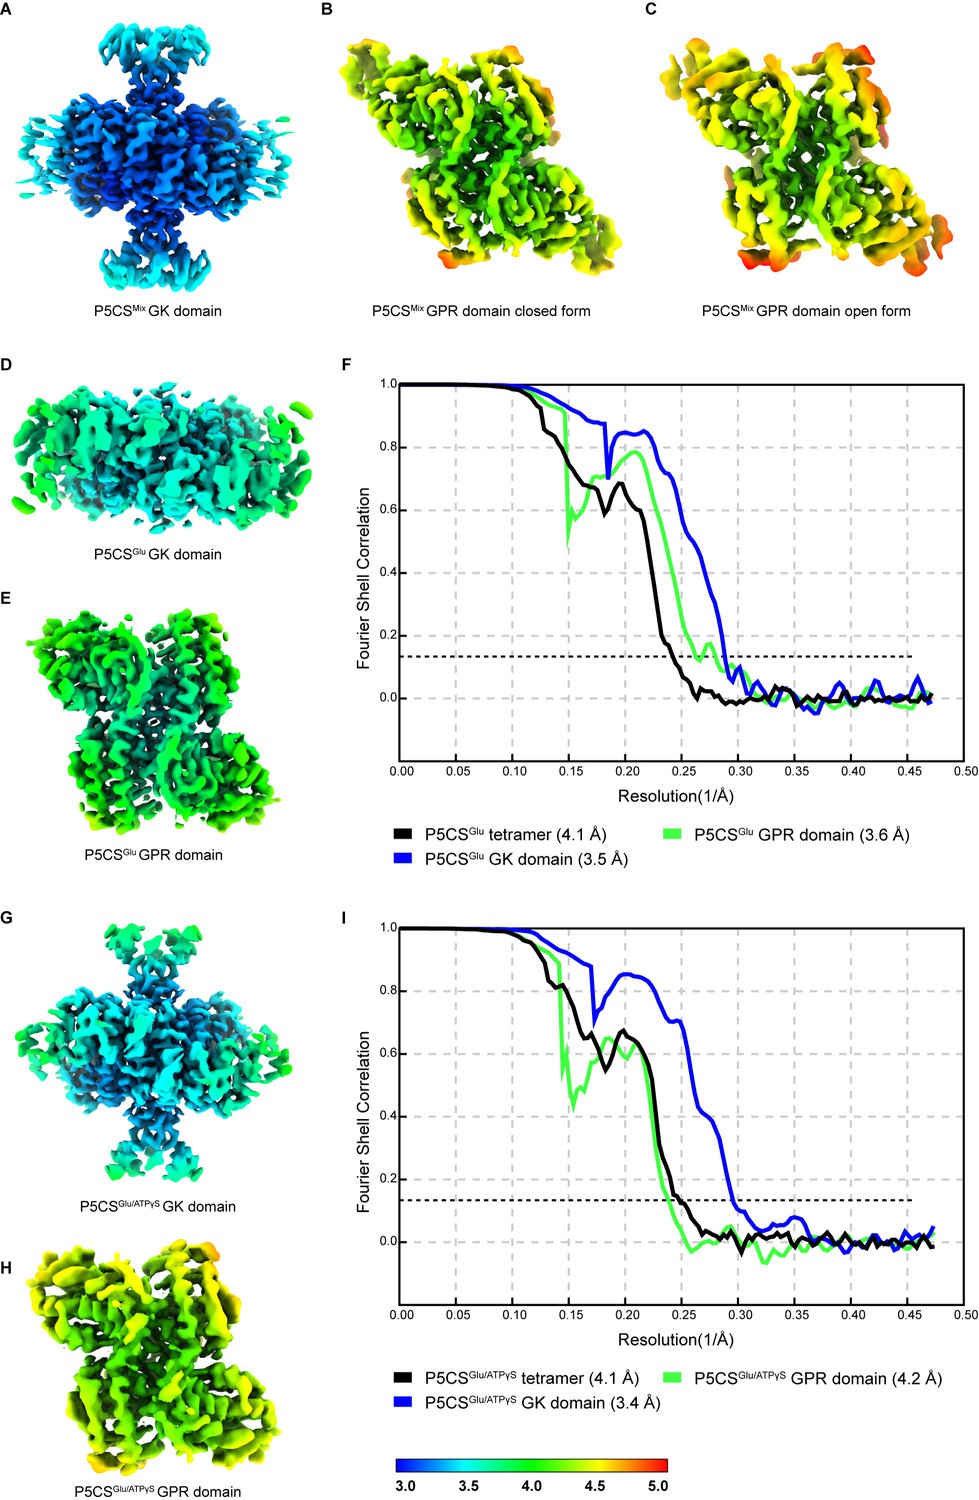
Quality of cryo-electron microscopy (cryo-EM) maps.
(A–C) Local resolution distribution of the glutamate kinase (GK) and γ-glutamyl phosphate reductase (GPR) domains in the P5CSMix filament. The corresponding Fourier shell correlation (FSC) curve is shown in Figure 1—figure supplement 2. (D–F) Local resolution distribution of the GK and GPR domains in the P5CSGlu filament, and FSC curve for all structures. The resolution calculated at FSC = 0.143 is indicated. (G–I) Local resolution distribution of the GK and GPR domains in the P5CSGlu/ATPγS filament, and FSC curve for all structures. The resolution calculated at FSC = 0.143 is indicated.
Figure 1—figure supplement 4
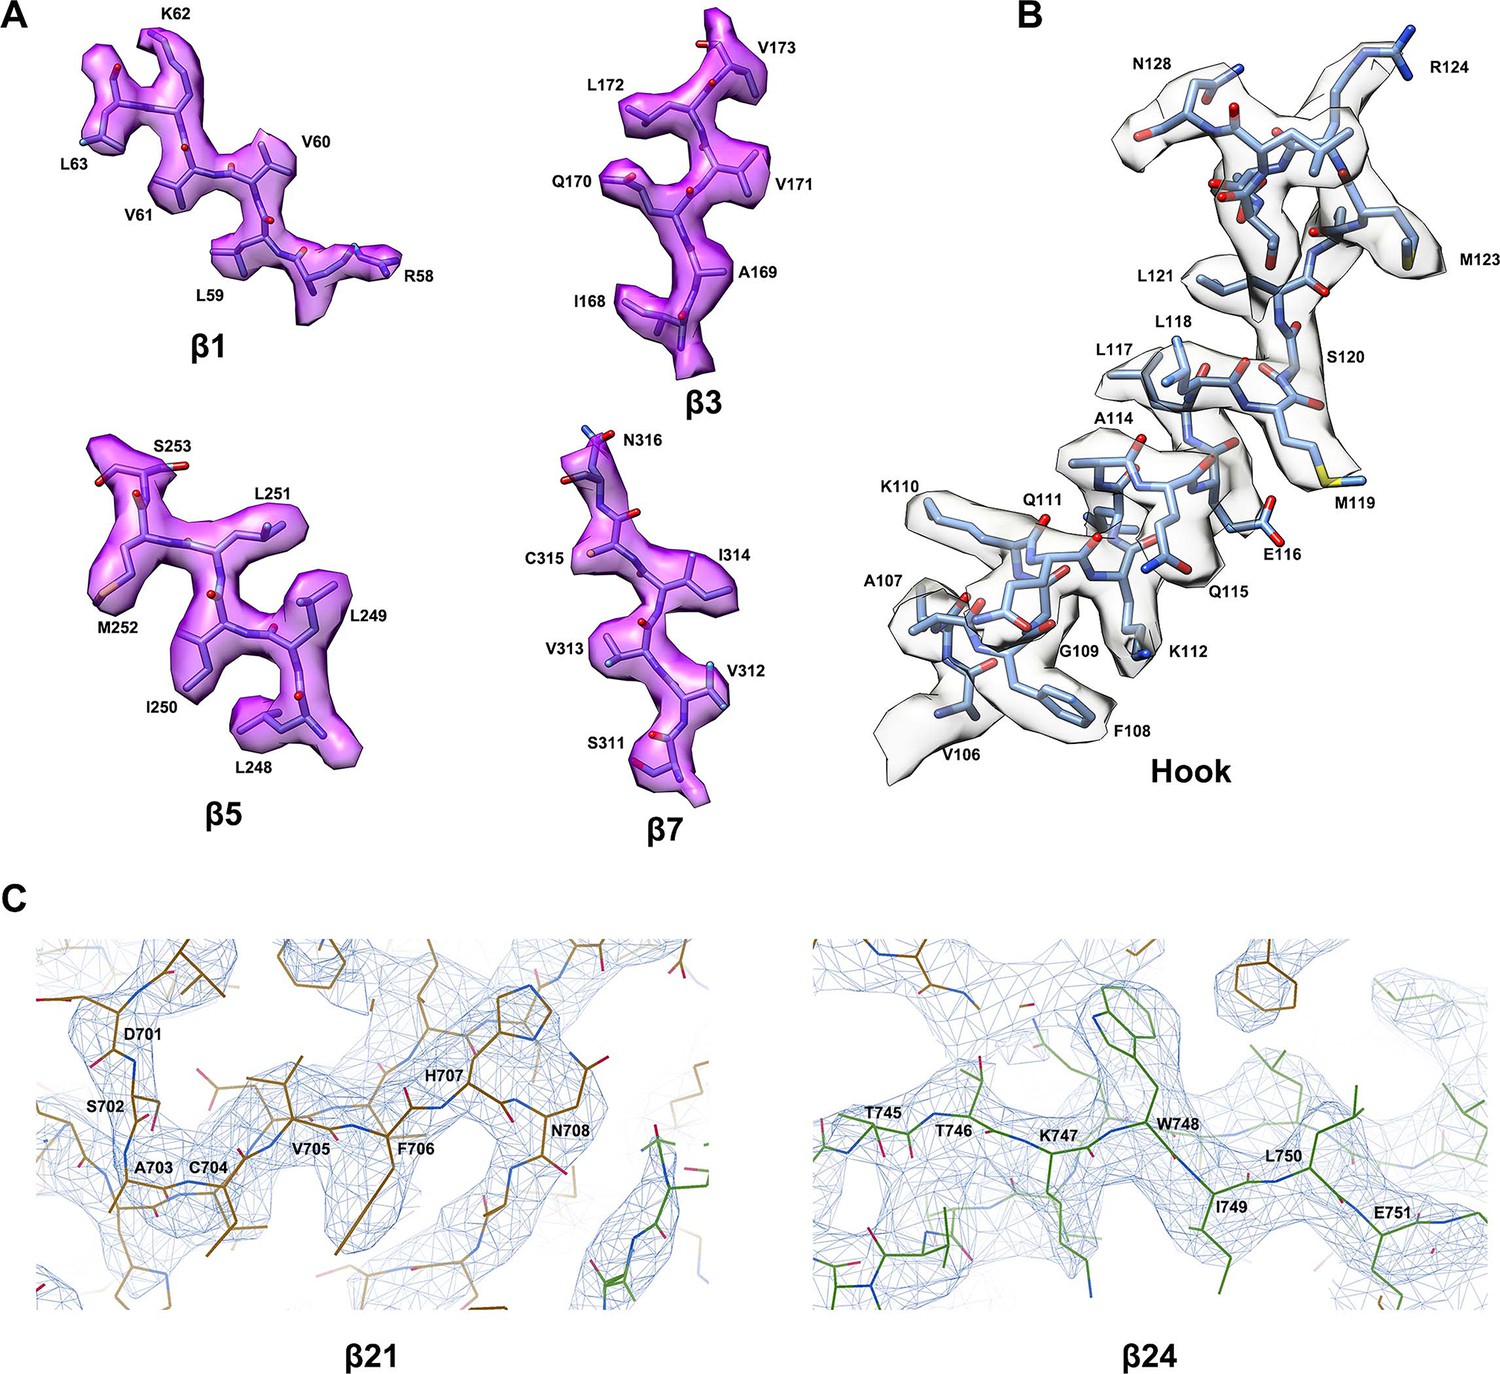
Representative cryo-electron microscopy (cryo-EM) map.
Representative regions of the P5CS protein model superimposed by cryo-EM map. (A) Atomic model of P5CS β-strands. (B) Atomic model of the hook structure α-helices. (C) Representative cryo-EM density of β21 and β24 is displayed at 4.5 σ contour level; panel (C) was generated by Coot.
Figure 1—video 1
Morph between the consensus structures of P5CSGlu filaments.
The model was generated by fitting the tetramer into each class of the 3D classification with C1 symmetry. Protomers were colored differently. This video implies the dynamic changes of the Glu-bound state of P5CS filaments. Morphs between conformations were created in ChimeraX.
Figure 1—video 2
Morph between the consensus structures of P5CSMix filaments.
The model was generated by fitting the tetramer into each class of the 3D classification with C1 symmetry. Each protomer was colored differently. This video shows the dynamic changes of P5CSMix filaments. Morphs between conformations were created in ChimeraX. See also Figure 1—video 1.
Figure 2 with 1 supplement

Conformational changes in the glutamate kinase (GK) domain-binding pocket.
(A) GK domain of the P5CSGlu filament, with glutamate shown as sticks with yellow carbons. The dashed lines represent disordered segments (residues 124–142, 211–232, and 275–297) in this model. (B) GK domain of the P5CSMix filament, with G5P, Mg+, and ADP shown as sticks with pink, green, and red carbons, respectively. The dashed lines represent disordered segments (residues 128–140, 214–228, and 282–295) in this model. (C, D) GK domain model surface representation showing the conformation of the binding pocket in the P5CSGlu filament or P5CSMix filament. The cryo-electron microscopy (cryo-EM) density of binding glutamate molecule in (C), and the binding complex of G5P, Mg+, and ADP in (D). The dashed lines represent ‘open loop’ and ‘closed loop’
Figure 2—figure supplement 1
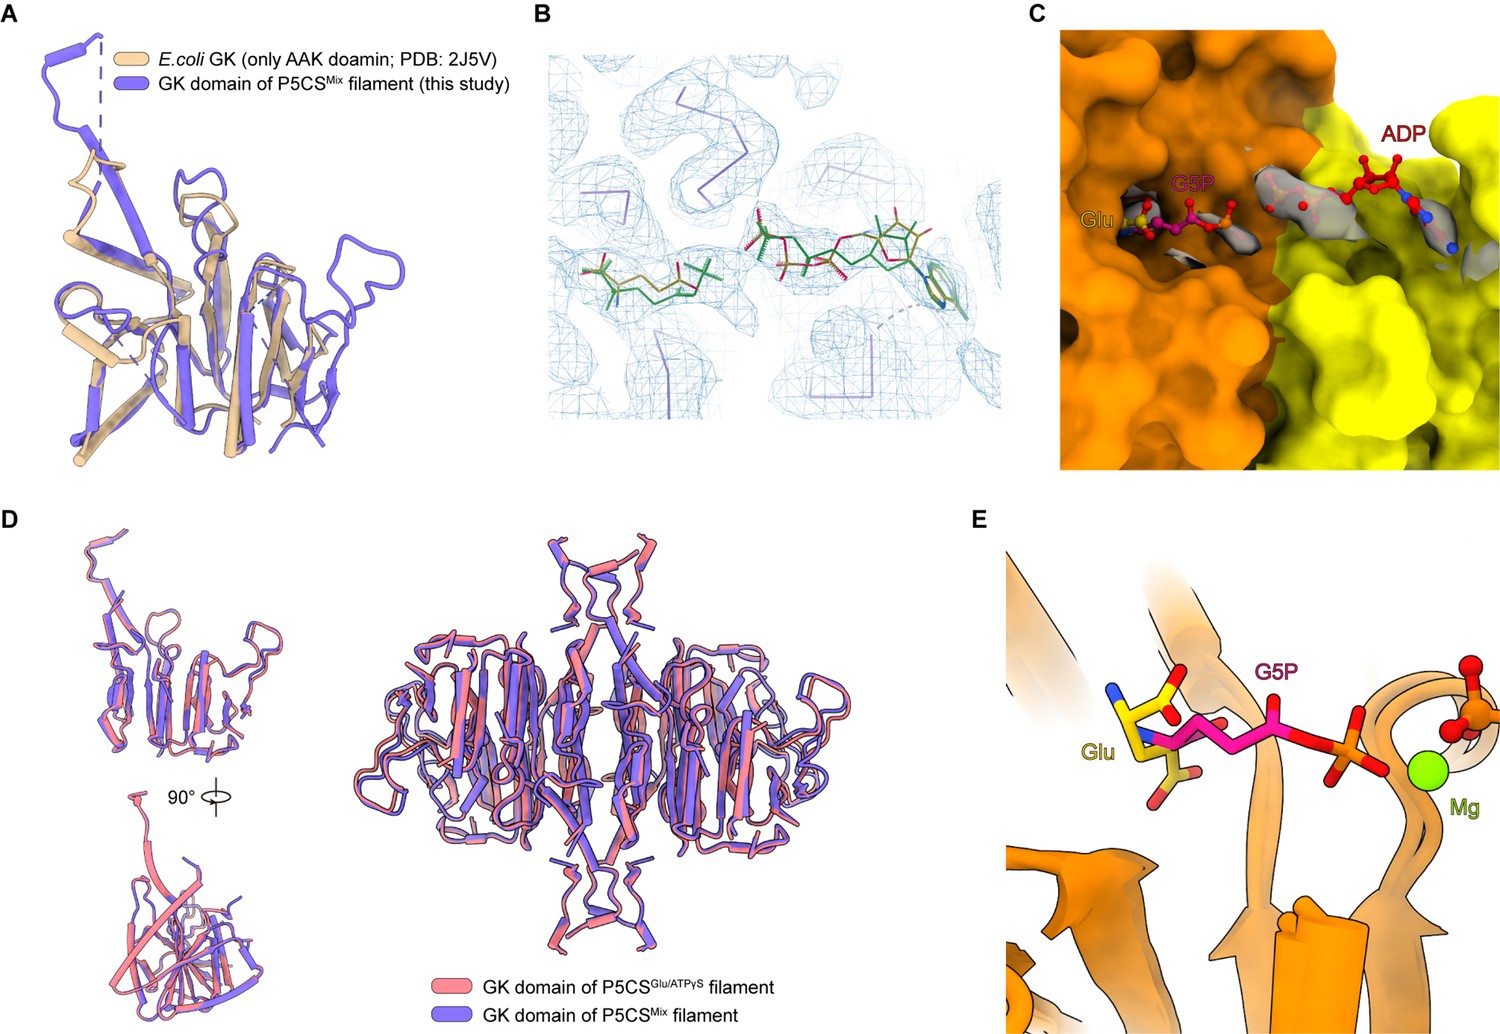
Structural details of the glutamate kinase (GK) domain characterized.
(A) The comparison of E. coli GK structure without PUA domain (tan; PDB: 2J5V) and Drosophila GK domain structure of P5CS (blue-violet; this study), with 30.56% sequence identity and root-mean-square-deviation (RMSD) value of 1.363 Å (198 atom pairs). (B) Cryo-electron microscopy (cryo-EM) map quality of the GK domain active site in the P5CSMix filament (blue-violet), indicating that the conformation of bound G5P/ADP (green) is better than Glu/ATP (dark yellow). (C) Unmodeled ligand densities in the GK domain of the P5CSGlu/ATPγS filament. (D) Superimposition between the GK domain protomer or tetramer structure of the P5CSGlu/ATPγS filament (coral) and that of the P5CSMix filament (blue-violet). (E) The binding mode of glutamate (yellow) and G5P (pink) in the GK domain.
Figure 3 with 1 supplement
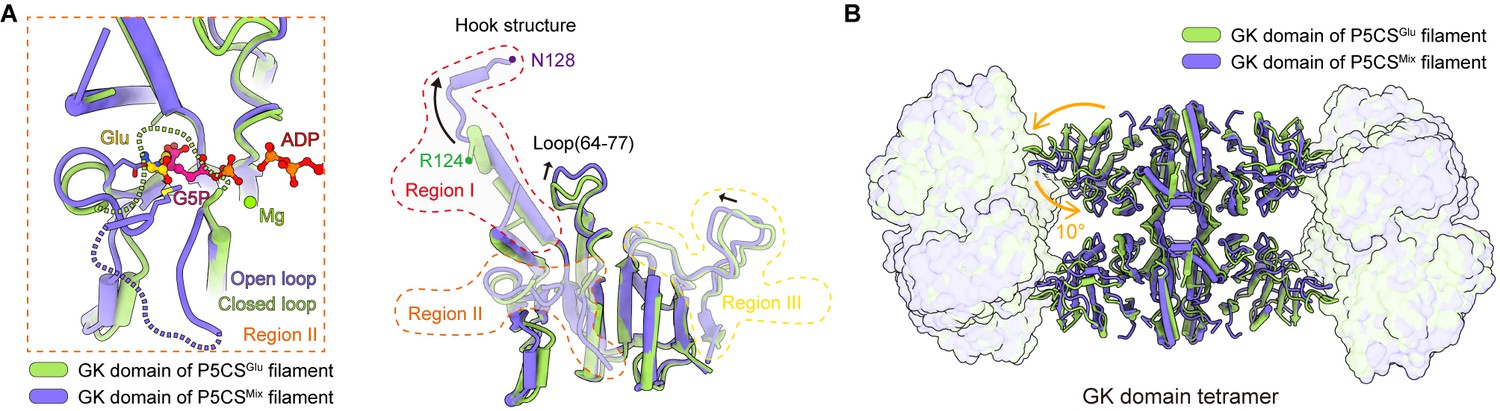
Structural comparison of the two types of glutamate kinase (GK) domain.
(A) Comparison of one protomer of the GK domain tetramer in the P5CSGlu filament (green) and P5CSMix filament (blue-violet) on the right panel. On the left panel, the dashed lines in the model represent the open loop (blue-violet) and closed loop (green) in region II. (B) Superimposition of the GK domain tetramer in the P5CSglu filament (green) with the P5CSMix filament (blue-violet). Transitions from glutamate-bound-conformation to G5P-Mg-ADP-bound conformation are shown as curved arrows, indicating GK domain conformational changes in the P5CS filament.
Figure 3—figure supplement 1
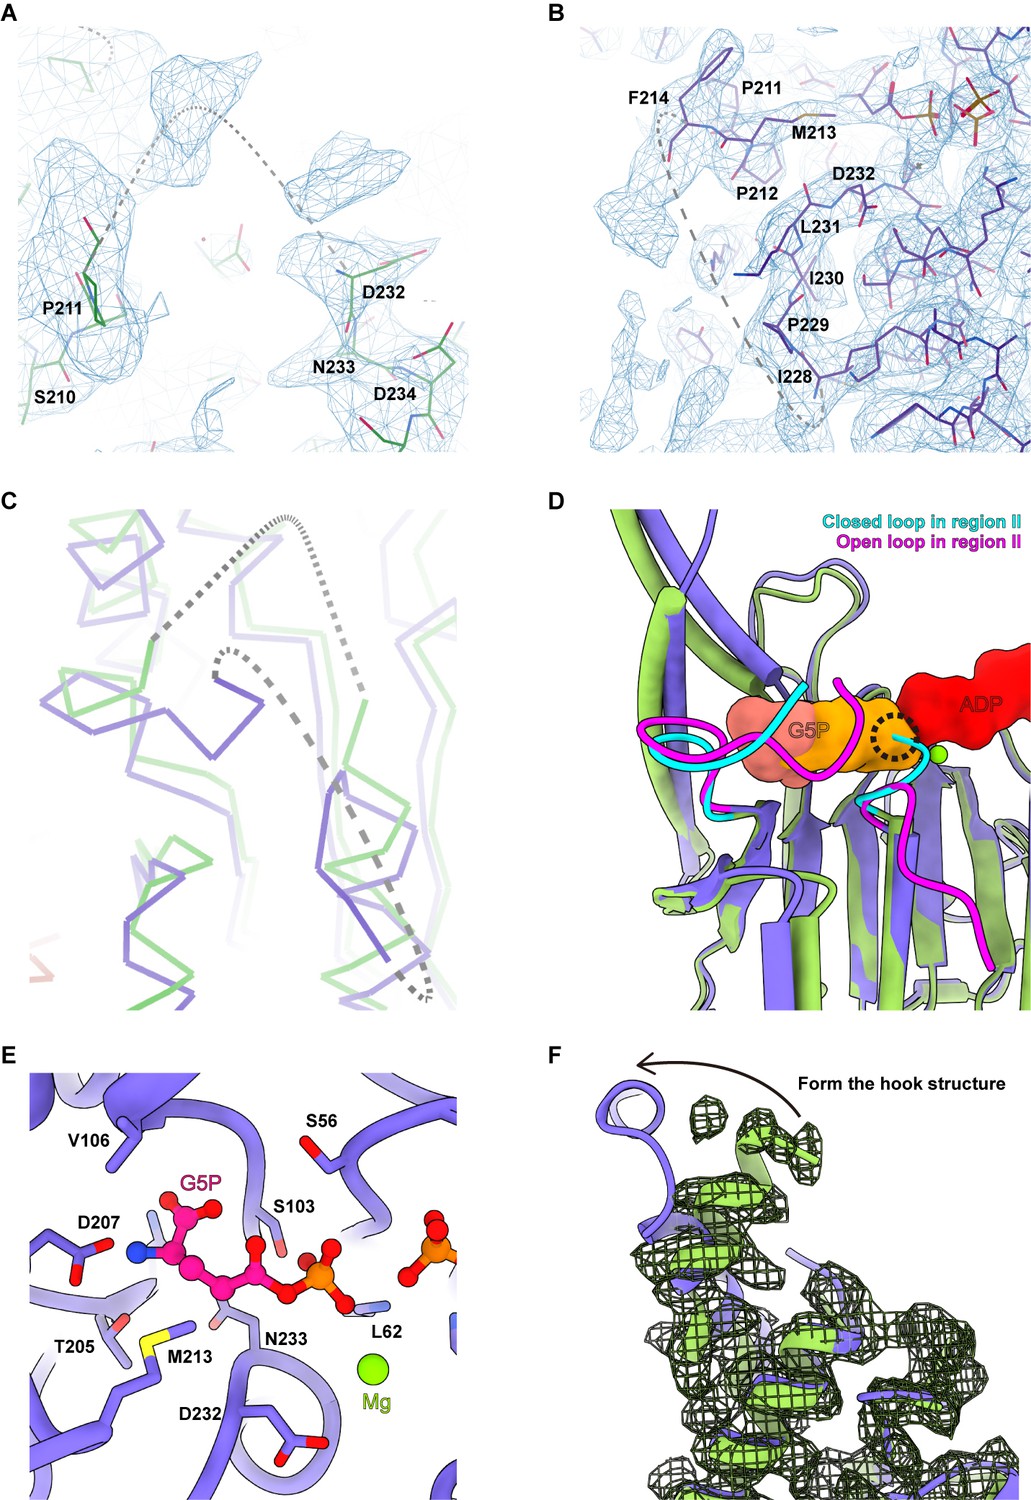
The conformational changes in regions I and II.
(A, B) Cryo-electron microscopy (cryo-EM) map quality of region II in the P5CSGlu filament (A) and P5CSMix filament (B). (C) Dashed lines generated by Coot represent disorder segment; superimposition between the P5CSGlu filament (green) and P5CSMix filament (blue-violet) in region II indicates significant conformational differences. (D) The open loop (pink) and closed loop (cyan) are highlighted in our models, referred to panel (C). G5P (pink and yellow) and ADP (red) are shown as surface representation, the steric clash between the closed loop (cyan) and the phosphate moiety (yellow) of G5P is indicated. (E) G5P-binding site of the GK domain in the P5CSMix filament. (F) The conformational change of hook structure in region I, and cartoon models have overlaid the cryo-EM density of the P5CSGlu filament shown as mesh.
Figure 4 with 4 supplements
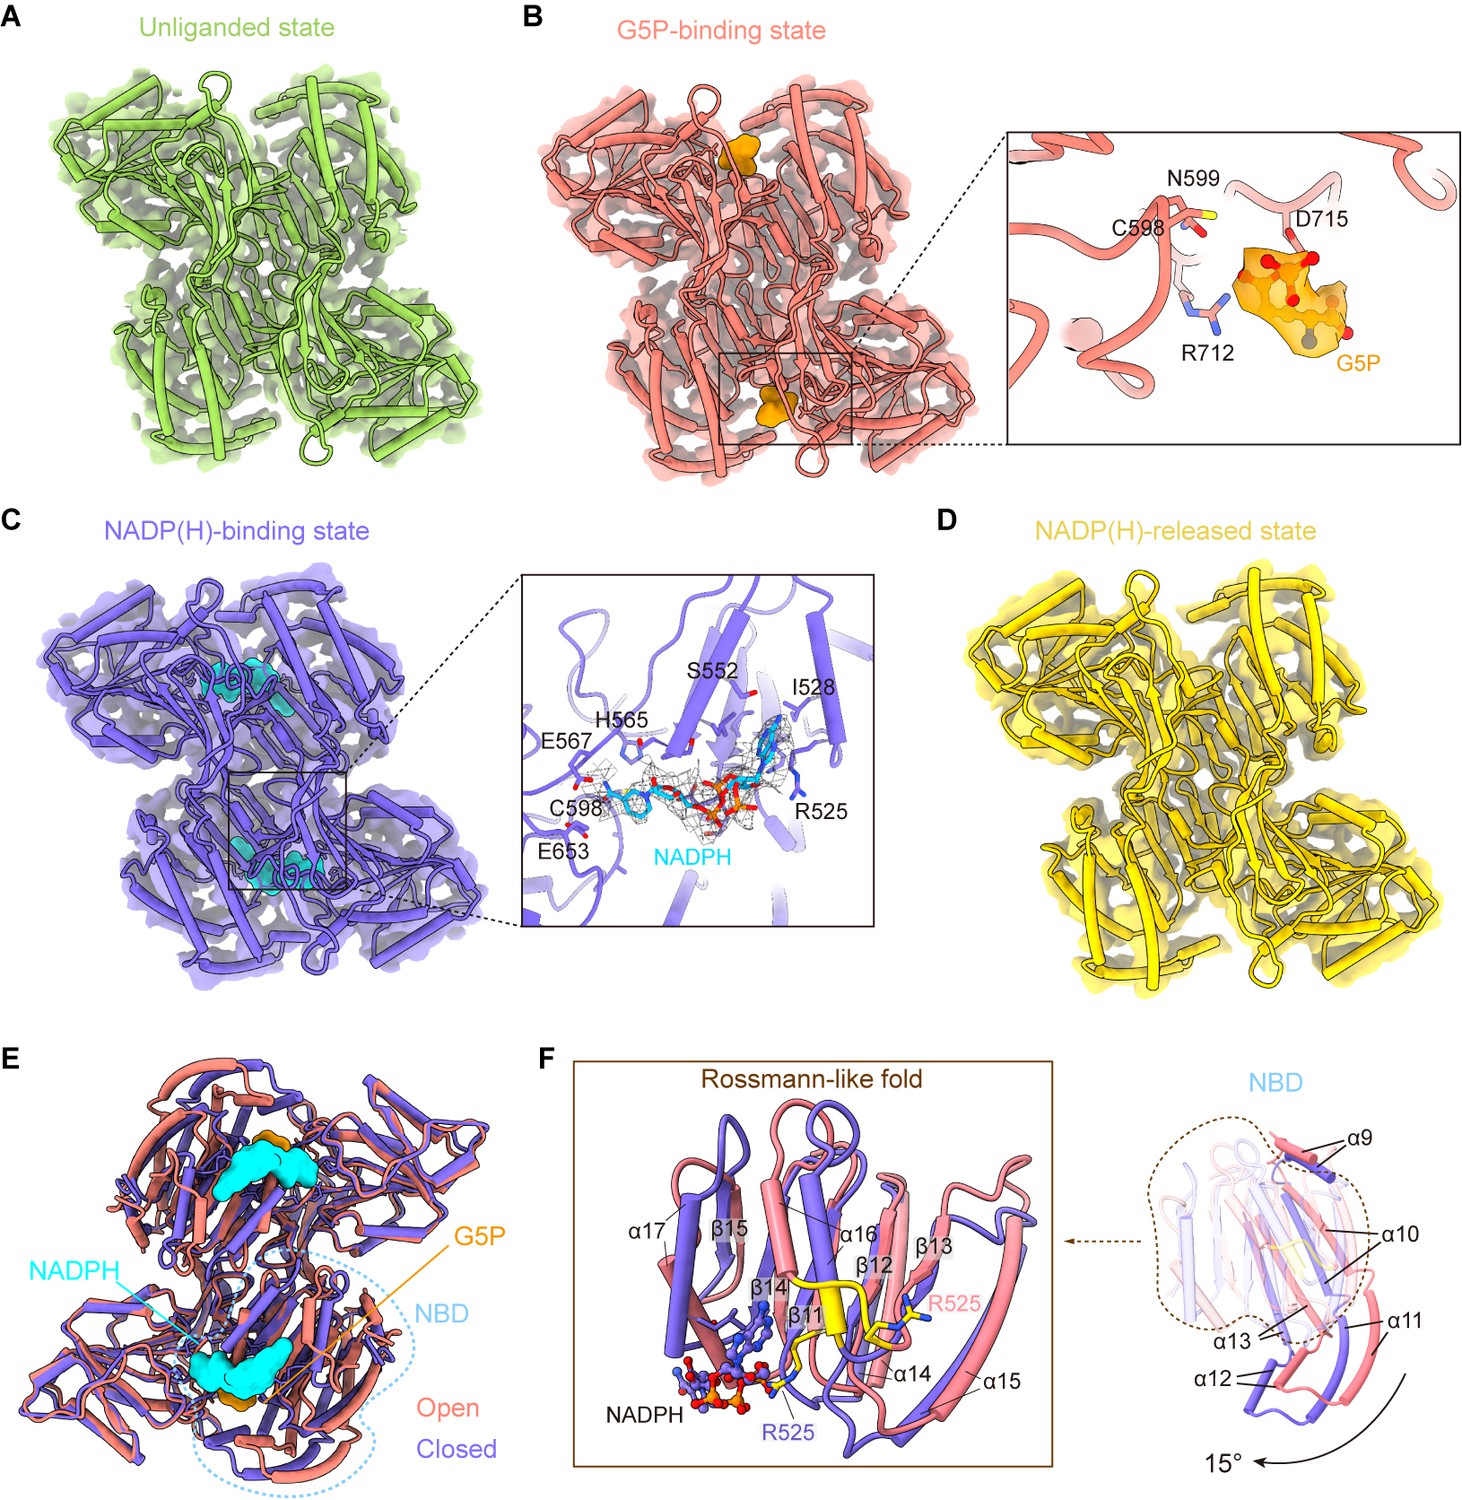
γ-Glutamyl phosphate reductase (GPR) domain ligand-bound mode and its conformation.
(A) The cryo-electron microscopy (cryo-EM) density of the GPR dimer structure and cartoon model is represented as an unliganded state in the P5CSGlu filament (green). (B) GPR dimer structure of the G5P-binding state in the P5CSGlu/ATPγS filament (coral). The conformation of the G5P-binding pocket and G5P (orange) is shown as stick representation. (C) GPR dimer structure of the NADP(H)-binding state in the P5CSMix filament (blue-violet). The conformation of the NADP(H)-binding pocket with NADPH (cyan) is shown as stick representation. (D) GPR dimer structure of the NADP(H)-released state in the P5CSMix filament (yellow). (E) Structural differences in the G5P-binding state (coral) and NADP(H)-binding state (blue-violet) of the GPR domain. Ligands are colored as in (B, C). (F) Superimposition of either the NADPH-binding domain (NBD) or the Rossmann-fold of the GPR domain at the G5P-binding state and NADP(H)-binding state using a single protomer.
Figure 4—figure supplement 1

Representative cryo-electron microscopy (cryo-EM) densities for the active site of the γ-glutamyl phosphate reductase (GPR) domain.
(A) Cryo-EM map quality of G5P ligand in the active site of the GPR domain in the P5CSGlu/ATPγS filament. (B) Unmodeled densities in the active site of the GPR domain at the NADP(H)-binding state, which may be the reaction product: Pi or GSA/P5C.
Figure 4—figure supplement 2

Comparison of the structures of the γ-glutamyl phosphate reductase (GPR) domain.
(A) Superimposition of the GPR domain at the unliganded state (green), GPR domain at the NADP(H)-released state (yellow), and GPR domain dimer structure at the G5P-binding state (coral). (B) Superimposition of the GPR domain at the NADP(H)-binding state (blue-violet) and GPR domain dimer structure at the G5P-binding state (coral). Compared with the GPR domain of Drosophila P5CS at the NADP(H)-binding state (blue-violet), the GPR domain of human P5CS (cyan, PDB: 2H5G) has 56.74% sequence identity and root-mean-square-deviation (RMSD) value of 1.531 Å (398 atom pairs).
Figure 4—figure supplement 3
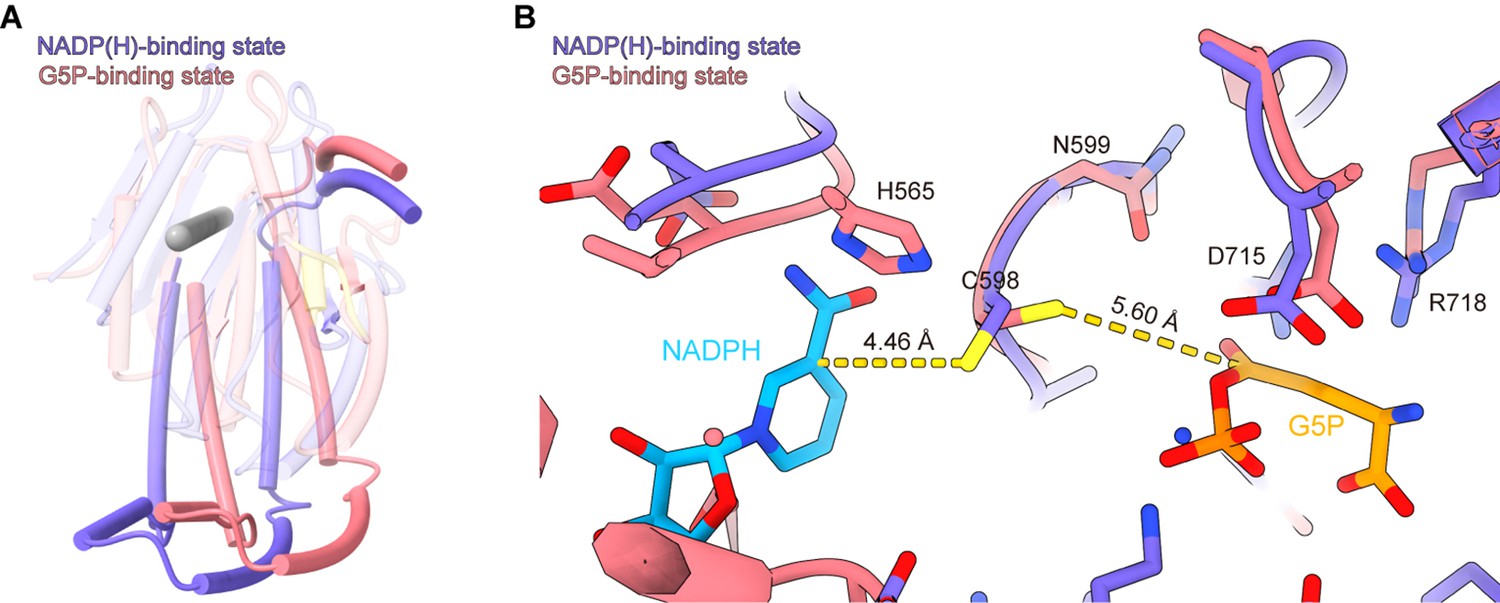
The NADPH-binding domain (NBD) rotation and view of the active site of the γ-glutamyl phosphate reductase (GPR) domain with its substrate.
(A) The position of cylinder axes (gray) around which the NBD rotates. (B) Superimposition of the GPR domain at the G5P-binding state (coral) to that at the NADP(H)-binding state (blue-violet) on their active site; the distance between the ligands and catalytic residue C598 is shown by the dash line (yellow).
Figure 4—video 1
Structural transition of open and closed conformations of the γ-glutamyl phosphate reductase (GPR) domain.
Morph from the G5P-binding state (open conformation) to the NADP(H)-binding state (closed conformation) of the GPR domain.
Figure 5 with 5 supplements
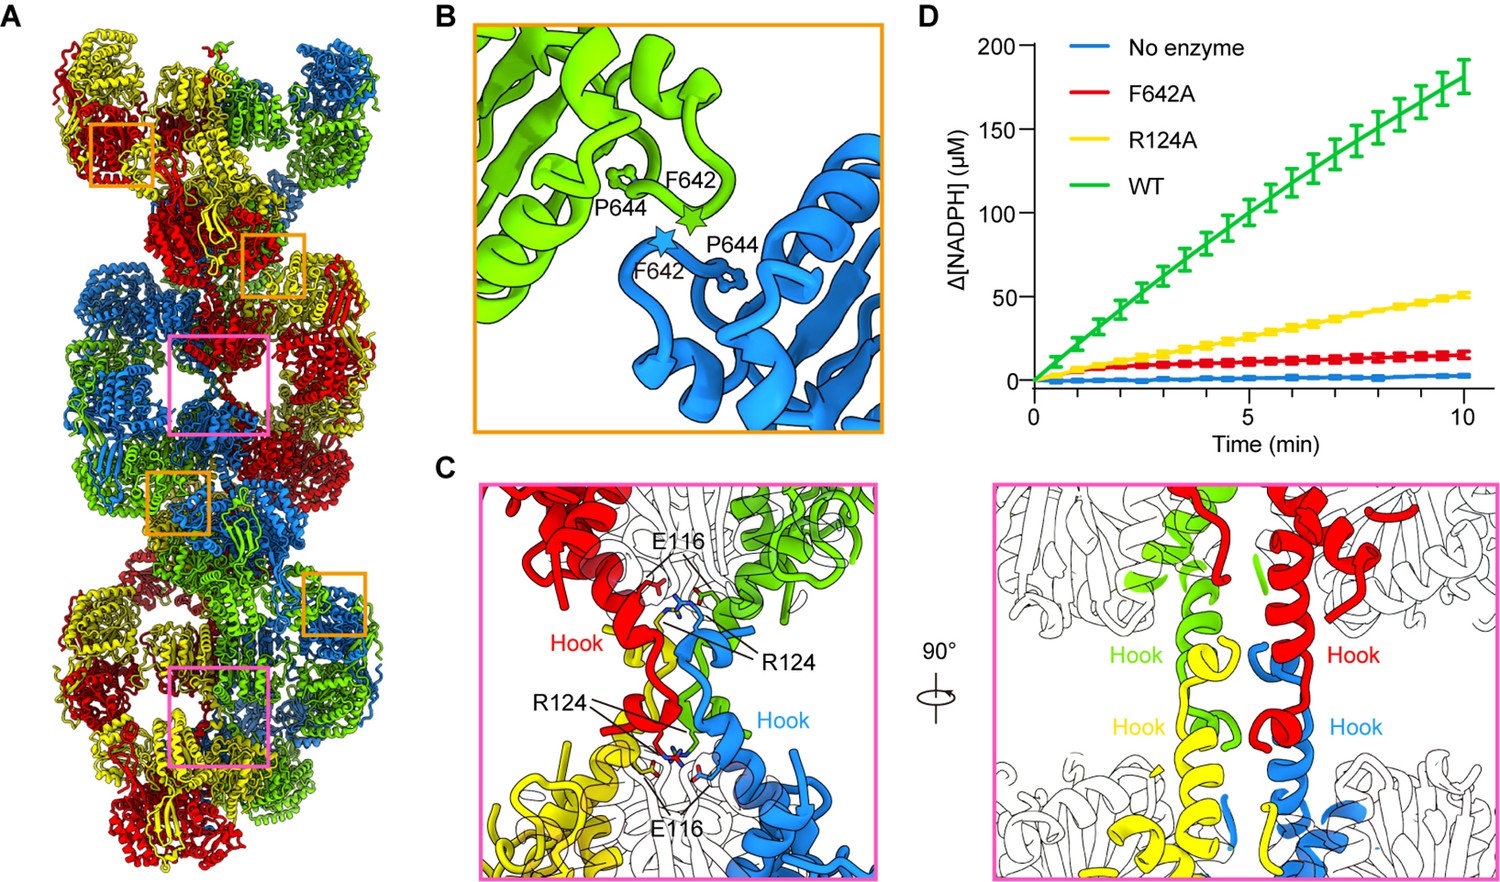
Assembly and interaction surfaces of the P5CS filament.
(A) P5CS filament assembly interface, the four P5CS protomers in one layer are colored in red, yellow, blue, and green. (B) Interaction between two adjacent γ-glutamyl phosphate reductase (GPR) domain dimers, residues F642 located at loop that interacts with P644 from another neighboring GPR domain dimer. (C) Model for hook structure interaction. (D) Enzyme activity analysis to examine P5CS wild-type or mutant proteins. All of the experiments were replicated three times (n = 3, mean ± SD).
-
Figure 5—source data 1
Enzymatic activity of wild-type and mutant Drosophila P5CS.
- https://cdn.elifesciences.org/articles/76107/elife-76107-fig5-data1-v2.xlsx
Figure 5—figure supplement 1

The interface of adjacent γ-glutamyl phosphate reductase (GPR) domain dimers.
Close-up of the interaction interface, the key residues are shown as sticks, with the overlaid cryo-electron microscopy (cryo-EM) density of the glutamate kinase (GK) domain at unliganded state.
Figure 5—figure supplement 2
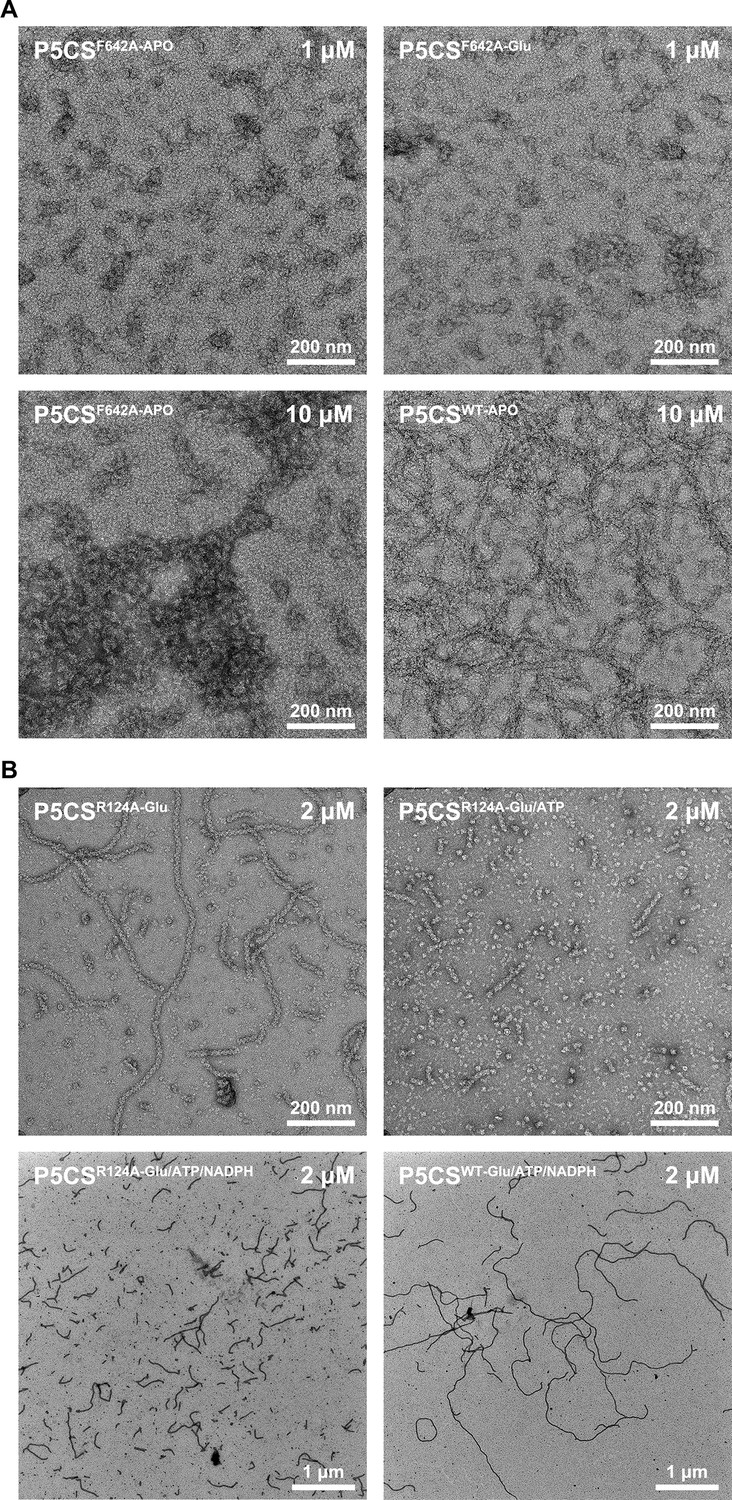
Negative staining of mutated P5CS.
(A) Negative stain electron microscopy micrographs of P5CSF642A mutation protein at the APO state; this mutation disrupts the filamentation of P5CS. (B) When the P5CSR124A-Glu filament was additionally incubated with ATP, depolymerization of P5CSR124A filament was observed.
Figure 5—figure supplement 3

The distance between the active sites of the glutamate kinase (GK) domain and γ-glutamyl phosphate reductase (GPR) domain.
The tetramer form of P5CS in filament; positions of each ligand are simulated in our models. G5P (pink) and ADP (brown) in the GK domain, G5P (purple), and NADPH (cyan) in the GPR domain are shown as surface representation. Distances between the G5P in the GK domain and GPR domain are indicated.
Figure 5—figure supplement 4

Sequence alignment of the representative P5CS enzymes.
The sequence alignment of P5CS sequences of Drosophila (UniProtKB: Q9VNW6), mouse (UniProtKB: Q9Z110; isoform long), human (UniProtKB: P54886; isoform long), C. elegans (UniProtKB: P54889; isoform b), and Arabidopsis (UniProtKB: P54887; isoform 1). The conserved residues are identically shaded red, and secondary structure elements are indicated above.
Figure 5—video 1
Simulated ligand-binding site of P5CS filament.
The structural models and color codes refer to Figure 5 and Figure 5—figure supplement 3.
Figure 6

Model of P5CS filament structural transitions during GSA/P5C synthesis.
The P5CS molecule polymerizes into filaments at the APO state or after binding with the glutamate. Upon ATP binding, the glutamate kinase (GK) domain initiates glutamate phosphorylation. The product leaves the pocket, and the GK domain subsequently repeats reaction cycle (left). Unstable G5P will be transported through channel and the half-open chamber inside the filament, and captured by the γ-glutamyl phosphate reductase (GPR) domain. NADPH binding to the GPR domain transforms the domain to closed conformation, which enables NADPH to approach the catalytic site and completes reductive dephosphorylation of G5P. The GSA/P5C will be released, and the GPR domain returns to the unliganded state with open conformation. The GPR domain then begins the next cycle (right).
Tables
Table 1
Cryo-electron microscopy (cryo-EM) data statistics.
| P5CSGlu filament | P5CSGlu/ATPγS filament | P5CSMix filament | ||||||||
|---|---|---|---|---|---|---|---|---|---|---|
| Data collection and processing | ||||||||||
| EM equipment | Titan Krios | Titan Krios | Titan Krios | |||||||
| Detector | K3 camera | K3 camera | K3 camera | |||||||
| Magnification | 22,500× | 22,500× | 22,500× | |||||||
| Voltage (kV) | 300 | 300 | 300 | |||||||
| Electron exposure (e–/Å2) | 72 | 72 | 72 | |||||||
| Defocus range (μm) | –0.8 to –2.5 | –0.8 to –2.5 | –0.8 to –2.5 | |||||||
| Pixel size (Å) | 0.53 | 0.53 | 0.53 | |||||||
| Symmetry imposed | D2 | D2 | D2 | |||||||
| Number of collected movies | 4933 | 6408 | 10,566 | |||||||
| Initial particle images (no.) | 1,911,843 | 1,563,553 | 8,027,582 | |||||||
| Final particle images (no.) | 432,746 | 327,841 | 1,412,498 | |||||||
| Refinement | ||||||||||
| P5CS tetramer | GK domain | GPR domain | P5CS tetramer | GK domain | GPR domain | P5CS tetramer | GK domain | GPR domain closed form | GPR domain open form | |
| EMDB ID | EMD-31466 | EMD-31469 | EMD-32877 | EMD-31467 | EMD-32876 | EMD-32880 | EMD-31468 | EMD-32875 | EMD-32878 | EMD-32879 |
| PDB code | 7F5T | 7F5X | 7WXF | 7F5U | 7WX4 | 7WXI | 7F5V | 7WX3 | 7WXG | 7WXH |
| Initial model used (PDB code) | - | 4Q1T | 2H5G | - | 4Q1T | 2H5G | - | 4Q1T | 2H5G | 2H5G |
| Map resolution (Å) | 4.1 | 3.5 | 3.6 | 4.1 | 3.4 | 4.2 | 3.6 | 3.1 | 4.2 | 4.3 |
| FSC threshold | 0.143 | 0.143 | 0.143 | 0.143 | 0.143 | 0.143 | 0.143 | 0.143 | 0.143 | 0.143 |
| Map resolution range (Å) | 3.8–8.0 | 3.4–5.2 | 3.5–5.0 | 3.4–8.0 | 3.2–4.7 | 4.1–5.3 | 3.3–7.8 | 3.0–4.1 | 4.1–5.9 | 4.0–5.5 |
| Map sharpening B-factor (Å2) | –120 | –120 | –120 | –100 | –70 | –200 | –80 | –80 | –150 | –150 |
| Model composition | ||||||||||
| Non-hydrogen atoms | 20,436 | 7244 | 6,494 | 20,744 | 7968 | 6522 | 20,912 | 8172 | 6494 | 6590 |
| Protein residues | 2700 | 1896 | 860 | 2740 | 1040 | 860 | 2760 | 1064 | 860 | 430 |
| Ligands | GGL | GGL | - | - | - | RGP | - | RGP, ADP | NAP | - |
| Ions | 0 | 0 | 0 | 0 | 0 | 0 | 0 | Mg | 0 | 0 |
| B factors (Å2) | ||||||||||
| Protein | 140 | 150 | 162 | 143 | 74 | 121 | 131 | 62 | 123 | 100 |
| Ligand | 140 | 150 | - | - | - | 145 | - | - | - | 121 |
| R.m.s. deviations | ||||||||||
| Bond lengths (Å) | 0.005 | 0.005 | 0.007 | 0.007 | 0.006 | 0.007 | 0.005 | 0.006 | 0.008 | 0.005 |
| Bond angles (°) | 0.678 | 0.54 | 0.777 | 0.786 | 0.576 | 0.788 | 0.675 | 0.554 | 0.864 | 0.73 |
| Validation | ||||||||||
| MolProbity score | 2.73 | 2.53 | 2.25 | 2.47 | 2.51 | 2.59 | 2.17 | 1.85 | 2.89 | 2.19 |
| Clashscore | 47.48 | 7.93 | 13.17 | 23.56 | 8.2 | 24.57 | 16.57 | 5.45 | 34.6 | 12.87 |
| Poor rotamers (%) | 0 | 6.12 | 0.29 | 0 | 6.39 | 0.58 | 0.18 | 3.56 | 1.74 | 0.29 |
| Ramachandran plot | ||||||||||
| Favored (%) | 89.04 | 91.67 | 87.15 | 87.59 | 92.8 | 81.78 | 92.96 | 97.27 | 93.29 | 89.25 |
| Allowed (%) | 10.51 | 7.89 | 12.62 | 12.26 | 7.2 | 18.22 | 6.89 | 2.73 | 16.71 | 10.75 |
| Disallowed (%) | 0.45 | 0.44 | 0.23 | 0.15 | 0 | 0.58 | 0.15 | 0 | 0 | 0 |
-
GPR: γ-glutamyl phosphate reductase; GK: glutamate kinase; FSC: Fourier shell correlation.
Key resources table
| Reagent type (species) or resource | Designation | Source or reference | Identifiers | Additional information |
|---|---|---|---|---|
| Gene (Drosophila melanogaster) | P5CS | GenBank | NM_001259948 | |
| Strain, strain background (Escherichia coli) | Transetta (DE3) | TransGen Biotech | ||
| Recombinant DNA reagent | pET28a-6His-SUMO | In house | ||
| Commercial assay or kit | BCA Protein Concentration Determination Kit (Enhanced) | Beyotime | P0010 | |
| Chemical compound, drug | Benzamidine hydrochloride | Sigma-Aldrich | 434760-5G | |
| Chemical compound, drug | Pepstatin A | Sigma-Aldrich | P5318-25MG | |
| Chemical compound, drug | Leupeptin hydrochloride microbial | Sigma/Aldrich | L9783-100MG | |
| Chemical compound, drug | PMSF | MDBio | P006-5g | |
| Chemical compound, drug | Ni-NTA Agarose | QIAGEN | 30250 | |
| Chemical compound, drug | l-Glutamic acid | Sigma-Aldrich | G1251-100G | |
| Chemical compound, drug | ATP | Takara | 4041 | |
| Chemical compound, drug | ATP-gamma-S | Abcam | ab138911 | |
| Chemical compound, drug | NADPH tetrasodium salt | Roche | 10107824001 | |
| Other | Nitinol mesh | Zhenjiang Lehua Electronic Technology | M024-Au300-R12/13 | Cryo-EM grid preparation |
| Other | Holey Carbon Film | Quantifoil | R1.2/1.3, 300 Mesh, Cu | Cryo-EM grid preparation |
| Other | 400 mesh reinforced carbon support film | EMCN | BZ31024a | Negative staining |
| Software, algorithm | UCSF Chimera | https://doi.org/10.1002/jcc.20084 | https://www.cgl.ucsf.edu/chimera | |
| Software, algorithm | UCSF ChimeraX | https://doi.org/10.1002/pro.3235 | https://www.cgl.ucsf.edu/chimerax/ | |
| Software, algorithm | RELION | https://doi.org/10.7554/eLife.42166 | https://relion.readthedocs.io/en/latest/index.html# | |
| Software, algorithm | Coot | https://doi.org/10.1107/S0907444910007493 | https://www2.mrc-lmb.cam.ac.uk/personal/pemsley/coot/ | |
| Software, algorithm | Phenix | https://doi.org/10.1107/S2059798318006551 | https://phenix-online.org/ |
Additional files
Download links
A two-part list of links to download the article, or parts of the article, in various formats.
Downloads (link to download the article as PDF)
Open citations (links to open the citations from this article in various online reference manager services)
Cite this article (links to download the citations from this article in formats compatible with various reference manager tools)
Structural basis of dynamic P5CS filaments
eLife 11:e76107.
https://doi.org/10.7554/eLife.76107


