Single-cell monitoring of dry mass and dry mass density reveals exocytosis of cellular dry contents in mitosis
- Koch Institute for Integrative Cancer Research, Massachusetts Institute of Technology, United States
- MIT Center for Precision Cancer Medicine, Massachusetts Institute of Technology, United States
- Department of Biological Engineering, Massachusetts Institute of Technology, United States
- Department of Mechanical Engineering, Massachusetts Institute of Technology, United States
Figures
Figure 1 with 2 supplements
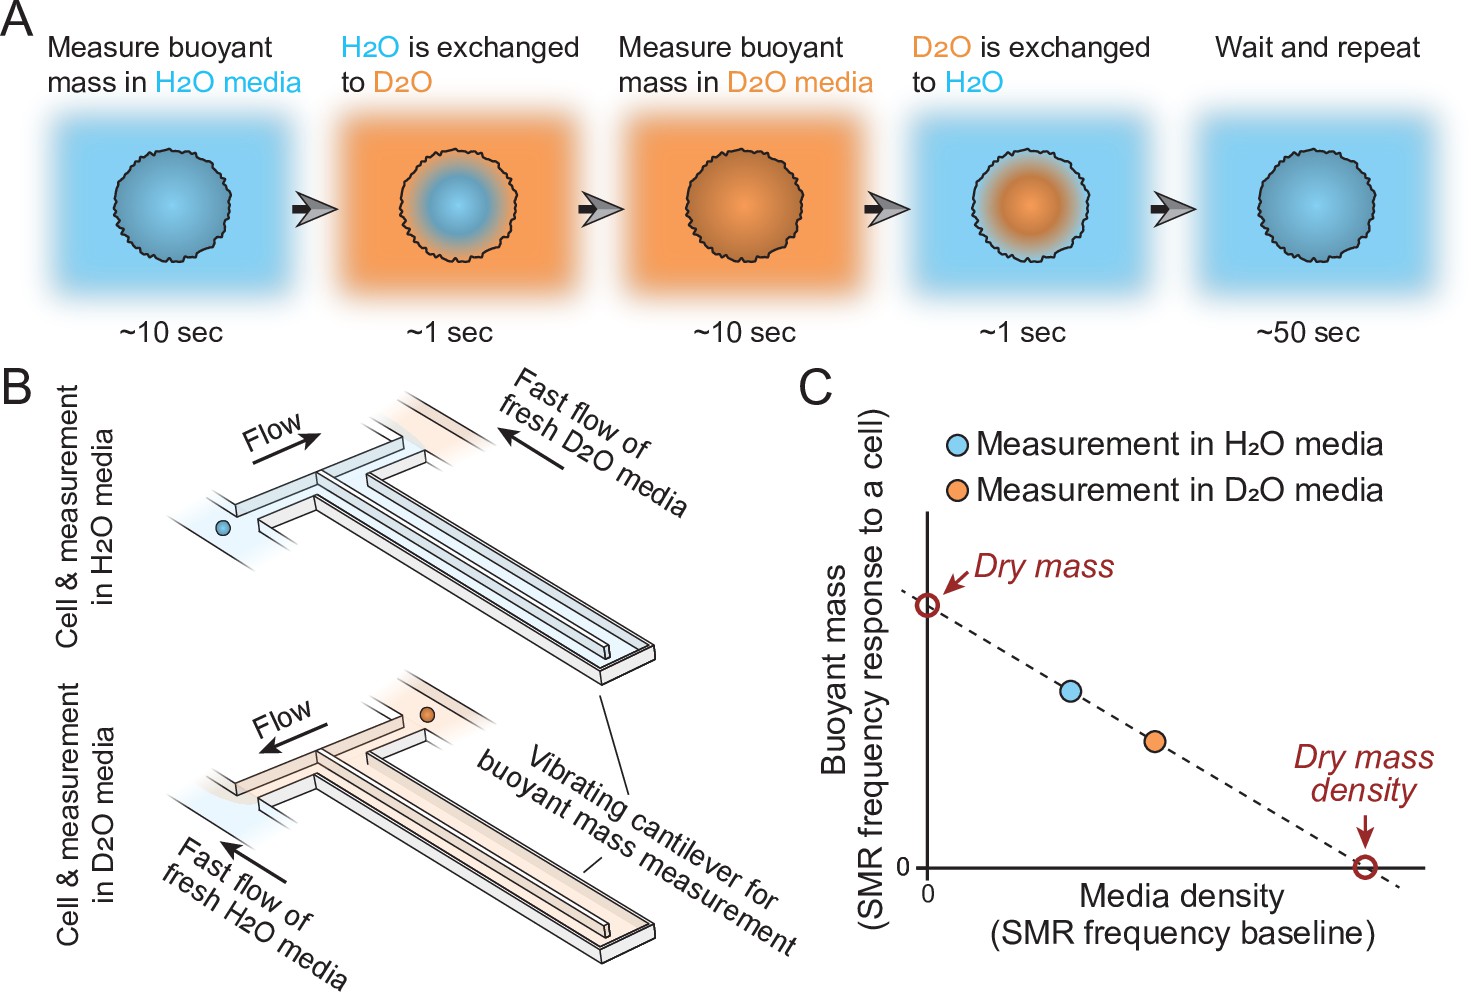
Schematic of dry mass and dry mass density measurements using the suspended microchannel resonator (SMR).
(A) The cell’s buoyant mass is first measured in normal, H2O-based culture media (blue), after which the cell mixes with D2O-based culture media (orange). The water content inside the cell exchanges to match the external water content. The cell’s buoyant mass is then measured again in the D2O-based media and the cell is mixed with normal, H2O-based media, where the cell waits for the next measurement. (B) In practice, these measurements are carried out using an SMR, where H2O and D2O-based medias are kept on different sides of the cantilever. Continuous flushing of fresh media into the system prevents the two fluids from equilibrating over time. The cell is depicted as a small blue/orange sphere. (C) To calculate the dry mass and dry mass density of the cell, the two buoyant mass measurements are correlated as a function of media density. The SMR’s baseline signal (vibration frequency) is proportional to media density and this measurement is obtained immediately before and after each buoyant mass measurement (frequency response to a cell flowing through the SMR) to account for variability in media mixing.
Figure 1—figure supplement 1
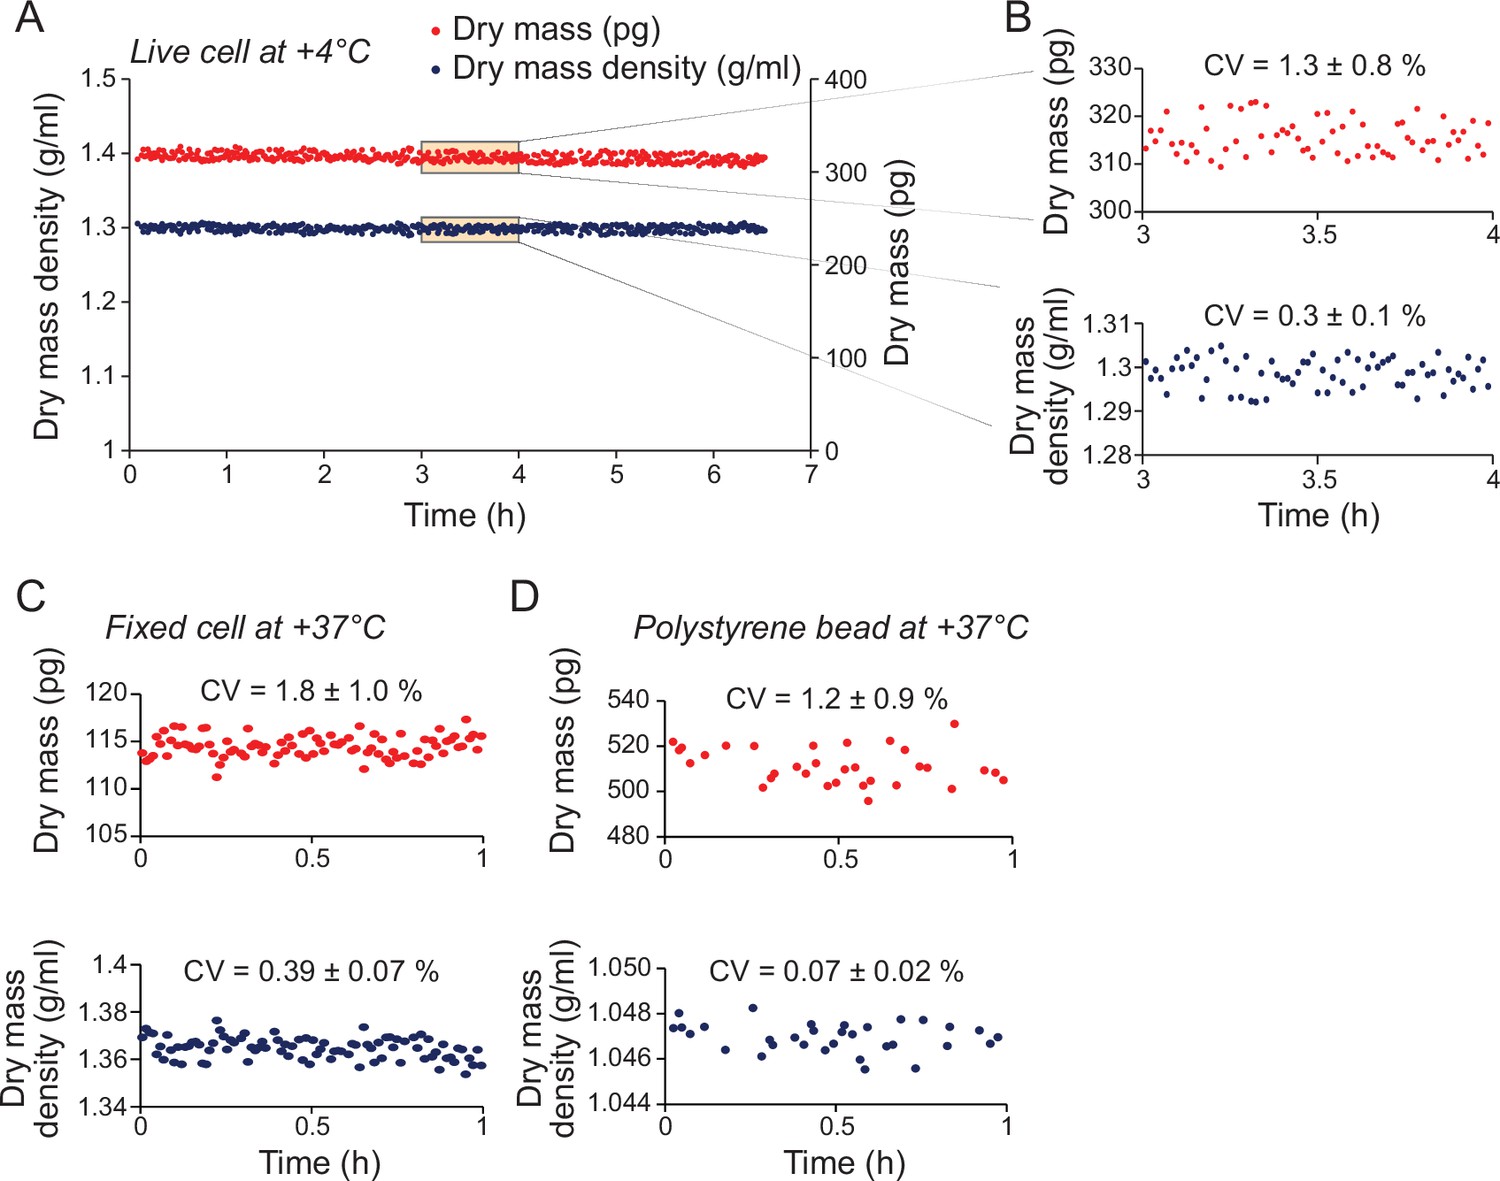
Quantifications of dry mass and dry mass density measurement errors.
(A) Monitoring dry mass (red) and dry mass density (blue) of a single L1210 cell kept at +4°C to prevent cell growth and major compositional changes. (B) Zoom-ins of dry mass and dry mass density within the indicated 1 hr window in panel (A). Measurement error was quantified as coefficient of variation (CV) within the 1 hr window (mean ± SD, N = 6 independent experiments). (C) Monitoring dry mass and dry mass density of a single L1210 cell that was fixed to prevent cell growth and compositional changes. Measurement error was quantified as CV (mean ± SD, N = 5 independent experiments). (D) Monitoring dry mass and dry mass density of a 10 µm diameter polystyrene bead. Measurement error was quantified as CV (mean ± SD, N = 4 independent experiments). For all measurement error quantifications, the error in dry volume measurements was comparable to the error in dry mass measurements.
Figure 1—figure supplement 2
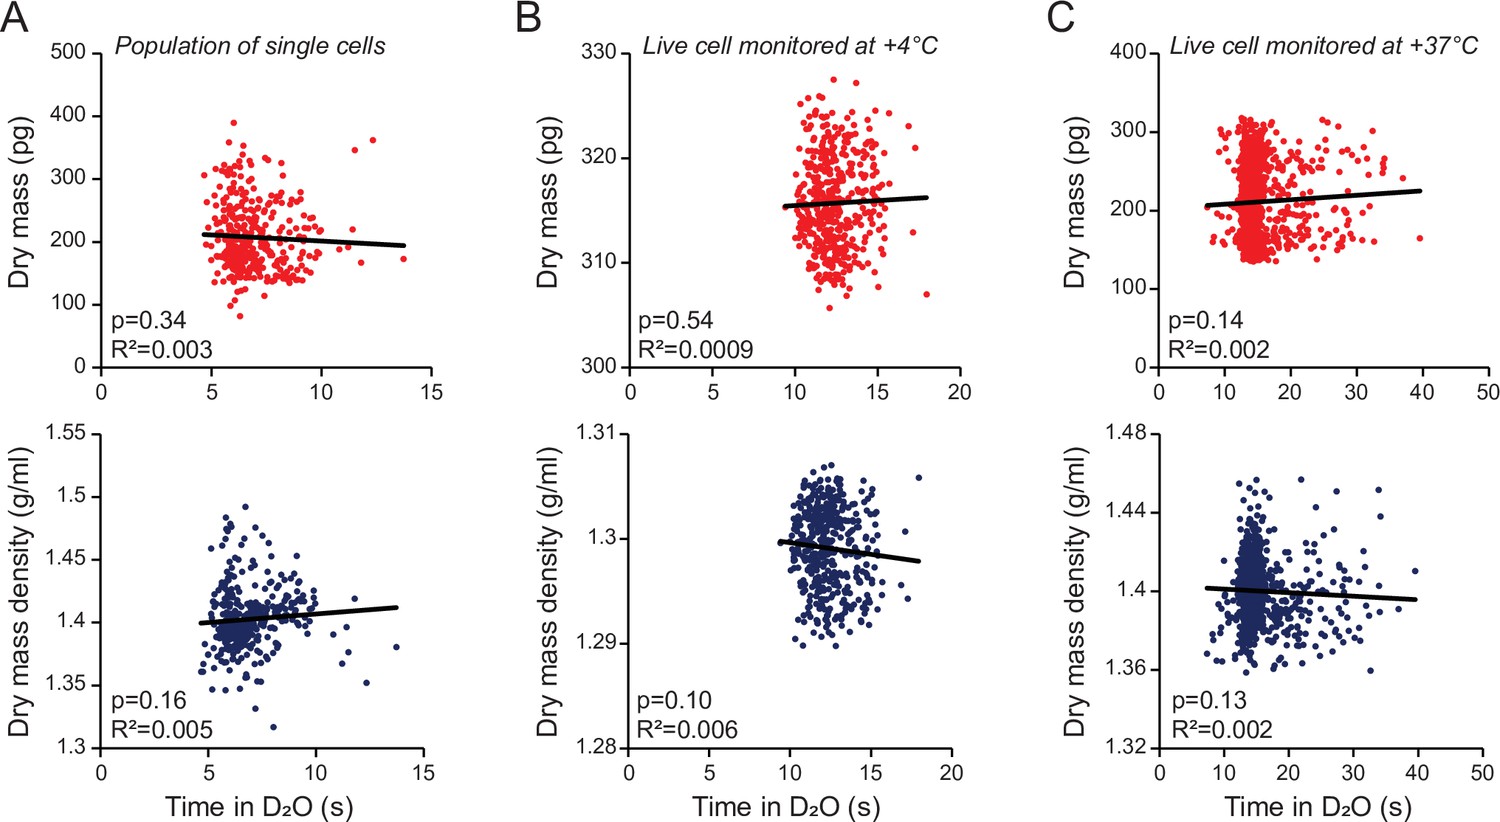
Dry mass and dry mass density measurements are not limited by the rate of water exchange.
(A) Dry mass (top, red) and dry mass density (bottom, blue) as a function of time that the cell was exposed to D2O-based media between the two consecutive buoyant mass measurements. Each dot represents a single cell from a population of L1210 cells; n = 358 cells. (B) Same as (A), but data is from single-cell monitoring of an L1210 cell at +4°C. Same data as in Figure 1—figure supplement 1A; n = 438 individual measurements. (C) Same as (A), but data is from single-cell monitoring of an L1210 growing at +37°C; n = 1102 individual measurements. Each figure shows a linear fit, Pearson correlation (R2), and correlation p-values calculated using ANOVA.
Figure 2 with 3 supplements
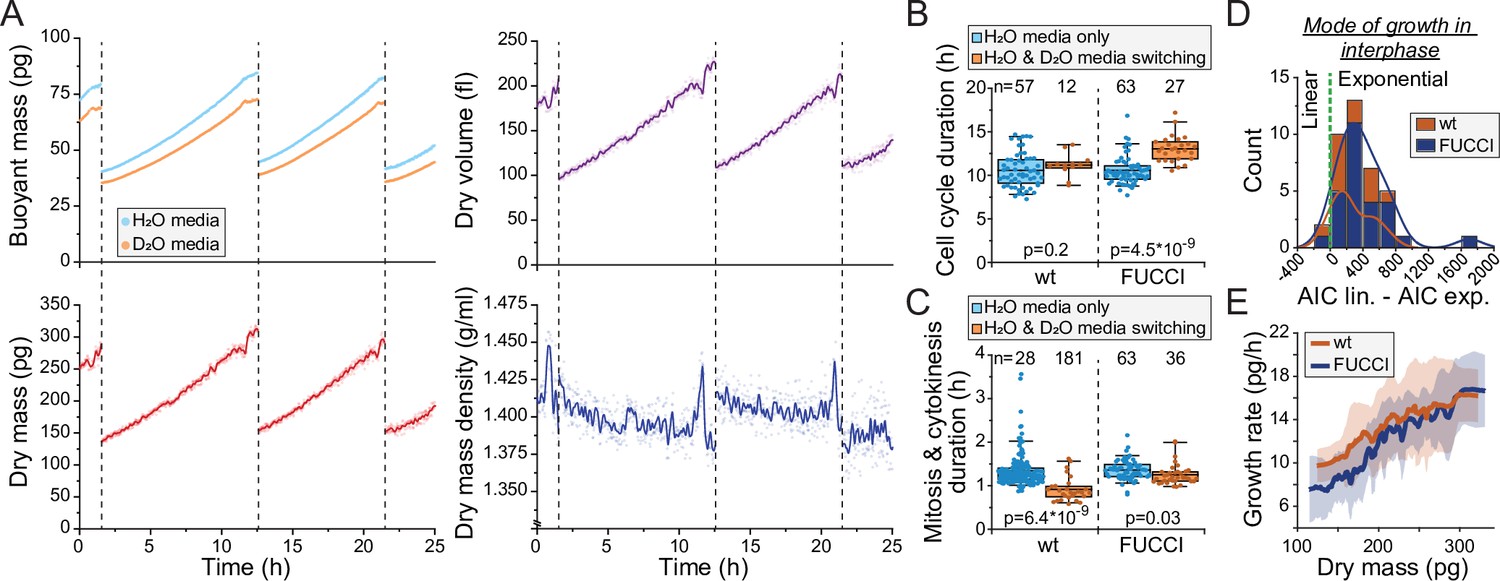
Monitoring buoyant mass, dry mass, dry volume, and dry mass density of single cells.
(A) An example dataset of an ancestral wild-type (wt) L1210 lineage tracked for its dry mass, dry volume, and dry mass density over two full cell cycles. Cell divisions are indicated with dashed vertical lines. Opaque points represent individual measurements and the solid lines represent smoothened data. (B) Cell cycle durations of wt and FUCCI L1210 cells grown in the suspended microchannel resonator (SMR) in normal media (blue) or with periodic D2O exposure (orange). Boxplot line: mean; box: interquartile range; whiskers: 5–95% range. p-Values calculated using Welch’s t-test; n values refer to individual cells. (C) Same as (B), but data displays the combined duration of mitosis and cytokinesis. (D) Histogram of Akaike information criterion (AIC) of a linear fit – AIC of an exponential fit for wt and FUCCI L1210 cells in interphase (n = 12 and 27 cells, respectively). Datapoints (individual cells) with positive values are better described by exponential rather than linear growth. (E) Cell dry mass growth rate as a function of dry mass in wt and FUCCI L1210 cells in interphase (n = 12 and 27 cells, respectively). The line and shaded area represent mean ± SD.
Figure 2—figure supplement 1
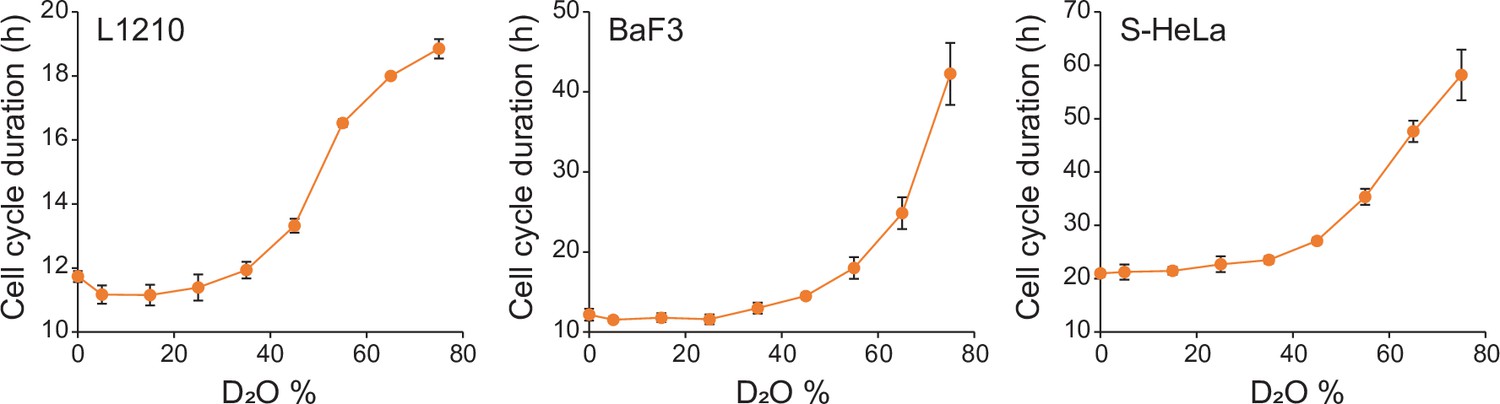
Influence of D2O on cell cycle durations in normal culture.
L1210, BaF3, and S-Hela cells were grown in media, where indicated % of H2O was replaced with D2O. Cell proliferation was monitored by imaging cell confluency over ~70 hr duration. N = 5 independent cultures (mean ± SD).
Figure 2—figure supplement 2
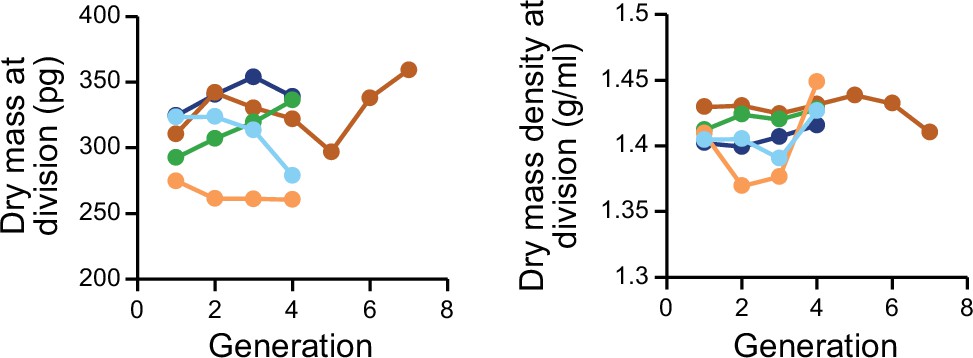
Dry mass and dry mass density measurements are not causing systematic drifts in cell size at division.
Dry mass (left) and dry mass density (right) at cell divisions across ancestral L1210 lineages. Each color displays a different experiment.
Figure 2—figure supplement 3
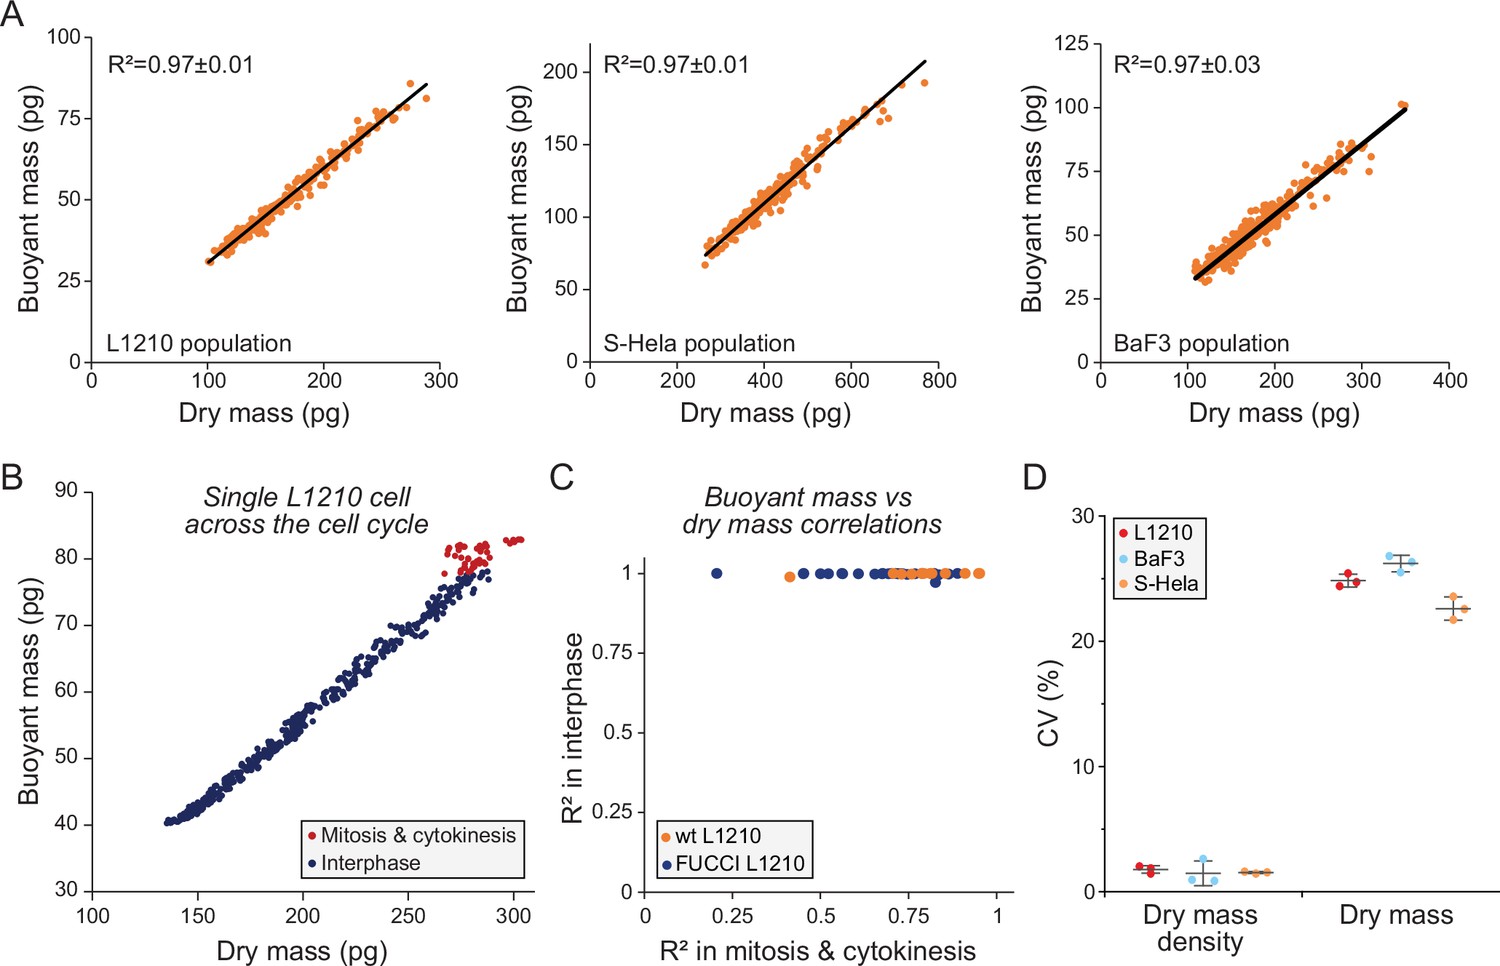
Dry and buoyant mass correlate near-perfectly, except in mitosis.
(A) Correlation between dry and buoyant mass in L1210 (left), S-Hela (middle), and BaF3 (right) cells within a population. Each dot represents a single cell from the same experiment and black line is the linear fit. The Pearson correlation (R2) values represent the mean ± SD from three independent experiments. (B) Correlation between buoyant mass and dry mass within a single wild-type (wt) L1210 cell cycle. Each dot represents a single measurement from the same cell in interphase (blue) or mitosis and cytokinesis (red). (C) Pearson correlations (R2) between buoyant mass and dry mass shown for interphase and for mitosis and cytokinesis. Data is obtained by single-cell monitoring and only full cell cycles are used (as in panel B). Each dot represents a single cell; data is shown for wt (orange) and FUCCI (blue) L1210 cells (n = 12 and 27, respectively). (D) Cell-to-cell variability in dry mass density and dry mass in L1210 (left), S-Hela (middle), and BaF3 (right) cells within a population. Each dot represents an independent experiment (N = 3); line and whiskers represent mean ± SD.
Figure 3 with 3 supplements
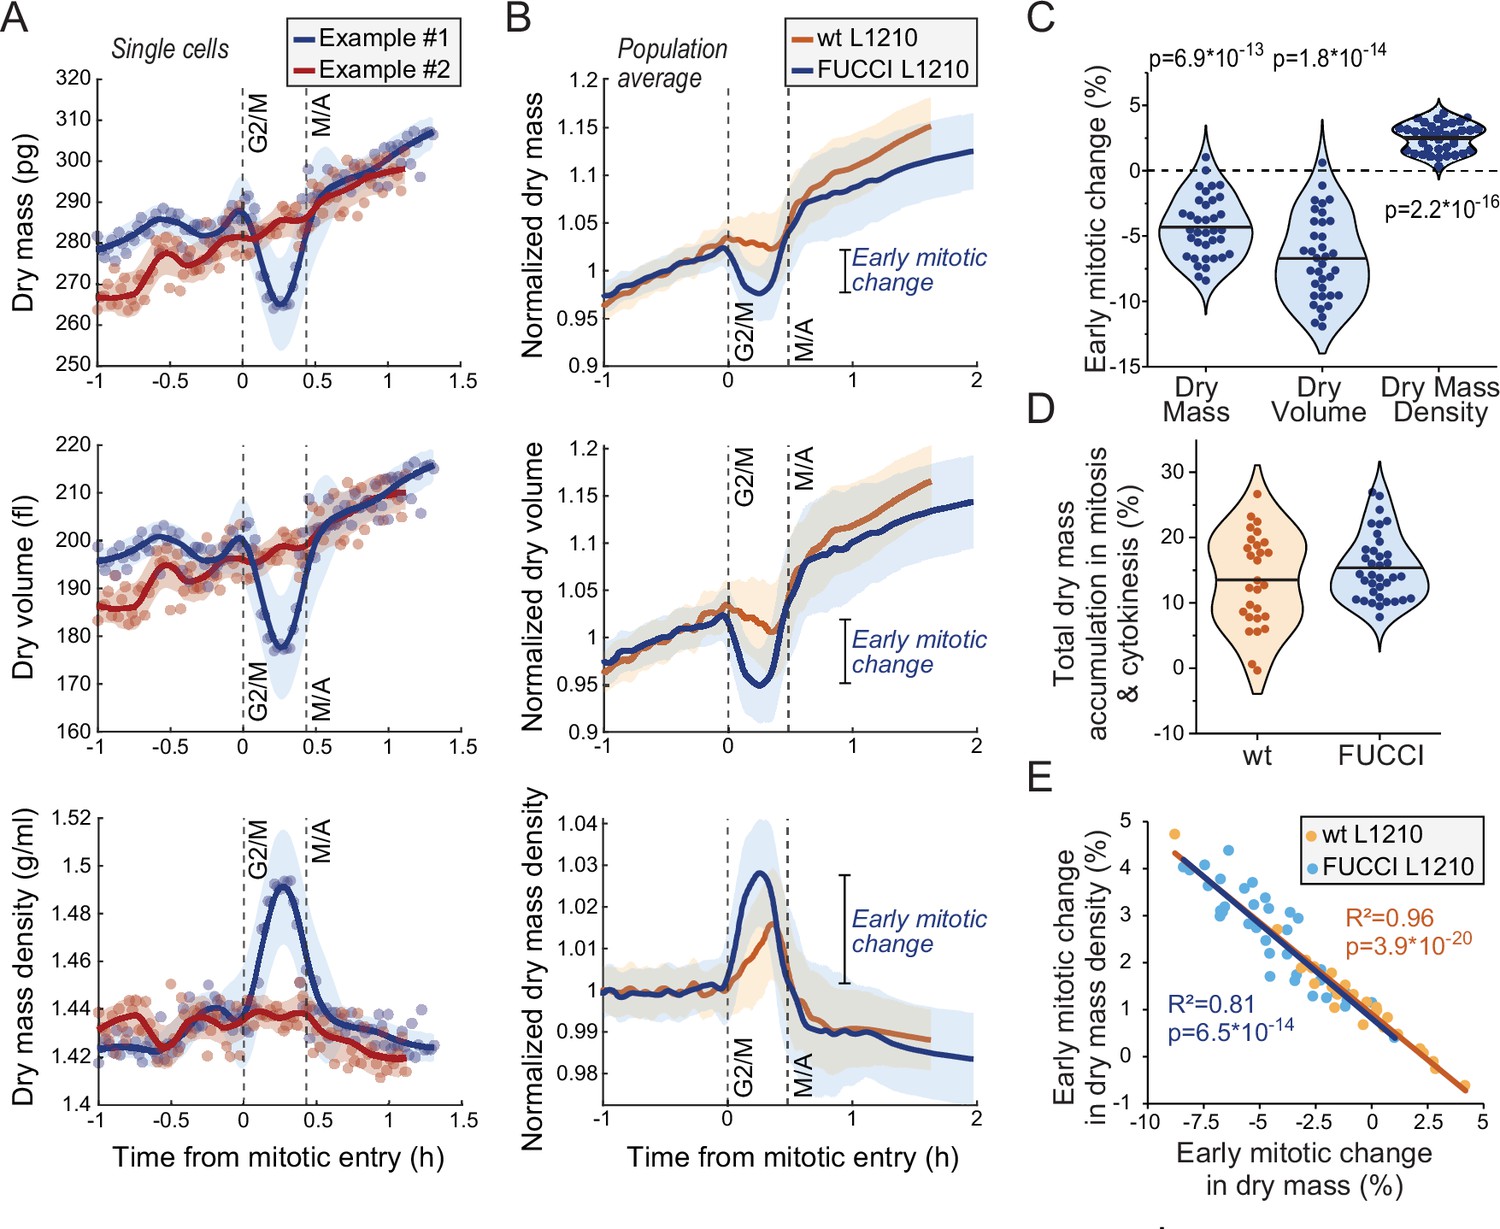
Cells transiently lose dry mass and increase dry mass density in early mitosis.
(A) Two example FUCCI L1210 cells with different dry mass (top), dry volume (middle), and dry mass density (bottom) behaviors in early mitosis. Opaque points represent individual measurements; thick line and shaded area represent smoothened data (mean ± SD). Dashed vertical lines indicate approximate G2/M and metaphase-anaphase (M/A) transitions. (B) Population average dry mass, dry volume, and dry mass density behavior in wild-type (wt) and FUCCI L1210 cells. Thick line and shaded area represent mean ± SD. N = 31 cells from 19 independent experiments for the wt cells; N = 36 cells from 13 independent experiments for the FUCCI cells. (C) Quantifications of dry composition changes in early mitosis in FUCCI L1210 cells. Dots represent individual cells; horizontal line represents mean; data is same as in panel (B); p-values calculated using one sample t-test and represent difference from zero. (D) Dry mass accumulation from mitotic entry to cell division relative to the dry mass accumulated in the whole cell cycle. Dots represent individual cells; horizontal line represents mean; data is same as in panel (B). (E) Correlation between dry mass and dry mass density change in early mitosis for wt and FUCCI L1210 cells. Data is same as in panel (B); correlation p-values calculated using ANOVA. Raw data can be found in Figure 3—source data 1.
-
Figure 3—source data 1
Dry mass and dry mass density traces for different cell lines and conditions.
- https://cdn.elifesciences.org/articles/76664/elife-76664-fig3-data1-v1.xlsx
Figure 3—figure supplement 1
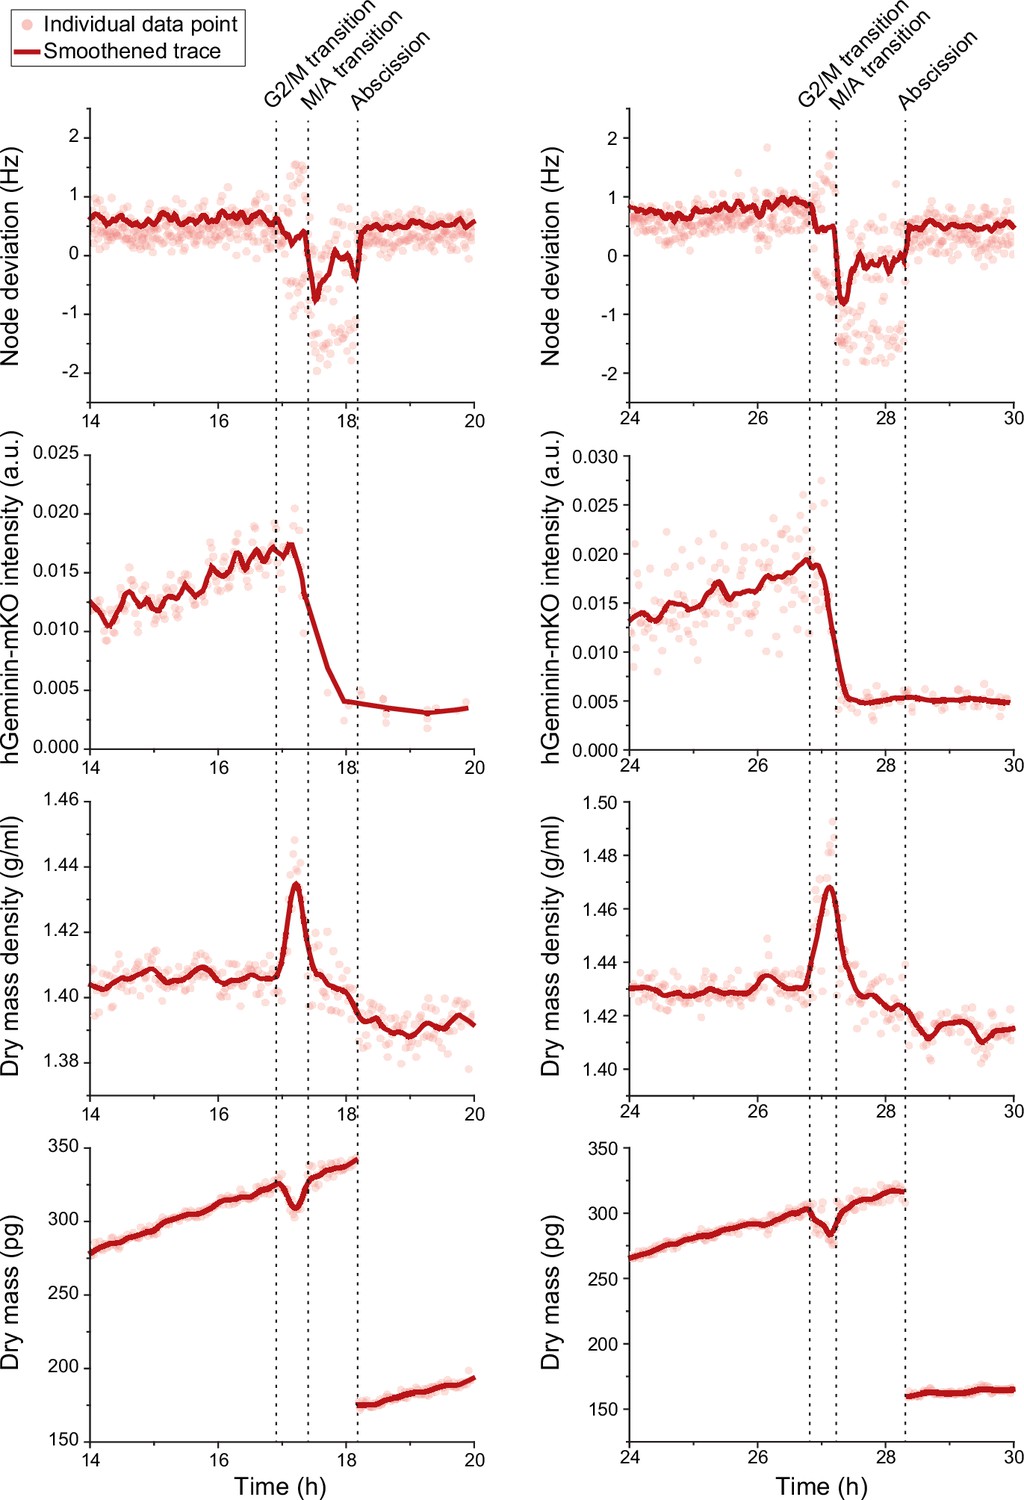
Cell cycle indicators and mitotic dry composition change.
Two representative L1210 FUCCI cell traces (left and right column) with cell cycle indicators (top two rows) and dry composition changes (bottom two rows) in mitosis. Acoustic scattering from the cell, that is, node deviation, is used to detect approximate mitotic entry and metaphase-anaphase transition (M/A transition), and the FUCCI cell cycle sensor, hGeminin-mKO fluorescence intensity, is used to validate the M/A transition.
Figure 3—figure supplement 2
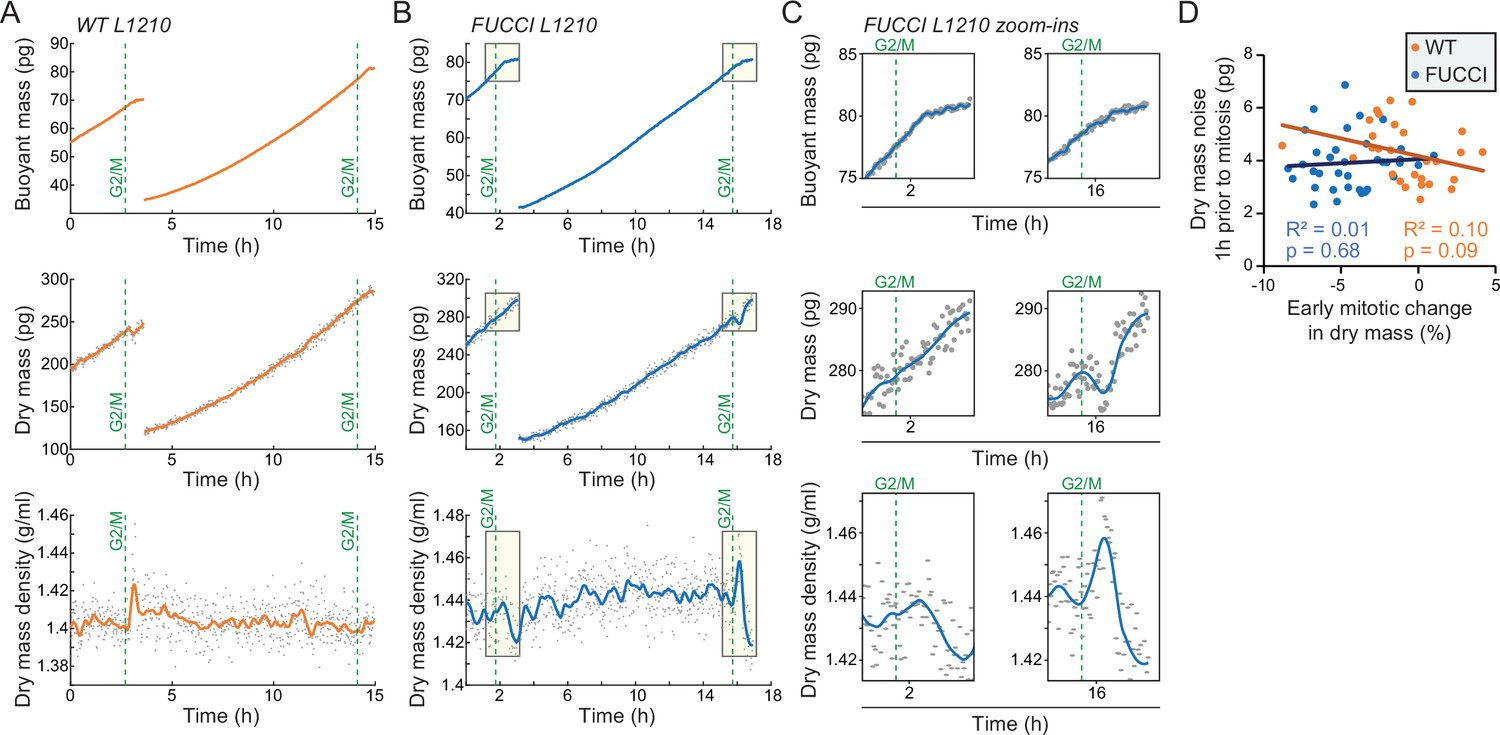
Cell-to-cell variability in the loss of dry mass in early mitosis reflects biological, non-genetic cell-to-cell variability.
(A) Example buoyant mass (in H2O-based media), dry mass, and dry mass density traces of wild-type (wt) L1210 cells, where mother and daughter cells display different mitotic dry composition behaviors. Gray dots indicate individual measurements and orange line indicates the smoothened trace; green, dashed vertical lines indicate mitotic entry (G2/M). (B) Same as panel (A), but for FUCCI L1210 cells. (C) Zoom-ins of the mitotic sections indicated by light yellow boxes in panel (B), showing the loss of dry mass and increase in dry mass density in daughter cell, but not the mother cell. Note that the buoyant mass resolution is lower than in our previous work (Miettinen et al., 2019) due to H2O and D2O fluid mixing which causes fluctuations in suspended microchannel resonator (SMR) baseline signal when monitoring the dry composition of a cell. (D) Correlation of experiment-specific dry mass noise (deviation from a linear fit in the last 1 hr prior to mitotic entry) as a function of the early mitotic change in dry mass. Each point is a separate cell; correlation p-value calculated using ANOVA; N = 28 cells for wt L1210; N = 36 cells for FUCCI L1210.
Figure 3—figure supplement 3

Mitotic dry mass and dry mass density behavior in BaF3 and THP-1 cells.
(A) An example of BaF3 cell dry mass behavior in mitosis. Opaque points represent individual measurements. Thick line and shaded area represent smoothened data (mean ± SD). Dashed vertical lines indicate approximate G2/M and metaphase-anaphase (M/A) transitions. (B) Same as (A), but for dry mass density. (C) Population average dry mass behavior in BaF3 cells. Thick line and shaded area represent mean ± SD. N = 18 cells from 11 independent experiments. (D) Same as (C), but for dry mass density. (E) Quantifications of dry mass and dry mass density changes in early mitosis in BaF3 cells. Dots represent individual cells; horizontal line represents mean; data is same as in panels (C and D); p-values calculated using one sample t-test and represent difference from zero. (F–J) Same as panels (A–E), but data is for THP-1 cells. N = 9 cells from eight independent experiments.
Figure 4 with 1 supplement

Mitotic dry mass loss and dry mass density increase do not require morphological changes.
(A) % of mitotic cells in a wild-type (wt) L1210 population following 5 hr control or S-trityl-L-cysteine (STLC) treatment. N = 4 independent cultures; p-value calculated using Welch’s t-test. (B) Normalized dry mass behavior for control and STLC-treated wt L1210 cells (left) and quantifications of early mitotic dry mass changes (right). N = 31 cells from 19 independent experiments for control; N = 9 cells from 9 independent experiments for STLC; p-value calculated using Welch’s t-test. (C) Same as panel (B), but for dry mass density. (D) Representative phase contrast and mAG-Geminin reporter images of control and Barasertib-treated FUCCI L1210 cells in mitosis. N > 20 cells from three independent experiments. (E) Normalized dry mass behavior for FUCCI L1210 cells treated with indicated chemicals (left) and quantifications of early mitotic dry mass changes (right). N = 36 cells from 13 independent experiments for control; N = 8 cells from eight independent experiments for Barasertib; N = 16 cells from 15 independent experiments for EIPA; p-value calculated using ANOVA. (F) Same as panel (E), but for dry mass density. (G) Normalized intracellular water volume behavior for control and EIPA-treated FUCCI L1210 cells (left) and quantifications of mitotic cell swelling (right). N = 6 cells from five independent experiments for control; N = 8 cells from eight independent experiments for EIPA; p-value calculated using Welch’s t-test. In dry mass, dry mass density, and water volume traces, the thick line and shaded area represent mean ± SD; boxplot line: mean; box: interquartile range; whiskers: 5–95% range. Raw data can be found in Figure 3—source data 1.
Figure 4—figure supplement 1
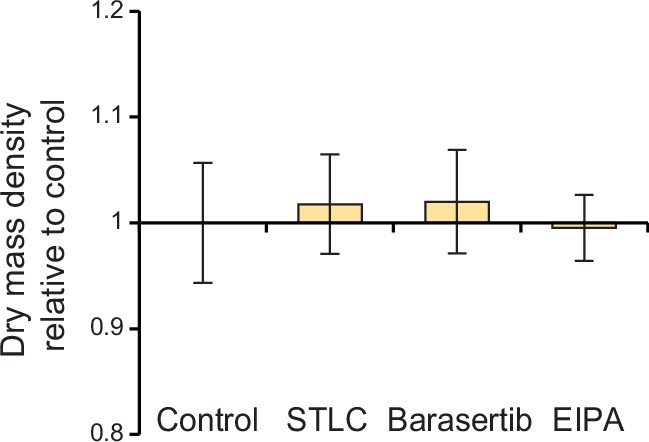
L1210 cell population dry mass density following mitotic perturbations.
L1210 cells were treated with indicated chemicals for 4 hr using same concentrations as in Figure 4. Data represents mean ± SD of dry mass density from >60 cells per condition.
Figure 5 with 2 supplements

Lysosomal exocytosis is increased in early mitosis.
(A) A representative image of surface LAMP-1 immunolabeling alone (left) and together with DNA labeling (right) in live L1210 cells. Orange arrow indicates a mitotic cell, blue arrowheads indicate interphase cells. Scale bars depict 10 μm. (B) Microscopy quantifications of cell surface LAMP-1 immunolabeling in unsynchronized L1210 cells. Early mitosis refers to prophase, prometaphase, and metaphase; late mitosis refers to anaphase. N = 380, 29, and 11 cells for interphase, early, and late mitotic cells, respectively; data pooled from two independent experiments; p-values calculated using ANOVA followed by Sidakholm post hoc test. (C) % of mitotic cells in L1210 cell populations following synchronization to G2 or early mitosis. N = 5 independent cultures; p-value calculated using Welch’s t-test. (D) Flow cytometry quantifications of L1210 cell population surface LAMP-1 immunolabeling following synchronization to G2 or early mitosis. N = 5 independent cultures; p-value calculated using Welch’s t-test. In all figures, line and whiskers indicate mean ± SD.
Figure 5—figure supplement 1
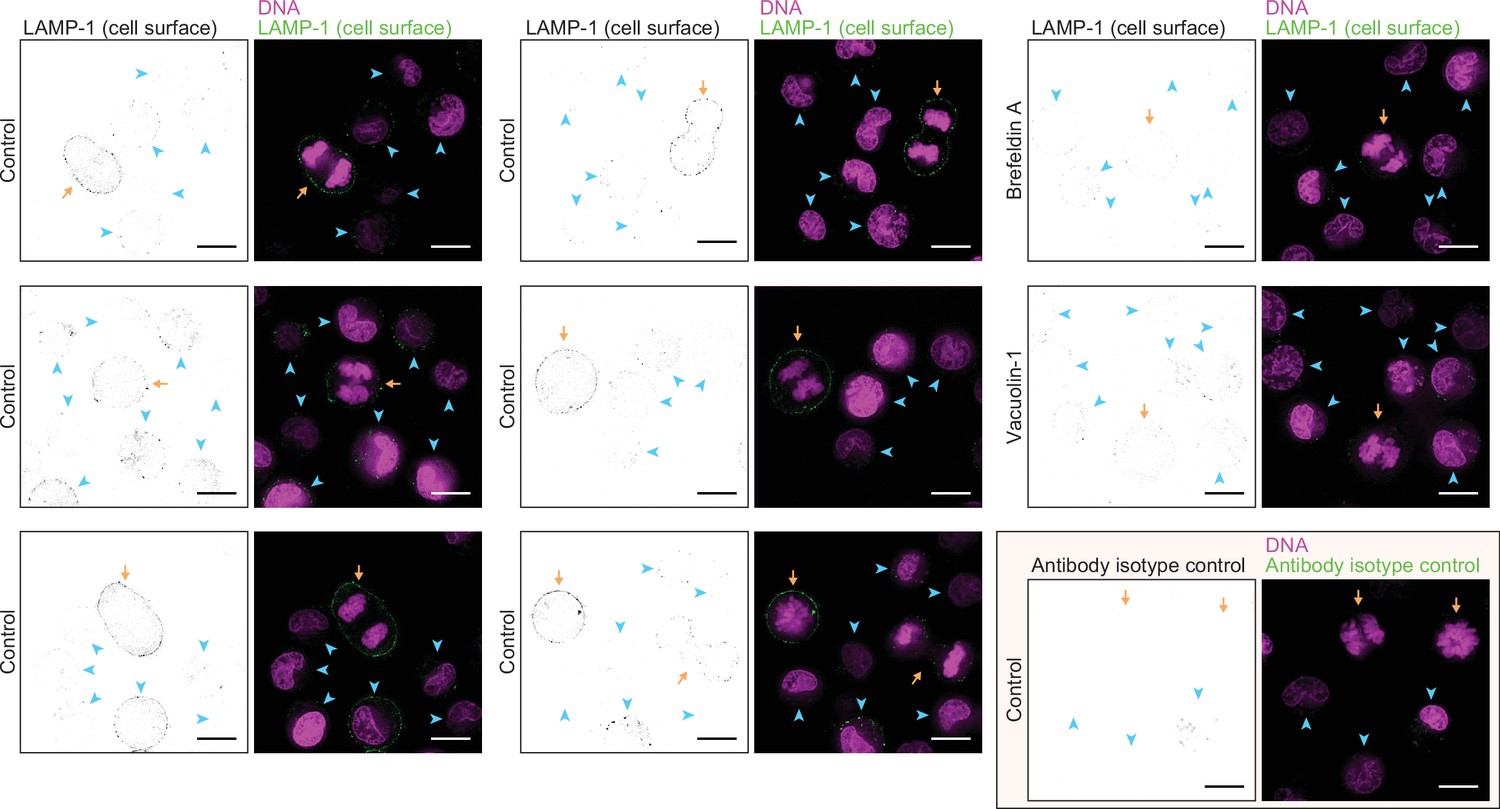
Additional examples of live L1210 cell surface LAMP-1 labeling.
Additional images of surface LAMP-1 immunolabeling alone (left, black and white) and together with DNA labeling (right, color) in live L1210 cells. First two columns display LAMP-1 immunolabeling under control conditions. Last column displays LAMP-1 immunolabeling after 4 hr drug treatments (top two rows) or under control conditions but using the corresponding antibody isotype labeling (bottom row). All images are from wild-type (wt) L1210 cells and represent a single z-slice. Orange arrows indicate mitotic cells, blue arrowheads indicate interphase cells. All scale bars depict 10 μm.
Figure 5—figure supplement 2
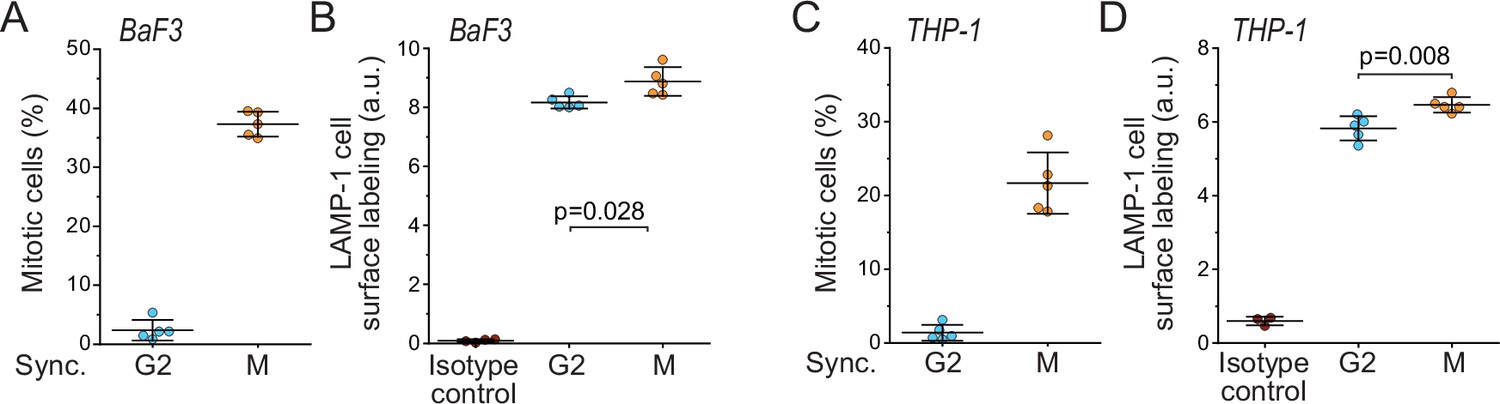
Lysosomal exocytosis is higher in early mitosis than in G2 in BaF3 and THP-1 cells.
(A) % of mitotic cells in BaF3 cell populations following synchronization to G2 or early mitosis. N = 5 independent cultures. (B) Flow cytometry quantifications of BaF3 cell population surface LAMP-1 immunolabeling following synchronization to G2 or early mitosis. N = 4–5 independent cultures. Isotype control indicates labeling intensity when using isotype control antibody in an unsynchronized population. (C) Same as panel (A), but for THP-1 cells. N = 5 independent cultures. (D) Same as panel (B), but for THP-1 cells. N = 3–5 independent cultures. In all figures, line and whiskers indicate mean ± SD, p-values calculated using Welch’s t-test.
Figure 6 with 1 supplement
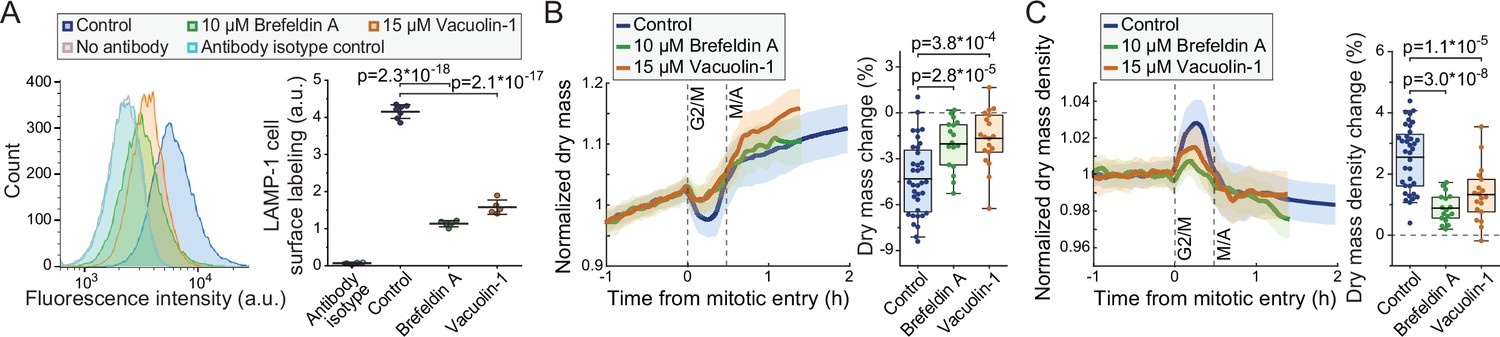
Inhibitors of lysosomal exocytosis decrease mitotic dry mass secretion.
(A) Representative histograms (left) and quantifications (right) of live L1210 cell surface LAMP-1 immunolabeling following indicated, 4 hr long chemical treatments. Line and whiskers indicate mean ± SD; N = 4–7 independent cultures. (B) Normalized dry mass behavior for FUCCI L1210 cells treated with indicated chemicals (left) and quantifications of early mitotic dry mass changes (right). N = 36 cells from 13 independent experiments for control; N = 17 cells from 17 independent experiments for brefeldin A; N = 19 cells from 19 independent experiments for vacuolin-1; p-values calculated using ANOVA followed by Sidakholm post hoc test; Thick line and shaded area represent mean ± SD; boxplot line: mean; box: interquartile range; whiskers: 5–95% range. (C) Same as panel (B), but for dry mass density. Raw data can be found in Figure 3—source data 1.
Figure 6—figure supplement 1
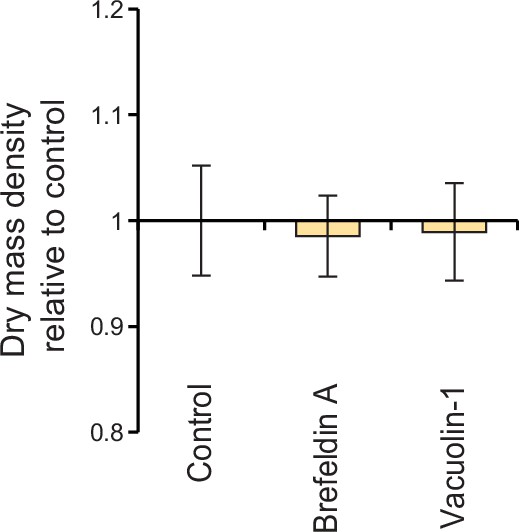
L1210 cell population dry mass density following exocytosis perturbations.
L1210 cells were treated with indicated chemicals for 4 hr using same concentrations as in Figure 6. Data represents mean ± SD of dry mass density from >70 cells per condition.
Tables
Key resources table
| Reagent type (species) or resource | Designation | Source or reference | Identifiers | Additional information |
|---|---|---|---|---|
| Cell line (Mus musculus) | wt L1210 | ATCC | Cat#CCL-219 | |
| Cell line (Mus musculus) | FUCCI L1210 | Other | Generated in a previous study (Son et al., 2015, Nature Methods), cells originate from ATCC (Cat#CCL-219) | |
| Cell line (Mus musculus) | BaF3 | RIKEN BioResource Center | Cat#RCB4476 | |
| Cell line (Homo sapiens) | S-HeLa | Other | Kindly provided by laboratory of Kevin Elias from Brigham And Women’s Hospital | |
| Cell line (Homo sapiens) | THP-1 | Other | Kindly provided by laboratory of Jianzhu Chen from Massachusetts Institute of Technology | |
| Cell line (Mus musculus) | wt L1210 | ATCC | Cat#CCL-219 | |
| Chemical compound, drug | STLC | Sigma-Aldrich | Cat#164739; CAS:2799-07-7 | |
| Chemical compound, drug | Barasertib | Cayman Chemical | Cat#13600; CAS:639089-54-6 | Alternative Names: MK 0457, VX 680 |
| Chemical compound, drug | EIPA | Cayman Chemical | Cat#14406; CAS:1154-25-2 | |
| Chemical compound, drug | RO-3306 | Cayman Chemical | Cat#15149; CAS:872573-93-8 | All experiments were done using a stock under 2 weeks of age |
| Chemical compound, drug | Vacuolin-1 | Cayman Chemical | Cat#20425; CAS:351986-85-1 | |
| Chemical compound, drug | Brefeldin A | Cayman Chemical | Cat#11861; CAS:20350-15-6 | |
| Antibody | Anti-LAMP-1 conjugated to Alexa Fluor 488 (rat monoclonal) | Thermo Fisher Scientific | Cat#53-1071-82; RRID:AB_657536 | Clone: eBio1D4B (1D4B) (1:50 dilution) |
| Antibody | IgG2a kappa Isotype Control conjugated to Alexa Fluor 488 (rat monoclonal) | Thermo Fisher Scientific | Cat#53-4321-80; RRID:AB_493963 | Clone: eBR2a (1:50 dilution) |
| Antibody | Anti-LAMP-1 conjugated to Alexa Fluor 488 (mouse monoclonal) | Thermo Fisher Scientific | Cat#53-1079-42; RRID:AB_2016657 | Clone: eBioH4A3 (1:50 dilution) |
| Other | RPMI media, powder | Thermo Fisher Scientific | Cat#31800022 | Cell culture media |
| Other | Heavy water (D2O) | Sigma-Aldrich | Cat#151882; CAS:7789-20-0 | Heavy water used for culture media |
| Other | NUCLEAR-ID Red DNA stain | Enzo Life Sciences | Cat#ENZ-52406 | DNA stain (1:250 dilution) |
| Other | 10 μm Diameter Duke Standards 2000 Series Uniform Polystyrene Particles | Thermo Fisher Scientific | Cat#2010A | Standard particles for calibration |
| Software, algorithm | MATLAB R2017b and R2021b | MathWorks | Used to analyze the SMR raw data and generate data plots | |
| Software, algorithm | Origin 2021b | OriginLab | Used to perform statistical analyses and generate data plots |
Additional files
Download links
A two-part list of links to download the article, or parts of the article, in various formats.
Downloads (link to download the article as PDF)
Open citations (links to open the citations from this article in various online reference manager services)
Cite this article (links to download the citations from this article in formats compatible with various reference manager tools)
Single-cell monitoring of dry mass and dry mass density reveals exocytosis of cellular dry contents in mitosis
eLife 11:e76664.
https://doi.org/10.7554/eLife.76664


