Crystal structures of bacterial small multidrug resistance transporter EmrE in complex with structurally diverse substrates
- Department of Molecular, Cellular, and Developmental Biology, University of Michigan, United States
- Program in Chemical Biology, University of Michigan, United States
- Laura and Isaac Perlmutter Cancer Center, New York University Langone Medical Center, United States
- Department of Medicine, New York University Grossman School of Medicine, United States
- Department of Biochemistry and Molecular Pharmacology, New York University Grossman School of Medicine, United States
- Program in Biophysics, University of Michigan, United States
Figures
Figure 1 with 3 supplements
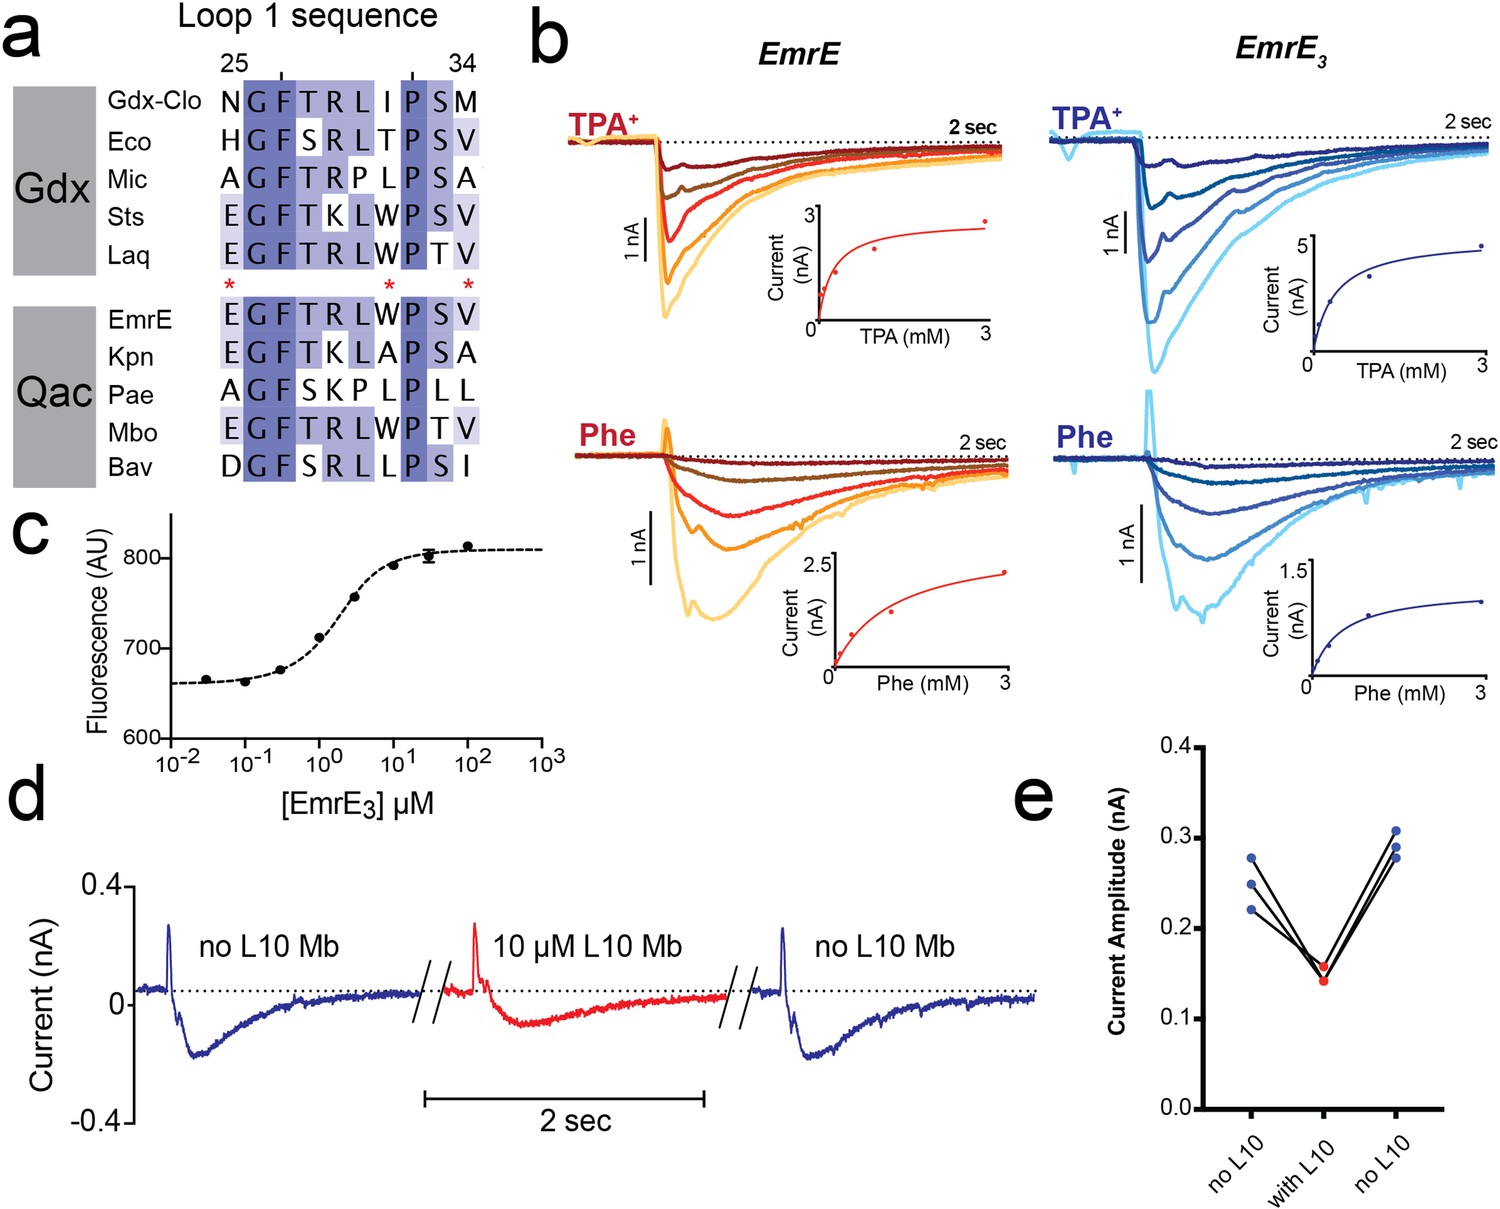
Introduction of monobody binding epitope to EmrE.
(A) Sequence alignment for loop 1 of selected SMR proteins, numbered according to EmrE sequence. From top to bottom: representative Gdx sequences (Clostridiales bacterium oral taxon 876, Escherichia coli, Micromonospora, Streptomyces tsukubensis, and Leifsonia aquatica) and representative Qac sequences (Escherichia coli, Klebsiella pneumoniae, Pseudomonas aeruginosa, Mycobacterium bovis, and Bordetella avium). Positions mutated in the EmrE3 construct (E25N, W31I, V34M) are indicated with red asterisks. Sequence conservation analysis for this loop is shown in Figure 4. (B) Representative currents evoked by perfusion of WT EmrE or EmrE3 sensors (shades of red and blue, respectively) with 30 μM – 3 mM TPA+ (top panels) or PheGdm+ (Phe, lower panels). Insets show plot of peak current amplitude as a function of substrate concentration for a representative titration performed using a single sensor. Solid lines represent fit of datapoints from a single titration series to the Michaelis-Menten equation. Km values for independent replicates are reported in Figure 1—figure supplement 2. (C) Microscale thermophoresis measurement of EmrE3 binding to monobody L10. Points and error bars represent mean and SEM of three independently prepared samples. Where not visible, error bars are smaller than the diameter of the point. Dashed line represents fit to Equation 1 with Kd = 850 nM. Representative raw data trace is shown in Figure 1—figure supplement 3. (D) EmrE3 currents evoked by 1 mM PheGdm+. Sensors were incubated for 10 min in the presence (red traces) or absence (blue traces) 10 μM monobody L10 prior to initiating transport by perfusion with PheGdm+. Currents shown are from a representative experimental series using a single sensor preparation. (E) Peak currents measured for three independent perfusion series performed as in panel D. Peak currents decreased an average of 40% ± 1.5% in the presence of monobody.
-
Figure 1—source data 1
SSM electrophysiology traces for EmrE and EmrE3 with varying concentrations of TPA+ and phenylGdm+.
- https://cdn.elifesciences.org/articles/76766/elife-76766-fig1-data1-v2.xlsx
-
Figure 1—source data 2
Peak currents for EmrE or EmrE3 as a function of TPA+ or phenylGdm+ concentration.
- https://cdn.elifesciences.org/articles/76766/elife-76766-fig1-data2-v2.xlsx
-
Figure 1—source data 3
Changes in MST fluorescence as a function of EmrE3 concentration.
- https://cdn.elifesciences.org/articles/76766/elife-76766-fig1-data3-v2.xlsx
-
Figure 1—source data 4
SSM electrophysiology traces for EmrE3 with and without L10 monobody addition.
- https://cdn.elifesciences.org/articles/76766/elife-76766-fig1-data4-v2.xlsx
-
Figure 1—source data 5
Peak current values for replicate measurements of EmrE3 currents in the presence and absence of monobody L10.
- https://cdn.elifesciences.org/articles/76766/elife-76766-fig1-data5-v2.xlsx
-
Figure 1—source data 6
Km values for TPA+ and phenylGdm+ transport by EmrE and EmrE3.
- https://cdn.elifesciences.org/articles/76766/elife-76766-fig1-data6-v2.xlsx
Figure 1—figure supplement 1
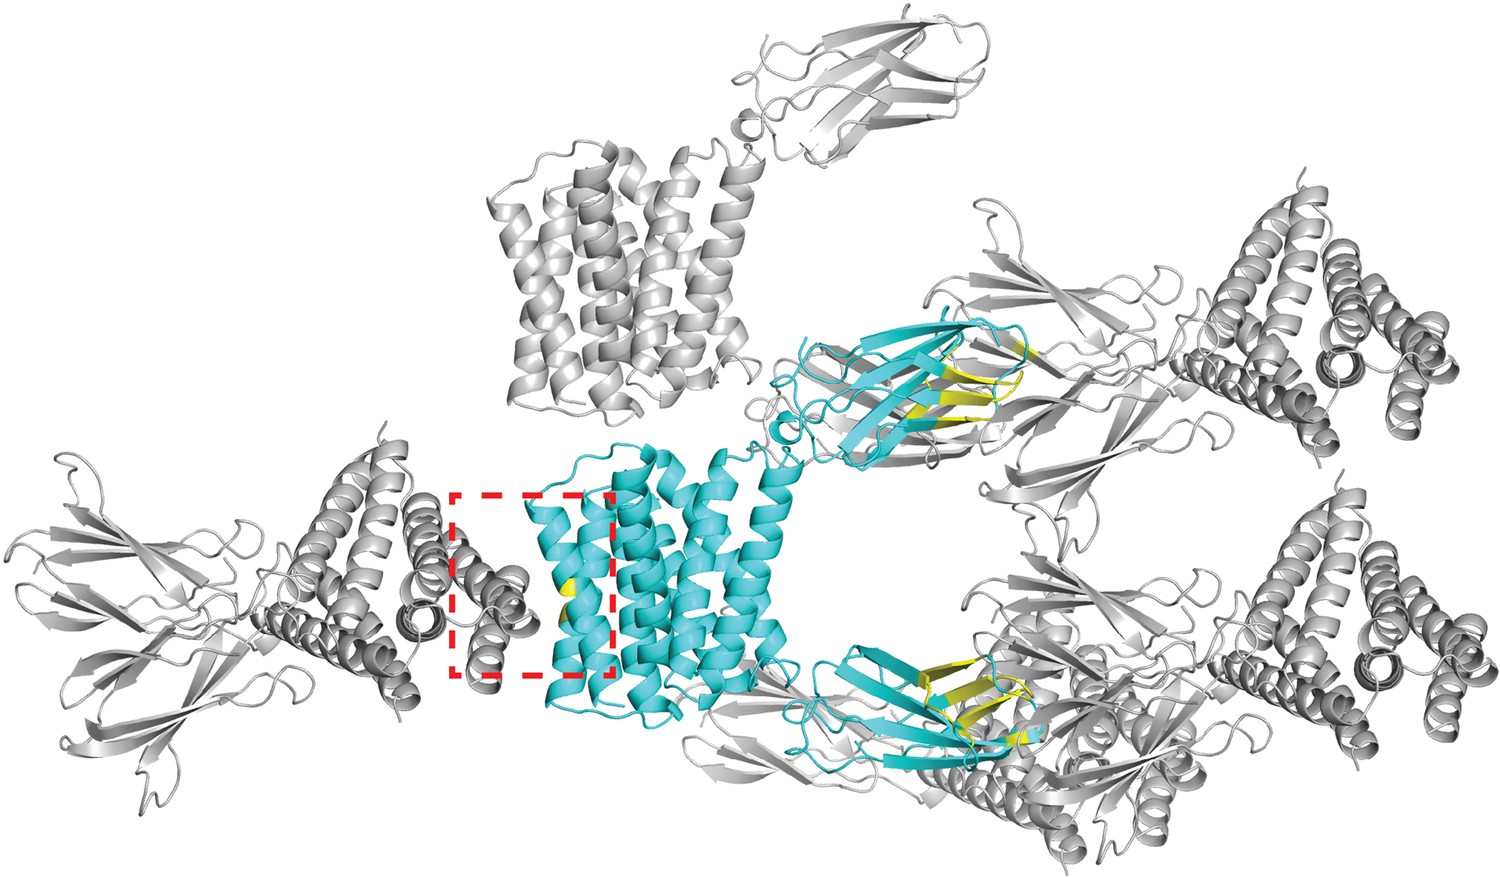
Crystal lattice for Gdx-Clo/L10 monobody complex (PDB: 6WK8).
The asymmetric unit, composed of one Gdx-Clo dimer and two monobodies, is shown in cyan. Symmetry mates are shown in gray. Residues that contribute to an interface between the asymmetric unit and its symmetry mates are colored yellow. Five Gdx-Clo residues are in contact with a symmetry mate: TM4 residues V88B, L92B, T95B, F89A, L92A (dashed red box).
Figure 1—figure supplement 2
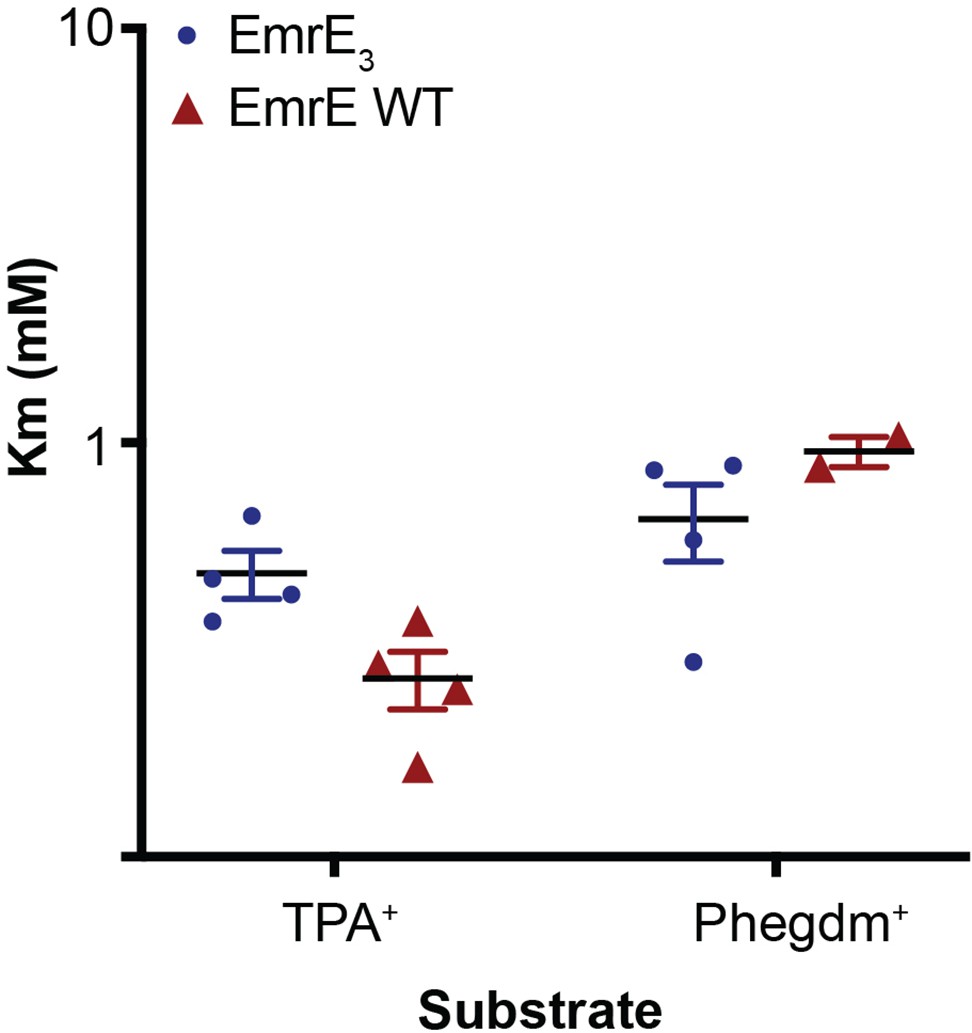
Km values for TPA+ and PheGdm+ transport by EmrE3 (blue) and WT EmrE (red).
Individual points are derived from Michaelis-Menten fits of titration experiments performed on a single sensor. Each Km value was measured from a full titration series on an independently prepared sensor. Sensors are prepared from two to three independent biochemical purifications.
Figure 1—figure supplement 3

Representative microscale thermophoresis traces for monobody L10 in the presence of 30 nM – 10 μM EmrE3.
Figure 2 with 3 supplements
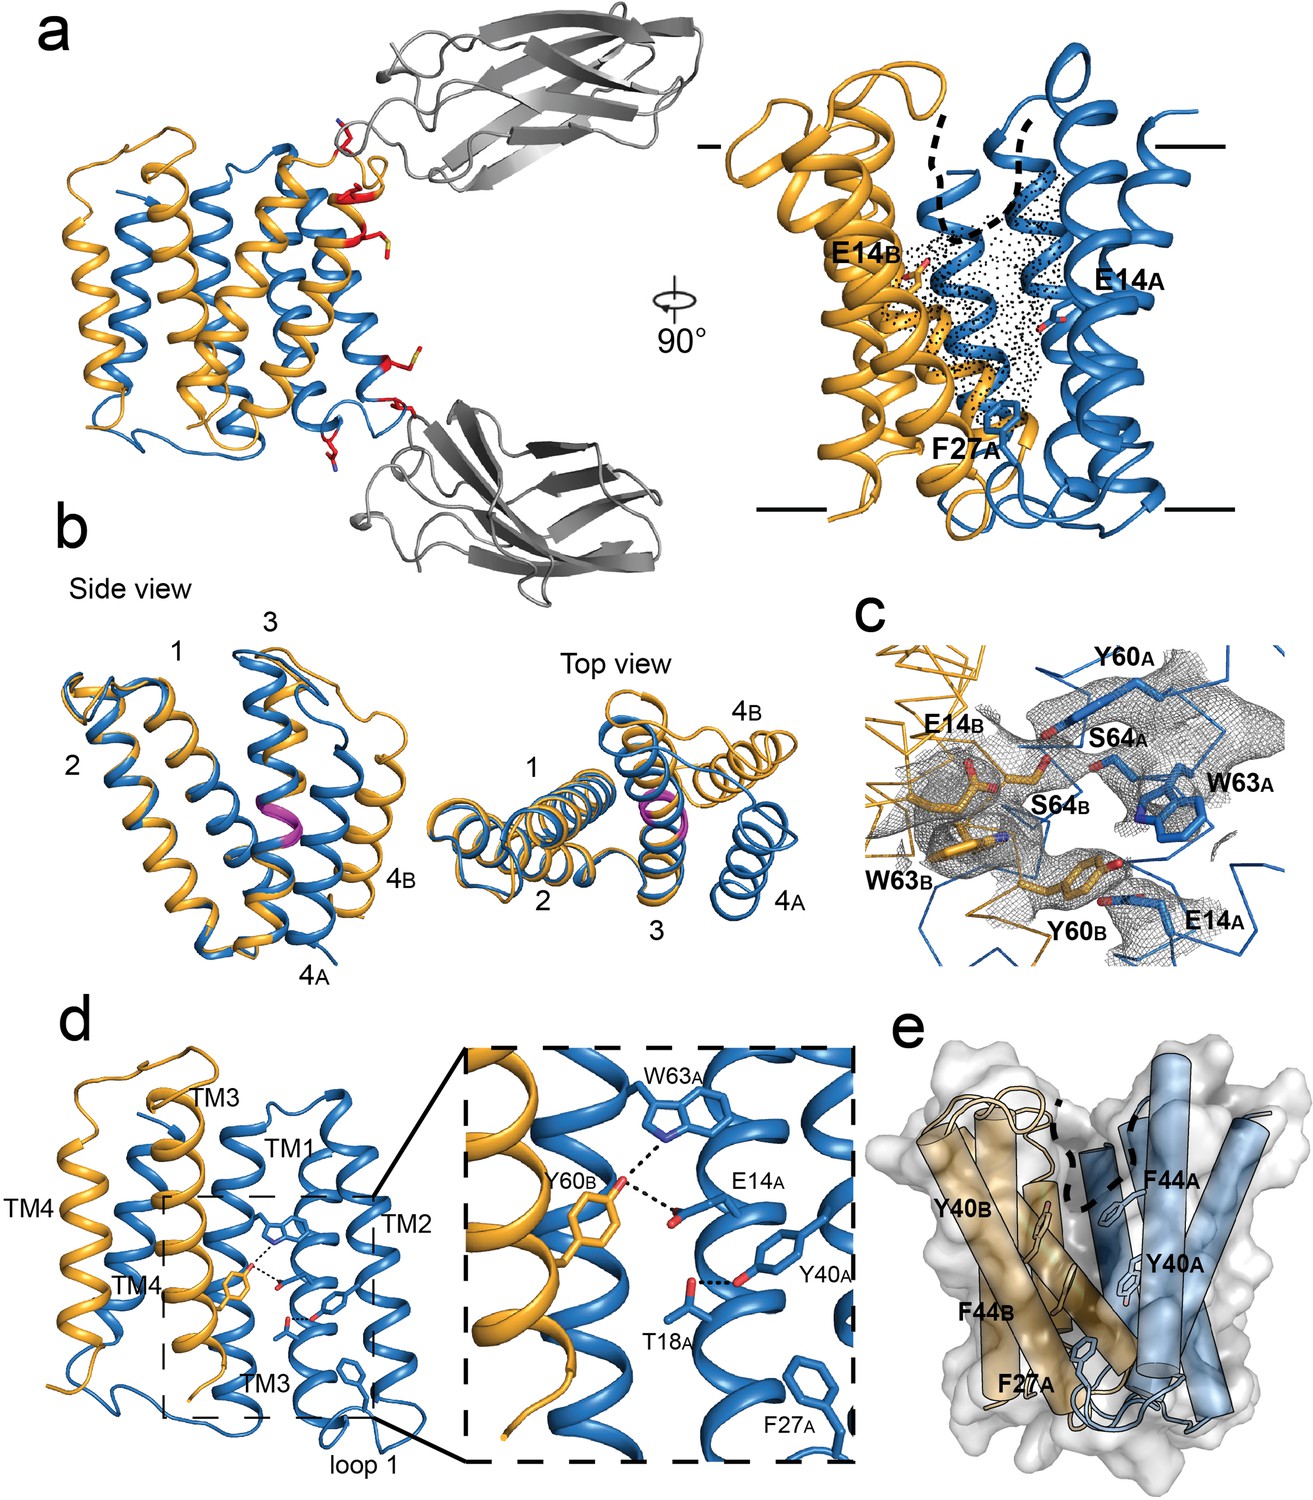
Crystal structure of EmrE3.
(A) Subunits A and B are shown in blue and orange, respectively, and monobody L10 is shown in gray. In the left panel, mutated residues E25N, W31I, V34M are shown in red with sidechain sticks. In the right panel, the monobodies are removed for clarity. E14A, E14B, and F27A are shown as sticks, and the aqueous accessible region of the transporter is indicated with dots. Approximate membrane boundaries are shown as solid lines, and the boundary of the membrane portal is shown as a dashed line. (B) A (blue) and B (orange) subunits of EmrE3, aligned over residues 1–63. The GVG fulcrum sequence in TM3 is colored in magenta. (C) S64 and surrounding sidechains with 2Fo-Fc density shown as gray mesh (contoured at 1.0 σ within 2 Å of selected residues). (D) Y60B hydrogen bonding network. EmrE dimers are shown with TM1 and TM2 of subunit B (orange) removed for clarity. Lower panels show zoomed in view. In each view, interactions within hydrogen bonding distance and geometry are shown as dashed lines. E. Surface rendering of EmrE3. TM2 sidechains that line the portal are shown as sticks.
Figure 2—figure supplement 1
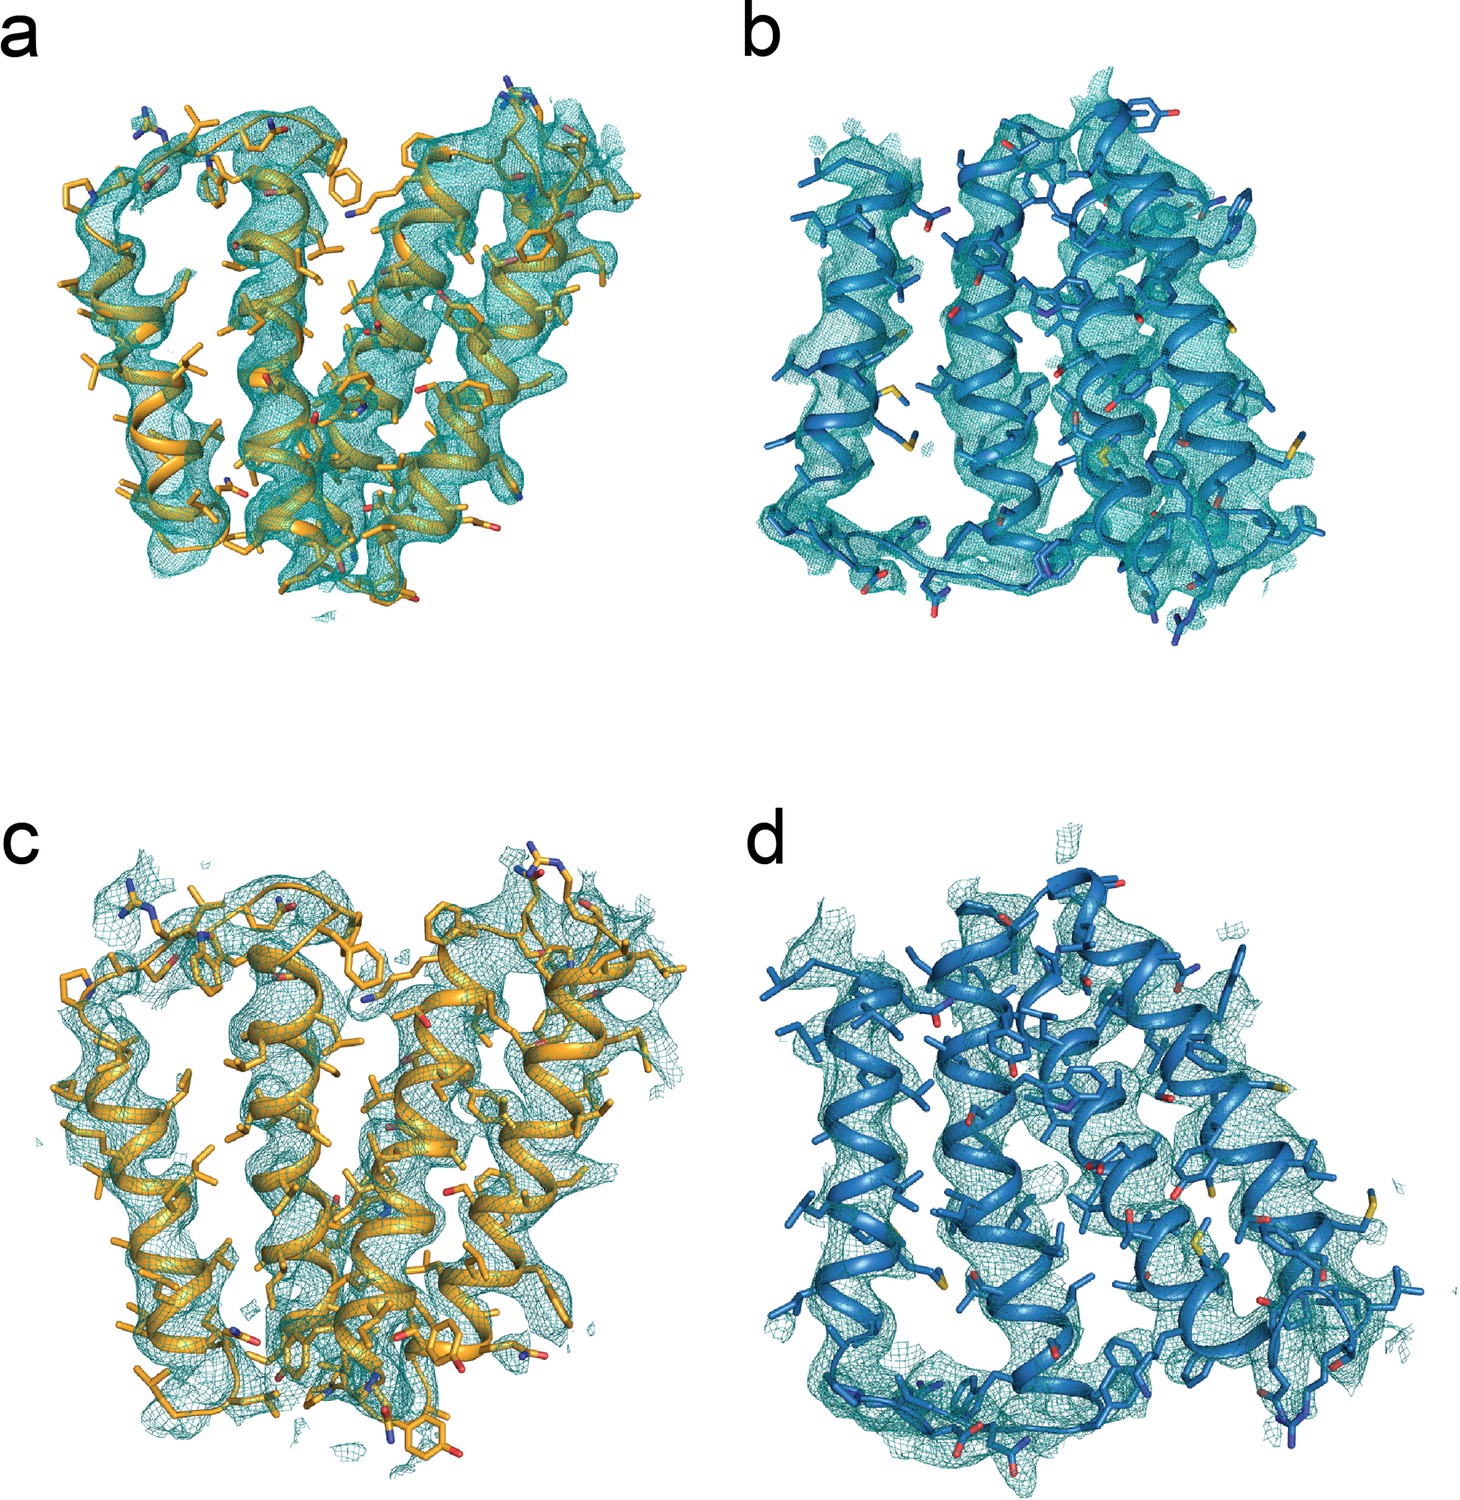
EmrE3 maps.
Subunits colored as in main text, with subunit B in orange, and subunit A in blue. Panels A and B: 2Fo-Fc maps for EmrE3, contoured at 1.2σ. Panels C and D: 2Fo-Fc composite omit maps for EmrE3, contoured at 1.0σ, prepared by omitting 5% of the atoms in the model at a time.
Figure 2—figure supplement 2
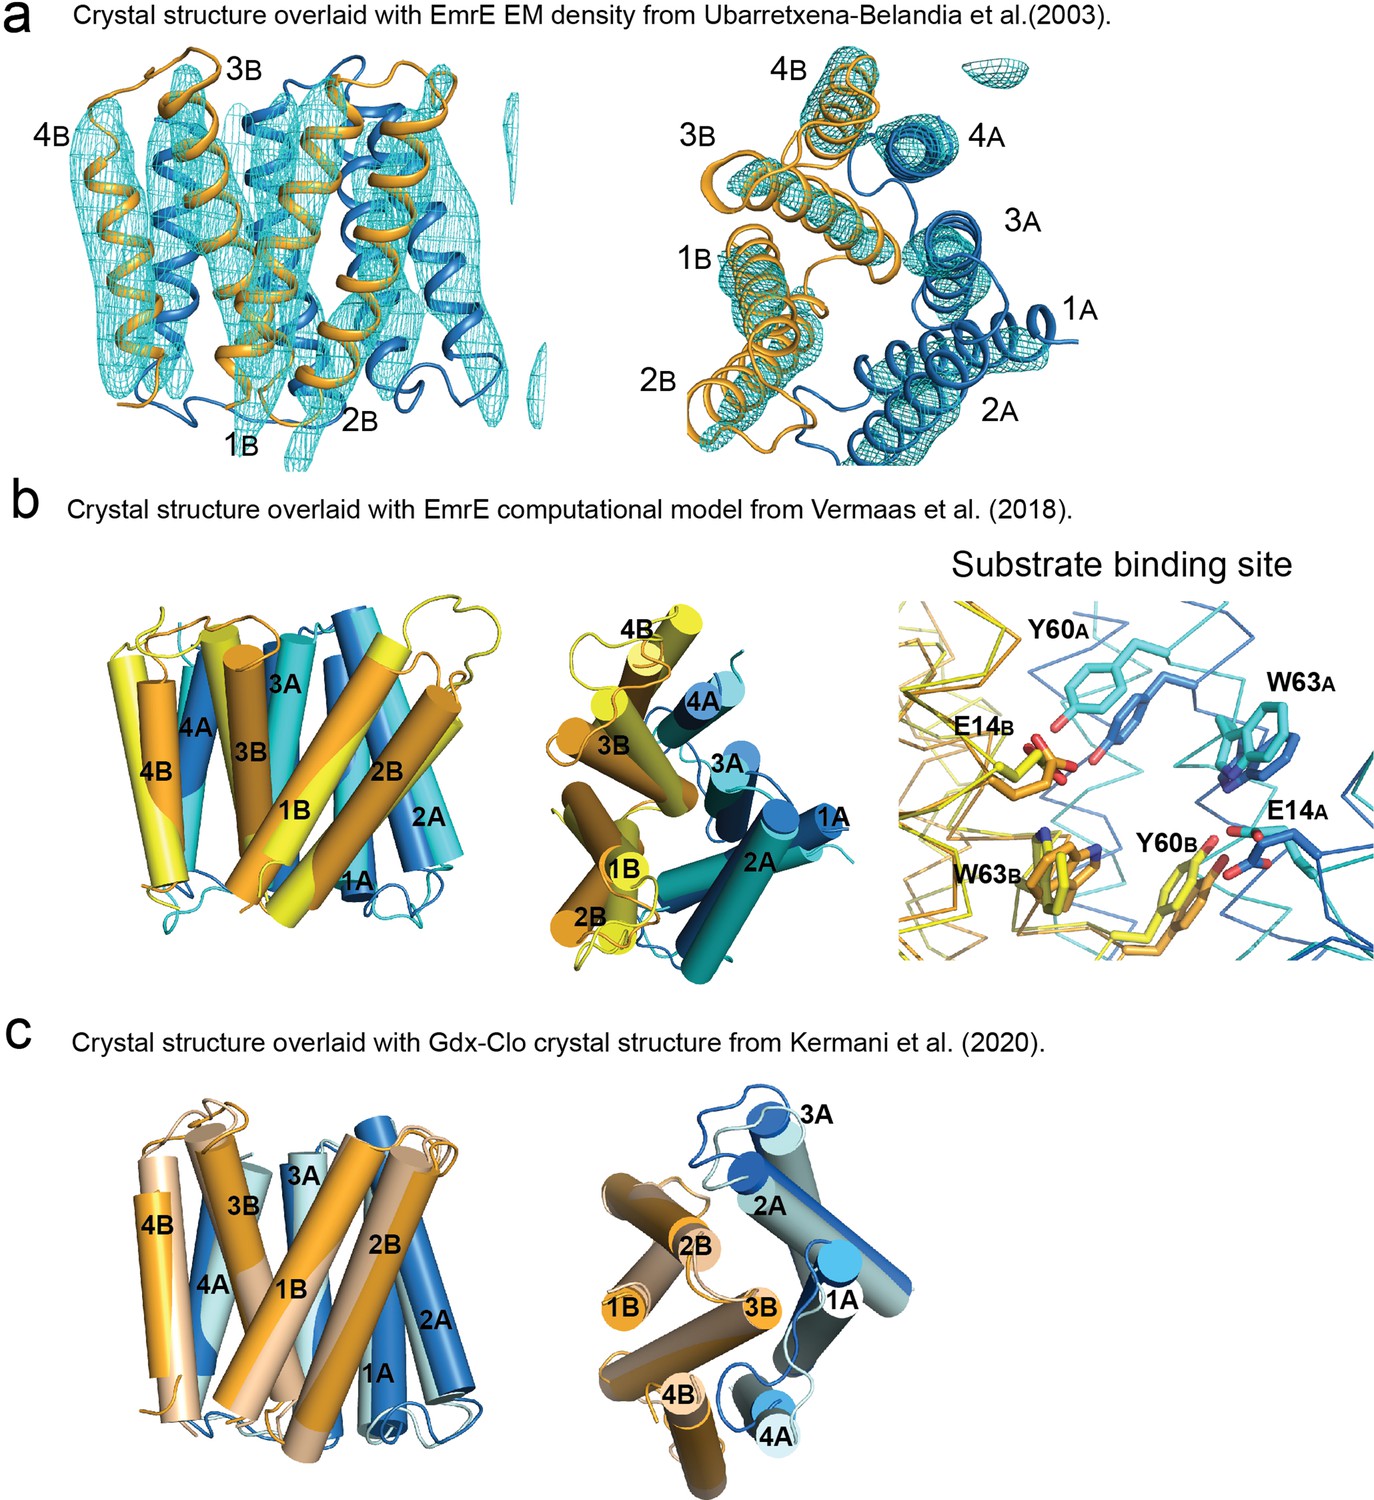
Structural comparison of EmrE3 crystal structure with electron microscopy maps, theoretical model, and Gdx-Clo.
(A) Crystal structure of EmrE3 (orange and blue cartoon) overlaid with experimental electron microscopy (EM) density (cyan mesh contoured at 1.5σ) (Ubarretxena-Belandia et al., 2003). (B) Crystal structure of EmrE3 (orange and blue) compared to a computational model (yellow and cyan) constrained by EM data (Vermaas et al., 2018 ). (C) Crystal structure of EmrE3 (orange and blue) compared to crystal structure of a homologue from the SMR family, Gdx-Clo (wheat and pale cyan) (Kermani et al., 2020). Models are aligned along the B subunit.
Figure 2—figure supplement 3
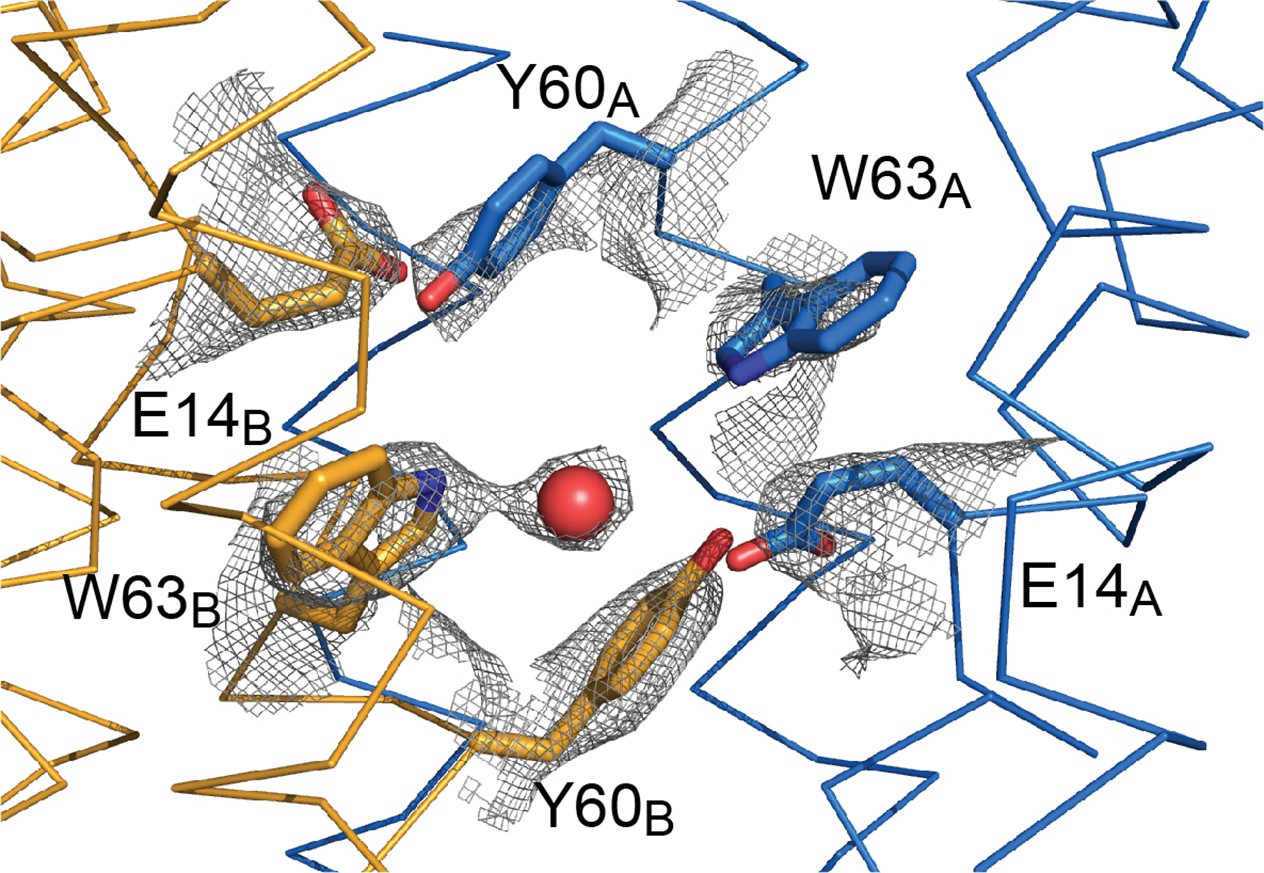
Sidechain density in the EmrE3 binding site.
2Fo-Fc map around selected residues is contoured at 1.5 σ. The red sphere represents a water molecule.
Figure 3 with 3 supplements
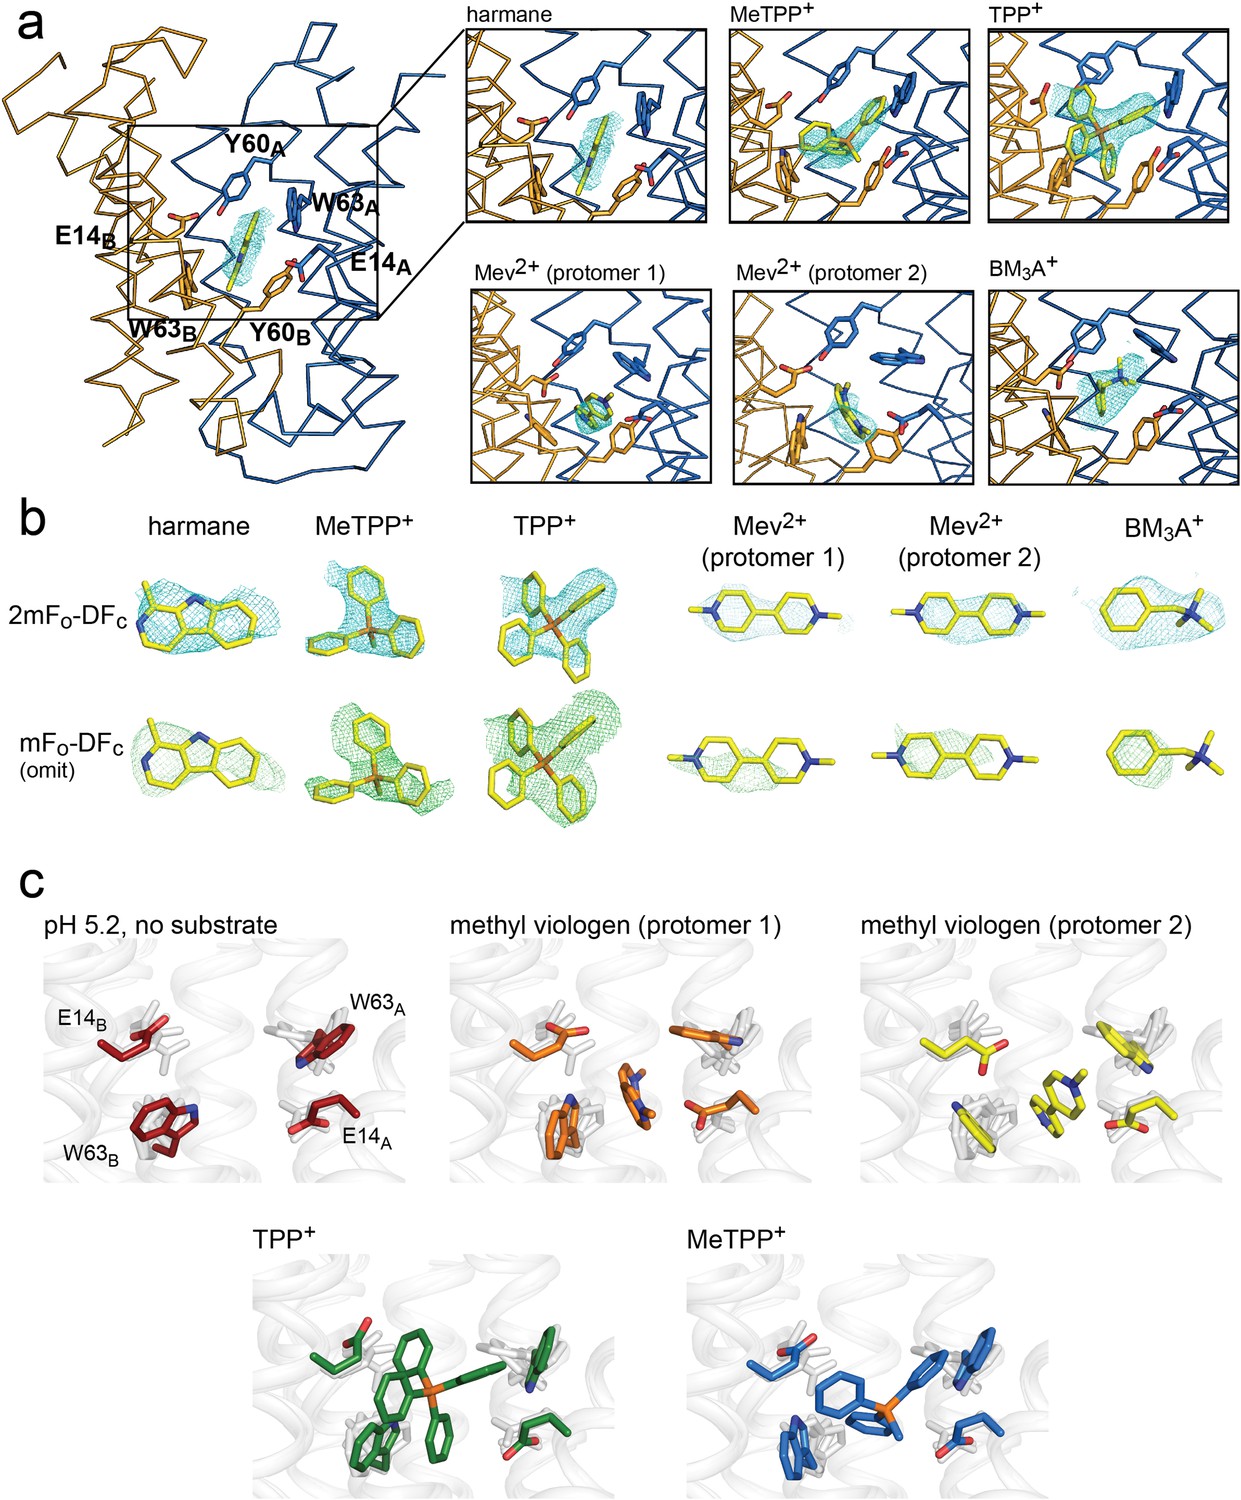
Substrate binding to EmrE3.
(A) Structures are shown in ribbon representation, with sidechains E14, W63, and Y60 shown as sticks. All panels are zoomed and oriented the same. 2mFo-DFc maps (carved 2 Å around each substrate) are shown as cyan mesh. Maps are contoured at 1σ for harmane and 1.2σ for MeTPP+, TPP+, methylviologen, and benzyltrimethylammonium (BM3A+). (B) Top row: Substrate structures and 2mFo-DFc maps from the panels in A, individually rotated to view each substrate. Bottom row: mFo-DFc substrate omit maps shown as green mesh. Omit maps are contoured at 1.8σ for harmane and 2σ for MeTPP+, TPP+, methylviologen, and BM3A+. (C) Comparison of E14 and W63 positions in each substrate-bound structure. Individual panels show substrate, E14, and W63 from indicated structure in color aligned with the other four structures, which are rendered in light gray.
Figure 3—figure supplement 1
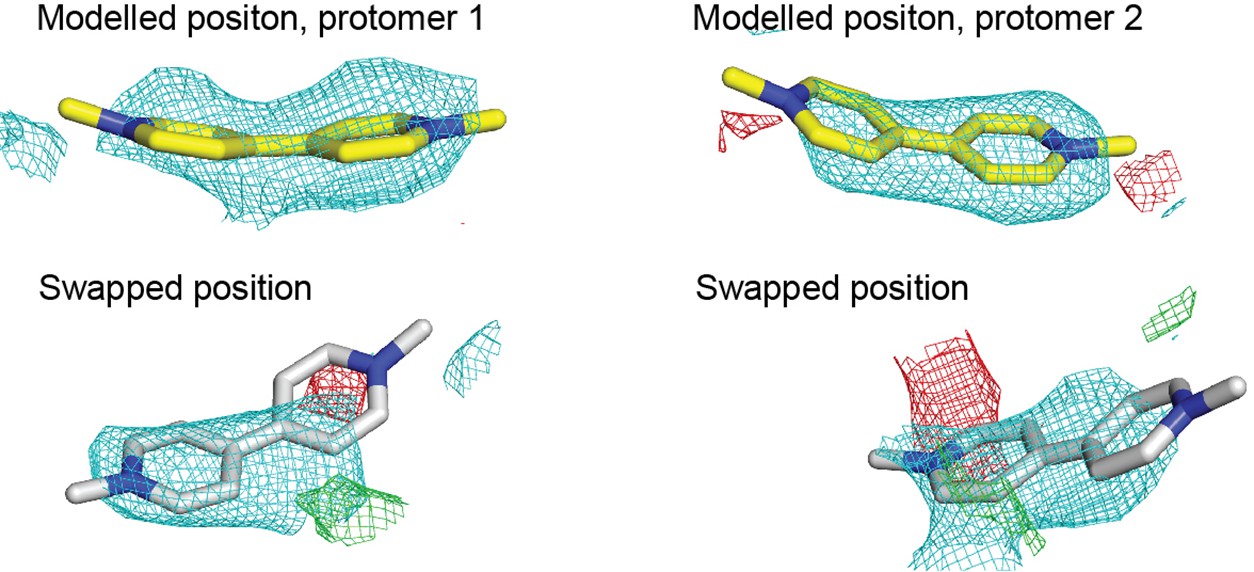
Electron density maps of methyl viologen in different EmrE3 protomers in the asymmetric unit.
Yellow stick representations (top panels) show the modeled position of methyl viologen in each protomer, with the final refined maps shown as mesh. White stick representations show the methyl viologen position swapped between the two protomers. Maps show a subsequent re-refinement with the substrates in the swapped positions. For all panels, 2Fo-Fc density (cyan) contoured at 1.2σ and Fo-Fc density (green or red) contoured at 2.5 σ.
Figure 3—figure supplement 2
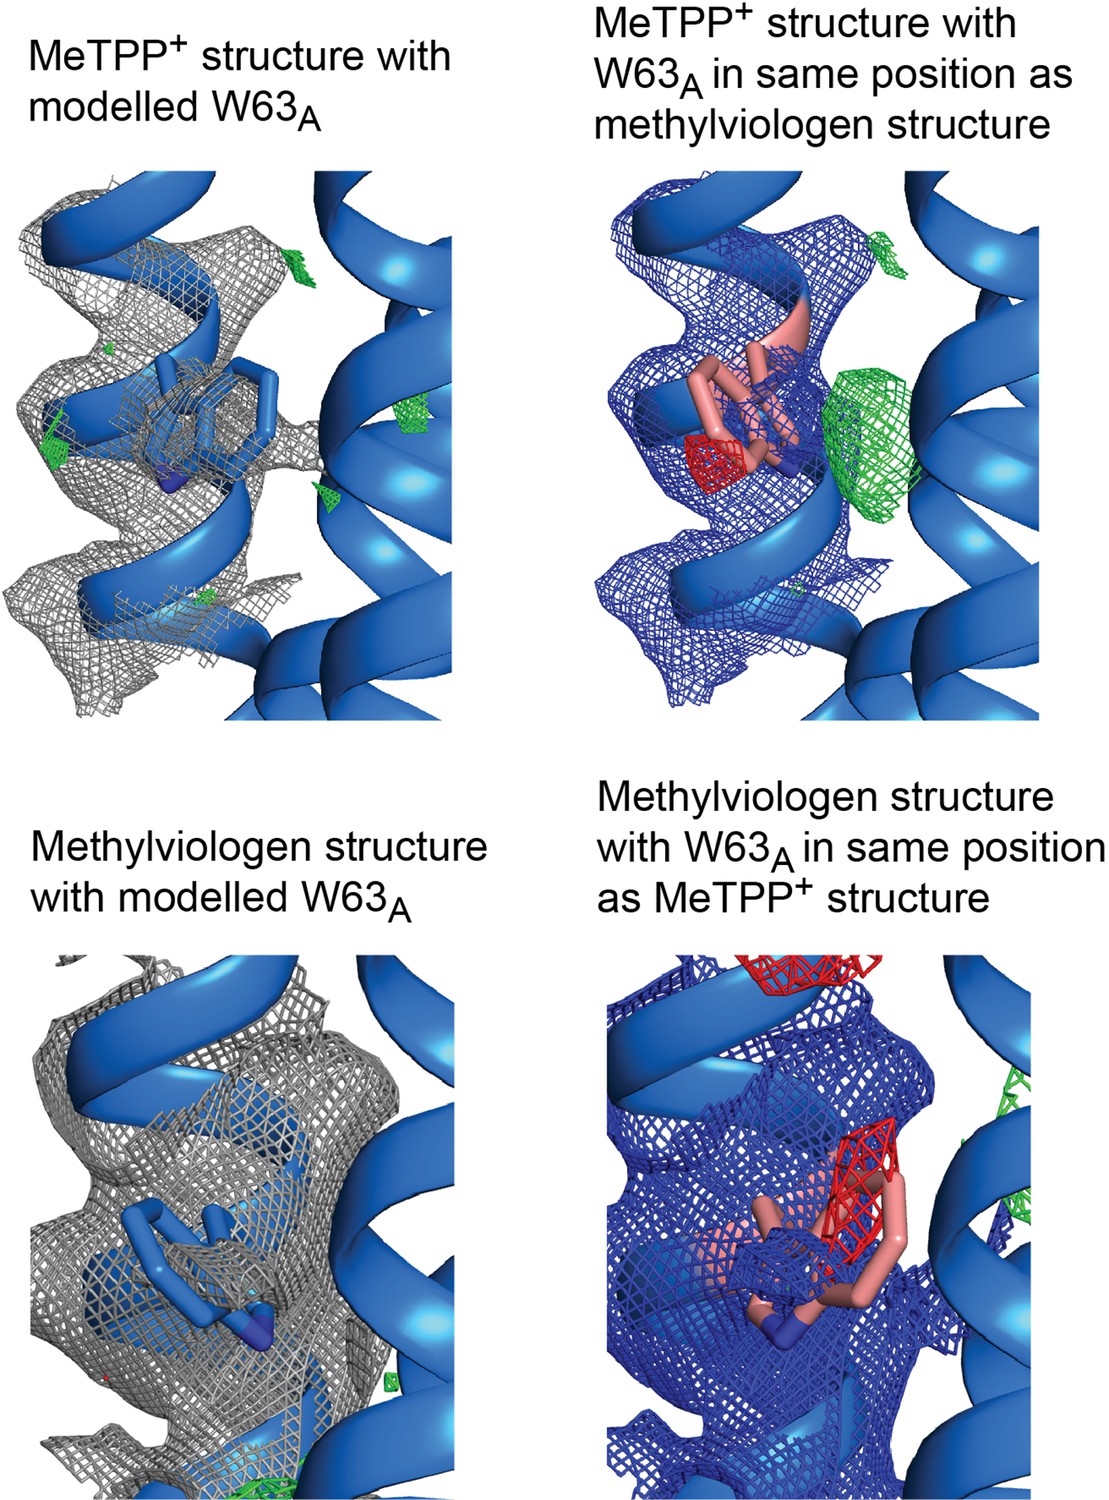
Electron density maps for W63A modeled in different positions.
Top panels: 2Fo-Fc density contoured at 1.8σ and Fo-Fc density contoured at 3 σ. Bottom panels: 2Fo-Fc density contoured at 1.2 σ and Fo-Fc density contoured at 2.5 σ.
Figure 3—figure supplement 3
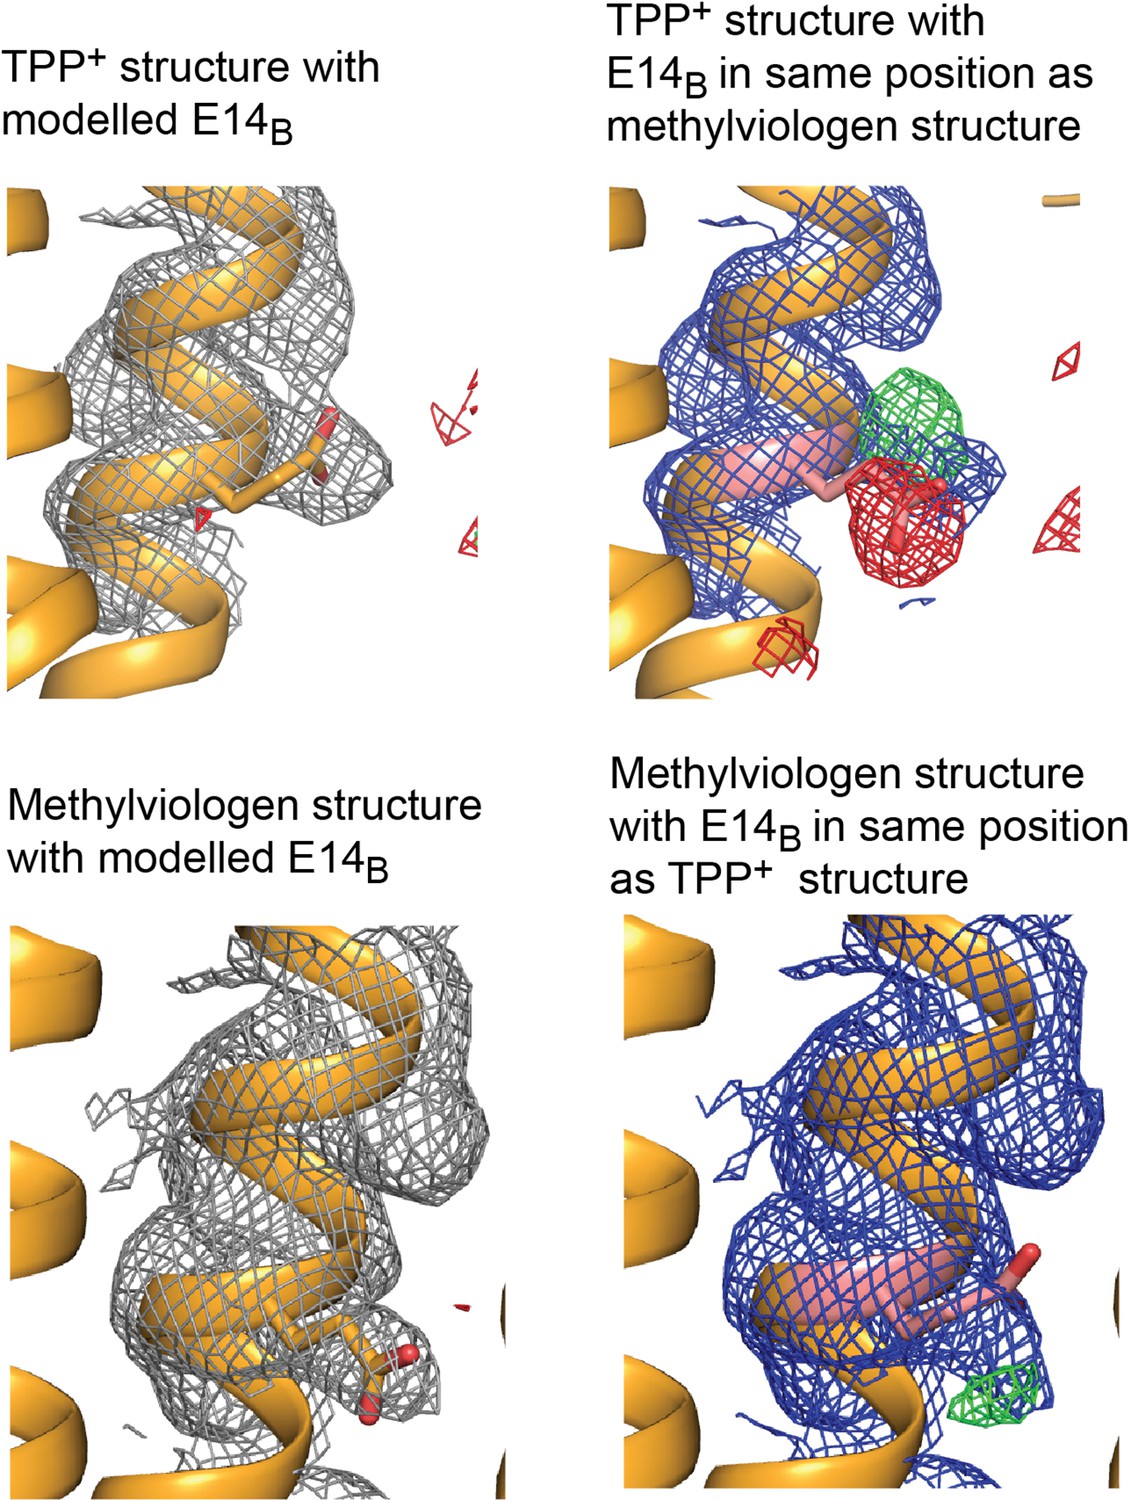
Electron density maps for E14B modeled in different positions.
Top panels: 2Fo-Fc density contoured at 1.8σ and Fo-Fc density contoured at 3 σ. Bottom panels: 2Fo-Fc density contoured at 1.2 σ and Fo-Fc density contoured at 2.5 σ.
Figure 4 with 2 supplements
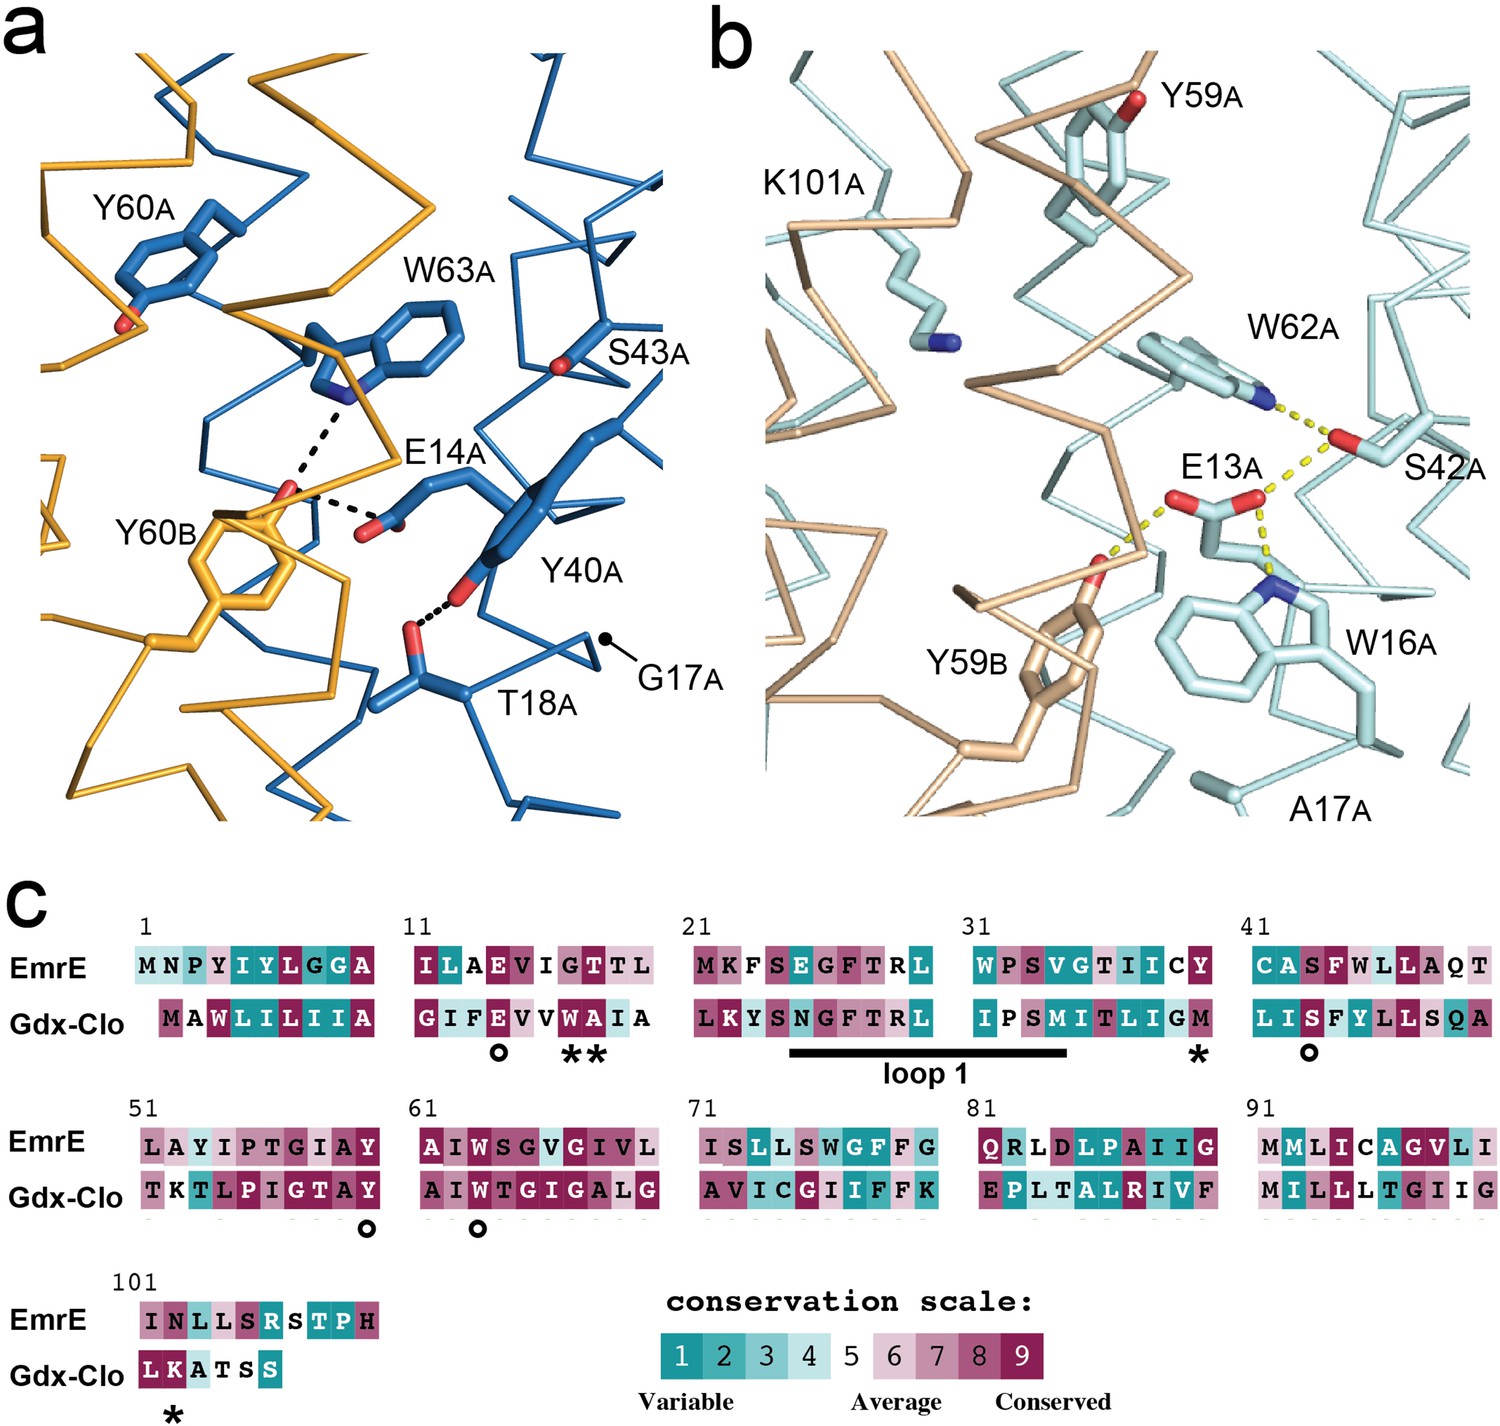
Structure and sequence conservation of substrate binding site residues in Qac and Gdx subtypes.
(A) Substrate-binding site in EmrE, with subunit B in orange and subunit A in blue. (B) Substrate-binding site in Gdx-Clo, with subunit B in wheat and subunit A in pale cyan (PDB: 6WK8). For panels A and B, the proteins are shown in the same orientation. Note that residue numbering is offset by one in Gdx-Clo. Potential hydrogen bonds are shown as dashed lines. (C) Amino acid conservation analysis for the Qac and Gdx subtypes overlaid on exemplar sequences of EmrE and Gdx-Clo, respectively. Analysis was performed using ConSurf (Ashkenazy et al., 2016; Berezin et al., 2004). Residues that contribute to the binding pocket and that are conserved between the Qac and Gdx subtypes are indicated with an astericks. Residues that contribute to the binding pocket and that differ between the Qac and Gdx subtypes are indicated with a circle. The monobody binding loop 1 is indicated by the sold line. Alignments of representative sequences are shown in Figure 4—figure supplement 2.
Figure 4—figure supplement 1
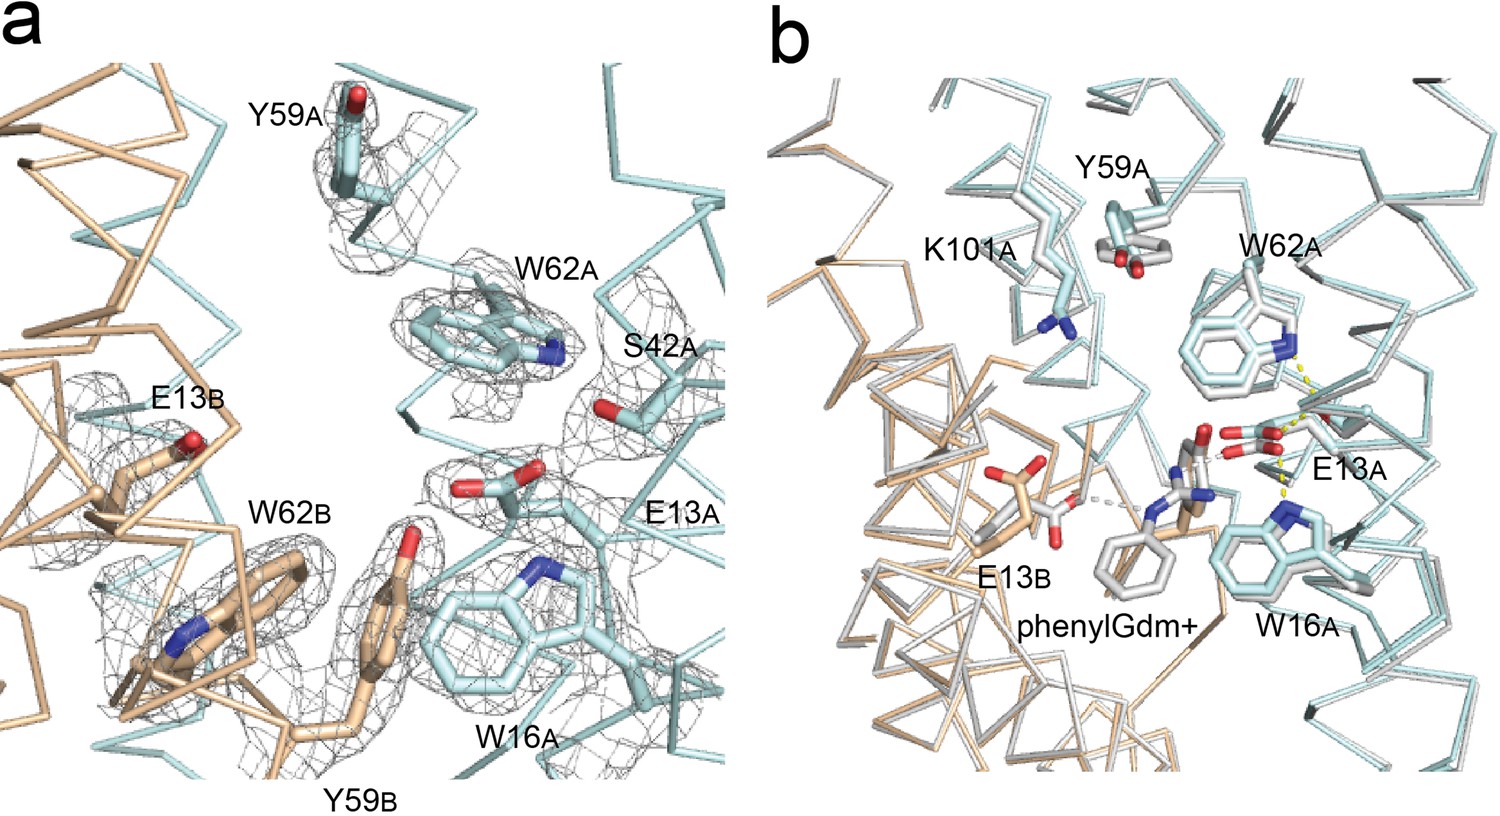
Gdx-Clo and EmrE substrate binding sites.
(A) 2Fo-Fc map shown around selected residues in the Gdx-Clo substrate binding site (pH 5.2) contoured at 1.5 σ. (B) Alignment of Gdx-Clo structures. The present pH 5.2 structure is shown in wheat and cyan with putative H-bond interactions shown as yellow dashed lines. The structure with phenylGdm+ bound is shown in light gray with putative H-bonds between the substrate and the E13 residues shown as gray dashed lines.
Figure 4—figure supplement 2
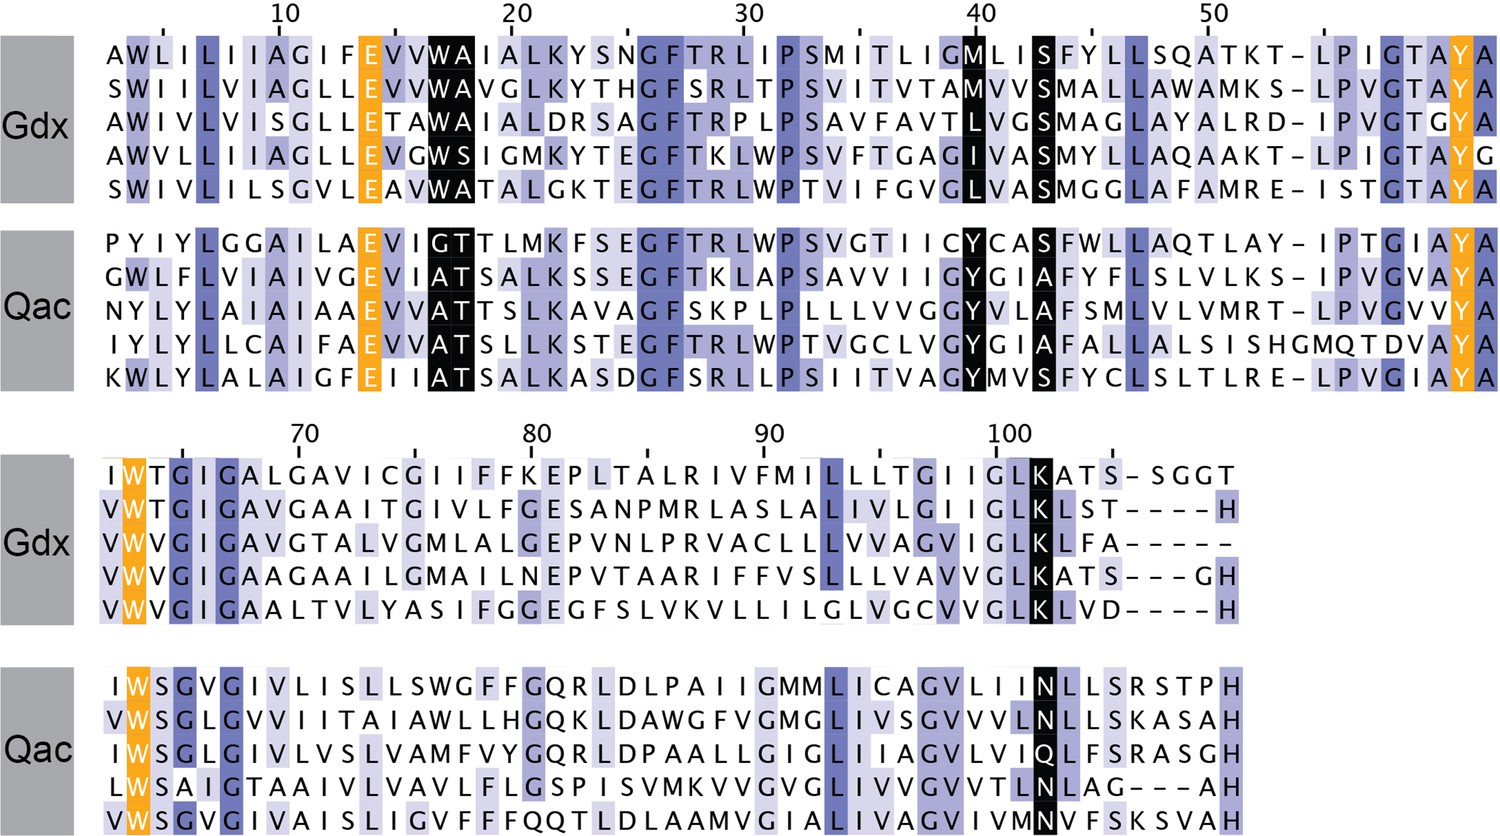
Sequence alignments of five representative Gdx proteins (from top to bottom: Clostridiales bacterium oral taxon 876, E. coli, Micromonospora, Streptomyces tsukubensis, and Leifsonia aquatica) and five representative Qac proteins (from top to bottom: E. coli, Klebsiella pneumoniae, Pseudomonas aeruginosa, Mycobacterium bovis, and Bordetella avium).
Sequence numbering corresponds to EmrE. Sequences are colored according to sequence conservation (shades of blue). Residues that contribute to the binding pocket and that are conserved between the Qac and Gdx subtypes are highlighted in orange. Residues that contribute to the binding pocket and that differ in the Qac and Gdx subtypes are highlighted in black.
Figure 5
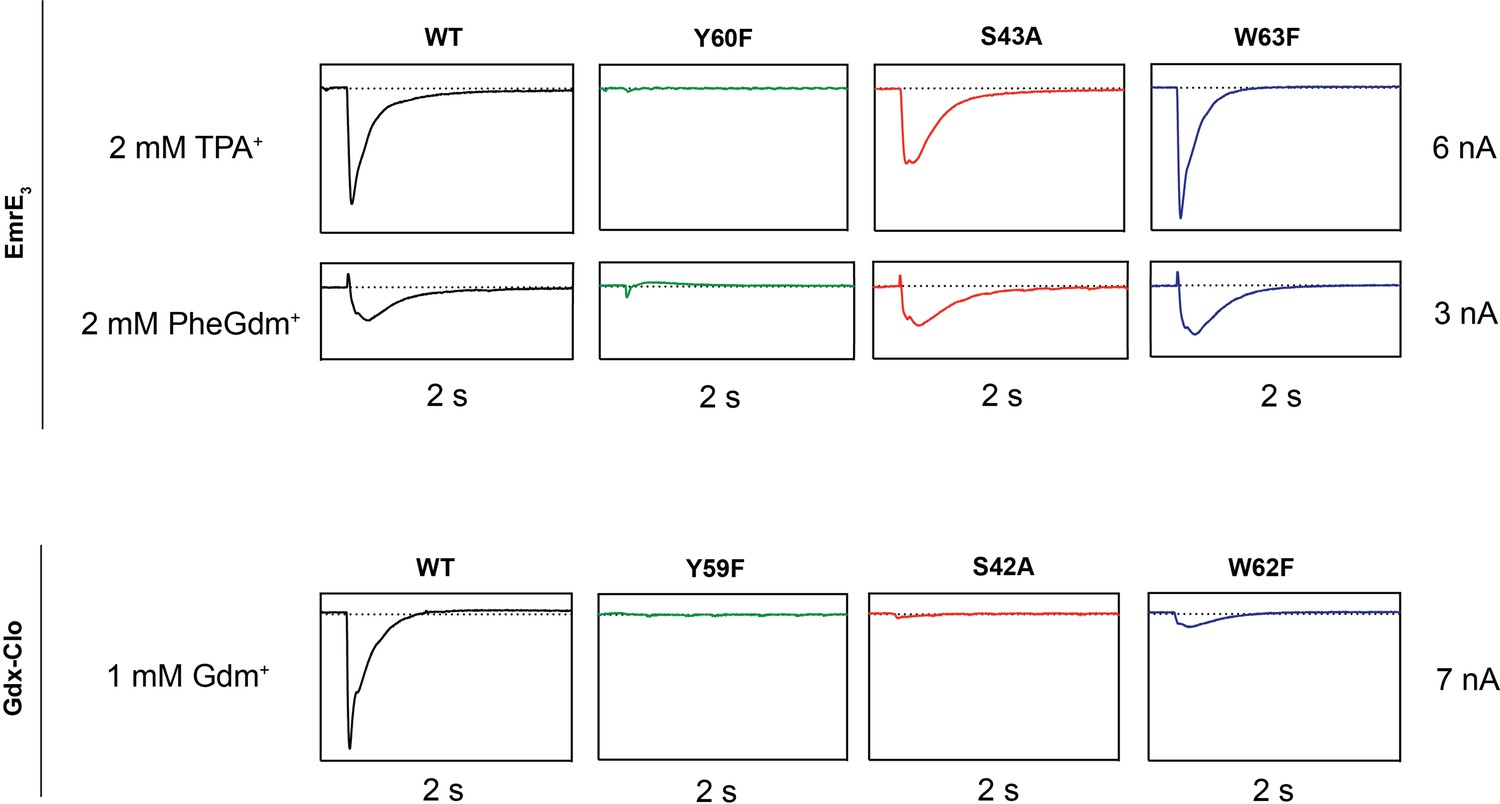
Representative SSM electrophysiology recordings for EmrE3 and Gdx-Clo mutants.
For EmrE3, PheGdm+ and TPA+ traces are from the same sensor and shown on the same scale. Vertical box edges are 3 nA for PheGdm+ traces, and 6 nA for TPA+ traces. For Gdx-Clo, vertical box edges are 7 nA. Horizontal box edges are 2 s for all traces. Dashed line represents the zero-current level. Traces are representative of currents from three independently prepared sensors and two independent biochemical preparations. Peak current values for all replicates are reported in Table 2. Note that because there is some sensor-to-sensor variation in liposome fusion, comparisons of current amplitude among the mutants are qualitative.
-
Figure 5—source data 1
SSM electrophysiology traces for EmrE3 mutants and Gdx-Clo mutants.
- https://cdn.elifesciences.org/articles/76766/elife-76766-fig5-data1-v2.xlsx
Figure 6 with 2 supplements
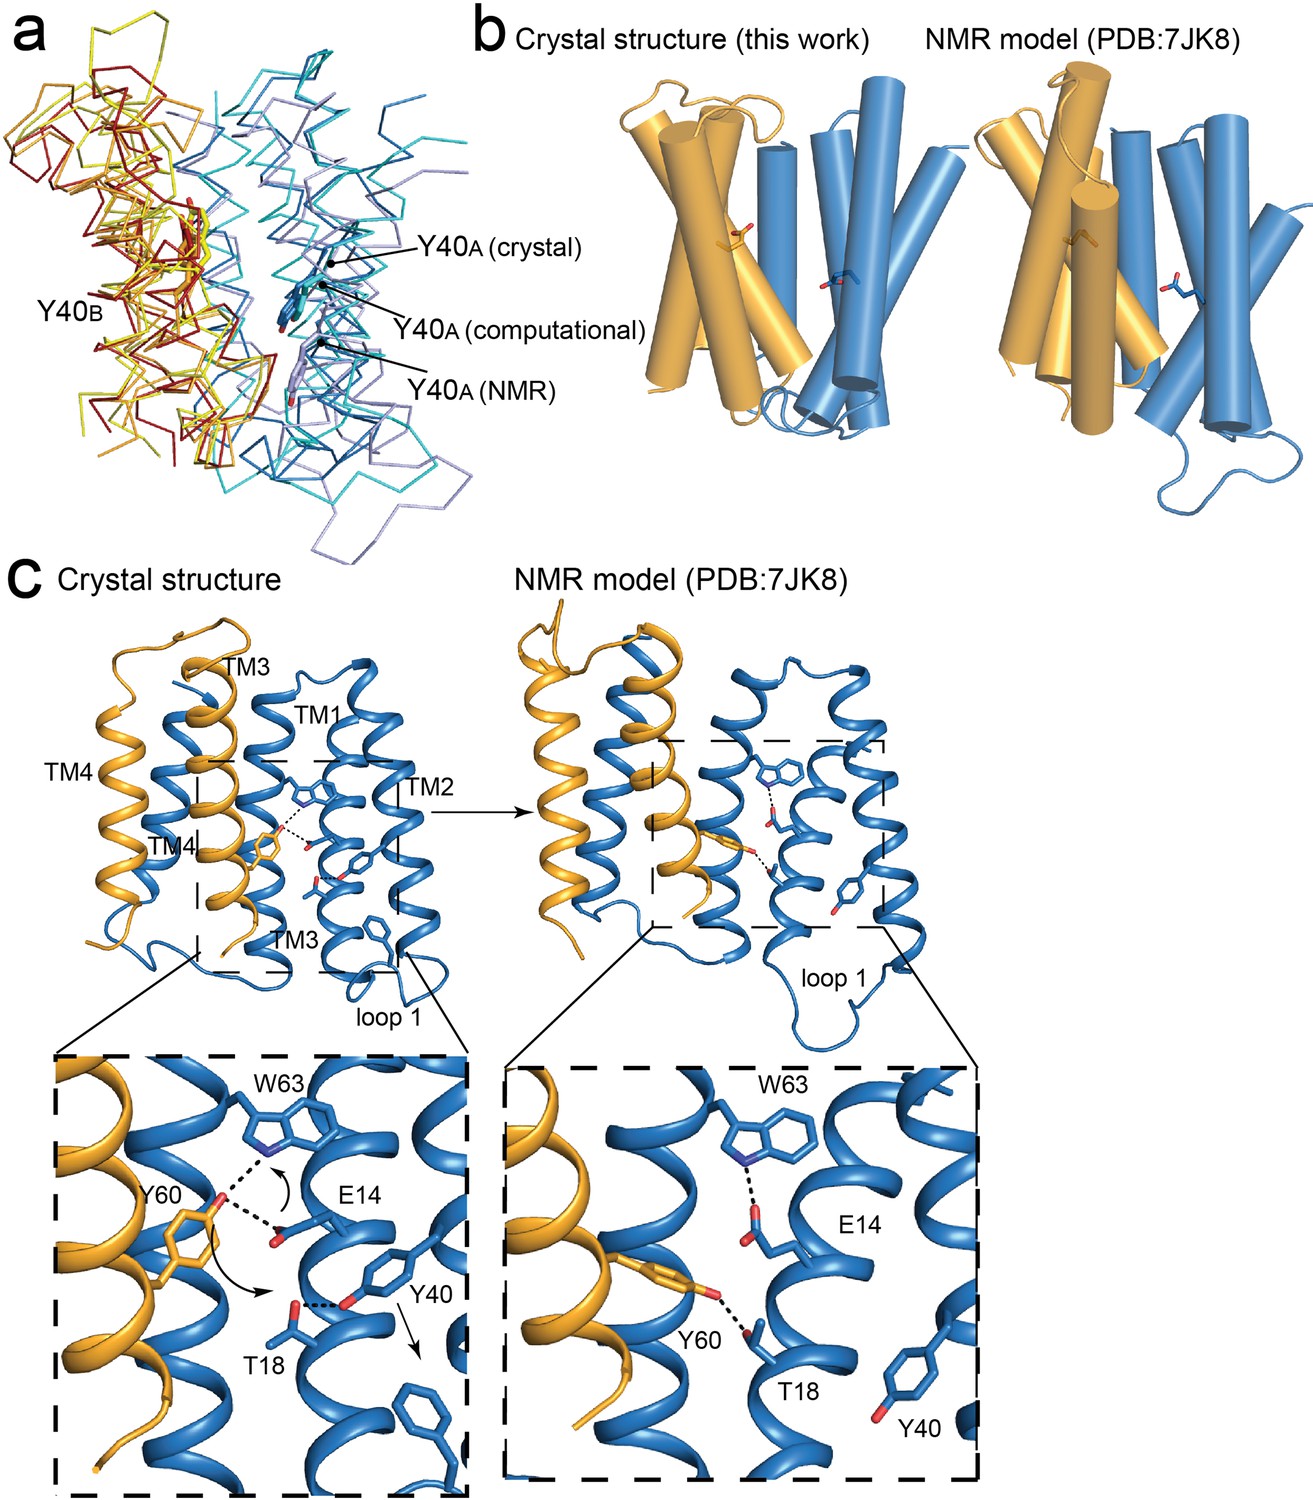
Comparisons of NMR and crystallography models of EmrE.
(A) Overlay of crystallography (orange/blue), computational (yellow/cyan; Vermaas et al., 2018) and NMR (dark red/pale blue; Shcherbakov et al., 2021) models, aligned over the B subunit. Y40 sidechain sticks are show as landmarks. (B) Side-by-side comparisons of the crystallography and NMR models, with A subunit in blue and B subunit in orange. E14 sidechains shown as landmarks. (C) Comparison of Y60B hydrogen bonding network in the crystal structure (left) and NMR structure (right). EmrE dimers are shown with TM 1 and 2 of subunit B (orange) removed for clarity. Lower panels show zoomed in view. In each view, interactions within hydrogen bonding distance and geometry are shown as dashed lines. Arrows are shown to help visualize sidechain rearrangements between the two structures.
Figure 6—figure supplement 1
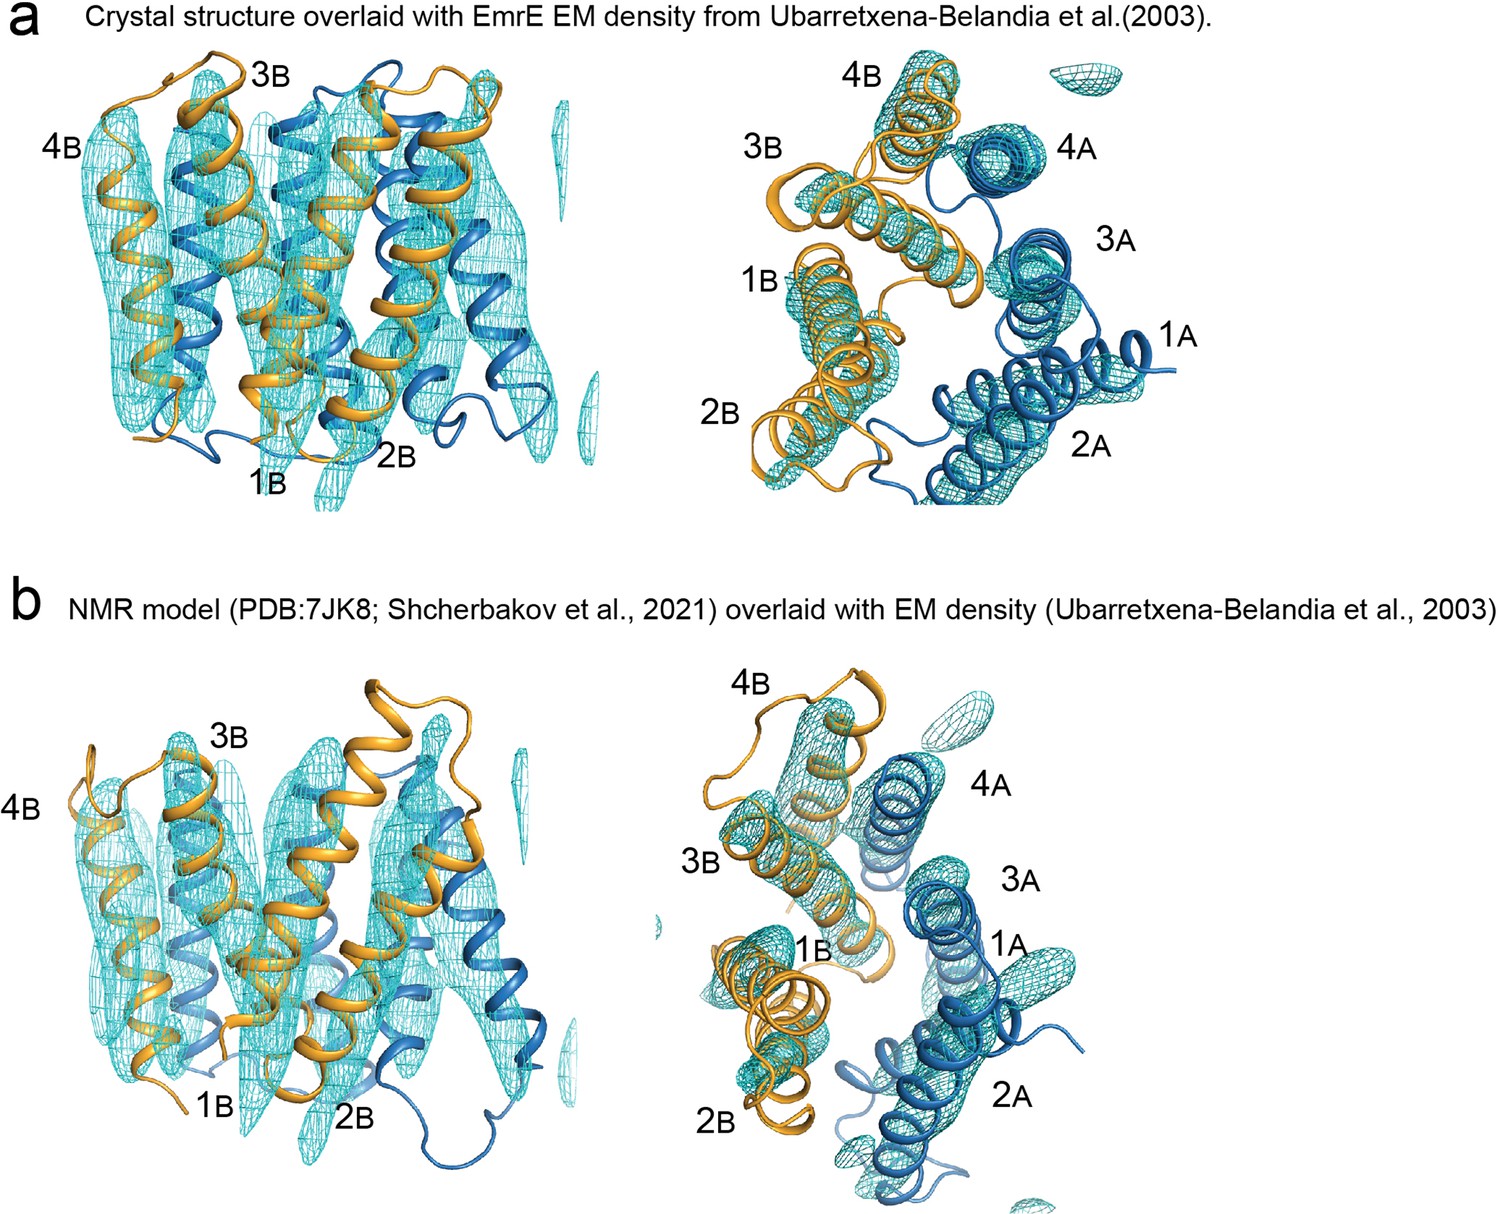
Comparison of EmrE models with electron microscopy density.
(A) Crystal structure of EmrE3 (orange and blue cartoon) overlaid with experimental electron microscopy density (cyan mesh contoured at 1.5σ) (Ubarretxena-Belandia et al., 2003). (Panel repeated from Figure 2—figure supplement 2 to aid visual comparison). (B) NMR model of EmrE S64V (orange and blue cartoon) (Shcherbakov et al., 2021) overlaid with experimental electron microscopy density shown in panel A (cyan mesh contoured at 1.5σ) (Ubarretxena-Belandia et al., 2003).
Figure 6—figure supplement 2
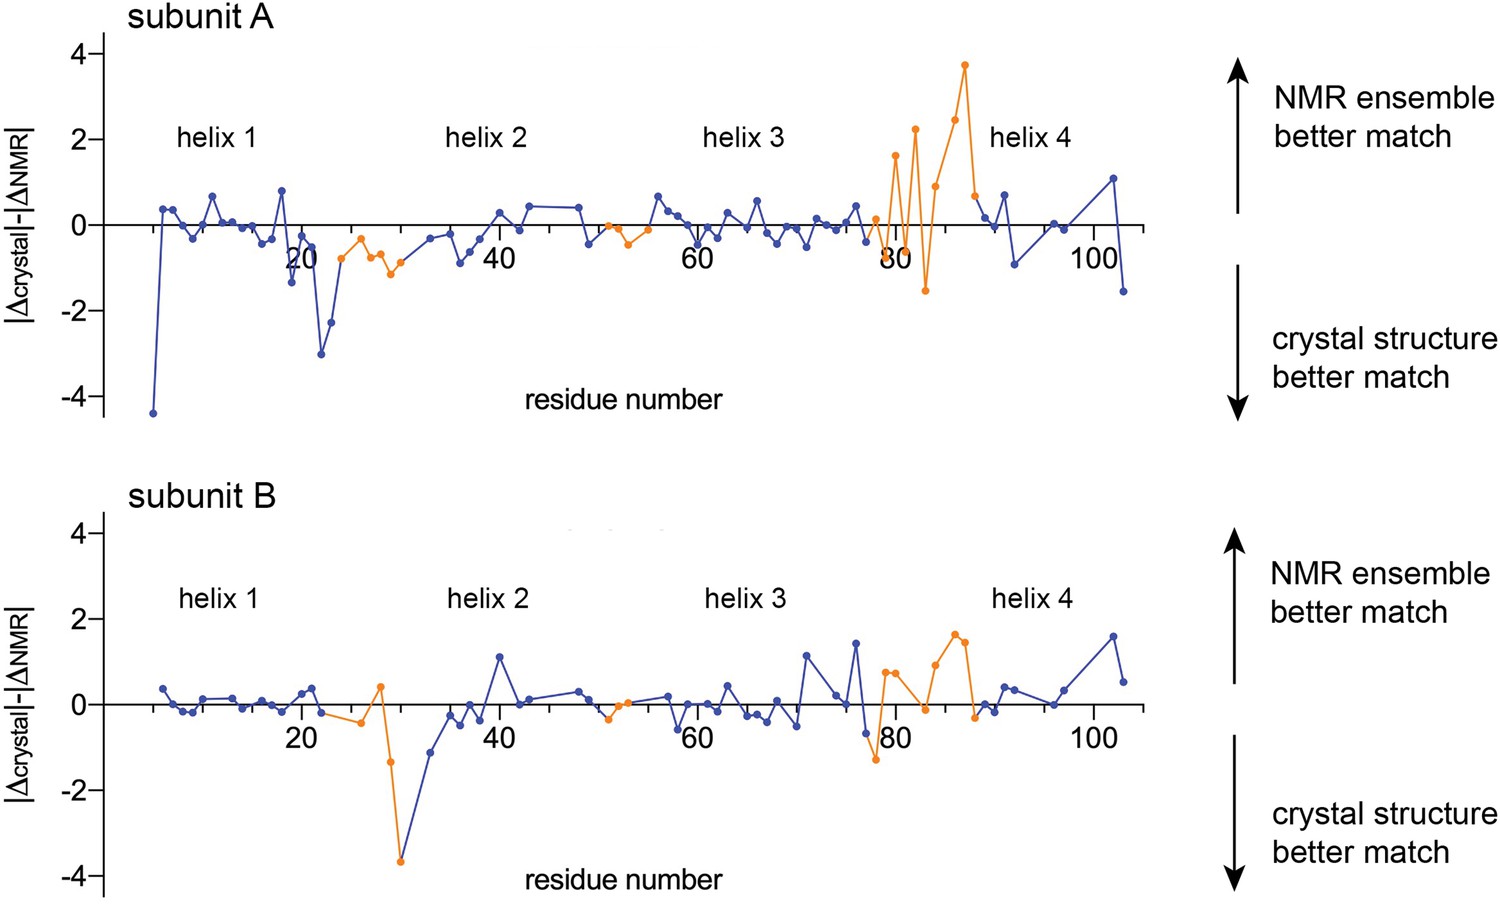
Comparison of experimental chemical shifts for EmrE (BMRB accession number 50411) with chemical shifts predicted from the crystallography model and NMR ensemble using LARMORCα (Frank et al., 2015).
Residue number is plotted along the x-axis. The y-axis compares the relative difference between the experimental chemical shifts and the predicted chemical shifts for the crystallography and NMR models. For each Cα position, the difference between the predicted and experimental chemical shifts was calculated (δpredicted, NMR model-δexperimental = ΔNMR and δpredicted, crystallography model-δexperimental = Δcrystal), and their relative magnitude compared (|Δcrystal|-|ΔNMR|). Values above the origin line indicate that the experimental chemical shifts are in better agreement with the predicted chemical shifts for the NMR model; values below the origin line indicate that the experimental chemical shifts are in better agreement with the predicted chemical shifts for the crystallography model. Residues in TM helices are shown as blue points, and residues in loop regions are shown as orange points. Residues that were not assigned in the NMR dataset, or that are mutated in either the NMR or crystal structures (E25, W31, V34, S64) are absent from this plot.
-
Figure 6—figure supplement 2—source data 1
Chemical shift predictions for NMR model and crystallography model and NMR ensemble using LARMORCα.
- https://cdn.elifesciences.org/articles/76766/elife-76766-fig6-figsupp2-data1-v2.xlsx
Figure 7 with 1 supplement
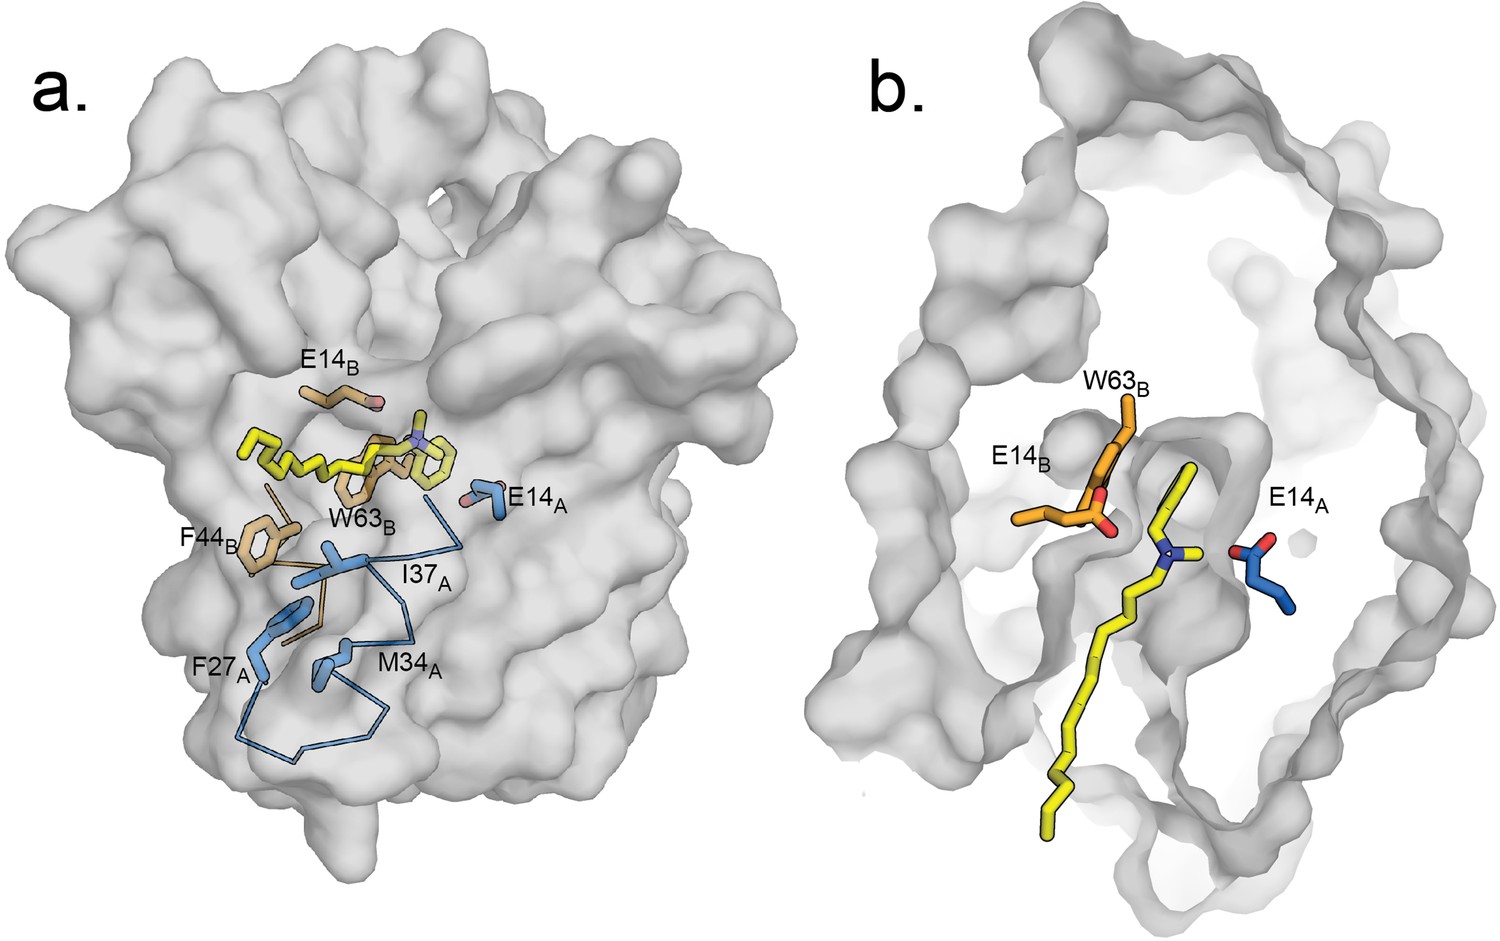
Hypothetical model of benzalkonium binding to EmrE.
(A) Benzalkonium is shown in yellow stick representation. Sidechains from the A and B subunits are colored as before. The mainchain for helices lining the TM2 portal is shown in ribbon format, with the portal-lining sidechains shown as sticks. (B) Top-down view of binding site with benzalkonium. EmrE is sliced at the midpoint of the membrane. Comparisons of this model to the experimental models of EmrE in complex with benzyltrimethylammonium (PDB:7T00) and Gdx-Clo in complex with octylguanidinium (PDB:6WK9) are shown in Figure 7—figure supplement 1.
Figure 7—figure supplement 1
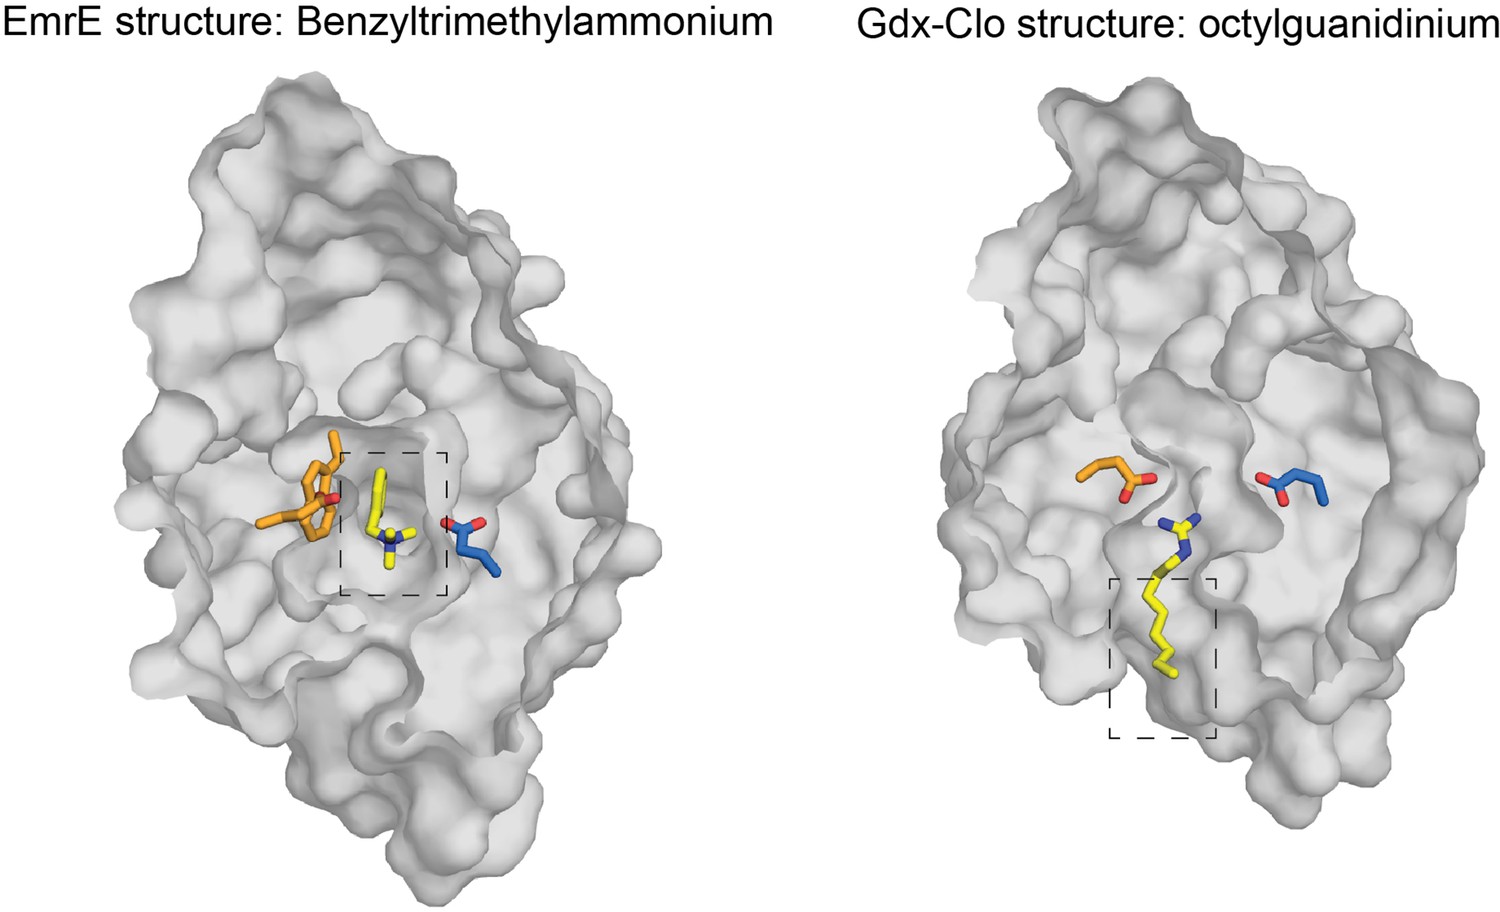
Top down structures of EmrE in complex with benzyltrimethylammonium (PDB:7T00; model for benzalkonium headgroup binding) and Gdx-Clo in complex with octylguanidinium (PDB:6WK9; model for alkyl tail positioning).
Structures are sliced at the midpoint of the membrane, as in Figure 7. Dashed boxes indicate the headgroup and alkyl group positions used to prepare the hypothetical model of benzalkonium binding.
Tables
Table 1
Data collection, phasing, and refinement statistics for EmrE and Gdx-Clo complexes.
| EmrE3/L10/MeTPP+ | EmrE3/L10/TPP+ | EmrE3/L10/harmane | EmrE3/L10/methyl viologen | EmrE3/L10, pH 5.2 | Gdx-Clo/L10, pH 5.0 | EmrE3/L10/BM3A+ | |
|---|---|---|---|---|---|---|---|
| Crystallization conditions | 0.1 M LiNO3, 0.1 M ADA pH 6.5, 32.8% PEG 600 | 0.1 M (NH4)2SO4, 0.1 M HEPES pH 7.25, 30.8% PEG 600 | 0.1 M (NH4)2SO4, 0.1 M HEPES pH 7.1, 33.8% PEG 600 | 0.1 M (NH4)2SO4, 0.1 M ADA pH 6.3, 34.8% PEG 600 | 0.2 M NaCl, 0.1 M sodium cacodylate pH 5.2, 34% PEG 600 | 0.1 M calcium acetate, 0.1 M sodium acetate pH 5.0, 40% PEG 600 | 0.1 M NH4SO4, 0.1 M HEPES pH 7.25, 33% PEG 600 |
| Data collection | |||||||
| Space group | C121 | C121 | C121 | P1 | C121 | P1 | C121 |
| Cell dimensions | |||||||
| a, b, c (Å) | 141.17, 50.87, 110.79 | 140.71, 50.14, 110.28 | 145.7, 51.83, 114.95 | 50.91, 75.07, 111.43 | 140.64, 49.85, 109.83 | 49.70, 74.32, 107.43 | 140.18, 50.12, 110.73 |
| α,β,γ (Å) | 90, 92.69, 90 | 90, 93.45, 90 | 90, 92.67, 90 | 92.03, 90.33, 109.20 | 90, 93.75, 90 | 93.56, 89.71, 109.92 | 90, 92.79, 90 |
| Resolution (Å) | 70.5–3.22 (3.42–3.22) | 70.2–3.36 (3.62–3.36) | 114.8–3.75 (4.37–3.75) | 70.8–3.13 (3.41–3.13) | 70.2–2.85 (3.16–2.85) | 107.2–2.32 (2.67–2.32) | 70.50–3.22 (3.42–3.22) |
| Ellipsoidal Resolution Limit (best/worst)* | 3.22/4.33 | 3.36/5.1 | 3.75/6.34 | 3.13/4.50 | 2.85/3.72 | 2.32/3.55 | 3.22/4.33 |
| % Spherical Data Completeness* | 69.0 (20.9) | 54.5 (13.6) | 44.0 (10.1) | 52.0 (11.1) | 62.0 (12.0) | 41.9 (6.0) | 69.0 (20.9) |
| % Ellipsoidal Data Completeness* | 88.6 (80.1) | 84.1 (78.5) | 82.7 (65.7) | 82.0 (72.3) | 87.0 (62.6) | 80.3 (45.6) | 88.6 (80.1) |
| Rmerge* | 0.152 (0.656) | 0.349 (1.053) | 0.365 (0.752) | 0.123 (0.697) | 0.118 (1.85) | 0.089 (0.4) | 0.152 (0.656) |
| Rmeas* | 0.166 (0.707) | 0.384 (1.15) | 0.396 (0.817) | 0.144 (0.814) | 0.129 (1.99) | 0.104 (0.465) | 0.166 (0.707) |
| CC1/2 | 0.967 (0.861) | 0.779 (0.610) | 0.992 (0.862) | 0.939 (0.629) | 0.994 (0.366) | 0.967 (0.861) | |
| Mn I / σI* | 10.4 (2.7) | 4.0 (1.8) | 7.4 (2.3) | 7.7 (1.5) | 9.5 (1.2) | 6.5 (2.8) | 10.4 (2.7) |
| Multiplicity* | 6.6 (7.1) | 5.9 (6.2) | 6.7 (6.6) | 3.7 (3.8) | 6.4 (7.1) | 3.8 (3.8) | 6.6 (7.1) |
| Refinement | |||||||
| Resolution (Å) | 55.3–3.22 | 55.0–3.36 | 60.2–3.91 | 32.9–3.13 | 35.2–2.85 | 35.5–2.32 | 55.3–3.91 |
| No. reflections | 8,025 | 6,097 | 3,347 | 14,194 | 11,149 | 26,026 | 5,040 |
| Rwork / Rfree | 29.4 / 33.4 | 29.0/31.4 | 34.2/34.4 | 30.0/33.1 | 30.7/32.7 | 25.1/29.5 | 33.0/36.7 |
| Ramachandran Favored | 89.4 | 89.6 | 90.9 | 89.1 | 91.0 | 92.9 | 88.7 |
| Ramachandran Outliers | 1.9 | 1.9 | 2.4 | 2.6 | 1.9 | 1.5 | 2.7 |
| Clashscore | 11.8 | 13.6 | 8.4 | 16.8 | 8.6 | 10.4 | 14.9 |
| R.m.s. deviations | |||||||
| Bond lengths (Å) | 0.003 | 0.003 | 0.003 | 0.004 | 0.003 | 0.004 | 0.004 |
| Bond angles (°) | 0.70 | 0.68 | 0.60 | 0.82 | .65 | 0.70 | 0.67 |
| Coordinates in Protein Databank | 7SSU | 7SV9 | 7SVX | 7 MGX | 7MH6 | 7SZT | 7 T00 |
-
*
Where applicable, values reported are for anisotropically truncated data performed using the Staraniso webserver (Global Phasing). See Methods for details.
Table 2
SSM electrophysiology peak currents (nA) for EmrE3 and Gdx-Clo mutants summarized by experimental replicate.
| EmrE3 | ||||||
|---|---|---|---|---|---|---|
| Prep 1/Sensor 1 | Prep 1/Sensor 2 | Prep 2/Sensor 1 | ||||
| TPA+ | PheGdm+ | TPA+ | PheGdm+ | TPA+ | PheGdm+ | |
| No protein | 0 | 0 | 0 | 0 | 0 | 0 |
| WT | –4.8 | –1.4 | –4.1 | –1.2 | –3.9 | –1.0 |
| Y60F | –0.14 | –0.03 | –0.05 | –0.07 | –0.04 | –0.05 |
| S43A | –3.7 | –1.6 | –3.9 | –1.3 | –3.2 | –1.2 |
| W63F | –5.4 | –2.0 | –4.6 | –1.5 | –4.0 | –1.0 |
| Gdx-Clo | ||||||
| Prep 1/Sensor 1 (Gdm+) | Prep 1/Sensor 2 (Gdm+) | Prep 2/Sensor 1 (Gdm+) | ||||
| No protein | 0 | 0 | 0 | |||
| WT | –6.3 | –6.7 | –6.3 | |||
| Y60F | 0.04 | 0.007 | 0.6 | |||
| S43A | –0.15 | –0.15 | –0.15 | |||
| W63F | –0.60 | –0.33 | –0.30 | |||
Key resources table
| Reagent type (species) or resource | Designation | Source or reference | Identifiers | Additional information |
|---|---|---|---|---|
| Gene (Escherichia coli) | EmrE3 | Uniprot | P23895 | Bears mutations E25N, W31I, V34M to bind monobody(this paper – see Figure 1) |
| Gene (Clostridiales bacterium oral taxon 876) | Gdx-Clo | GenBank | ERI95081.1 | PMID:33247110 |
| Recombinant DNA reagent | EmrE3 in pET15b (plasmid) | This publication | Expression vector for EmrE3. Available upon request. | |
| Recombinant DNA reagent | Gdx-Clo in pET21c (plasmid) | PMID:33247110 | Expression vector for Gdx-Clo. Available upon request. | |
| Chemical compound, drug | E. coli polar lipids | Avanti, Alabaster, AL | #100600 C | |
| Chemical compound, drug | n-decyl-β -D-maltopyranoside | Anatrace, Maumee, OH | D322 | |
| Recombinant DNA reagent | Monobody L10 in pHBT1 (plasmid) | PMID:33247110 | Expression vector for monobody L10.PMID:33247110. Addgene ID: 183,406 |
Additional files
Download links
A two-part list of links to download the article, or parts of the article, in various formats.
Downloads (link to download the article as PDF)
Open citations (links to open the citations from this article in various online reference manager services)
Cite this article (links to download the citations from this article in formats compatible with various reference manager tools)
Crystal structures of bacterial small multidrug resistance transporter EmrE in complex with structurally diverse substrates
eLife 11:e76766.
https://doi.org/10.7554/eLife.76766


