Global hypo-methylation in a proportion of glioblastoma enriched for an astrocytic signature is associated with increased invasion and altered immune landscape
- Blizard Institute, Barts and The London School of Medicine and Dentistry, Queen Mary University, United Kingdom
- Laboratory for Molecular and Cellular Therapy, Vrije Universiteit Brussel, Belgium
- Division of Neuropathology, The National Hospital for Neurology and Neurosurgery, University College London Hospitals NHS Foundation Trust, and Department of Neurodegenerative Disease, Queen Square, Institute of Neurology, University College London, United Kingdom
- Centre for Translational Bioinformatics, William Harvey Research Institute, Barts and The London School of Medicine and Dentistry, Queen Mary University of London, United Kingdom
- Department of Immunology Genetics and Pathology, Uppsala University, Sweden
Figures
Figure 1 with 1 supplement
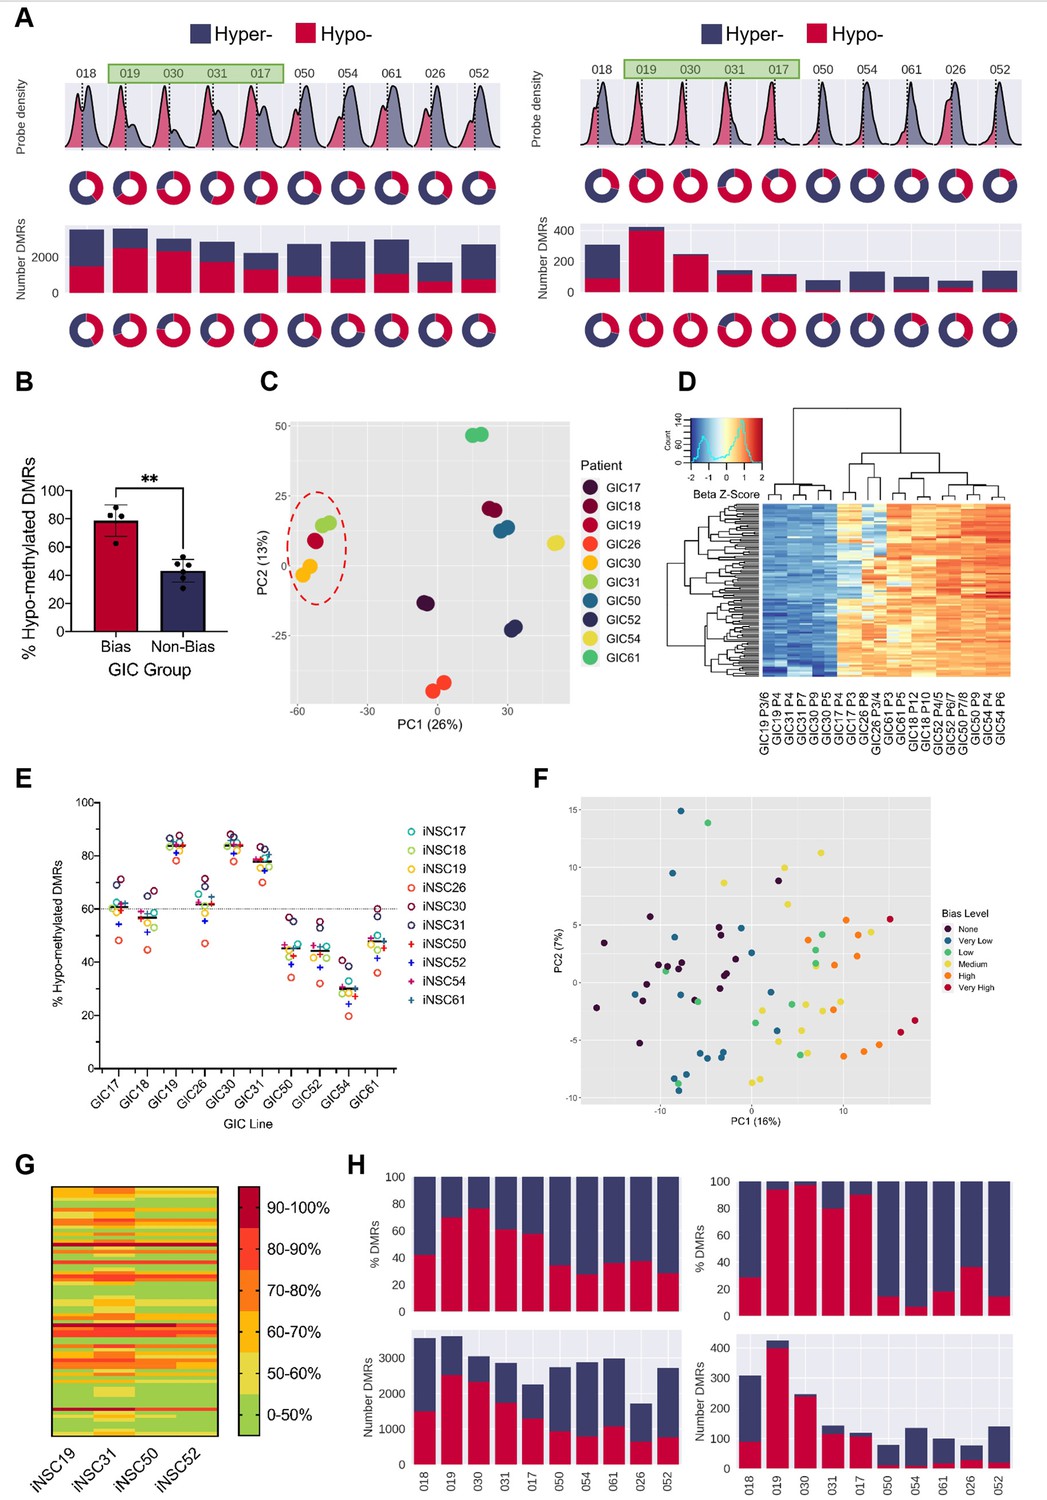
A DNA hypo-methylation bias in a subset of GBM.
(A) The distribution of median probe delta M values (first row), the proportion of hypo- (red) and hyper- (blue) probes (second row), total number of differentially methylated regions (DMRs) (third row), and the proportion of hypo- and hyper-DMRs (fourth row) for each glioblastoma initiating cell (GIC)-induced neural stem cell (iNSC) comparison (left panel) and using patient-specific probes and DMRs (right panel). Samples with a hypo-methylation bias highlighted in green. (B) Percentage of hypo-methylated DMRs in bias-GICs (N=4) and non-bias-GICs (N=6), statistical significance tested using Welch’s t-test. (C) Principal component analysis (PCA) of all patient-derived GIC samples from our cohort, based on the top 5000 most variable methylation probes, GICs 19, 30, and 31 highlighted by red circle. (D) Heatmap dendrogram of the beta value z-scores of the top 100 methylation probes driving the variation of PC1 across all GICs and replicates in our cohort. (E) Percentage of hypo-methylated DMRs from all possible comparisons of GICs and iNSCs in our cohort, the mean percentage hypo-methylated DMRs for each GIC is represented by a horizontal black line. (F) PCA of all patient-derived GIC samples from the HGCC cohort, based on the top 5000 most variable methylation probes. (G) Heatmap summary of the percentage of hypo-methylated DMRs from all possible comparisons of HGCC GICs and five iNSCs from our cohort. (H) Number (bottom panel) and proportion (top panel) of hypo- and hyper-DMRs for each patient comparison between formalin fixed paraffin embedded (FFPE) bulk tumour and iNSC, repeated in the right panel for patient-specific DMRs from the same comparisons.
-
Figure 1—source data 1
Source data for Figure 1.
- https://cdn.elifesciences.org/articles/77335/elife-77335-fig1-data1-v1.zip
Figure 1—figure supplement 1
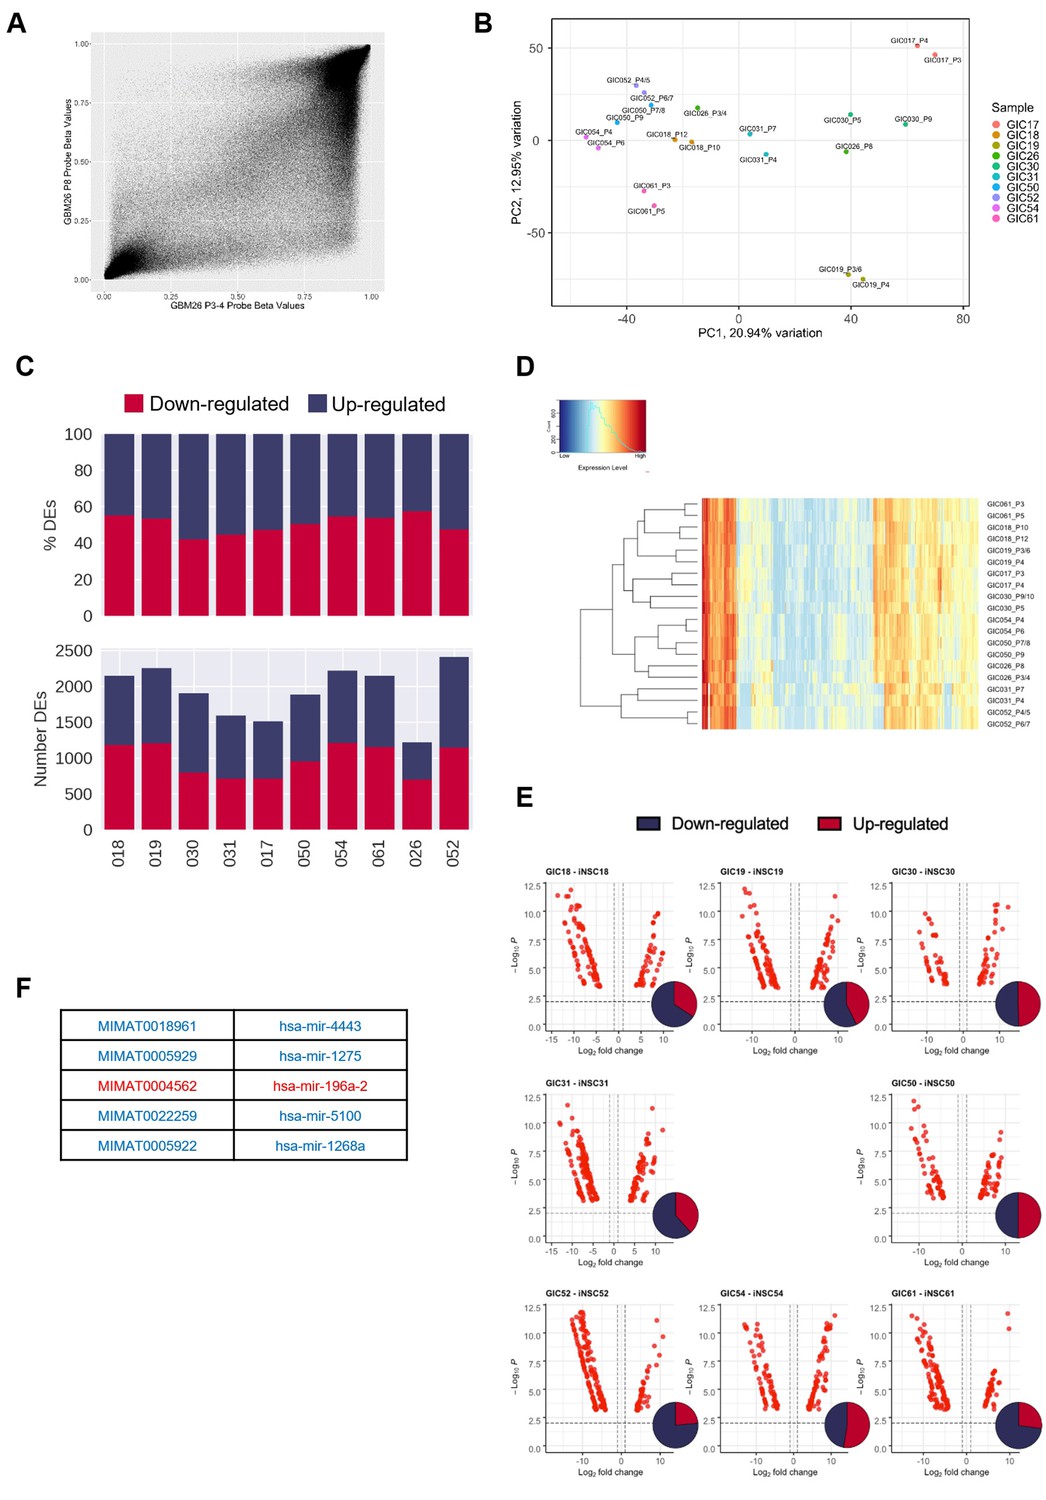
Hypo-methylation bias does not globally impact on transcription, but bias-glioblastoma initiating cells (B-GICs) are transcriptionally different from non-B-GICs (nB-GICs).
(A) Correlation of methylation probe beta values between the two technical replicates of GIC26. (B) Principal component analysis (PCA) of GICs based on the top 20% most variably expressed genes, point coloured by GIC line and labelled by sample name. (C) Total number (bottom panel) and proportion (top panel) of differentially expressed genes (DEGs) that are up-regulated (blue) or down-regulated (red) in GIC as compared to induced neural stem cell (iNSC) for each patient comparison. (D) Unsupervised hierarchical clustering of the top 500 variably expressed miRNAs across two biological replicates from the 11 GICs in our cohort. Euclidean clustering method and complete distance method were used. Red indicates highly expressed, blue lowly expressed. (E) Volcano plots of differentially expressed (DE) miRNAs (false discovery ratio [FDR] < 0.01, log fold change [FC] >1) for each syngeneic comparison between iNSC and GIC with inset Venn diagram showing proportion of up-regulated (red) and down-regulated (blue) miRNAs. (F) List of five DE miRNAs common to patients 19, 30, and 31, blue indicating down-regulation in GIC, red indicating up-regulation.
-
Figure 1—figure supplement 1—source data 1
Source data for Figure 1—figure supplement 1.
- https://cdn.elifesciences.org/articles/77335/elife-77335-fig1-figsupp1-data1-v1.zip
Figure 2 with 1 supplement
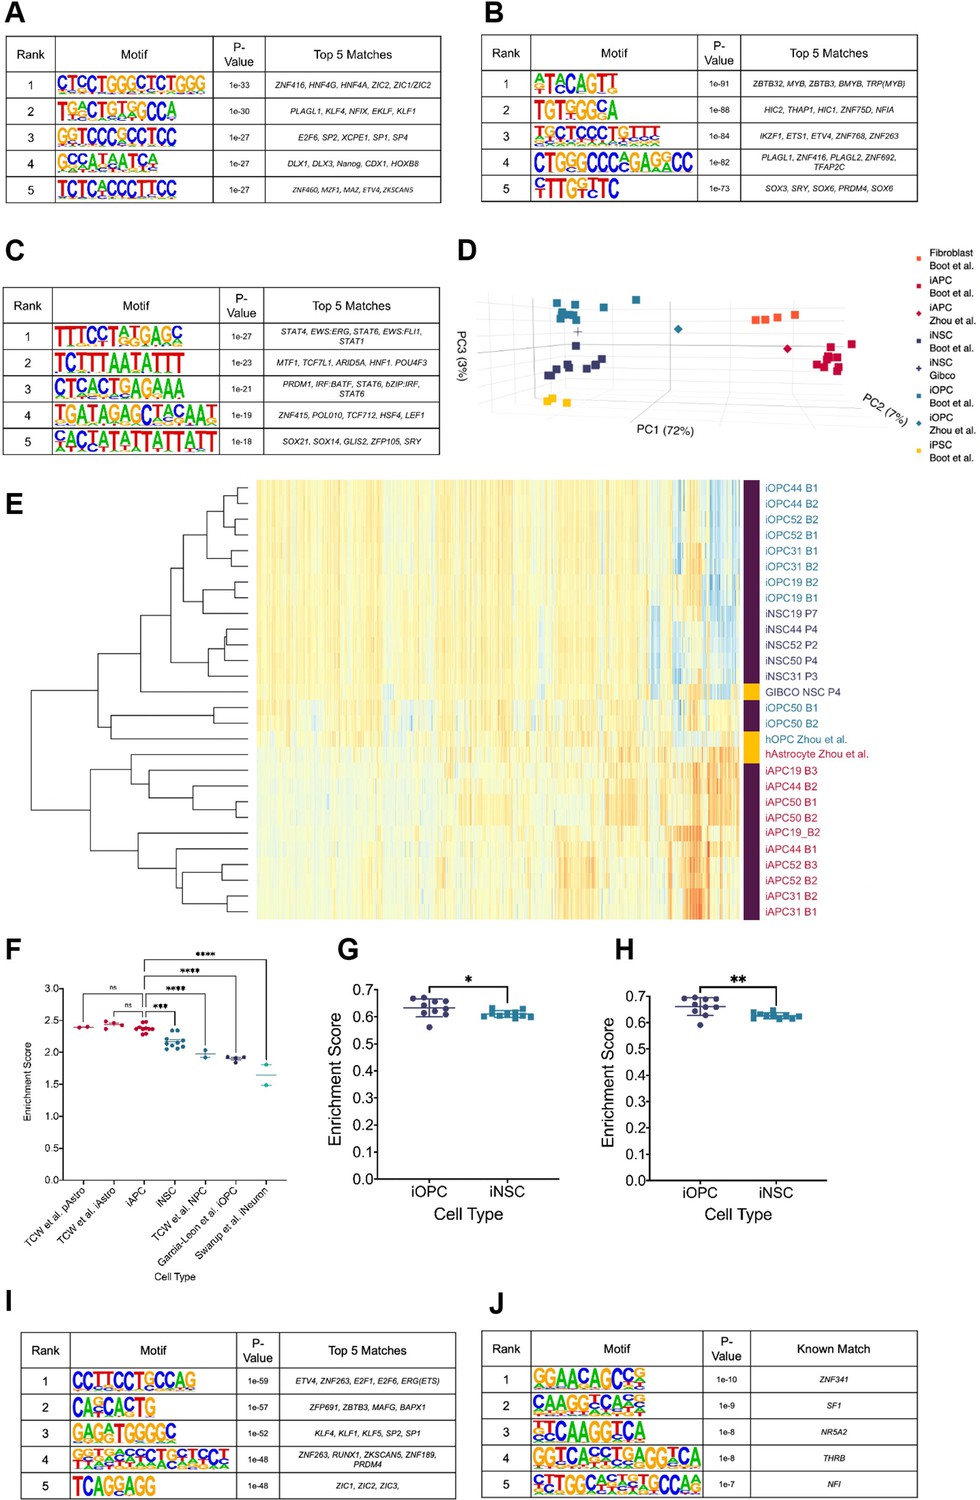
Hypo-methylated differentially methylated regions (DMRs) from bias-glioblastoma initiating cells (B-GICs) are enriched for transcription factor binding sites linked to glial differentiation.
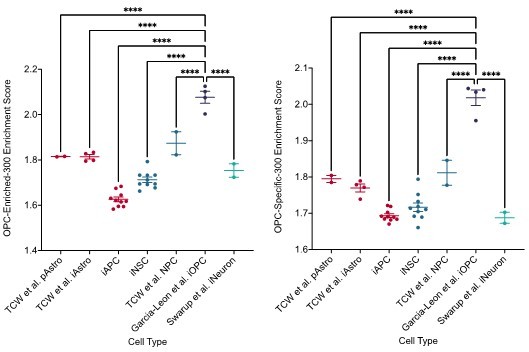
(A) Top five motifs enriched in all hypo-methylated DMRs from B-GICs as compared to all other DMRs from all GICs. (B) Top five motifs enriched in all hypo-methylated DMRs from B-GICs as compared to all the hypo-methylated DMRs from all other GICs. (C) Top five motifs enriched in all hyper-methylated DMRs from B-GICs as compared to all other DMRs from all GICs. (D) 3D principal component analysis (PCA) of methylation data from patient-derived fibroblasts, induced pluripotent stem cells (iPSCs), induced neural stem cells (iNSCs), induced astrocyte progenitor cells (iAPCs), induced oligodendrocyte progenitor cells (iOPCs), and publicly available reference datasets of NSCs, astrocytes, and oligodendrocyte precursor cells. (E) Unsupervised hierarchical clustering based on the top 5000 variable methylation probes of iAPCs, iNSCs, iOPCs (purple bar), and publicly available reference datasets (yellow bar). (F) Single sample gene set enrichment analysis (ssGSEA) enrichment scores for the astrocyte composite signature (ACS) of iAPCs (N=10), iNSCs (N=10), and publicly available reference datasets, statistical differences tested with one-way ANOVA. ssGSEA enrichment scores of iOPCs (N=10) and iNSCs (N=10) for the Oligodendrocyte Specific-300 (G) and Oligodendrocyte Enriched-300 (H) gene signatures, statistical significance tested using Mann-Whitney t-test. Top five de novo (I) and known (J) motifs enriched in all hypo-methylated DMRs in iAPCs, from each iAPC versus iNSC comparison.
-
Figure 2—source data 1
Source data for Figure 2.
- https://cdn.elifesciences.org/articles/77335/elife-77335-fig2-data1-v1.zip
Figure 2—figure supplement 1
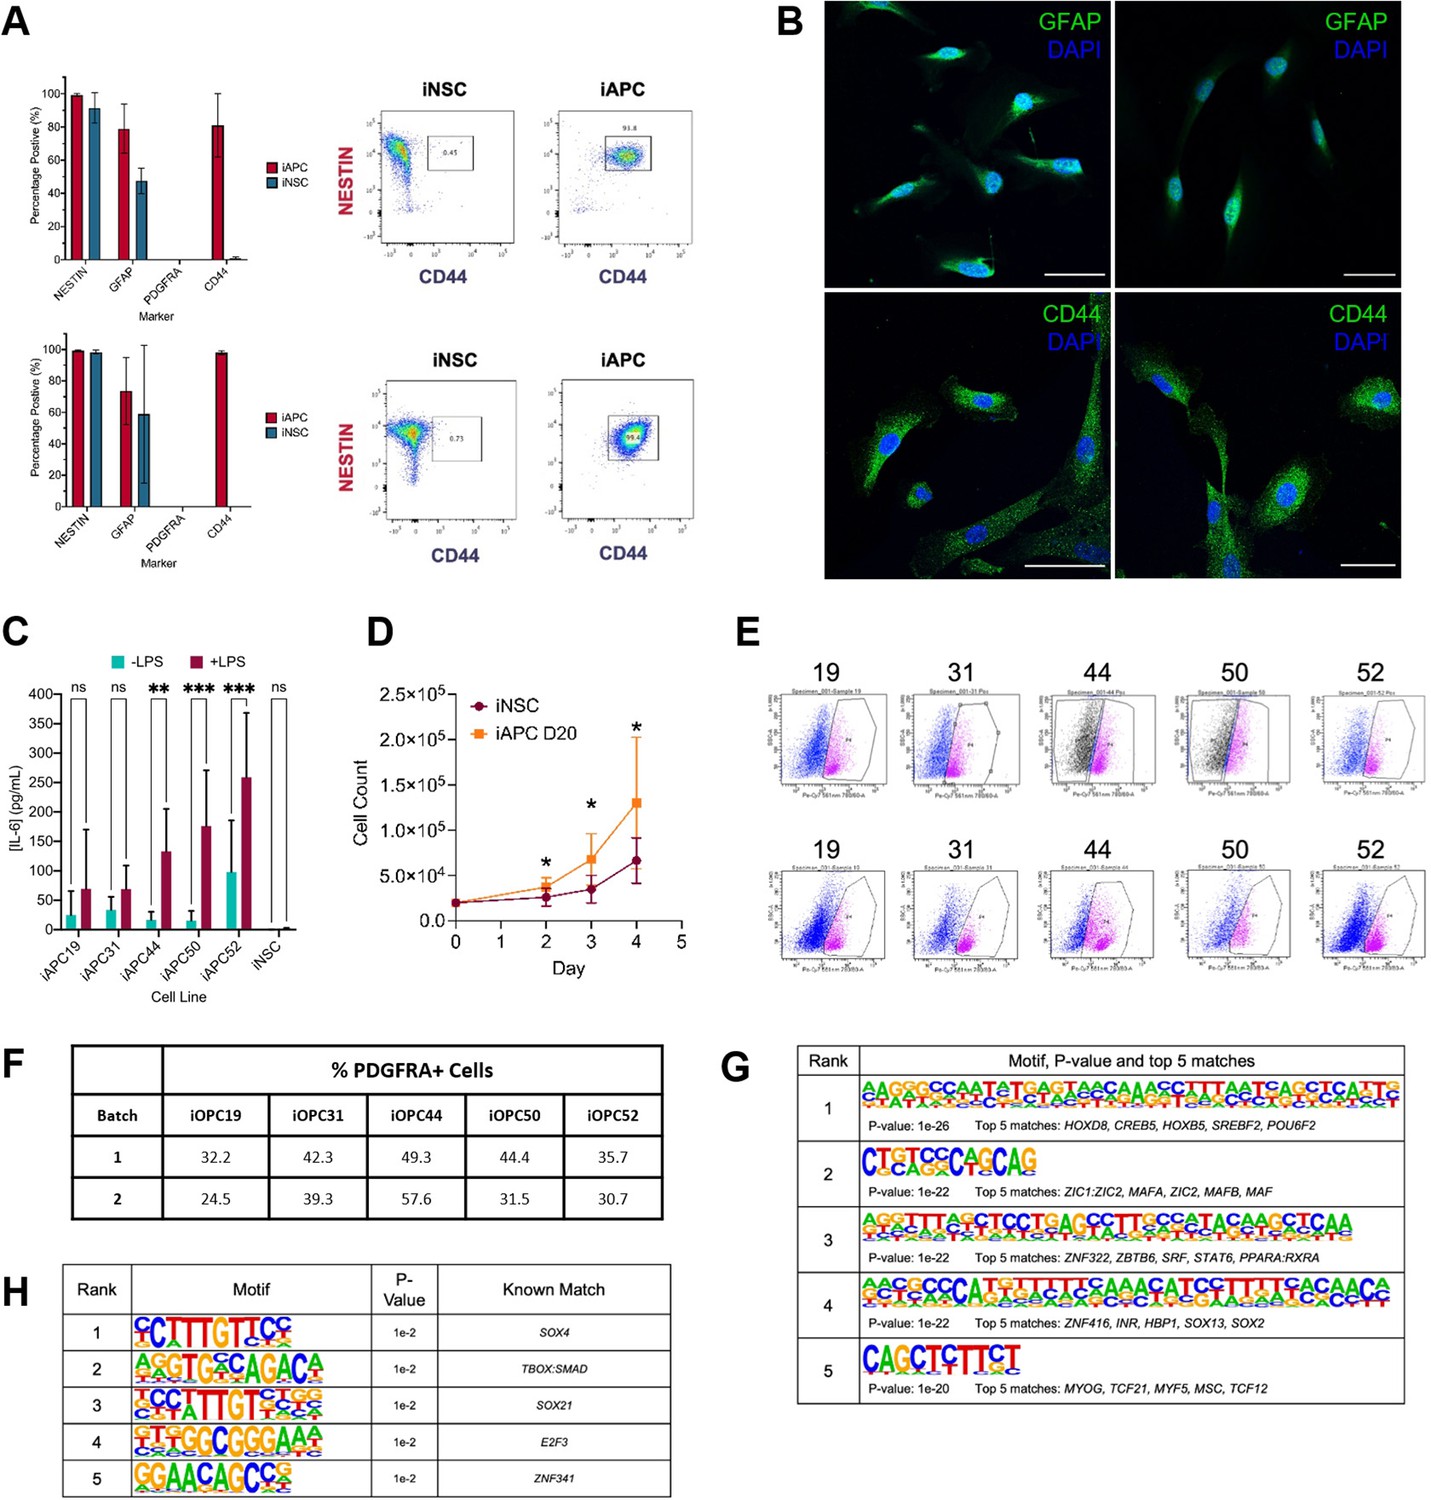
Characterisation of induced astrocyte progenitor cell (iAPC) and induced oligodendrocyte progenitor cell (iOPC) obtained from induced neural stem cell (iNSC).
(A) Flow cytometry results of iAPCs analysed after 10 days of differentiation (top panel) and 20 days (bottom panel). iAPCs (red) (N=5) and iNSCs (teal) (N=3) were analysed for the markers NESTIN, GFAP, PDGFRA, and CD44. Results presented as bar charts of percentage of positive cells for respective markers, and for each timepoint representative dot plots of NESTIN versus CD44 of iNSC and iAPCs, to show co-expression of the two markers. (B) Immunostaining of iAPCs, for GFAP (top panel, green) and CD44 (bottom panel, green) with DAPI nuclear staining (blue), after 30 days of differentiation, 50 µm scale bars. (C) Concentration of interleukin-6 (IL-6) produced by iAPCs and iNSCs stimulated with 50 µg of LPS for 24 hr (turquoise) and unstimulated (burgundy). Statistical significance was tested using a two-way ANOVA (N=5–7). (D) Cell counts of iNSCs (maroon) and iAPCs differentiated for 20 days (iAPC D20) (orange). Cell counts at days 2, 3, and 4 were statistically compared using a t-test (N=5). (E) Fluorescent activated cell sorting (FACS) results, based on PDGFRA sorting, for Batch 1 (top panel) and Batch 2 (bottom panel) of iOPC differentiation. (F) FACS results summary: the percentage PDGFRA+ cells for each cell line from each batch. Top five de novo (G) and known (H) motifs enriched in all hypo-methylated differentially methylated regions (DMRs) in iOPCs, from each iOPC versus iNSC comparison.
-
Figure 2—figure supplement 1—source data 1
Source data for Figure 2—figure supplement 1.
- https://cdn.elifesciences.org/articles/77335/elife-77335-fig2-figsupp1-data1-v1.zip
Figure 3 with 1 supplement
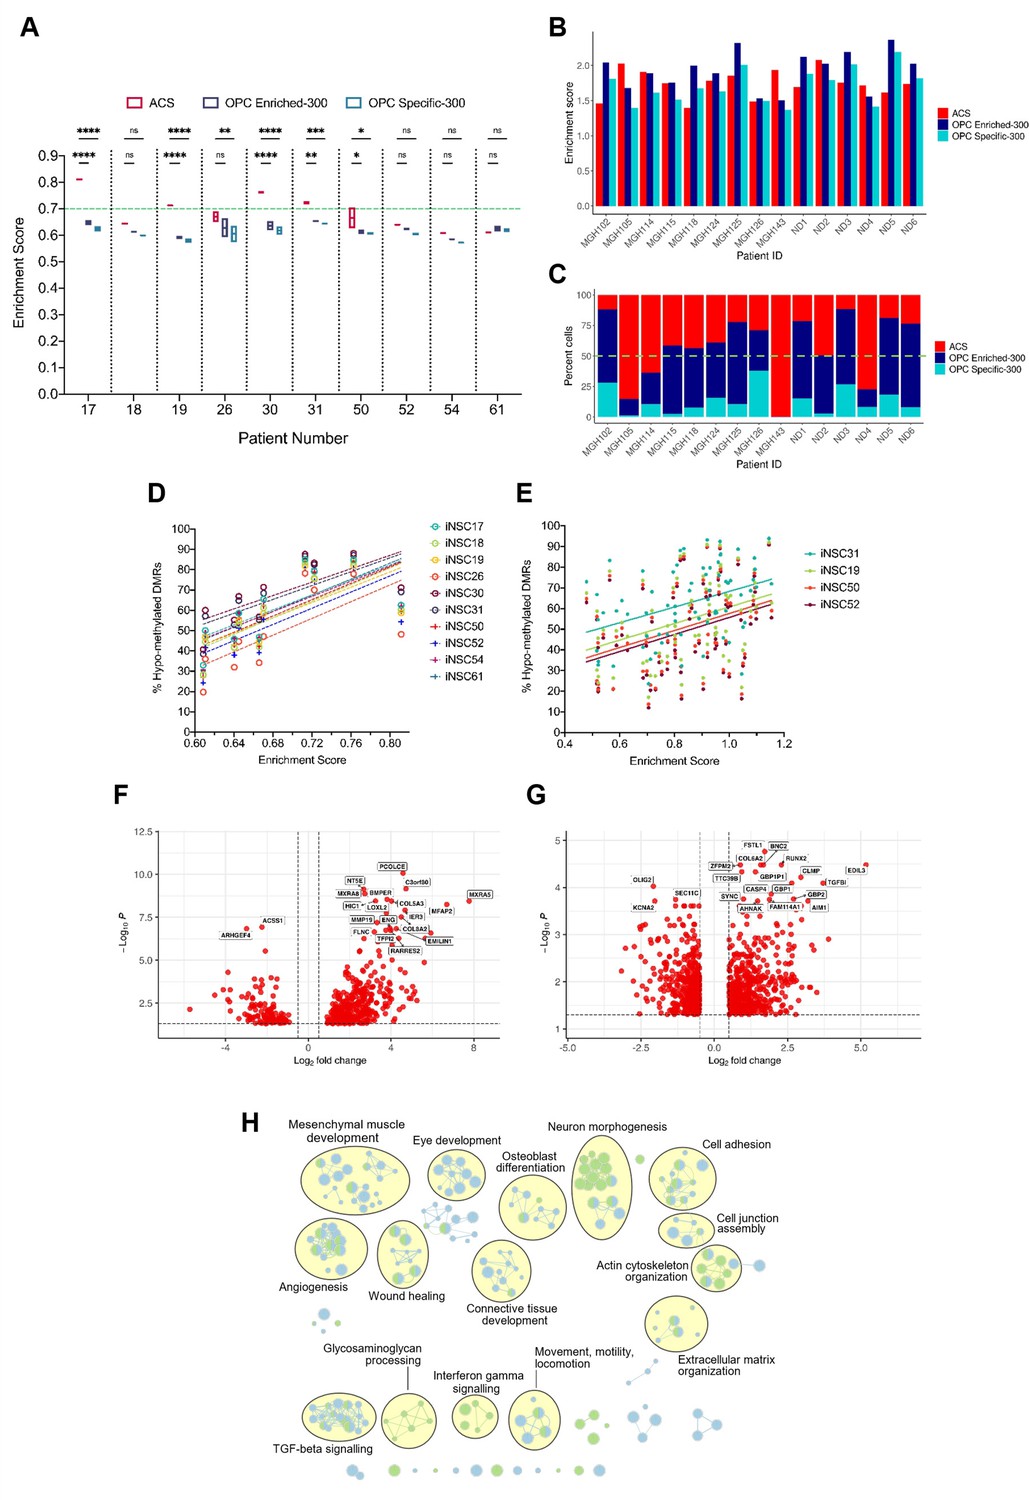
A positive correlation between DNA hypo-methylation and astrocyte signature enrichment.
(A) Single sample gene set enrichment analysis (ssGSEA) enrichment scores of glioblastoma initiating cells (GICs) (N=2) for three different gene signatures; ACS (red), OPC Enriched-300 Signature (blue) and OPC Specific-300 Signature (teal), statistical significance tested using two-way ANOVA. Green dashed line indicating threshold for enrichment. (B) ssGSEA enrichment scores based on pseudo-bulk (aggregated within a patient) data of the cancer cell subset from the single-cell RNA sequencing (scRNAseq) glioblastoma tumour data from Pombo Antunes et al., 2021, and Neftel et al., 2019, for three different gene signatures, ACS (red), OPC Enriched-300 Signature (blue), and OPC Specific-300 Signature (teal). (C) Percentage of single cells for each tumour, which scored the highest for one of the three different signatures: ACS (red), OPC Enriched-300 Signature (blue), and OPC Specific-300 Signature (teal). Green dashed line indicating threshold for enrichment. (D) Scatter plot of the ACS enrichment score and the percentage of hypo-methylated DMRs for each of the GICs from our cohort, when comparing to iNSCs from our cohort. (E) Scatter plot of the ACS enrichment score and the percentage of hypo-methylated differentially methylated regions (DMRs) for each of the HGCC GICs, when comparing to induced neural stem cells (iNSCs) from our cohort. (F) Volcano plot of differentially expressed genes (DEGs) identified from the comparison of BE-GICs versus nBE-GICs (glm model used for differentially expressed [DE] analysis). (G) Volcano plot of DEGs identified from the comparison of BE-GICs versus nBE-GICs from the HGCC cohort (glm model used for DE analysis). (H) Summary of pathway analysis performed using gProfiler, using the DEGs identified in (F) and (G).
-
Figure 3—source data 1
Source data for Figure 3.
- https://cdn.elifesciences.org/articles/77335/elife-77335-fig3-data1-v1.zip
Figure 3—figure supplement 1
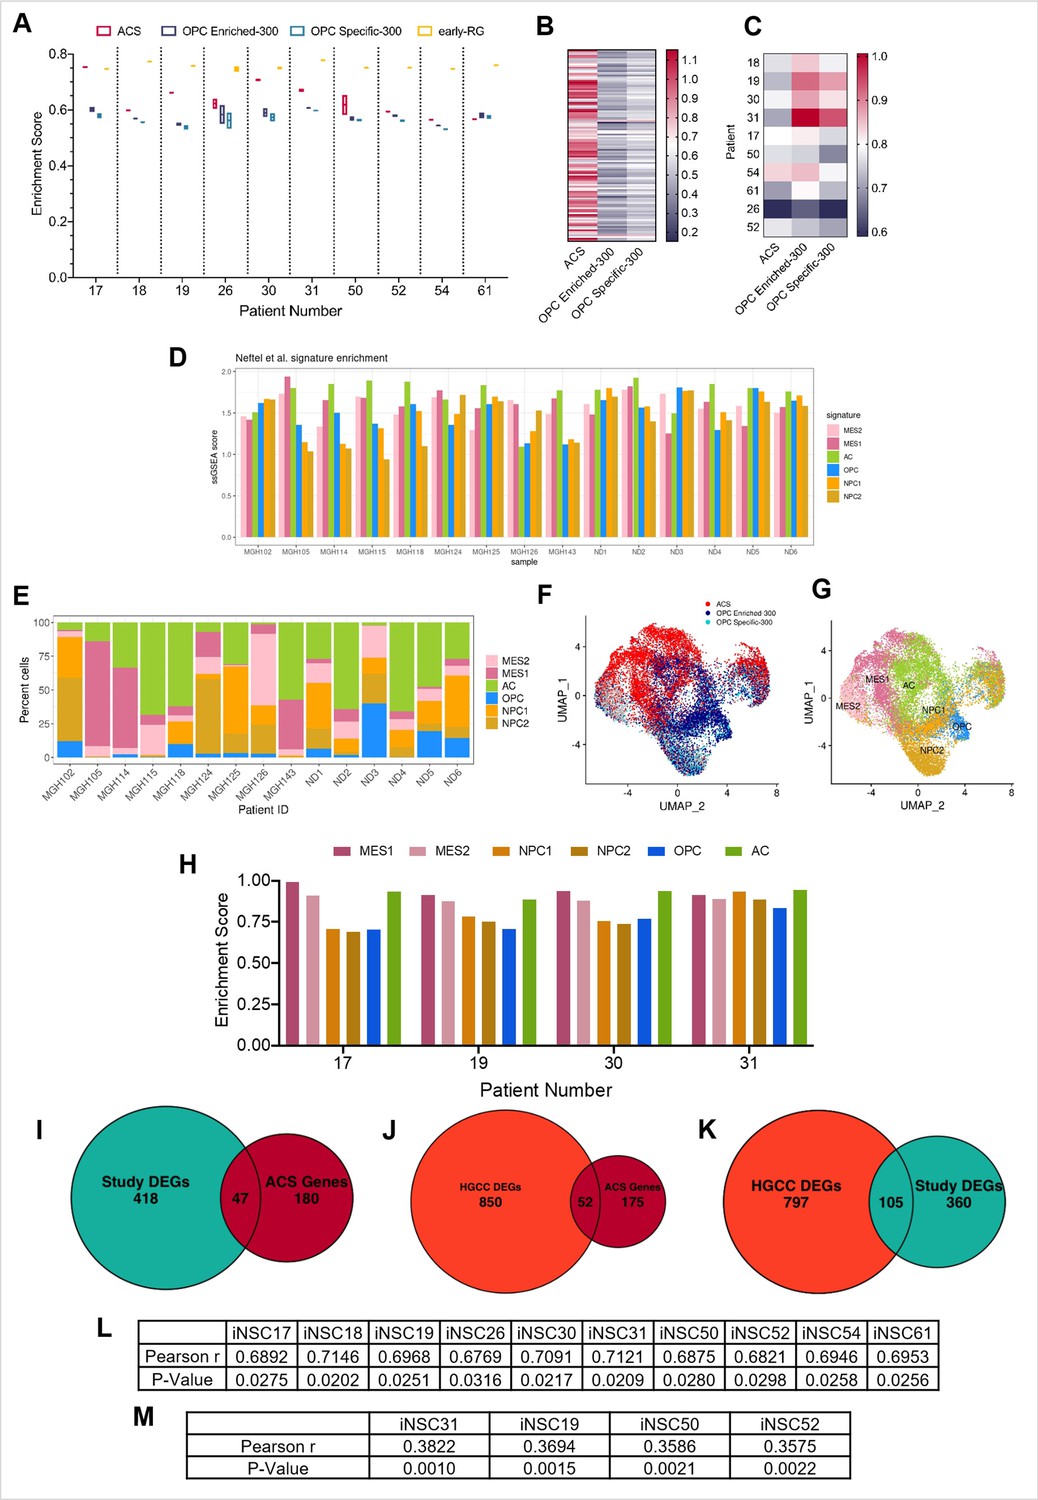
Characterisation of the positive correlation between DNA hypo-methylation and astrocyte signature enrichment.
(A) Single sample gene set enrichment analysis (ssGSEA) enrichment scores of glioblastoma initiating cells (GICs) (N=2) for four different gene signatures; ACS (red), OPC Enriched-300 Signature (blue), OPC Specific-300 Signature (teal), and early radial glia (early-RG) (yellow). (B) Enrichment score heatmap for the ACS, OPC Enriched-300, and OPC Specific-300 signatures, of external GICs (N=1). (C) ssGSEA enrichment scores of formalin fixed paraffin embedded (FFPE) bulk tumour tissues (N=1) for three different signatures: ACS, OPC Enriched-300, and OPC Specific-300. (D) ssGSEA enrichment scores, based on pseudo-bulk (aggregated within a patient) data of the cancer cell subset from the single-cell RNA sequencing (scRNAseq) GBM tumour data from Pombo Antunes et al., 2021, and Neftel et al., 2019, for six cancer gene signatures from Neftel et al., 2019. (E) Percentage of single cancer cells for each tumour, corresponding to the dataset from (D), which scored the highest for one of the six signatures from Neftel et al., 2019. (F) UMAP plot of single cancer cells, corresponding to the dataset from (D); each cell was assigned to the signature with the highest enrichment score between ACS, OPC Enriched-300, and OPC Specific-300. The cells were coloured based on the assigned signature type. (G) UMAP plot of single cancer cells, corresponding to the dataset from (D); each cell was assigned to the signature with the highest enrichment score from the Neftel et al., 2019, signatures. The cells were coloured based on the assigned signature type. (H) ssGSEA enrichment scores of GICs (N=2) for the six different signatures from Neftel et al., 2019. (I) Overlap between differentially expressed genes (DEGs) identified from the comparison of BE-GICs versus nBE-GICs (from our cohort) and the ACS genes, Fisher’s exact test p-value < 0.00001. (J) Overlap between DEGs identified from the comparison of BE-GICs versus nBE-GICs (from the HGCC cohort) and the ACS genes, Fisher’s exact test p-value < 0.00001. (K) Overlap between DEGs identified when comparing BE-GICs versus nBE-GICs from our cohort and the HGCC cohort, Fisher’s exact test p-value < 0.00001. (L) Pearson r- and p-values of correlations between percentage hypo-methylated differentially methylated regions (DMRs) (when compared to induced neural stem cells [iNSCs]) and ACS enrichment score for GICs from our cohort, corresponding to Figure 3B. (M) Pearson r- and p-values of correlations between percentage hypo-methylated DMRs (when compared to iNSCs) and ACS enrichment score for GICs from the HGCC cohort, corresponding to Figure 3C.
-
Figure 3—figure supplement 1—source data 1
Source data for Figure 3—figure supplement 1.
- https://cdn.elifesciences.org/articles/77335/elife-77335-fig3-figsupp1-data1-v1.zip
Figure 4 with 1 supplement
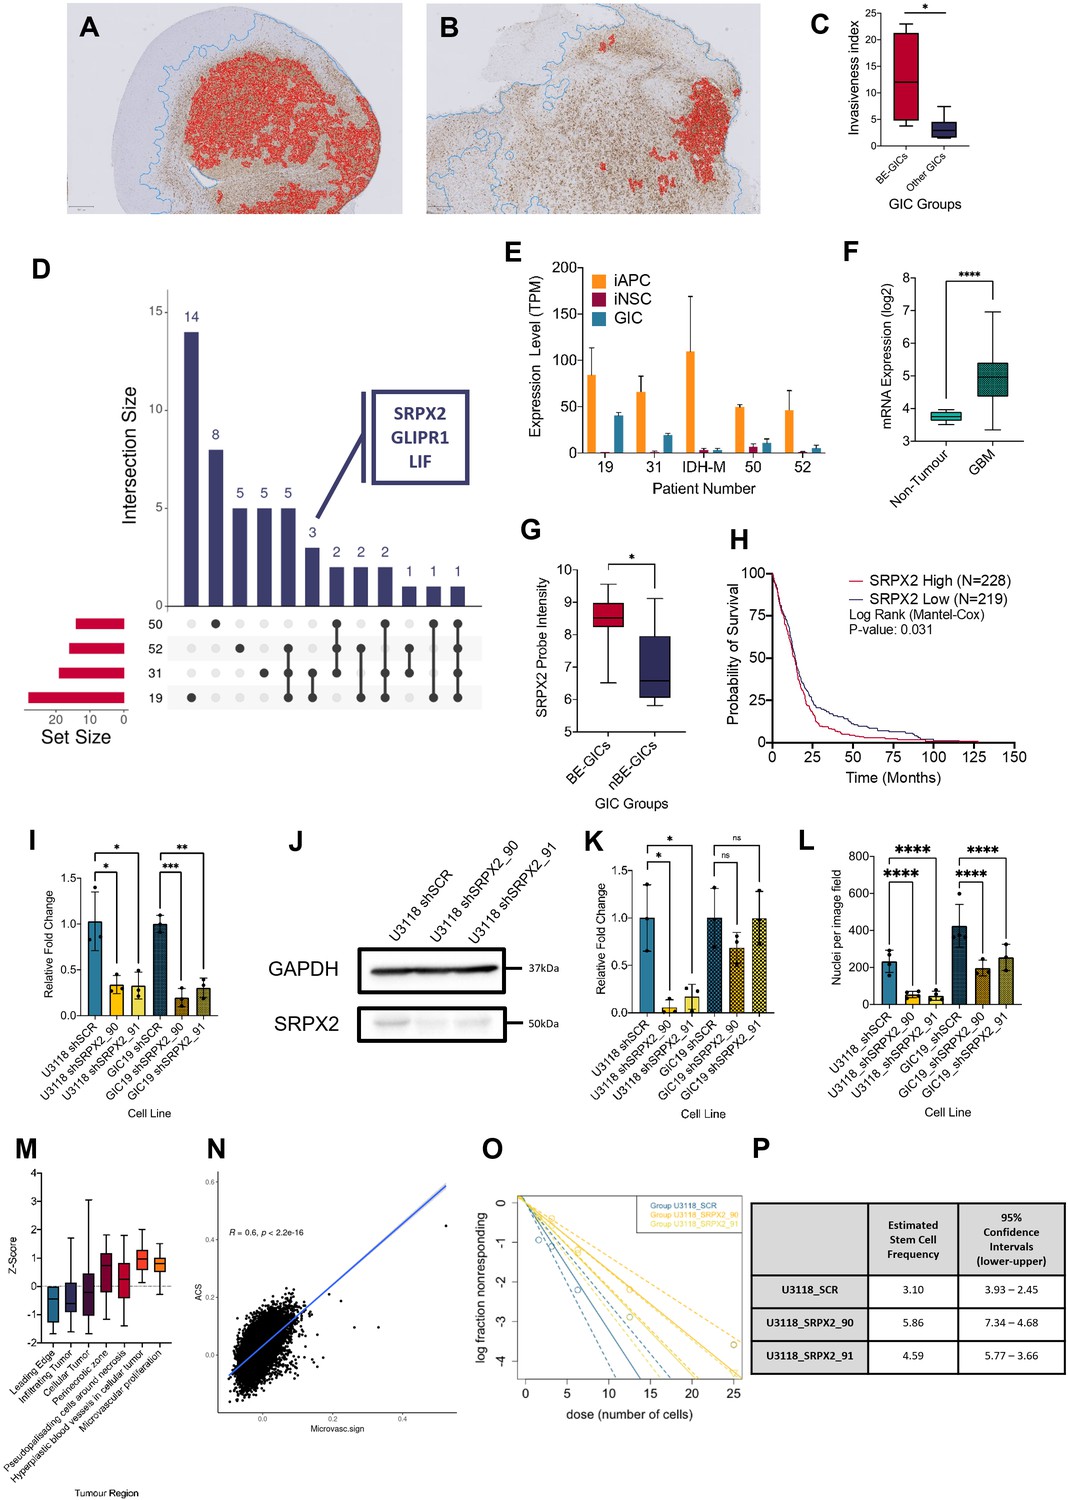
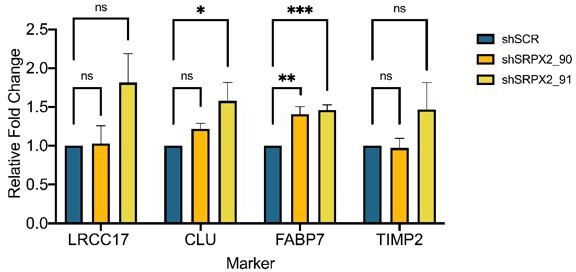
Increased invasion in xenografts derived from BE-GICs and role of SRPX2 in regulating invasion in vitro.
(A) and (B) Representative images of human vimentin-stained xenograft tumours with overlayed image analysis. Red outline is the detected tumour core, blue outline is the detected gross tumour edge. (C) Invasive index scores of xenografts from BE-GICs (N=4) and other GICs (N=8), statistical significance tested using un-paired t-test. (D) Overview of significant differentially expressed genes (DEGs) that are present in the astrocyte composite signature (ACS) and are identified in glioblastoma initiating cell (GIC) versus induced neural stem cell (iNSC) and induced astrocyte progenitor cell (iAPC) versus iNSC comparisons across patient comparisons. (E) Expression (transcripts per million [TPM]) of SRPX2 in the three cell types analysed: iAPC (orange), iNSC (red), and GIC (turquoise). (F) Expression of target genes in glioblastoma tissue (N=528) as compared to non-tumour tissue (N=10), data acquired from Gliovis (Bowman et al., 2017), statistical significance tested using Mann-Whitney t-test. (G) Expression of target genes in BE-GICs (N=13) versus nBE-GICs (N=6) from the HGCC cohort, statistical significance tested using Mann-Whitney t-test. (H) Kaplan-Meier curve for GBM patients with high expression (red) versus low expression (blue) of SRPX2, produced using TCGA data available on Gliovis (Bowman et al., 2017). (I) Relative fold change in mRNA expression of SRPX2 as determined by qPCR for GIC short hairpin RNA (shRNA) knockdown lines, statistical significance tested using t-test (N=3). (J) Representative western blot of SRPX2 in U3118 shRNA knockdown lines. (K) Relative fold change in SRPX2 protein expression as determined by western blot for GIC shRNA knockdown lines, statistical significance tested using t-test (N=3). (L) Invasion assay results: average number of nuclei per image field of GIC SRPX2 knockdown lines, statistical significance tested using two-way ANOVA (N=3-4). (M) Z-score of SRPX2 expression in different tumour regions according to Ivy GAP (Puchalski et al., 2018) (N=19-111). (N) Correlation of ACS enrichment scores (y-axis) and enrichment scores for a signature of the top 200 up-regulated genes in regions of microvascular proliferation and hyperplastic blood vessels (x-axis) in single tumour cells from Pombo Antunes et al., 2021. (O) Neurosphere assay results: log fraction of the number of non-responding cultures at specified cell counts for U3118 SRPX2 knockdown lines. (P) Table of estimated stem cell frequencies and confidence intervals as determined by the neurosphere assay results and extreme limiting dilution assay analysis.
-
Figure 4—source data 1
Source data for Figure 4.
- https://cdn.elifesciences.org/articles/77335/elife-77335-fig4-data1-v1.zip
Figure 4—figure supplement 1

Characterisation of xenografts derived from BE-GICs and role of SRPX2 in regulating glioblastoma initiating cell (GIC) properties.
(A) Schematic overview of the strategy to identify genes that may contribute to the phenotypic characteristics of the BE-GICs. (B) and (C) Representative overview images of human vimentin-stained xenograft tumours with overlayed image analysis. Red outline is the detected tumour core, blue outline is the detected gross tumour edge. (D) Percentage vimentin positive area relative to tissue area of xenografts from BE-GICs (N=4) and other GICs (N=8), statistical significance tested using un-paired t-test. (E) Representative western blot of SRPX2 in GIC19 short hairpin RNA (shRNA) knockdown lines. Correlation of OPC Enriched-300 (F) and OPC Specific-300 (G) enrichment scores (y-axis) and enrichment scores for a signature of the top 200 up-regulated genes in regions of microvascular proliferation and hyperplastic blood vessels (x-axis) in single tumour cells from Pombo Antunes et al., 2021. (H) Proliferation assay growth curves for U3118 and GIC19 SRPX2 knockdown lines. (I) Neurosphere assay results: log fraction of the number of non-responding cultures at various cell counts for GIC19 SRPX2 knockdown lines. (J) Table of estimated stem cell frequencies and confidence intervals as determined by the neurosphere assay results and extreme limiting dilution assay analysis.
-
Figure 4—figure supplement 1—source data 1
Source data for Figure 4—figure supplement 1.
- https://cdn.elifesciences.org/articles/77335/elife-77335-fig4-figsupp1-data1-v1.zip
Figure 5 with 1 supplement
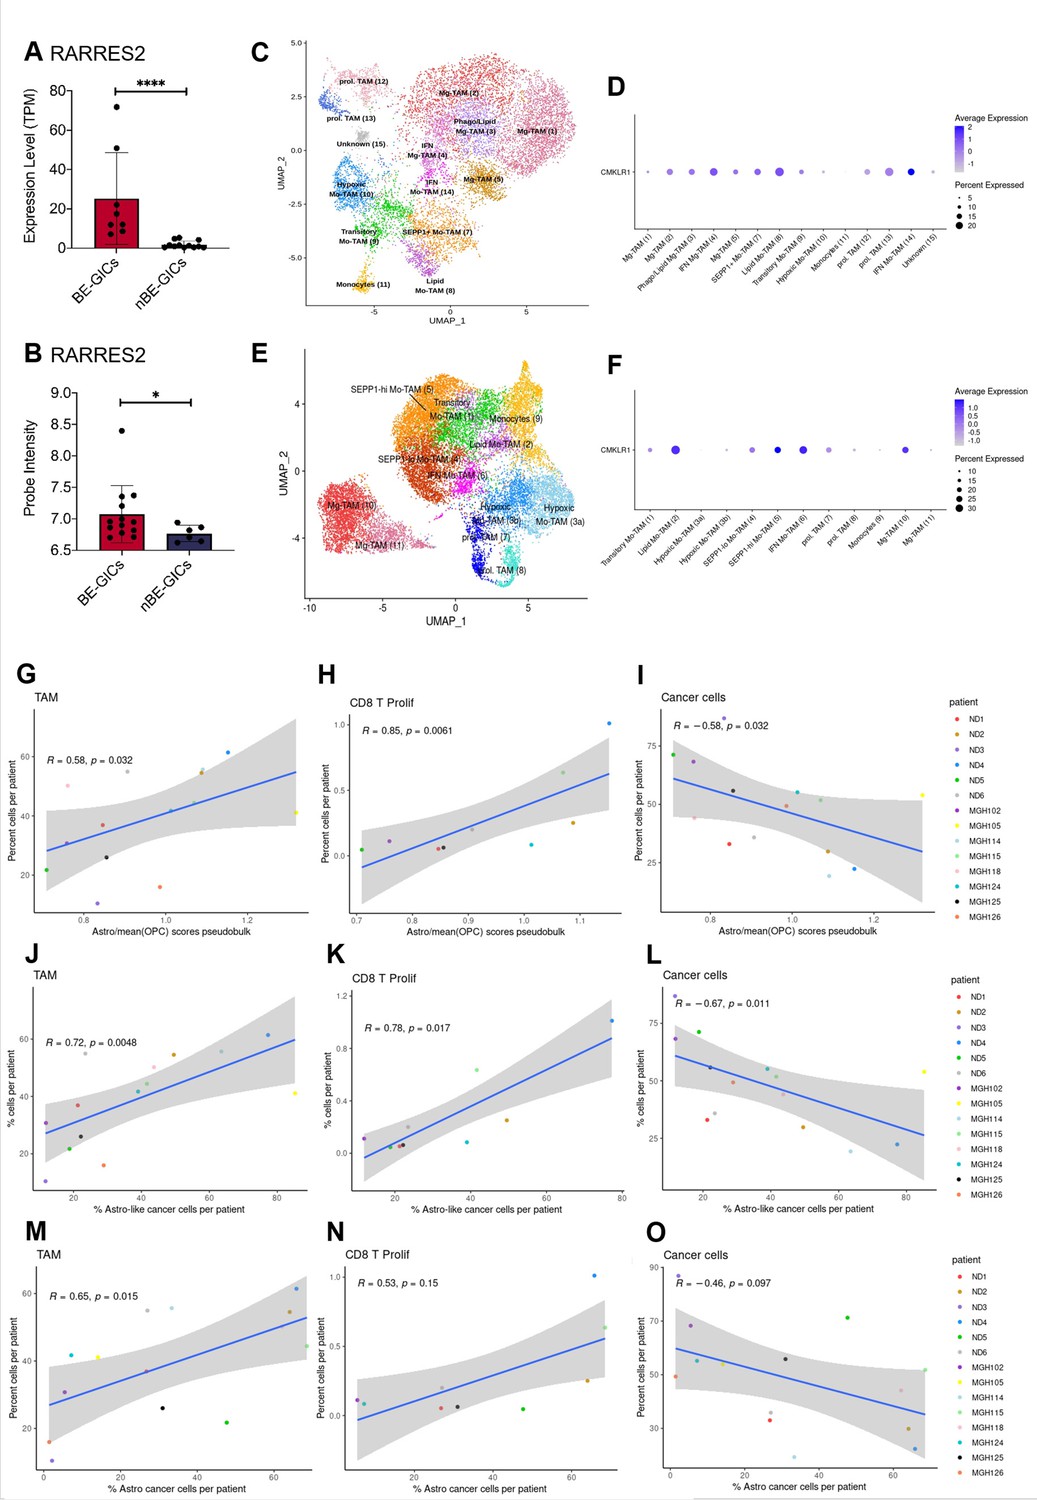
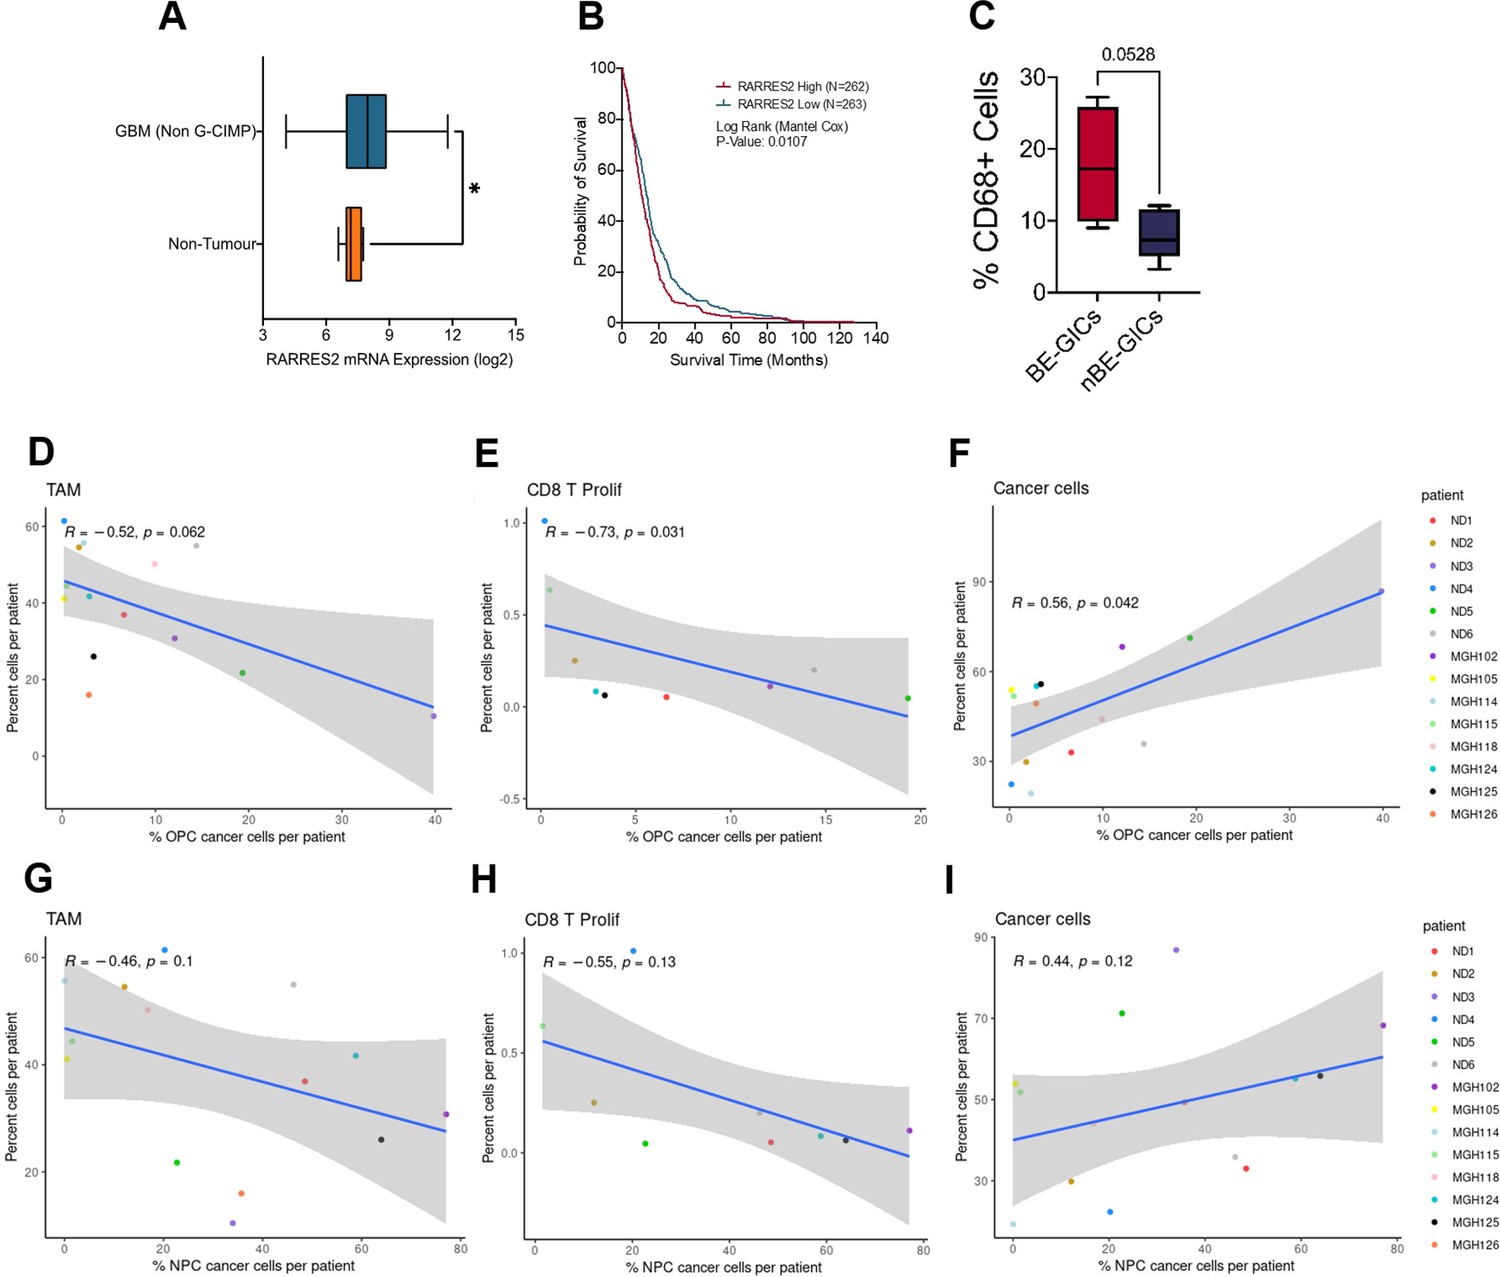
GBM enriched for an astrocytic signature display an altered immune landscape.
(A) Expression of RARRES2 in BE-GICs (N=8) and nBE-GICs (N=12) in our cohort, determined by RNAseq. (B) Expression of RARRES2 in BE-GICs (N=13) and nBE-GICs (N=6) in the HGCC cohort. (C) UMAP of monocyte and tumour-associated macrophage (TAM) cell clusters from the Antunes et al. (Tarazona et al., 2015) newly diagnosed glioblastoma tumour data; the cells are coloured by cell type. (D) Expression of CMKLR1 across different immune cell type clusters from panel (C). (E) UMAP of monocyte and TAM clusters from the Antunes et al. (Tarazona et al., 2015), recurrent glioblastoma tumour data; the cells are coloured by TAM subtype. (F) Expression of CMKLR1 across different TAM subtype clusters from panel (E). Scatter plot, comparing the ratio of the astrocyte composite signature (ACS) and the mean OPC pseudo-bulk enrichment scores, and the proportion of TAM cells (G), CD8 proliferative T cells (H), and cancer cells (I) from the same tumour. Scatter plot, comparing the proportion of ACS-enriched cancer cells and the proportion of TAM cells (J), CD8 proliferative T cells (K), and cancer cells (L) from the same tumour, corresponding to the dataset from (G–I). Scatter plot, comparing the proportion of AC-enriched and the proportion of TAM cells (M), CD8 proliferative T cells (N), and cancer cells (O) from the same tumour, corresponding to the dataset from (G–I). Spearman’s rank correlation coefficient and the corresponding p-value are noted on each scatter plot. The blue lines represent smoothed conditional means using general linear model, while the grey areas on the plots denote the confidence interval around the smooth (using the geom_smooth function of ggplot2).
-
Figure 5—source data 1
Source data for Figure 5.
- https://cdn.elifesciences.org/articles/77335/elife-77335-fig5-data1-v1.zip
Figure 5—figure supplement 1
scRNA analysis of the TME composition in glioblastoma enriched for an astrocytic signature.
(A) Expression of RARRES2 in non-G-CIMP tumour tissue (N=482) as compared to healthy non-tumour tissue (N=10), statistical significance tested using Mann-Whitney t-test, produced using TCGA data available on Gliovis. (B) Kaplan-Meier curve for GBM patients with high expression (red) versus low expression (blue) of RARRES2, produced using TCGA data available on Gliovis. (C) Percentage CD68+ cells in formalin fixed paraffin embedded (FFPE) tumour tissue from tumours corresponding to BE-GICs (N=4) or nBE-GICs (N=5). Scatter plot, comparing the proportion of OPC-enriched cancer cells (as determined by the gene signatures from Neftel et al., 2019) and the proportion of myeloid cells (D), CD8 proliferative T cells (E), and cancer cells (F) from the same tumour of the single-cell RNA sequencing (scRNAseq) GBM tumour data from Pombo Antunes et al., 2021, and Neftel et al., 2019. Scatter plot, comparing the proportion of NPC-enriched tumour cells (as determined by the signatures; Neftel et al., 2019) and the proportion of myeloid cells (G), CD8 proliferative T cells (H), and cancer cells (I) from the same tumour, corresponding to the dataset from (D–F).
-
Figure 5—figure supplement 1—source data 1
Source data for Figure 5—figure supplement 1.
- https://cdn.elifesciences.org/articles/77335/elife-77335-fig5-figsupp1-data1-v1.zip
Author response image 1
Author response image 2
Additional files
-
Supplementary file 1
Differentially expressed genes (DEGs) (log fold change and false discovery ratio [FDR]) from comparisons between patient-matched pairs of glioblastoma initiating cells (GICs) and induced neural stem cells (iNSCs) for 10 patient pairs from this study.
- https://cdn.elifesciences.org/articles/77335/elife-77335-supp1-v1.xlsx
-
Supplementary file 2
Differentially expressed genes in the myeloid cell populations of the integrated dataset from newly diagnosed human GBM tumours of Pombo Antunes et al., 2021, and the 10× GBM tumours of Neftel et al., 2019.
- https://cdn.elifesciences.org/articles/77335/elife-77335-supp2-v1.xlsx
-
Supplementary file 3
Differentially expressed genes in the lymphocyte cell populations of the integrated dataset from newly diagnosed human GBM tumours of Pombo Antunes et al., 2021, and the 10× GBM tumours of Neftel et al., 2019.
- https://cdn.elifesciences.org/articles/77335/elife-77335-supp3-v1.xlsx
-
Supplementary file 4
Media recipes, primer sequences, antibody details, shRNA plasmid details and gene signature lists used in this study.
- https://cdn.elifesciences.org/articles/77335/elife-77335-supp4-v1.xlsx
-
Transparent reporting form
- https://cdn.elifesciences.org/articles/77335/elife-77335-transrepform1-v1.docx
Download links
A two-part list of links to download the article, or parts of the article, in various formats.
Downloads (link to download the article as PDF)
Open citations (links to open the citations from this article in various online reference manager services)
Cite this article (links to download the citations from this article in formats compatible with various reference manager tools)
Global hypo-methylation in a proportion of glioblastoma enriched for an astrocytic signature is associated with increased invasion and altered immune landscape
eLife 11:e77335.
https://doi.org/10.7554/eLife.77335


