Tumor elimination by clustered microRNAs miR-306 and miR-79 via noncanonical activation of JNK signaling
- State Key Laboratory of Biocontrol, School of Ecology, Sun Yat-sen University, China
- Laboratory of Genetics, Graduate School of Biostudies, Kyoto University, Yoshida-Konoe-cho, Japan
- Guangzhou Key Laboratory of Insect Development Regulation and Application Research, Institute of Insect Science and Technology & School of Life Sciences, South China Normal University, China
Figures
Figure 1 with 2 supplements
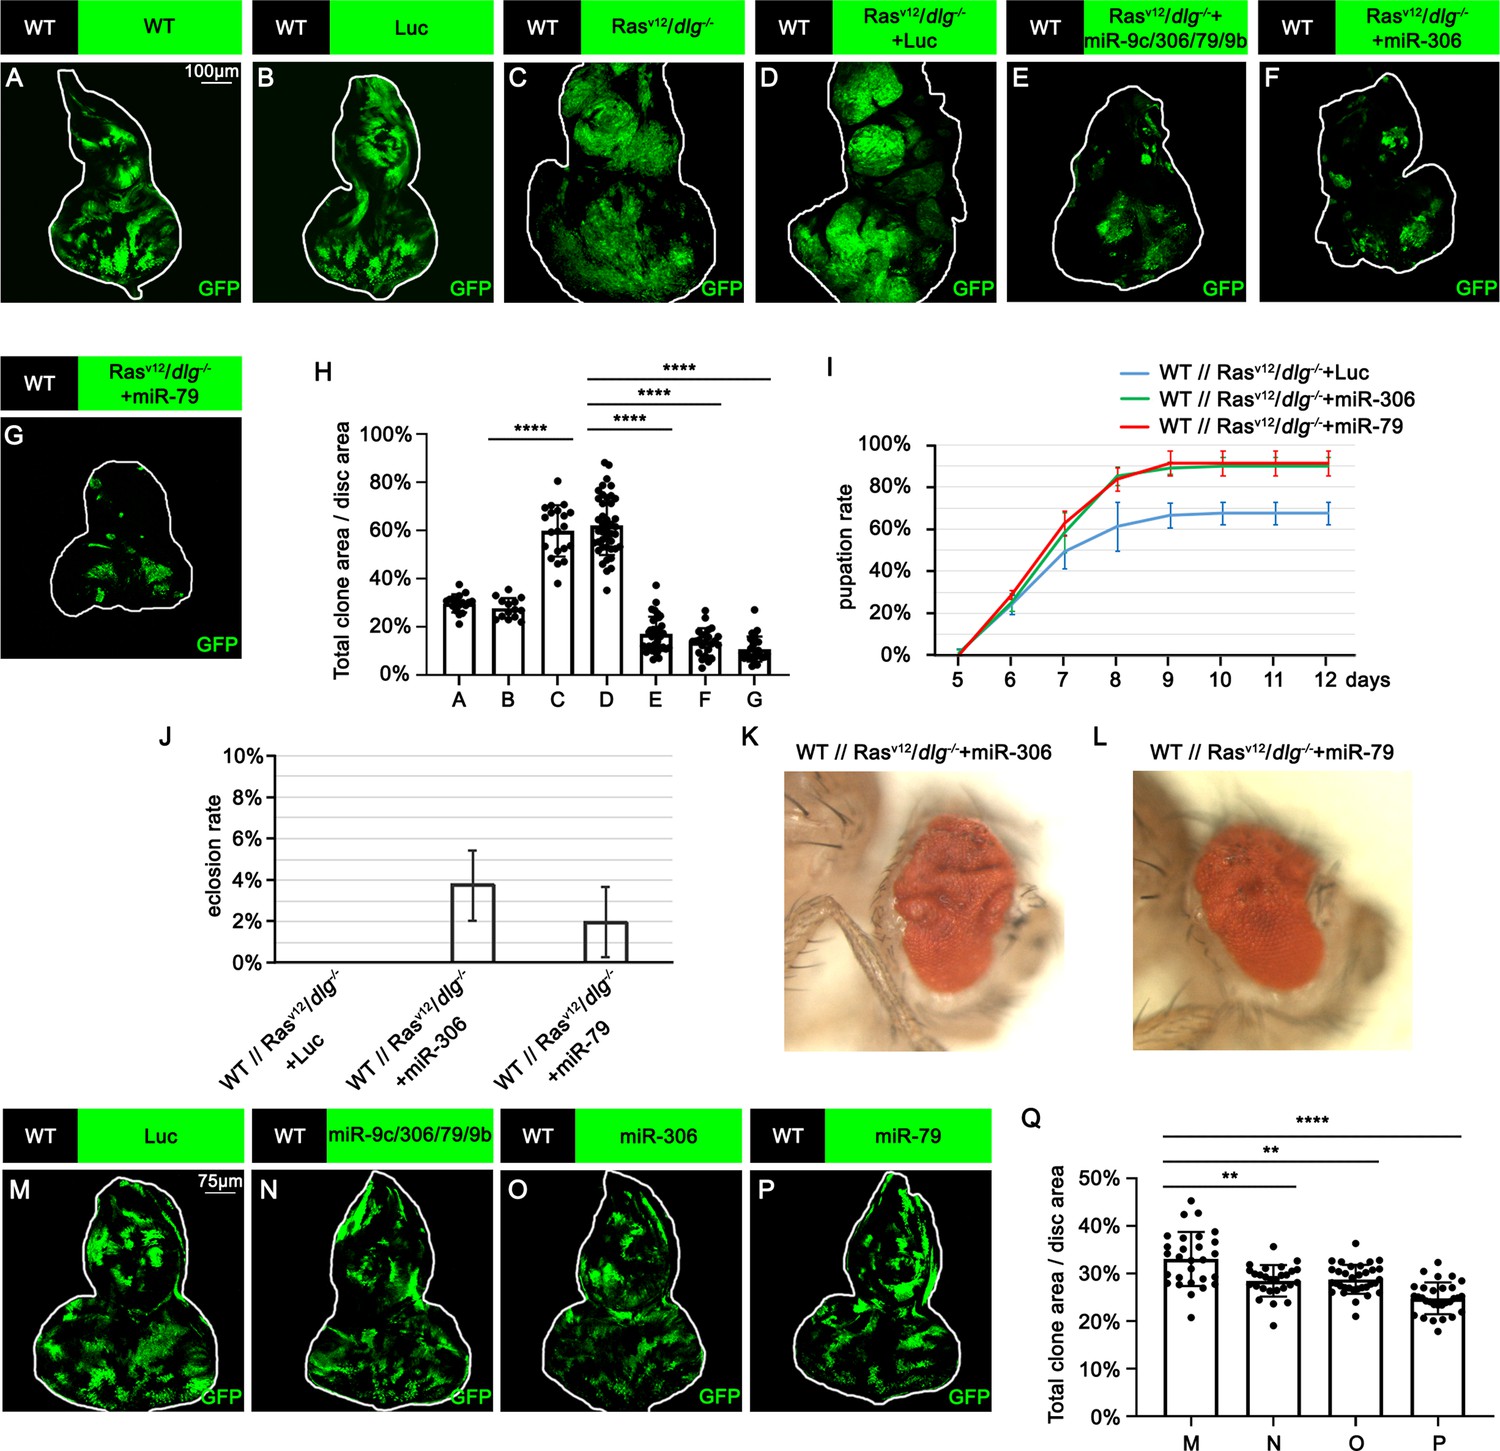
miR-306 and miR-79 suppress RasV12/dlg-/- tumor growth.
(A–G) Eye-antennal disc bearing GFP-labeled clones of indicated genotypes (A and B, 5 days after egg laying, C–G, 7 days after egg laying). (H) Quantification of clone size (% of total clone area per disc area in eye-antennal disc) in (A–G). Error bars, SD; ****p<0.0001 by one-way ANOVA multiple-comparison test. (I) Pupation rate of flies with indicated genotypes. Data from three independent experiment, n > 30 for each group in one experiment; error bars, SD. (J) Eclosion rate of flies with indicated genotypes. Data from three independent experiment, n > 30 for each group in one experiment; error bars, SD. (K, L) Adult eye phenotype of flies with indicated genotypes. (M–P) Eye-antennal disc bearing GFP-labeled clones of indicated genotypes (5 days after egg laying). (Q) Quantification of clone size (% of total clone area per disc area in eye-antennal disc) of (M–P). Error bars, SD; **p<0.01, ****,p<0.0001 by one-way ANOVA multiple-comparison test.
-
Figure 1—source data 1
Quantitative data for Figure 1.
- https://cdn.elifesciences.org/articles/77340/elife-77340-fig1-data1-v2.zip
-
Figure 1—source data 2
Genotypes for Figure 1 and Figure 1—figure supplements 1 and 2.
- https://cdn.elifesciences.org/articles/77340/elife-77340-fig1-data2-v2.zip
Figure 1—figure supplement 1
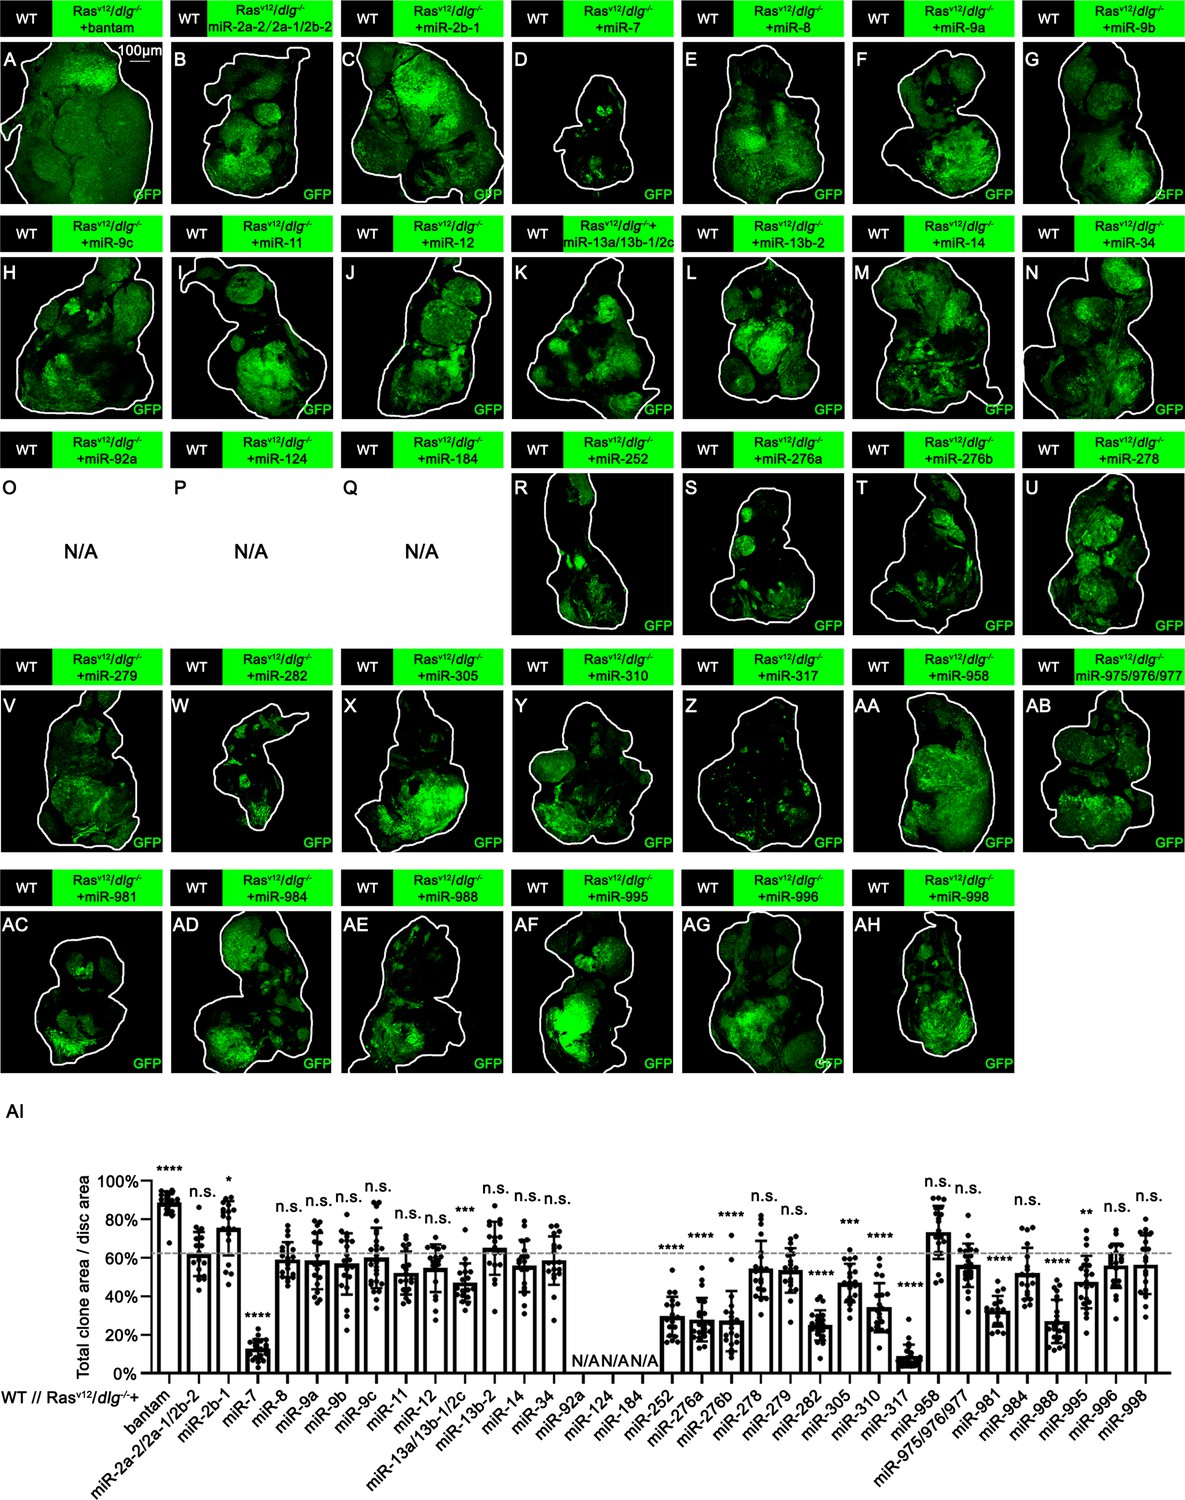
Effect of miRNAs or miRNA clusters on RasV12/dlg-/- tumor growth.
(A–AH) Eye-antennal disc bearing GFP-labeled clones of indicated genotypes (7 days after egg laying). (AI) Quantification of clone size (% of total clone area per disc area in eye-antennal disc) of (A–AH). The relative clone size of WT//Dlg-/-+RasV12+Luc (Figure 1D) is used as control in statistical analysis. The dashed horizontal line shows the relative clone size of WT//Dlg-/-+RasV12+Luc on average (comes from the quantified data in Figure 1H). Error bars, SD; n.s., p>0.05 (not significant), *p<0.05, **p<0.01, ***p<0.001, ****p<0.0001 by one-way ANOVA multiple-comparison test. N/A, no 7-day-old larva available.
-
Figure 1—figure supplement 1—source data 1
Quantitative data for Figure 1—figure supplement 1.
- https://cdn.elifesciences.org/articles/77340/elife-77340-fig1-figsupp1-data1-v2.zip
Figure 1—figure supplement 2
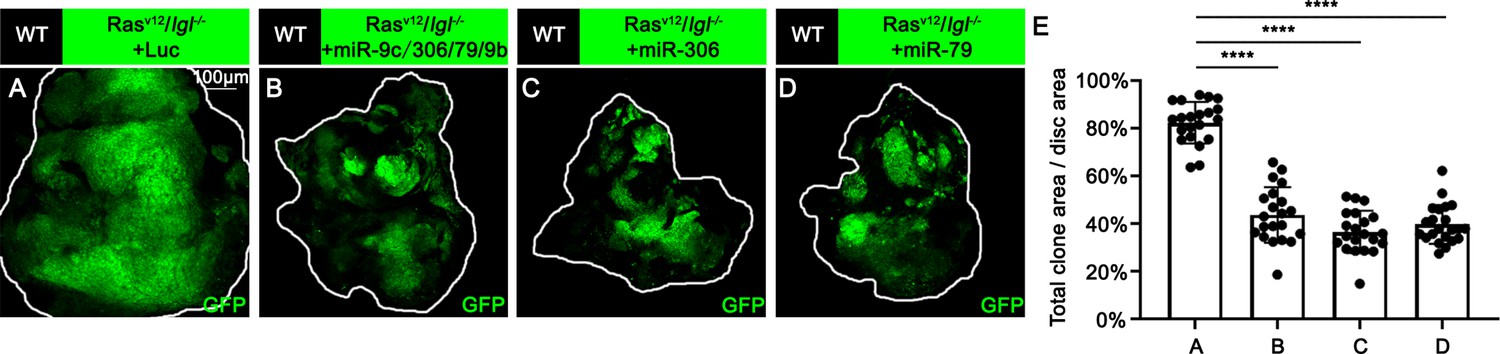
miR-306 and miR-79 suppress RasV12/lgl-/- tumor growth.
(A–D) Eye-antennal disc bearing GFP-labeled clones of indicated genotypes (7 days after egg laying). (E) Quantification of clone size (% of total clone area per disc area in eye-antennal disc) of (A–D). Error bars, SD; ****p<0.0001 by one-way ANOVA multiple-comparison test.
-
Figure 1—figure supplement 2—source data 1
Quantitative data for Figure 1—figure supplement 2.
- https://cdn.elifesciences.org/articles/77340/elife-77340-fig1-figsupp2-data1-v2.zip
Figure 2 with 1 supplement
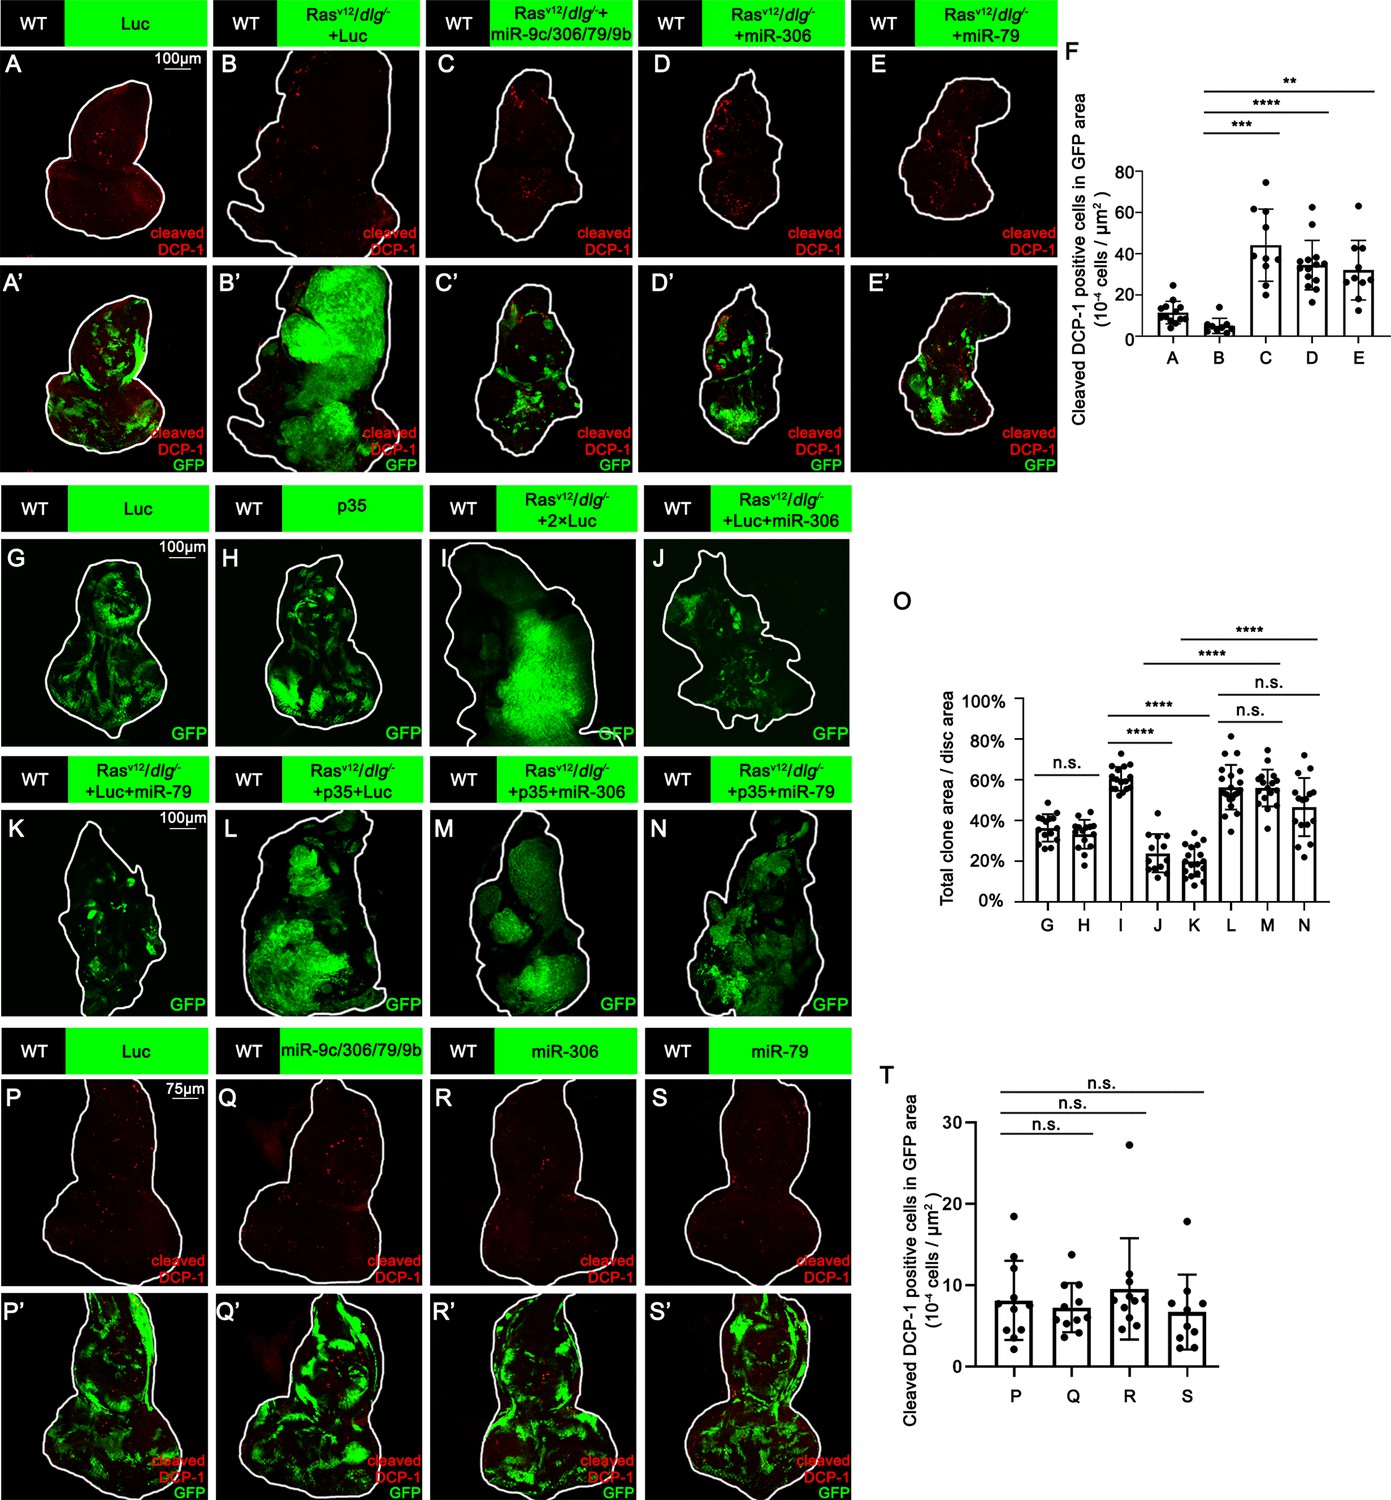
miR-306 and mir-79 suppress RasV12/dlg-/- tumor growth by inducing apoptosis.
(A–E) Eye-antennal disc bearing GFP-labeled clones (A’-E’) of indicated genotypes stained with anti-cleaved Dcp-1 antibody (A-E and A’-E’, A, 5 days after egg laying, B–E, 7 days after egg laying). (F) Quantification of dying cells in GFP-positive clone area in (A–E). Error bars, SD; **p<0.01, ***p<0.001, ****p<0.0001 by one-way ANOVA multiple-comparison test. (G–N) Eye-antennal disc bearing GFP-labeled clones of indicated genotypes (G and H, 5 days after egg laying, I–N, 7 days after egg laying). (O) Quantification of clone size (% of total clone area per disc area in eye-antennal disc) of (G–N). Error bars, SD; n.s., p>0.05 (not significant), ****p<0.0001 by one-way ANOVA multiple-comparison test. (P–S) Eye-antennal disc bearing GFP-labeled clones (P’-S’) of indicated genotypes stained with anti-cleaved Dcp-1 antibody (P-S and P’-S’, 5 days after egg laying). (T) Quantification of dying cells in GFP-positive clone area in (P–S). Error bars, SD; n.s., p>0.05 (not significant) by one-way ANOVA multiple-comparison test.
-
Figure 2—source data 1
Quantitative data for Figure 2.
- https://cdn.elifesciences.org/articles/77340/elife-77340-fig2-data1-v2.zip
-
Figure 2—source data 2
Genotypes for Figure 2 and Figure 2—figure supplement 1.
- https://cdn.elifesciences.org/articles/77340/elife-77340-fig2-data2-v2.zip
Figure 2—figure supplement 1
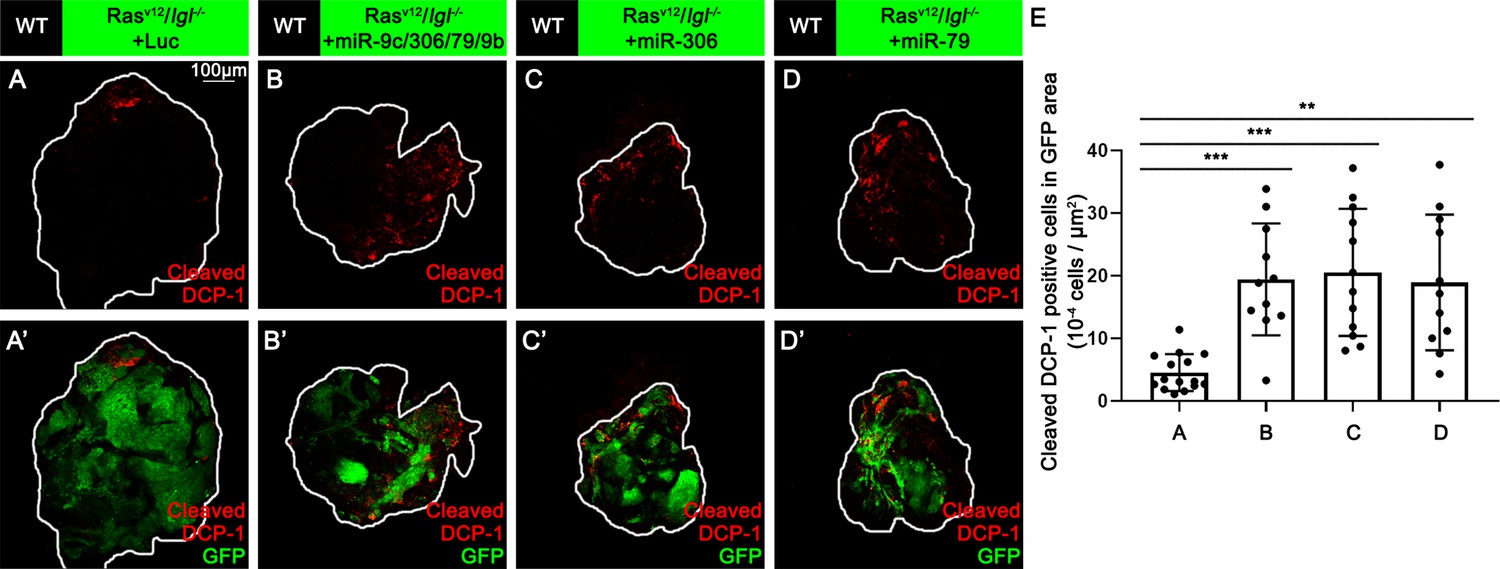
miR-306 and miR-79 induce apoptosis in RasV12/lgl-/- tumors.
(A–D) Eye-antennal disc bearing GFP-labeled clones (A’-D’) of indicated genotypes stained with anti-cleaved Dcp-1 antibody (A-D and A’-D’, 7 days after egg laying). (E) Quantification of dying cells in GFP-positive clone area in (A–D). Error bars, SD; **p<0.01, ***p<0.001 by one-way ANOVA multiple-comparison test.
-
Figure 2—figure supplement 1—source data 1
Quantitative data for Figure 2—figure supplement 1.
- https://cdn.elifesciences.org/articles/77340/elife-77340-fig2-figsupp1-data1-v2.zip
Figure 3 with 3 supplements
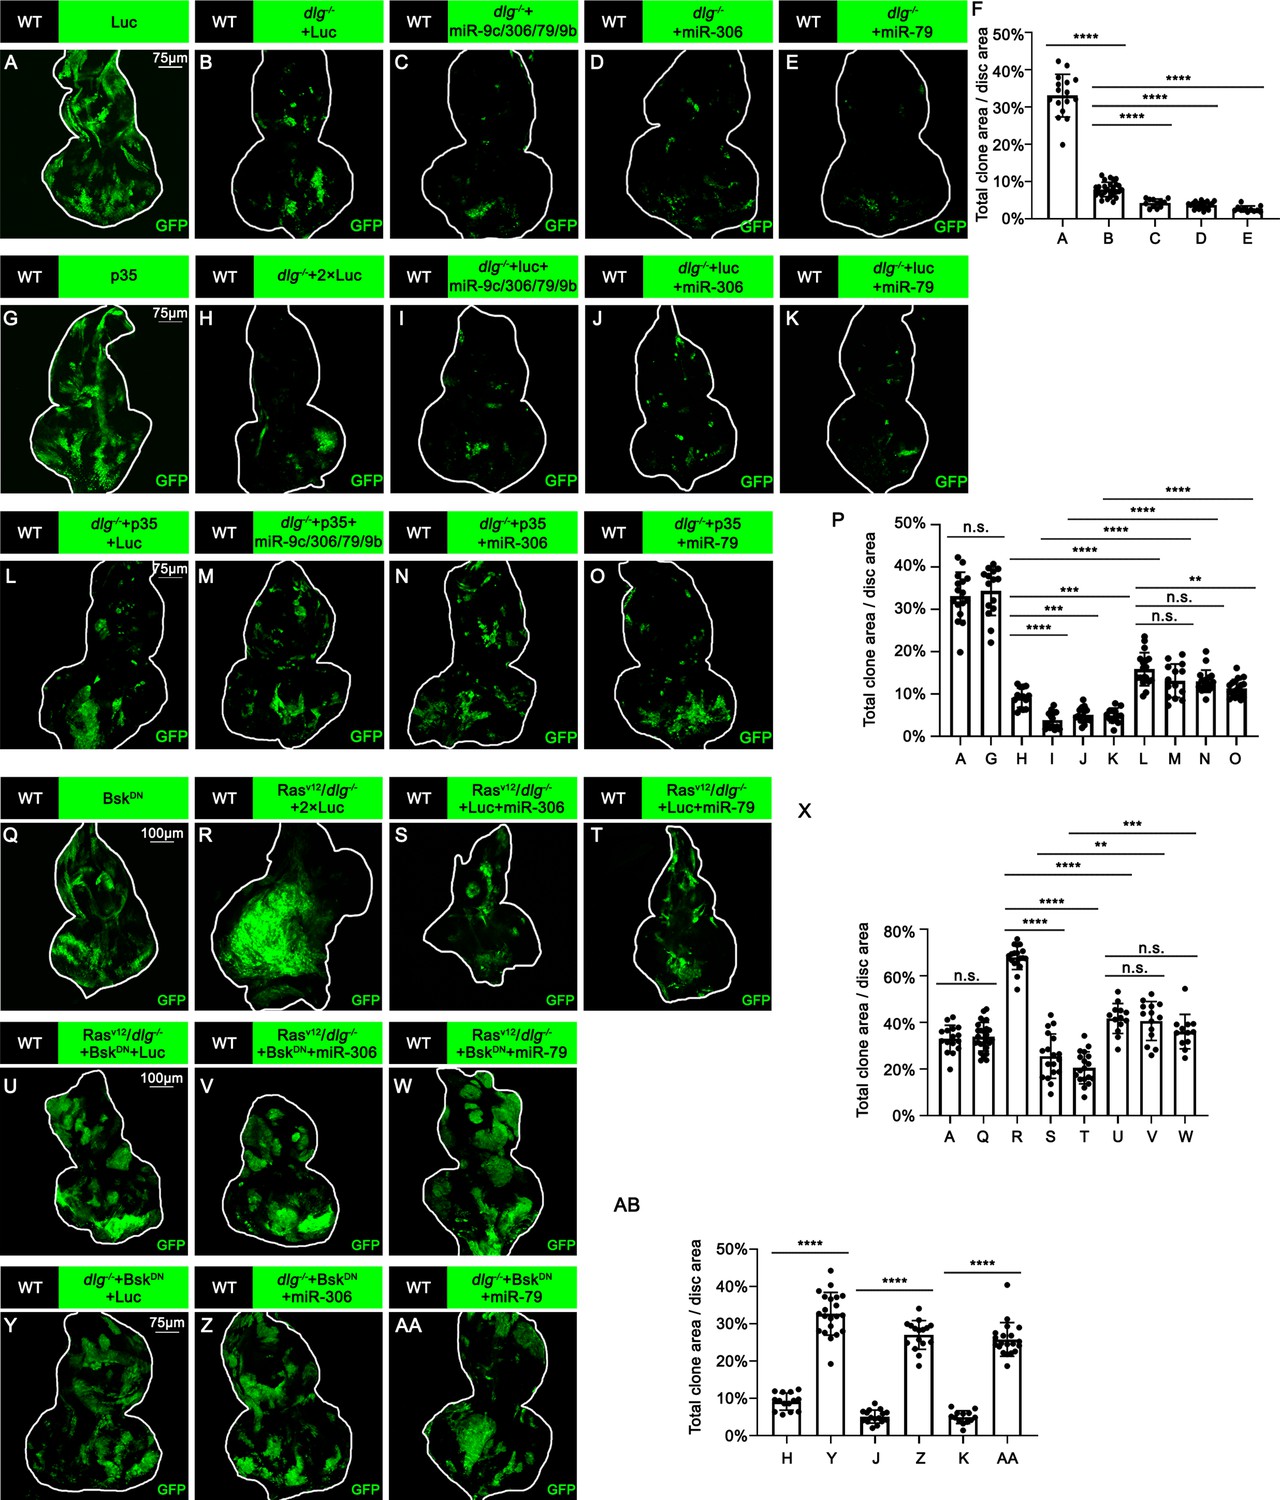
miR-306 and mir-79 suppress tumor growth and promote cell competition by promoting JNK signaling.
(A–E) Eye-antennal disc bearing GFP-labeled clones of indicated genotypes (5 days after egg laying). (F) Quantification of clone size (% of total clone area per disc area in eye-antennal disc) of (A–E). Error bars, SD; ****p<0.0001 by one-way ANOVA multiple-comparison test. (G–O) Eye-antennal disc bearing GFP-labeled clones of indicated genotypes (5 days after egg laying). (P) Quantification of clone size (% of total clone area per disc area in eye-antennal disc) of (A, G–O). Error bars, SD; n.s., p>0.05 (not significant), **p<0.01, ***p<0.001, ****p<0.0001 by one-way ANOVA multiple-comparison test. (Q–W) Eye-antennal disc bearing GFP-labeled clones of indicated genotypes (Q, 5 days after egg laying, R–W, 7 days after egg laying). (X) Quantification of clone size (% of total clone area per disc area in eye-antennal disc) of (A, Q–W). Error bars, SD; n.s., p>0.05 (not significant), **p<0.01, ***p<0.001, ****p<0.0001 by one-way ANOVA multiple-comparison test. (Y–AA) Eye-antennal disc bearing GFP-labeled clones of indicated genotypes (5 days after egg laying). (AB) Quantification of clone size (% of total clone area per disc area in eye-antennal disc) of (H, J, K, Y–AA). Error bars, SD; ****p<0.0001 by one-way ANOVA multiple-comparison test.
-
Figure 3—source data 1
Quantitative data for Figure 3.
- https://cdn.elifesciences.org/articles/77340/elife-77340-fig3-data1-v2.zip
-
Figure 3—source data 2
Genotypes for Figure 3 and Figure 3—figure supplements 1–3.
- https://cdn.elifesciences.org/articles/77340/elife-77340-fig3-data2-v2.zip
Figure 3—figure supplement 1
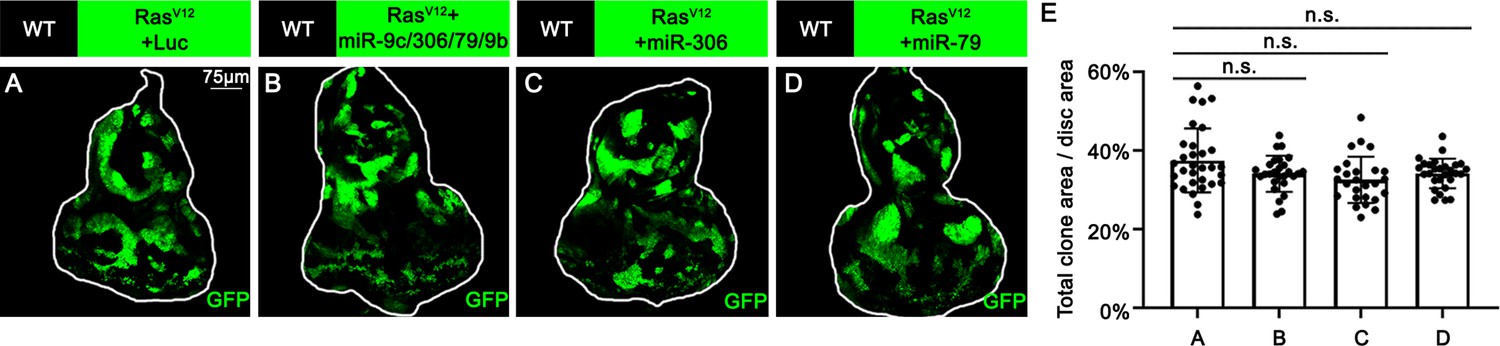
miR-306 and miR-79 do not suppresses RasV12 tumor growth.
(A–D) Eye-antennal disc bearing GFP-labeled clones of indicated genotypes (7 days after egg laying). (E) Quantification of clone size (% of total clone area per disc area in eye-antennal disc) of (A–D). Error bars, SD; n.s., p>0.05 by one-way ANOVA multiple-comparison test.
-
Figure 3—figure supplement 1—source data 1
Quantitative data for Figure 3—figure supplement 1.
- https://cdn.elifesciences.org/articles/77340/elife-77340-fig3-figsupp1-data1-v2.zip
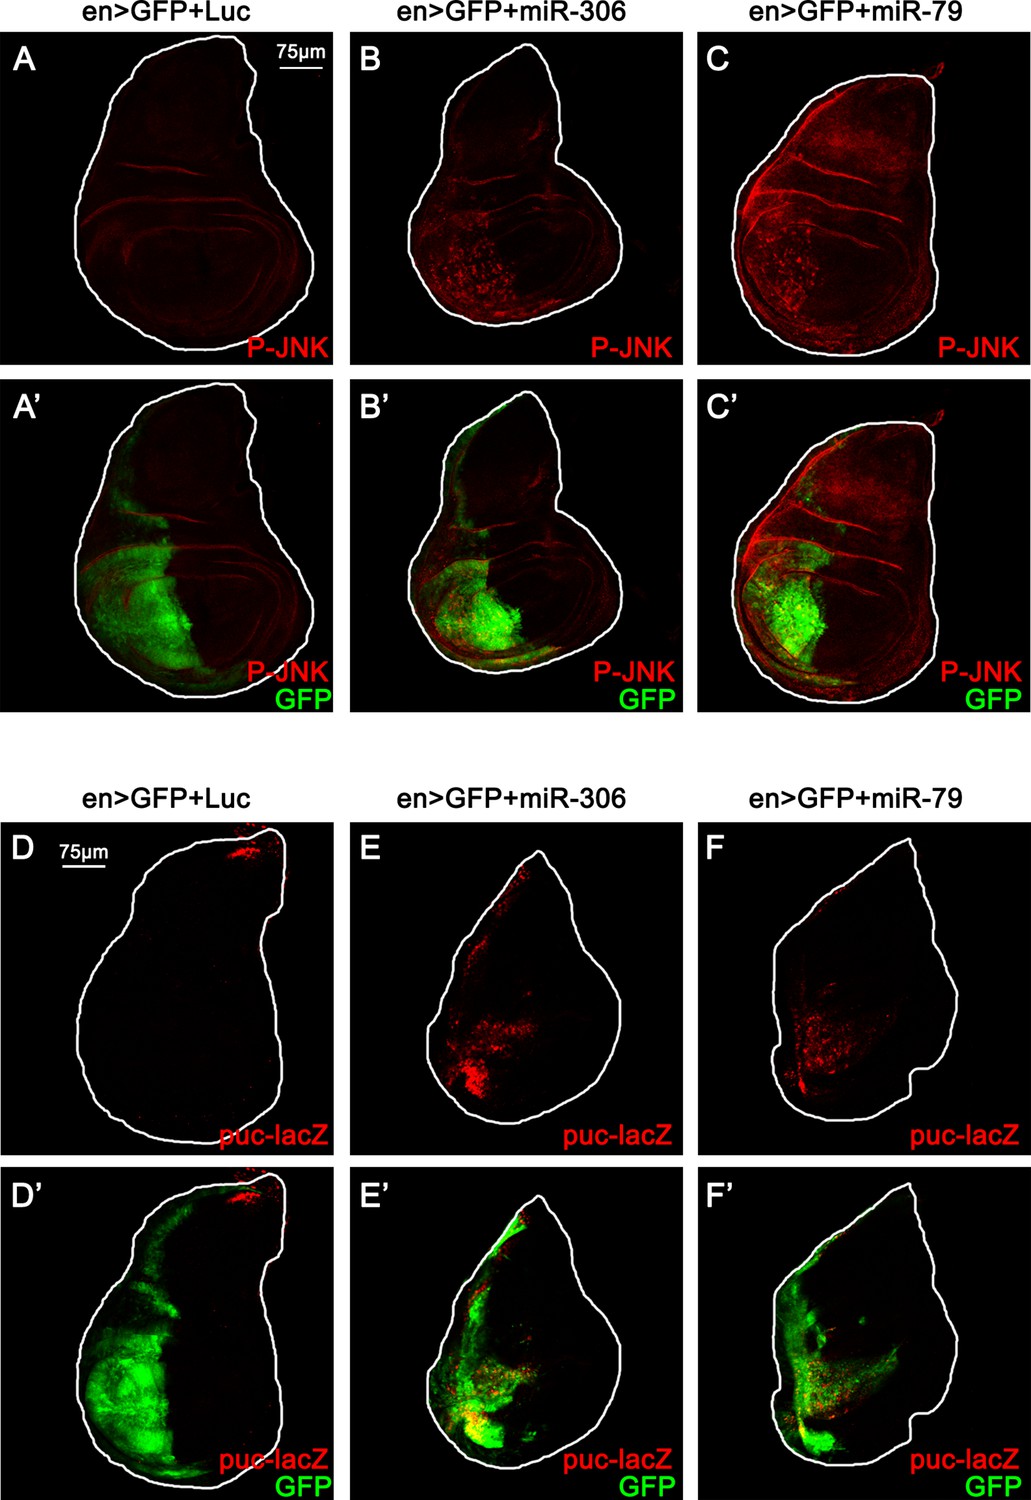
Figure 3—figure supplement 2
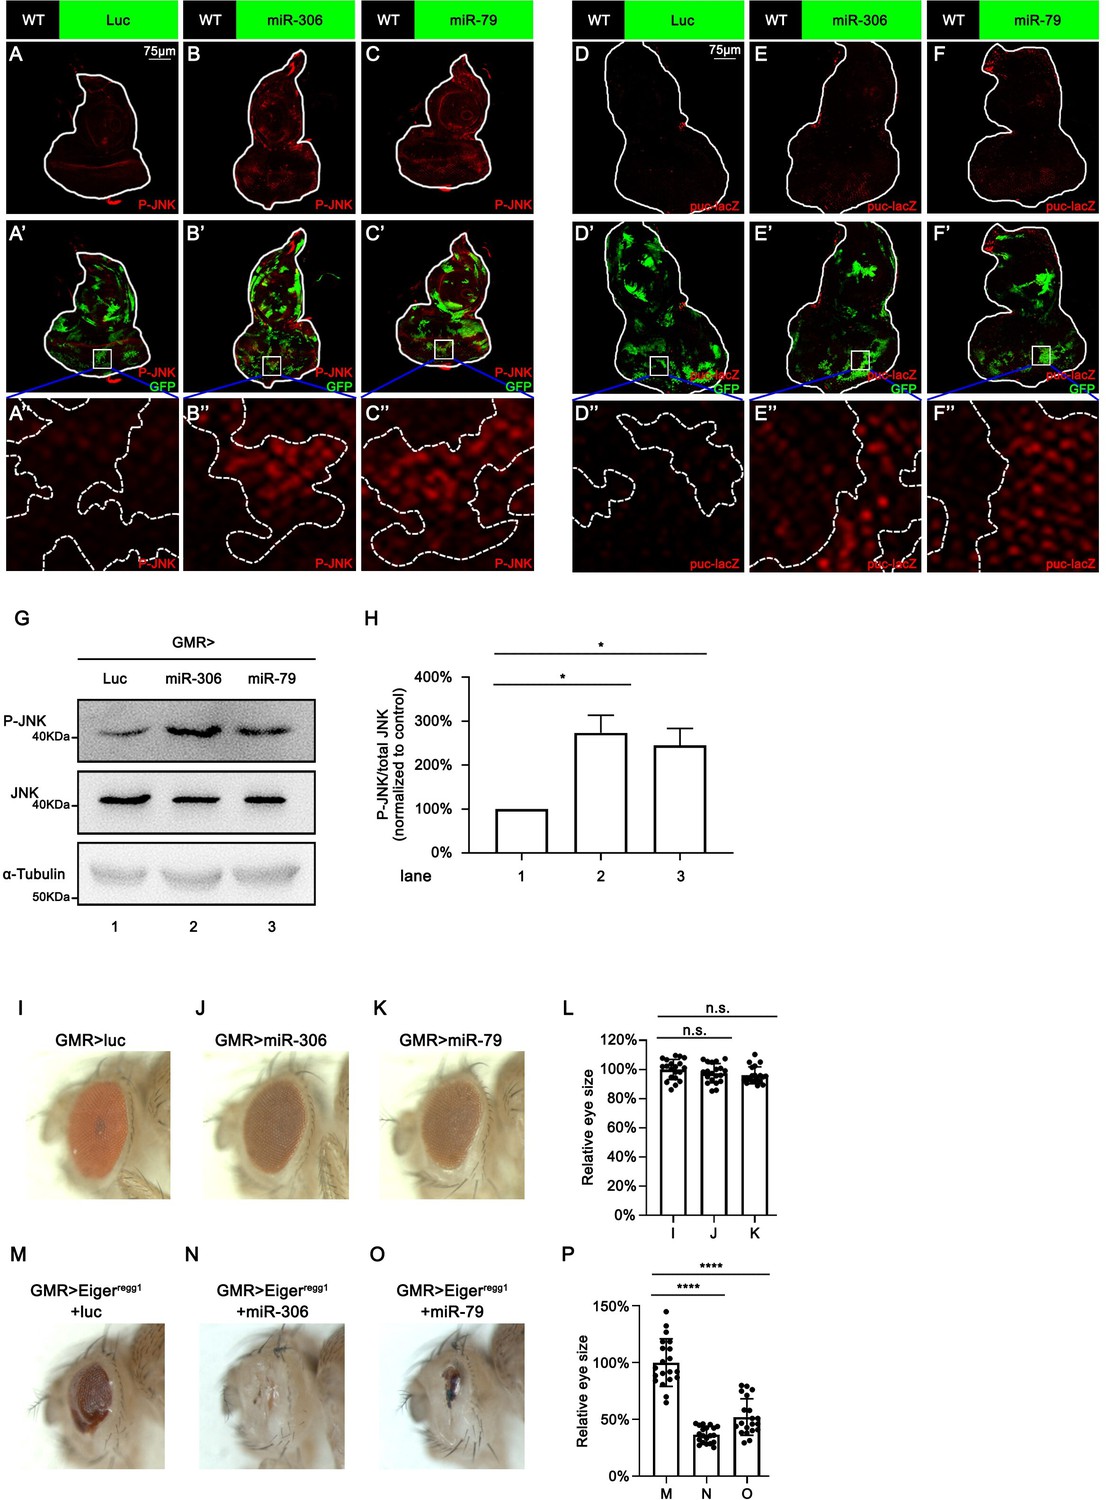
miR-306 and miR-79 promote JNK signaling in the eye-antennal disc and adult eye.
(A–C) Eye-antennal disc bearing GFP-labeled clones (A’-C’) of indicated genotypes stained with anti-phospho-JNK antibody (A-C, A’-C’ and A’’-C’’, 5 days after egg laying). (D–F) Eye-antennal disc bearing GFP-labeled clones (D’-F’) of indicated genotypes in puc-lacZ background stained with anti-β-galactosidase antibody (D-F, D’-F’ and D’’-F’’, 5 days after egg laying). (G) Lysates of adult head of indicated genotypes were subjected to Western blots using indicated antibodies. (H) Quantification of relative P-JNK signaling in (G) from three independent experiments. Error bars, SD; *, p<0.05 by one-way ANOVA multiple-comparison test. (I–K) Adult eye phenotype of flies with indicated genotypes. (L) Quantification of adult eye size (normalized to control) of (I–K). Error bars, SD; n.s., p>0.05 by one-way ANOVA multiple-comparison test. (M–O) Adult eye phenotype of flies with indicated genotypes. (P) Quantification of adult eye size (normalized to control) of (M–O). Error bars, SD; ****p<0.0001 by one-way ANOVA multiple-comparison test.
-
Figure 3—figure supplement 2—source data 1
Quantitative data or raw data for Figure 3—figure supplement 2.
- https://cdn.elifesciences.org/articles/77340/elife-77340-fig3-figsupp2-data1-v2.zip
Figure 3—figure supplement 3

miR-306 and miR-79 suppress RasV12/lgl-/- tumor growth by promoting JNK signaling.
(A–C) Eye-antennal disc bearing GFP-labeled clones of indicated genotypes (7 days after egg laying). (D) Quantification of clone size (% of total clone area per disc area in eye-antennal disc) of indicated genotypes. The quantified data in Figure 1—figure supplement 2E are used as control (columns 1, 3, and 5). Error bars, SD; n.s., p>0.05 (not significant), ****p<0.0001 by one-way ANOVA multiple-comparison test. (E–J) Eye-antennal disc bearing GFP-labeled clones of indicated genotypes (5 days after egg laying). (K) Quantification of clone size (% of total clone area per disc area in eye-antennal disc) of (E–J). Error bars, SD; n.s., p>0.05 (not significant), ****p<0.0001 by one-way ANOVA multiple-comparison test.
-
Figure 3—figure supplement 3—source data 1
Quantitative data for Figure 3—figure supplement 3.
- https://cdn.elifesciences.org/articles/77340/elife-77340-fig3-figsupp3-data1-v2.zip
Figure 4 with 3 supplements
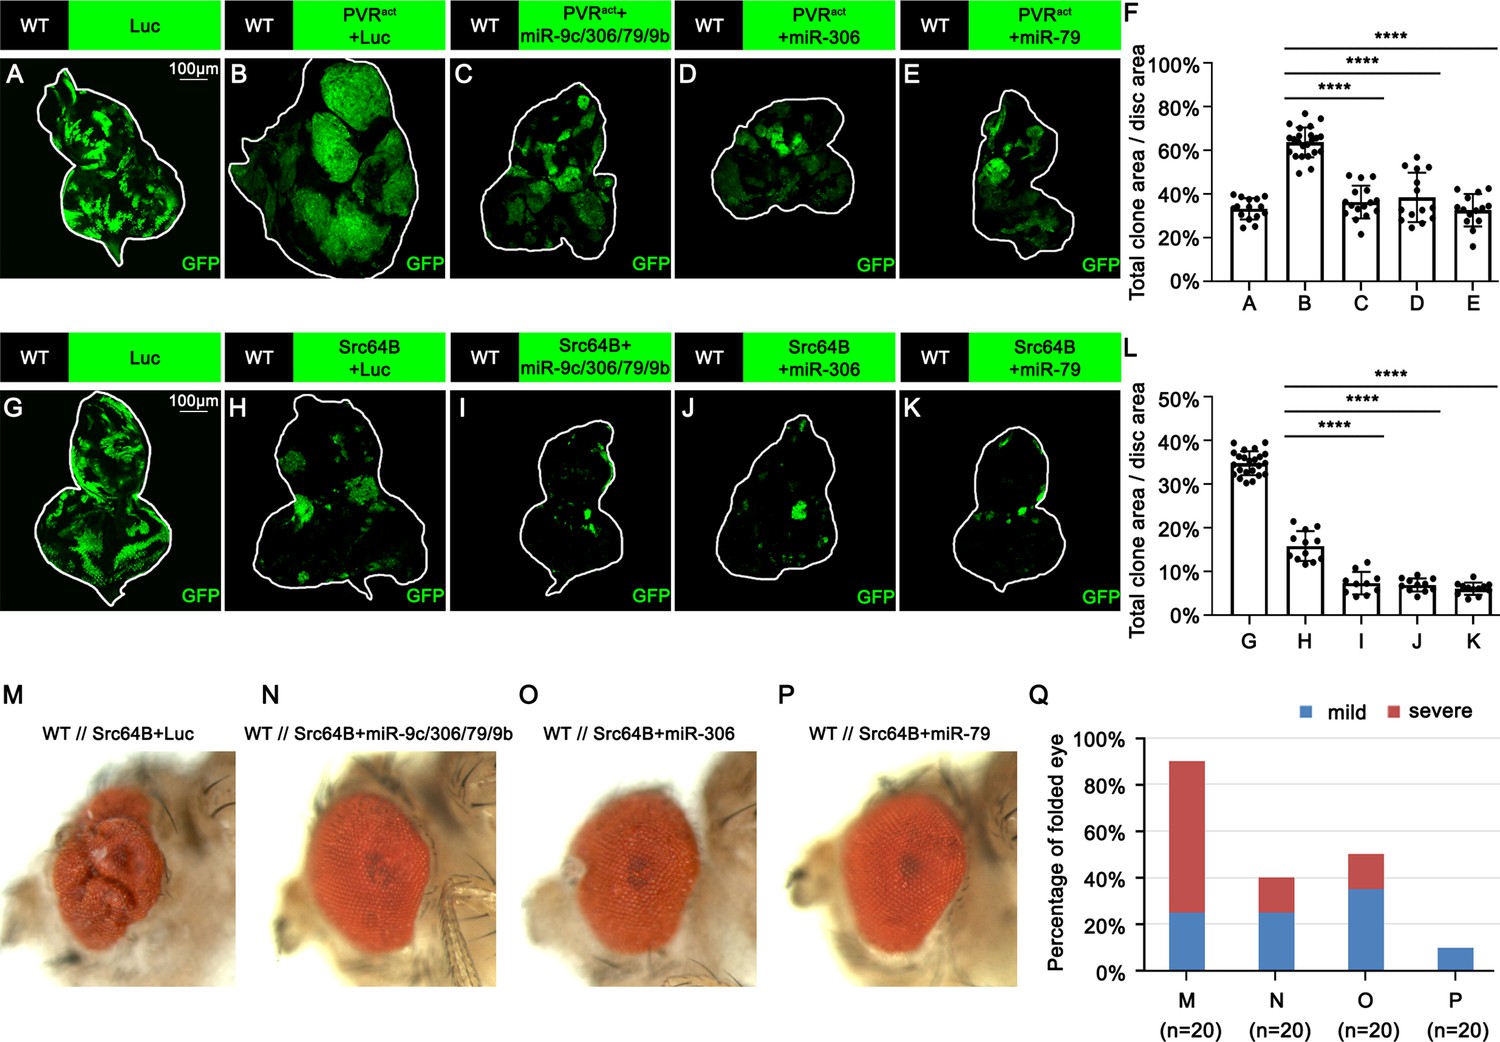
miR-306 and miR-79 suppress growth of multiple types of tumor models.
(A–E) Eye-antennal disc bearing GFP-labeled clones of indicated genotypes (A, 5 days after egg laying, B–E, 7 days after egg laying). (F) Quantification of clone size (% of total clone area per disc area in eye-antennal disc) of (A–E). Error bars, SD; ****p<0.0001 by one-way ANOVA multiple-comparison test. (G–K) Eye-antennal disc bearing GFP-labeled clones of indicated genotypes (G, 5 days after egg laying, H–K, 6 days after egg laying). (L) Quantification of clone size (% of total clone area per disc area in eye-antennal disc) of (G–K). Error bars, SD; ****p<0.0001 by one-way ANOVA multiple-comparison test. (M–P) Adult eye phenotype of flies with indicated genotypes. (Q) Quantification of percentage of folded eye in (M–P). n = 20 for each group.
-
Figure 4—source data 1
Quantitative data for Figure 4.
- https://cdn.elifesciences.org/articles/77340/elife-77340-fig4-data1-v2.zip
-
Figure 4—source data 2
Genotypes for Figure 4 and Figure 4—figure supplements 1–3.
- https://cdn.elifesciences.org/articles/77340/elife-77340-fig4-data2-v2.zip
Figure 4—figure supplement 1
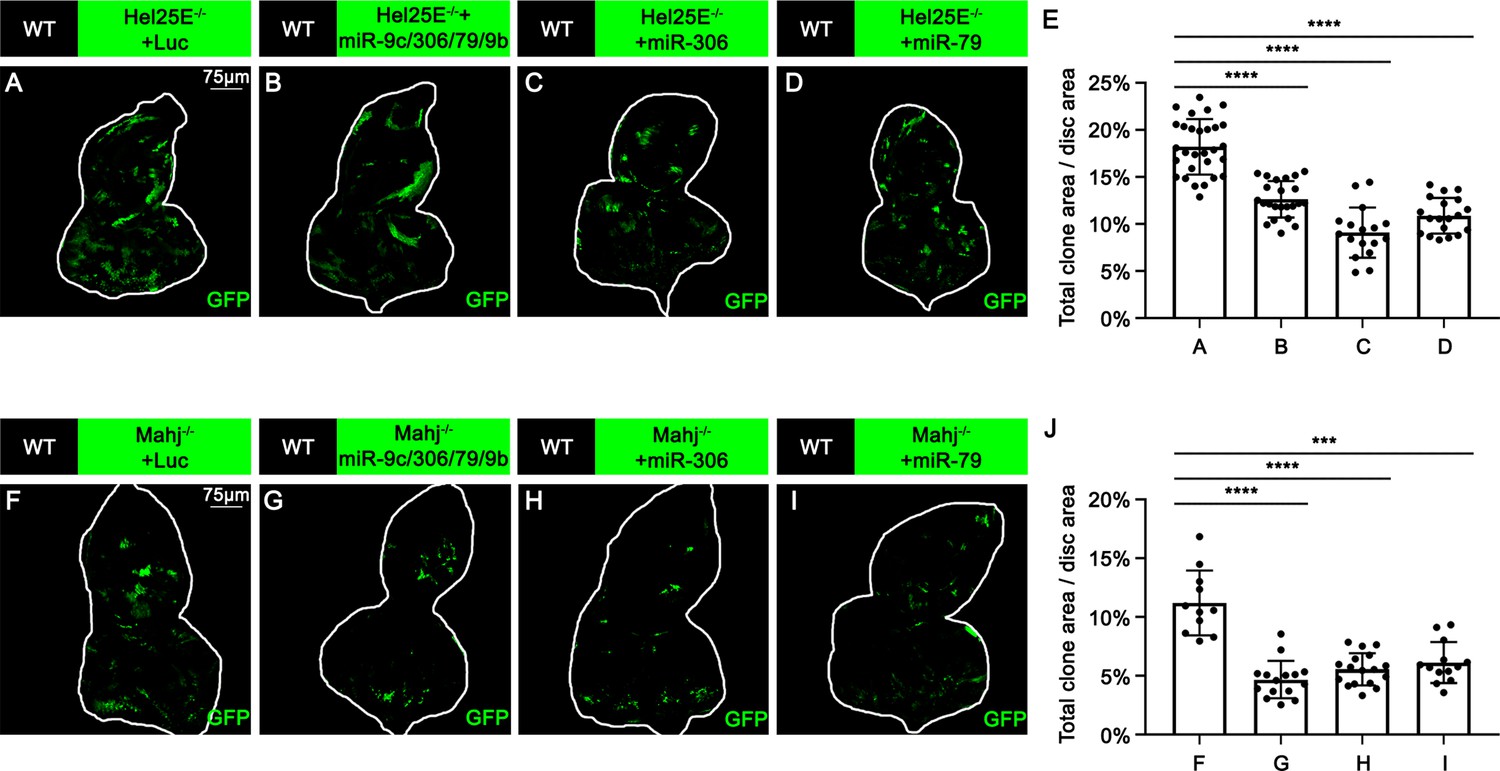
miR-306 and miR-79 promote multiple types of cell competition.
(A–D) Eye-antennal disc bearing GFP-labeled clones of indicated genotypes (5 days after egg laying). (E) Quantification of clone size (% of total clone area per disc area in eye-antennal disc) of (A–D). Error bars, SD; ****p<0.0001 by one-way ANOVA multiple-comparison test. (F–I) Eye-antennal disc bearing GFP-labeled clones of indicated genotypes (5 days after egg laying). (J) Quantification of clone size (% of total clone area per disc area in eye-antennal disc) of (F–I). Error bars, SD; ***p<0.001, ****p<0.0001 by one-way ANOVA multiple-comparison test.
-
Figure 4—figure supplement 1—source data 1
Quantitative data for Figure 4—figure supplement 1.
- https://cdn.elifesciences.org/articles/77340/elife-77340-fig4-figsupp1-data1-v2.zip
Figure 4—figure supplement 2

miR-306 and miR-79 enhance JNK signaling in multiple types of tumors or cell competition models.
(A–O) Eye-antennal disc bearing GFP-labeled clones (A’-O’) of indicated genotypes stained with anti-phospho-JNK antibody (A-O and A’-O’, A–F, 7 days after egg laying, G–I, 6 days after egg laying, J–O, 5 days after egg laying). (P) Quantification of the p-JNK signaling (% P-JNK-positive area in GFP-positive area) of (A–O). Error bars, SD; *p<0.05, **p<0.01, ***p<0.001 by one-way ANOVA multiple-comparison test.
-
Figure 4—figure supplement 2—source data 1
Quantitative data for Figure 4—figure supplement 2.
- https://cdn.elifesciences.org/articles/77340/elife-77340-fig4-figsupp2-data1-v2.zip
Figure 4—figure supplement 3
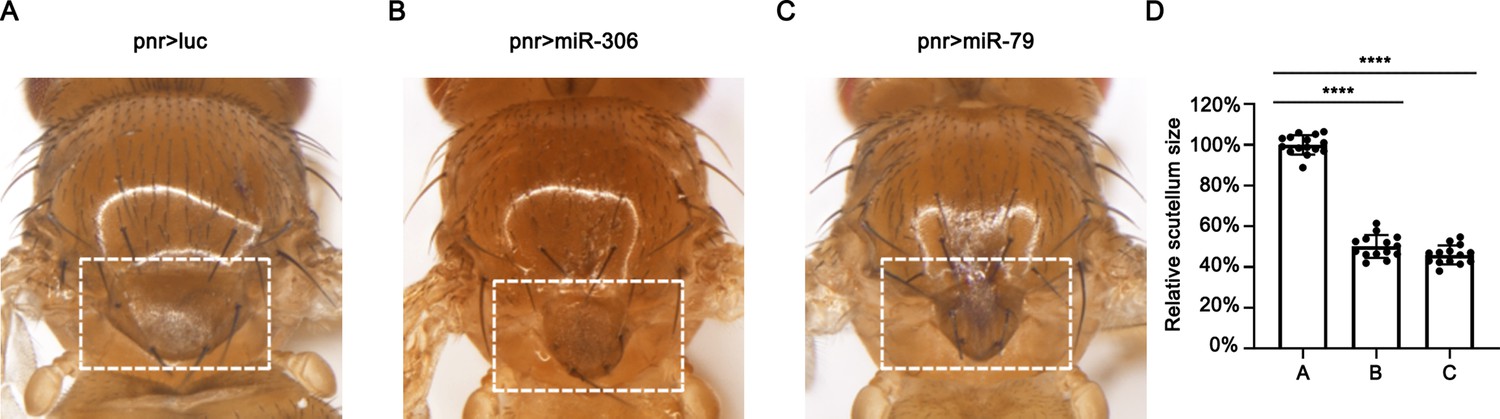
miR-306 and miR-79 enhance normally occurring JNK activity.
(A–C) Adult scutellum phenotypes of flies with indicated genotypes. (D) Quantification of scutellum size of (A–C). Error bars, SD; ****p<0.0001 by one-way ANOVA multiple-comparison test.
-
Figure 4—figure supplement 3—source data 1
Quantitative data for Figure 4—figure supplement 3.
- https://cdn.elifesciences.org/articles/77340/elife-77340-fig4-figsupp3-data1-v2.zip
Figure 5 with 6 supplements
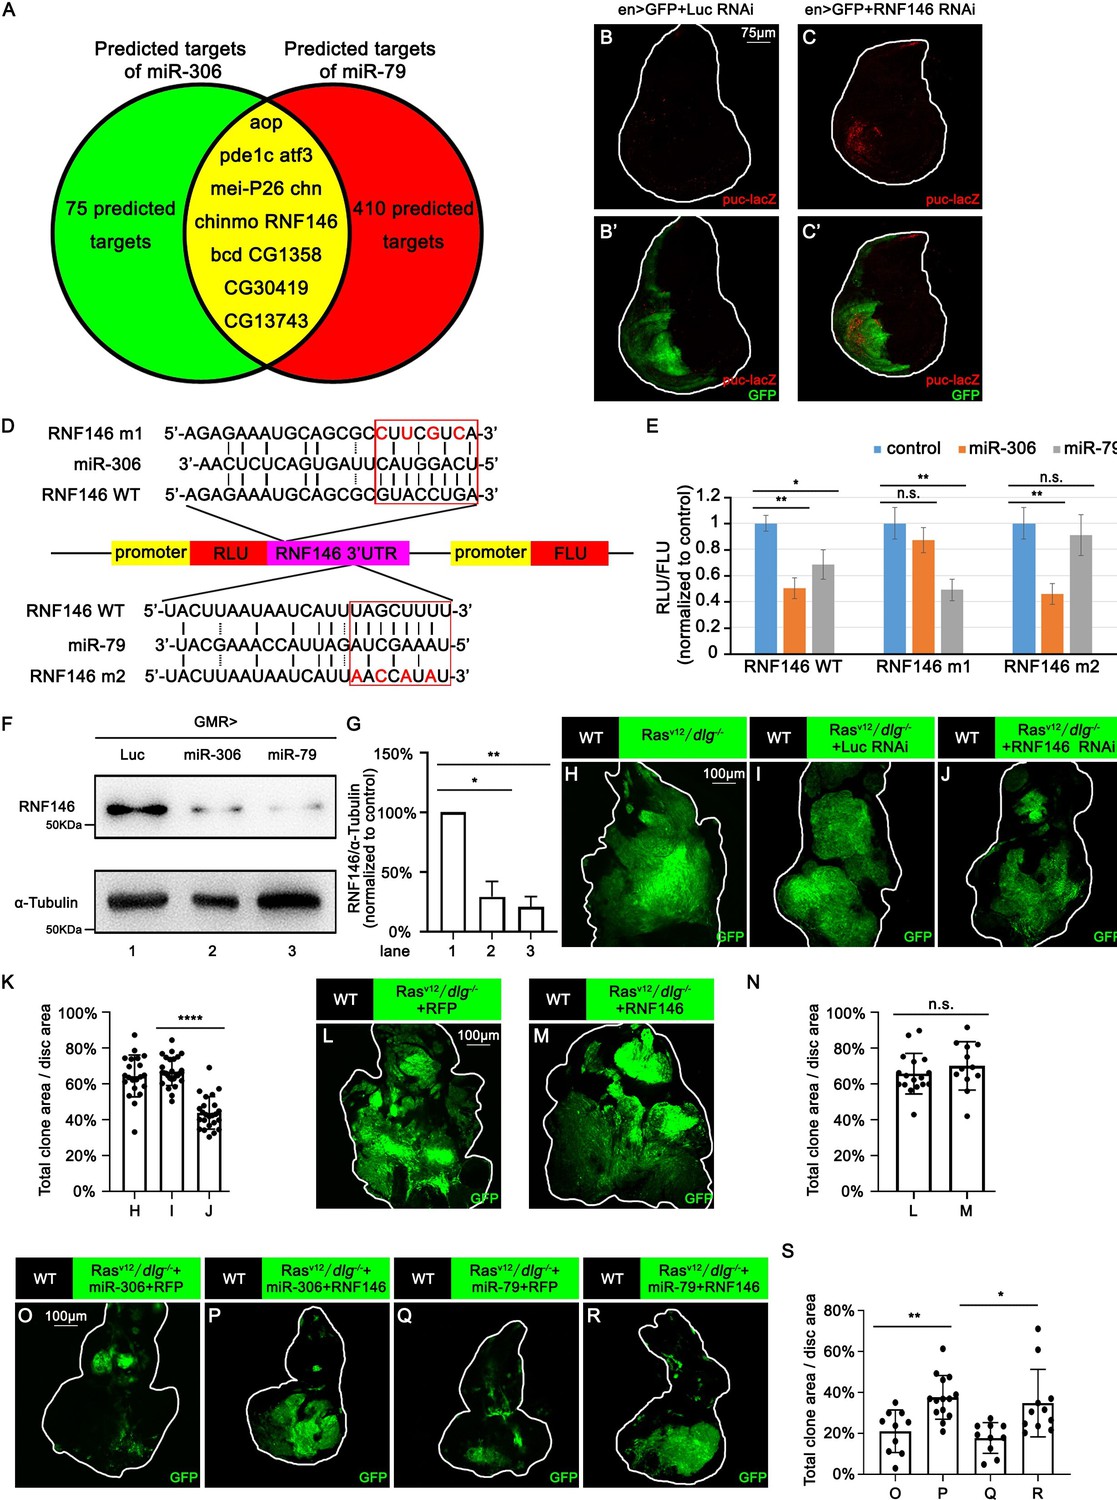
miR-306 and mir-79 suppress tumor growth and promote cell competition by targeting RNF146.
Predicted targets of miR-306 and miR-79. (B, C) Wing disc of indicated genotypes with puc-lacZ background stained with anti-β-galactosidase antibody (B,C and B’, C’, 5 or 6 days after egg laying). (D) Schematic of the wild-type and mutation-type 3′UTR vector with miRNA binding sites for miR-306 and miR-79, respectively. Red letters shows the mutation sites. Red box shows the seed sequence pairing region. (E) RLU/FLU rate from dual-luciferase assay. n = 3, error bars, SD; n.s., p>0.05 (not significant), **p<0.01 by two-tailed Student’s t-test. (F) Lysates of adult heads of indicated genotypes were subjected to Western blots using indicated antibodies. (G) Quantification of relative levels of RNF146 protein in (F) from three independent experiments. Error bars, SD; *p<0.05, **p<0.01 by one-way ANOVA multiple-comparison test. (H–J) Eye-antennal disc bearing GFP-labeled clones of indicated genotypes (7 days after egg laying). (K) Quantification of clone size (% of total clone area per disc area in eye-antennal disc) of (H–J). Error bars, SD; ****p<0.0001 by two-tailed Student’s t-test. (L–M) Eye-antennal disc bearing GFP-labeled clones of indicated genotypes (7 days after egg laying). (N) Quantification of clone size (% of total clone area per disc area in eye-antennal disc) of (L–M). Error bars, SD; n.s., p>0.05 (not significant) by two-tailed Student’s t-test. (O–R) Eye-antennal disc bearing GFP-labeled clones of indicated genotypes (7 days after egg laying). (S) Quantification of clone size (% of total clone area per disc area in eye-antennal disc) of (O–R). Error bars, SD; *p<0.05, **p<0.01 by one-way ANOVA multiple-comparison test.
-
Figure 5—source data 1
Quantitative data or raw data for Figure 5.
- https://cdn.elifesciences.org/articles/77340/elife-77340-fig5-data1-v2.zip
-
Figure 5—source data 2
Genotypes for Figure 5 and Figure 5—figure supplements 1–6.
- https://cdn.elifesciences.org/articles/77340/elife-77340-fig5-data2-v2.zip
Figure 5—figure supplement 1
miR-306 and miR-79 promote JNK signaling in the wing disc.
(A–C) Wing disc of indicated genotypes stained with anti-phospho-JNK antibody (A-C and A’-C’, 5 or 6 days after egg laying). (D–F) Wing disc of indicated genotypes with puc-lacZ background stained with anti-β-galactosidase antibody (D-F and D’-F’, 5 or 6 days after egg laying).
Figure 5—figure supplement 2

RNAis that target eight candidate genes do not induce JNK activation in the wing disc.
(A–H) Wing disc of indicated genotypes with puc-lacZ background stained with anti-β-galactosidase antibody (A-H and A’-H’, 5 or 6 days after egg laying).
Figure 5—figure supplement 3

Suppression of miR-306 and miR-79 functions promotes RNF146 protein level.
(A) Lysates of adult heads of indicated genotypes were subjected to Western blots using indicated antibodies. (B) Quantification of relative levels of RNF146 protein in (A) from three independent experiments. Error bars, SD; *p<0.05 by two-tailed Student’s t-test.
-
Figure 5—figure supplement 3—source data 1
Quantitative data or raw data for Figure 5—figure supplement 3.
- https://cdn.elifesciences.org/articles/77340/elife-77340-fig5-figsupp3-data1-v2.zip
Figure 5—figure supplement 4
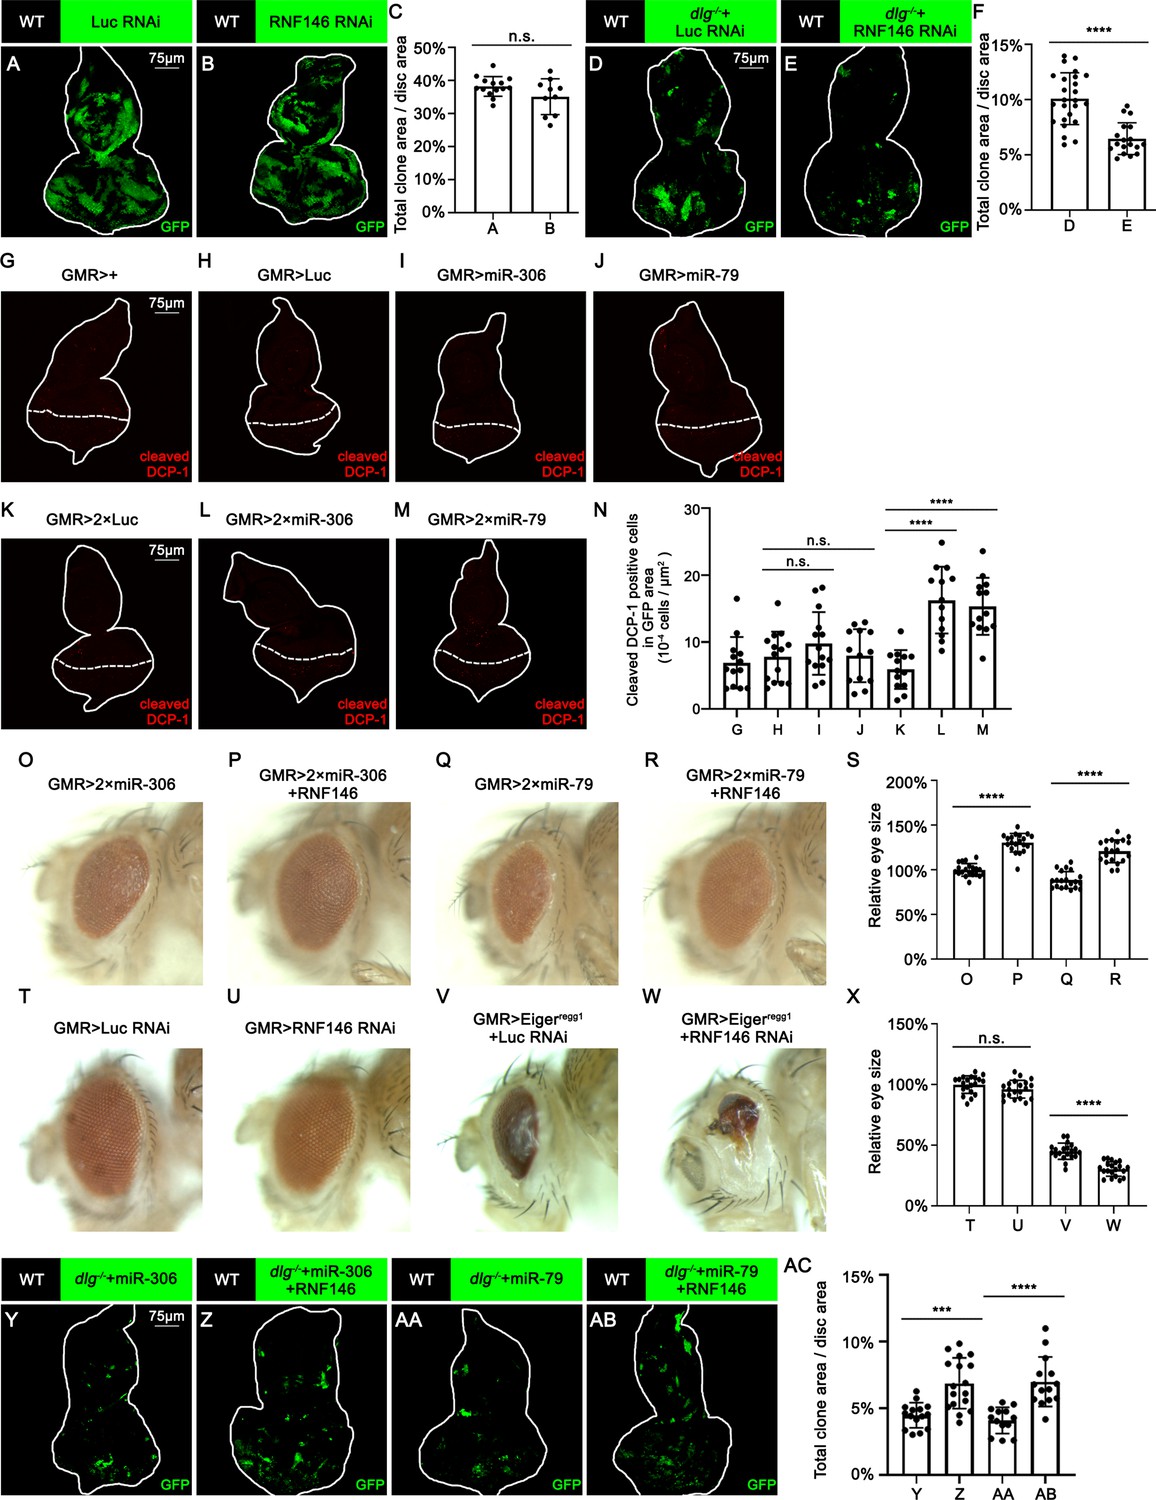
miR-306 and miR-79 promote cell competition by targeting RNF146.
(A, B) Eye-antennal disc bearing GFP-labeled clones of indicated genotypes (5 days after egg laying). (C) Quantification of clone size (% of total clone area per disc area in eye-antennal disc) of (A, B). Error bars, SD; n.s., p>0.05 (not significant) by two-tailed Student’s t-test. (D, E) Eye-antennal disc bearing GFP-labeled clones of indicated genotypes (5 days after egg laying). (F) Quantification of clone size (% of total clone area per disc area in eye-antennal disc) of (D, E). Error bars, SD; ****p<0.0001 by two-tailed Student’s t-test. (G–M) Eye-antennal disc bearing GFP-labeled clones of indicated genotypes stained with anti-cleaved Dcp-1 antibody (5 days after egg laying). (N) Quantification of dying cells in GMR-Gal4 expressing area in (G–M). Error bars, SD; n.s., p>0.05 (not significant), ****p<0.0001 by one-way ANOVA multiple-comparison test. (O–R) Adult eye phenotype of flies with indicated genotypes. (S) Quantification of adult eye size (normalized to control) of (O–R). Error bars, SD; ****p<0.0001 by one-way ANOVA multiple-comparison test. (T–W) Adult eye phenotype of flies with indicated genotypes. (X) Quantification of adult eye size (normalized to control) of (T–W). Error bars, SD; n.s., p>0.05 (not significant), ****p<0.0001 by one-way ANOVA multiple-comparison test. (Y–AB) Eye-antennal disc bearing GFP-labeled clones of indicated genotypes (5 days after egg laying). (AC) Quantification of clone size (% of total clone area per disc area in eye-antennal disc) of (Y–AB). Error bars, SD; ***p<0.001, ****p<0.0001 by one-way ANOVA multiple-comparison test.
-
Figure 5—figure supplement 4—source data 1
Quantitative data for Figure 5—figure supplement 4.
- https://cdn.elifesciences.org/articles/77340/elife-77340-fig5-figsupp4-data1-v2.zip
Figure 5—figure supplement 5
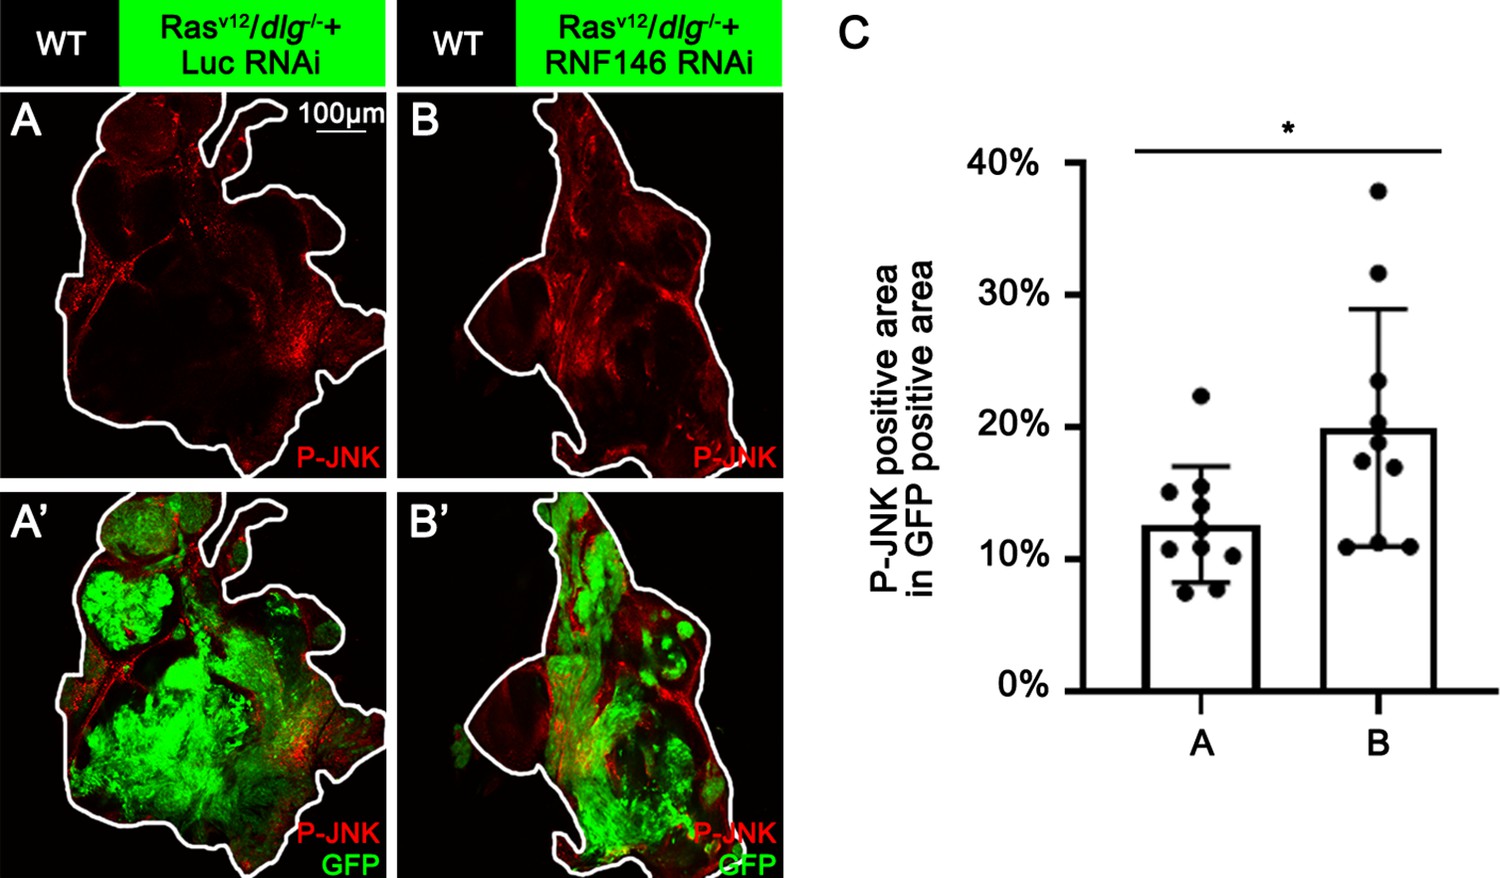
Knocking down of RNF146 promotes JNK phosphorylation in RasV12/dlg-/- tumor.
(A, B) Eye-antennal disc bearing GFP-labeled clones (A’, B’) of indicated genotypes (A, B and A’, B’, 7 days after egg laying). (C) Quantification of P-JNK signaling (% P-JNK-positive area in GFP-positive area) of (A, B). Error bars, SD; *p<0.05 by two-tailed Student’s t-test.
-
Figure 5—figure supplement 5—source data 1
Quantitative data for Figure 5—figure supplement 5.
- https://cdn.elifesciences.org/articles/77340/elife-77340-fig5-figsupp5-data1-v2.zip
Figure 5—figure supplement 6
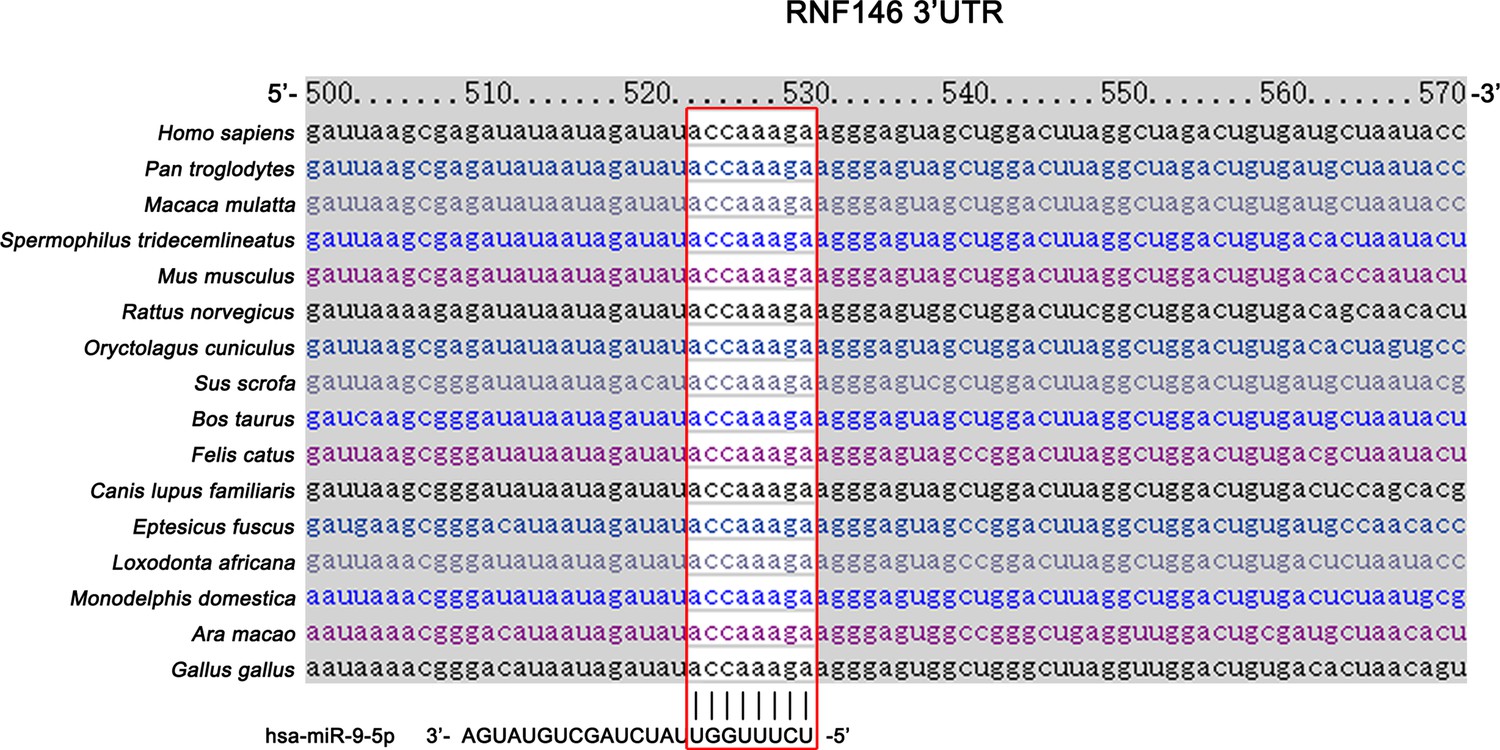
miR-9 is predicted to target mammalian RNF146.
Schematic of the miRNA binding sites for miR-9. Red box shows the seed sequence pairing region.
Figure 6 with 1 supplement
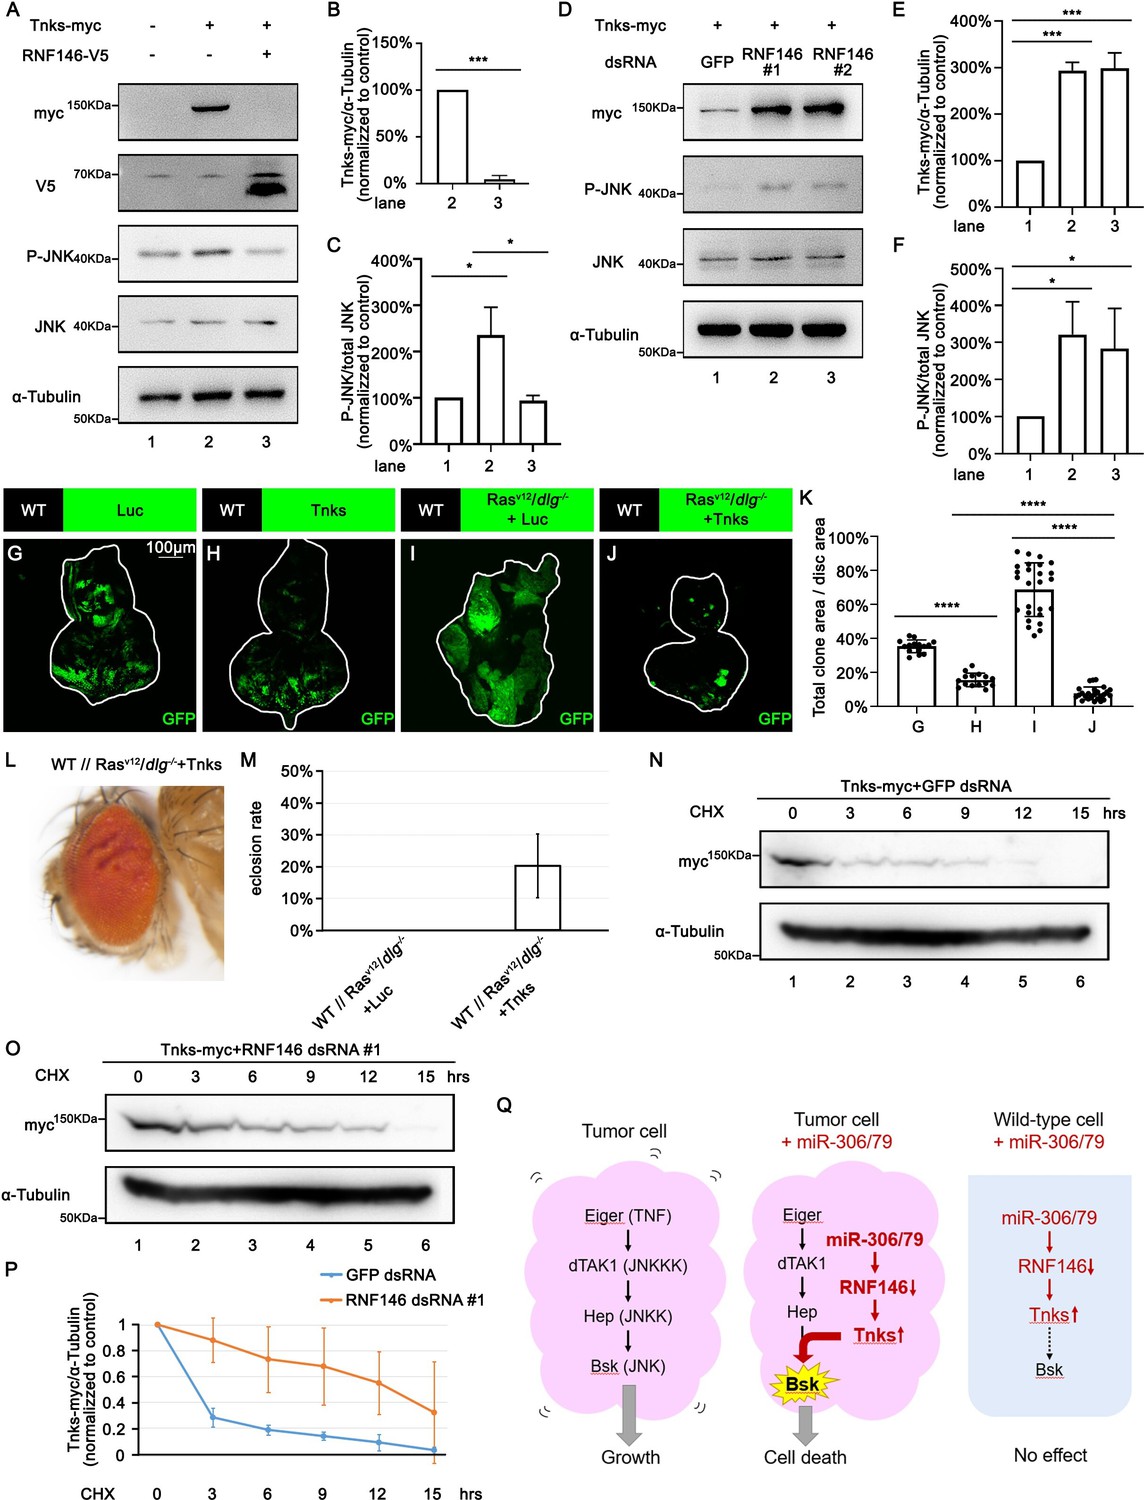
RNF146 promotes poly-ubiquitination and degradation of Tnks.
(A) Drosophila S2 cells were transfected with plasmids expressing indicated proteins. Cell lysates were subjected to Western blots using indicated antibodies. (B) Quantification of relative Tnks-myc levels in (A) from three independent experiments. Error bars, SD; ***p<0.001 by two-tailed Student’s t-test. (C) Quantification of relative p-JNK levels in (A) from three independent experiments. Error bars, SD; *p<0.05 by one-way ANOVA multiple-comparison test. (D) Drosophila S2 cells were transfected with plasmid expressing indicated protein and dsRNA targeting indicated gene. (E, F) Quantification of relative Tnks-myc levels (E) and p-JNK (F) levels in (D) from three independent experiments. Error bars, SD; *p<0.05, ***p<0.001 by one-way ANOVA multiple-comparison test. (G–J) Eye-antennal disc bearing GFP-labeled clones of indicated genotypes (G, H, 5 days after egg laying, I, J, 7 days after egg laying). (K) Quantification of clone size (% of total clone area per disc area in eye-antennal disc) of (G–J). Error bars, SD; ****p<0.0001 by one-way ANOVA multiple-comparison test. (L) Adult eye phenotype of flies with indicated genotypes. (M) Eclosion rate of flies with indicated genotypes. Data from three independent experiment, n > 30 for each group in one experiment; error bars, SD. (N, O) Drosophila S2 cells were transfected with plasmid expressing indicated protein and dsRNA targeting indicated gene. After 36 hr, cells were treated with 50 μg/ml cycloheximide (CHX) for the indicated periods. Cell lysates were subjected to Western blots using indicated antibodies. (P) Quantification of relative Tnks-myc levels in (N, O) from three independent experiments. Error bars, SD. (Q) A model for tumor elimination by miR-306/79. Tumor cell with elevated canonical JNK signaling via Eiger/TNF, dTAK1/JNKKK, and Hep/JNKK grows in a Bsk/JNK-dependent manner. Overexpression of miR-306 or miR-79 in JNK-activated tumor cell results in overactivation of JNK signaling to the lethal level via RNF146-Tnks-mediated noncanonical JNK-activating signaling. Overexpression of miR-306 or miR-79 in normal cells has no significant effect on JNK signaling.
-
Figure 6—source data 1
Quantitative data or raw data for Figure 6 (part 1).
- https://cdn.elifesciences.org/articles/77340/elife-77340-fig6-data1-v2.zip
-
Figure 6—source data 2
Quantitative data or raw data for Figure 6 (part 2).
- https://cdn.elifesciences.org/articles/77340/elife-77340-fig6-data2-v2.zip
-
Figure 6—source data 3
Genotypes for Figure 6.
- https://cdn.elifesciences.org/articles/77340/elife-77340-fig6-data3-v2.zip
Figure 6—figure supplement 1
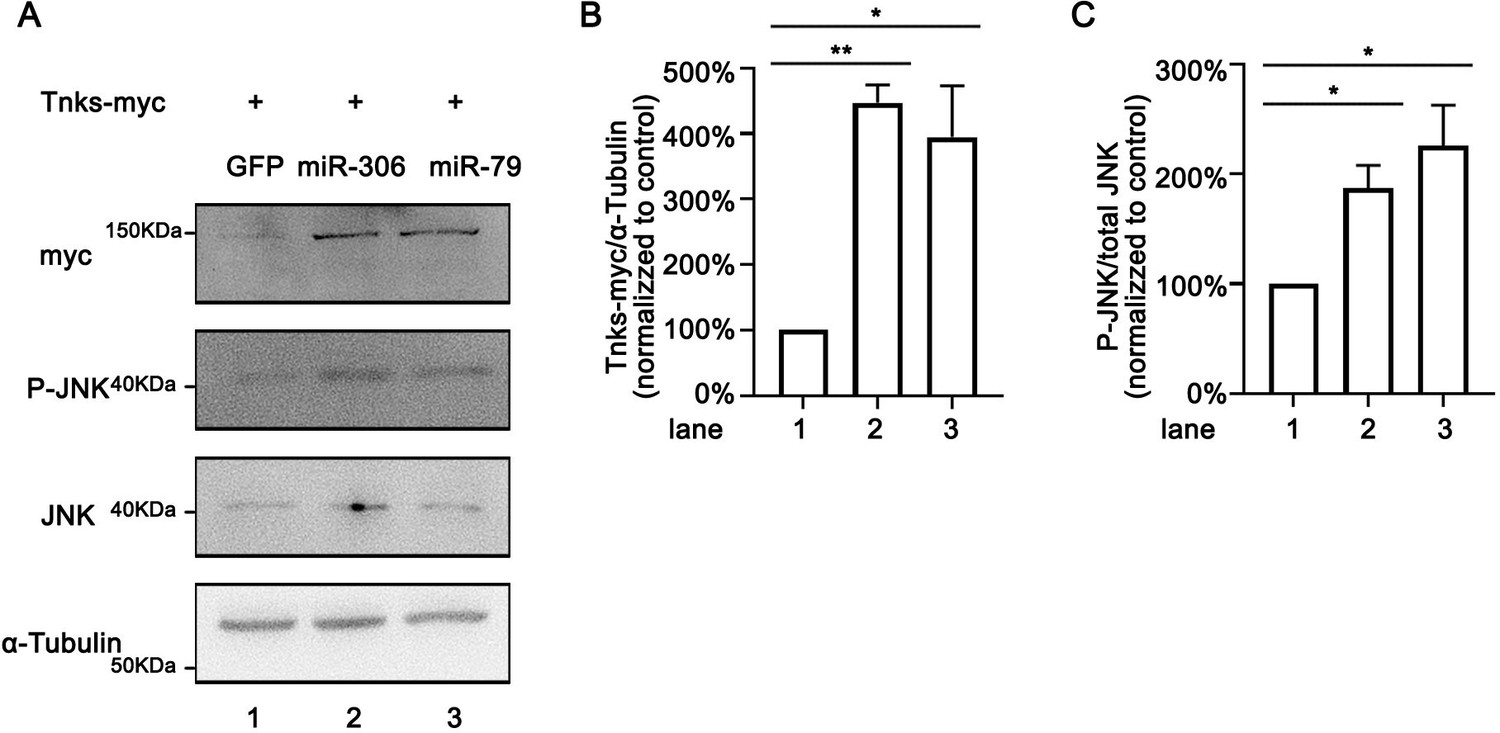
miR-306 and miR-79 increase Tnks protein level.
(A) Drosophila S2 cells were transfected with plasmids expressing indicated protein and miRNAs. Cell lysates were subjected to Western blots using indicated antibodies. (B, C) Quantification of relative levels of Tnks-myc (B) and p-JNK (C) in (A) from three independent experiments. Error bars, SD; *p<0.05, **p<0.01 by one-way ANOVA multiple-comparison test.
-
Figure 6—figure supplement 1—source data 1
Source data for Figure 6—figure supplement 1.
- https://cdn.elifesciences.org/articles/77340/elife-77340-fig6-figsupp1-data1-v2.zip
Tables
Appendix 1—key resources table
| Reagent type (species) or resource | Designation | Source or reference | Identifiers | Additional information |
|---|---|---|---|---|
| Genetic reagent (Drosophila melanogaster) | dlgm52 | PMID:9334318 | N/A | |
| Genetic reagent (D. melanogaster) | puc-lacZ | PMID:16753569 | N/A | |
| Genetic reagent (D. melanogaster) | UAS-Rasv12 | PMID:16753569 | N/A | |
| Genetic reagent (D. melanogaster) | UAS-BskDN | PMID:10490662 | N/A | |
| Genetic reagent (D. melanogaster) | UAS-Src64B | PMID:10069336 | N/A | |
| Genetic reagent (D. melanogaster) | Hel25Eccp-8 | PMID:31543447 | N/A | |
| Genetic reagent (D. melanogaster) | Mahj1 | PMID:20644714 | N/A | |
| Genetic reagent (D. melanogaster) | UAS-Nact | PMID:15496440 | N/A | |
| Genetic reagent (D. melanogaster) | UAS-RNF146 | PMID:30796047 | N/A | |
| Genetic reagent (D. melanogaster) | lgl4 | Bloomington Drosophila Stock Center | BDSC:36289 | |
| Genetic reagent (D. melanogaster) | UAS-p35 | Bloomington Drosophila Stock Center | BDSC:5073 | |
| Genetic reagent (D. melanogaster) | UAS-PVRact | Bloomington Drosophila Stock Center | BDSC:58496 | |
| Genetic reagent (D. melanogaster) | UAS-YkiS168A | Bloomington Drosophila Stock Center | BDSC:28836 | |
| Genetic reagent (D. melanogaster) | UAS-Luciferase | Bloomington Drosophila Stock Center | BDSC:35788 | |
| Genetic reagent (D. melanogaster) | UAS-RFP | Bloomington Drosophila Stock Center | BDSC:30556 | |
| Genetic reagent (D. melanogaster) | UAS-bantam | Bloomington Drosophila Stock Center | BDSC:60672 | |
| Genetic reagent (D. melanogaster) | UAS-miR-9c,306,79,9b | Bloomington Drosophila Stock Center | BDSC:41156 | |
| Genetic reagent (D. melanogaster) | UAS-miR-79 | Bloomington Drosophila Stock Center | BDSC:41145 | |
| Genetic reagent (D. melanogaster) | UAS-miR-2a-2,2a-1,2b-2 | Bloomington Drosophila Stock Center | BDSC:59849 | |
| Genetic reagent (D. melanogaster) | UAS-miR-2b-1 | Bloomington Drosophila Stock Center | BDSC:41128 | |
| Genetic reagent (D. melanogaster) | UAS-miR-7 | Bloomington Drosophila Stock Center | BDSC:41137 | |
| Genetic reagent (D. melanogaster) | UAS-miR-8 | Bloomington Drosophila Stock Center | BDSC:41176 | |
| Genetic reagent (D. melanogaster) | UAS-miR-9a | Bloomington Drosophila Stock Center | BDSC:41138 | |
| Genetic reagent (D. melanogaster) | UAS-miR-9b | Bloomington Drosophila Stock Center | BDSC:41131 | |
| Genetic reagent (D. melanogaster) | UAS-miR-9c | Bloomington Drosophila Stock Center | BDSC:41139 | |
| Genetic reagent (D. melanogaster) | UAS-miR-11 | Bloomington Drosophila Stock Center | BDSC:59865 | |
| Genetic reagent (D. melanogaster) | UAS-miR-12 | Bloomington Drosophila Stock Center | BDSC:41140 | |
| Genetic reagent (D. melanogaster) | UAS-miR-13a,13b-1,2c | Bloomington Drosophila Stock Center | BDSC:64097 | |
| Genetic reagent (D. melanogaster) | UAS-miR-13b-2 | Bloomington Drosophila Stock Center | BDSC:59867 | |
| Genetic reagent (D. melanogaster) | UAS-miR-14 | Bloomington Drosophila Stock Center | BDSC:41178 | |
| Genetic reagent (D. melanogaster) | UAS-miR-34 | Bloomington Drosophila Stock Center | BDSC:41158 | |
| Genetic reagent (D. melanogaster) | UAS-miR-92a | Bloomington Drosophila Stock Center | BDSC:41153 | |
| Genetic reagent (D. melanogaster) | UAS-miR-124 | Bloomington Drosophila Stock Center | BDSC:41126 | |
| Genetic reagent (D. melanogaster) | UAS-miR-184 | Bloomington Drosophila Stock Center | BDSC:41174 | |
| Genetic reagent (D. melanogaster) | UAS-miR-252 | Bloomington Drosophila Stock Center | BDSC:41127 | |
| Genetic reagent (D. melanogaster) | UAS-miR-276a | Bloomington Drosophila Stock Center | BDSC:41143 | |
| Genetic reagent (D. melanogaster) | UAS-miR-276b | Bloomington Drosophila Stock Center | BDSC:41162 | |
| Genetic reagent (D. melanogaster) | UAS-miR-278 | Bloomington Drosophila Stock Center | BDSC:41180 | |
| Genetic reagent (D. melanogaster) | UAS-miR-279 | Bloomington Drosophila Stock Center | BDSC:41147 | |
| Genetic reagent (D. melanogaster) | UAS-miR-282 | Bloomington Drosophila Stock Center | BDSC:41165 | |
| Genetic reagent (D. melanogaster) | UAS-miR-305 | Bloomington Drosophila Stock Center | BDSC:41152 | |
| Genetic reagent (D. melanogaster) | UAS-miR-310 | Bloomington Drosophila Stock Center | BDSC:41155 | |
| Genetic reagent (D. melanogaster) | UAS-miR-317 | Bloomington Drosophila Stock Center | BDSC:59913 | |
| Genetic reagent (D. melanogaster) | UAS-miR-958 | Bloomington Drosophila Stock Center | BDSC:41222 | |
| Genetic reagent (D. melanogaster) | UAS-miR-975,976,977 | Bloomington Drosophila Stock Center | BDSC:60635 | |
| Genetic reagent (D. melanogaster) | UAS-miR-981 | Bloomington Drosophila Stock Center | BDSC:60639 | |
| Genetic reagent (D. melanogaster) | UAS-miR-984 | Bloomington Drosophila Stock Center | BDSC:41224 | |
| Genetic reagent (D. melanogaster) | UAS-miR-988 | Bloomington Drosophila Stock Center | BDSC:41196 | |
| Genetic reagent (D. melanogaster) | UAS-miR-995 | Bloomington Drosophila Stock Center | BDSC:41199 | |
| Genetic reagent (D. melanogaster) | UAS-miR-996 | Bloomington Drosophila Stock Center | BDSC:60653 | |
| Genetic reagent (D. melanogaster) | UAS-miR-998 | Bloomington Drosophila Stock Center | BDSC:63043 | |
| Genetic reagent (D. melanogaster) | UAS-miR-306-sponge | Bloomington Drosophila Stock Center | BDSC:61424 | |
| Genetic reagent (D. melanogaster) | UAS-miR-79-sponge | Bloomington Drosophila Stock Center | BDSC:61387 | |
| Genetic reagent (D. melanogaster) | UAS-Luciferase RNAi | Bloomington Drosophila Stock Center | BDSC:31603 | |
| Genetic reagent (D. melanogaster) | UAS-aop RNAi | Bloomington Drosophila Stock Center | BDSC:34909 | |
| Genetic reagent (D. melanogaster) | UAS-pde1c RNAi | Bloomington Drosophila Stock Center | BDSC:55925 | |
| Genetic reagent (D. melanogaster) | UAS-atf3 RNAi | Bloomington Drosophila Stock Center | BDSC:26741 | |
| Genetic reagent (D. melanogaster) | UAS-mei-P26 RNAi | Bloomington Drosophila Stock Center | BDSC:57268 | |
| Genetic reagent (D. melanogaster) | UAS-chn RNAi | Bloomington Drosophila Stock Center | BDSC:26779 | |
| Genetic reagent (D. melanogaster) | UAS-chinmo RNAi | Bloomington Drosophila Stock Center | BDSC:26777 | |
| Genetic reagent (D. melanogaster) | UAS-RNF146 RNAi | Bloomington Drosophila Stock Center | BDSC:40882 | |
| Genetic reagent (D. melanogaster) | UAS-bcd RNAi | Bloomington Drosophila Stock Center | BDSC:33886 | |
| Genetic reagent (D. melanogaster) | UAS-CG1358 RNAi | Bloomington Drosophila Stock Center | BDSC:64848 | |
| Genetic reagent (D. melanogaster) | UAS-miR-306 | FlyORF | FlyORF: F002214 | |
| Genetic reagent (D. melanogaster) | UAS-Tnks | Core Facility of Drosophila Resource and Technology, Center for Excellence in Molecular Cell Science, Chinese Academy of Sciences | N/A | |
| Cell line (D. melanogaster) | S2 | ATCC | Cat #CRL-1963 | |
| Antibody | Anti-phospho-JNK (rabbit monoclonal) | Cell Signaling Technology | Cat #4668 | 1:100 |
| Antibody | Anti-β-galactosidase (chicken polyclonal) | Abcam | Cat #ab9361 | 1:1000 |
| Antibody | Anti-cleaved Drosophila Dcp-1 (Asp216) (rabbit polyclonal) | Cell Signaling Technology | Cat #9578 | 1:100 |
| Antibody | Goat anti-rabbit secondary antibody, Alexa Fluor 647 | Thermo Fisher Scientific | Cat #A32733 | 1:250 |
| Antibody | Goat anti-chicken secondary antibody, Alexa Fluor 647 | Thermo Fisher Scientific | Cat #A21449 | 1:250 |
| Antibody | Anti-α-tubulin (mouse monoclonal) | Sigma-Aldrich | Cat #T5168 | 1:5000 |
| Antibody | Anti-phospho-JNK (rabbit polyclonal) | Cell Signaling Technology | Cat #9251 | 1:1000 |
| Antibody | Anti-JNK (mouse monoclonal) | Santa Cruz Biotechnology | Cat #sc-7345 | 1:1000 |
| Antibody | Anti-RNF146 (rabbit polyclonal) | GenScript antibody service | N/A | Raised in rabbits against peptide HSGGGSGEDPAVGSC,1:2000 |
| Antibody | Anti-V5 tag (mouse monoclonal) | Thermo Fisher Scientific | Cat #R960-25 | 1:5000 |
| Antibody | Anti-myc tag (rabbit polyclonal) | MBL | Cat #562 | 1:1000 |
| Antibody | Horse anti-mouse IgG, HRP-linked antibody | Cell Signaling Technology | Cat #7076 | 1:5000 |
| Antibody | Goat anti-rabbit IgG, HRP-linked antibody | Cell Signaling Technology | Cat #7074 | 1:5000 |
| Commercial assay or kit | DAPI-containing SlowFade Gold Antifade Reagent | Thermo Fisher Scientific | Cat #S36937 | |
| Commercial assay or kit | FuGene HD transfection reagent | Promega | Cat #PRE2311 | |
| Other | CHX | Santa Cruz Biotechnology | Cat #SC-3508 | 50 μg/ml |
Additional files
Download links
A two-part list of links to download the article, or parts of the article, in various formats.
Downloads (link to download the article as PDF)
Open citations (links to open the citations from this article in various online reference manager services)
Cite this article (links to download the citations from this article in formats compatible with various reference manager tools)
Tumor elimination by clustered microRNAs miR-306 and miR-79 via noncanonical activation of JNK signaling
eLife 11:e77340.
https://doi.org/10.7554/eLife.77340


