Structural differences in adolescent brains can predict alcohol misuse
- Charité – Universitätsmedizin Berlin (corporate member of Freie Universiät at Berlin, Humboldt-Universiät at zu Berlin, and Berlin Institute of Health), Department of Psychiatry and Psychotherapy, Bernstein Center for Computational Neuroscience, Germany
- Faculty IV – Electrical Engineering and Computer Science, Technische Universität Berlin, Germany
- Department of Education and Psychology, Freie Universität Berlin, Germany
- Science of Intelligence, Research Cluster of Excellence, Germany
- Social and Preventive Medicine, Department of Sports and Health Sciences, Intra-faculty unit “Cognitive Sciences”, Faculty of Human Science, and Faculty of Health Sciences Brandenburg, Research Area Services Research and e-Health, University of Potsdam, Germany
- Department of Child and Adolescent Psychiatry and Psychotherapy, Central Institute of Mental Health, Medical Faculty Mannheim, Heidelberg University, Germany
- Discipline of Psychiatry, School of Medicine and Trinity College Institute of Neuroscience, Trinity College Dublin, Ireland
- Centre for Population Neuroscience and Precision Medicine (PONS), Institute of Psychiatry, Psychology Neuroscience SGDP Centre, King’s College London, United Kingdom
- Institute of Cognitive and Clinical Neuroscience, Central Institute of Mental Health, Medical Faculty Mannheim, Heidelberg University, Germany
- Department of Psychology, School of Social Sciences, University of Mannheim, Germany
- NeuroSpin, CEA, Université Paris-Saclay, France
- Departments of Psychiatry and Psychology, University of Vermont, United States
- Sir Peter Mansfield Imaging Centre School of Physics and Astronomy, University of Nottingham, United Kingdom
- Physikalisch-Technische Bundesanstalt, Germany
- Institut National de la Santé et de la Recherche Médicale, INSERM U A10 ”Trajectoires développementales en psychiatrie” Universite Paris-Saclay, Ecole Normale Supérieure Paris-Saclay, CNRS, Centre Borelli, France
- AP-HP Sorbonne Université, Department of Child and Adolescent Psychiatry, Pitié-Salpêtrière Hospital, France
- Psychiatry Department, EPS Barthélémy Durand, France
- PONS Research Group, Dept of Psychiatry and Psychotherapy, Campus Charite Mitte, Humboldt University, Germany
- Institut des Maladies Neurodégénératives, UMR 5293, CNRS, CEA, University of Bordeaux, France
- Department of Psychiatry, Faculty of Medicine and Centre Hospitalier Universitaire Sainte-Justine, University of Montreal, Canada
- Departments of Psychiatry and Psychology, University of Toronto, Canada
- Department of Child and Adolescent Psychiatry and Psychotherapy, University Medical Centre Göttingen, Germany
- Department of Psychiatry and Neuroimaging Center, Technische Universität Dresden, Germany
- Department of Psychological Medicine, Section for Eating Disorders, Institute of Psychiatry, Psychology and Neuroscience, King’s College London, United Kingdom
- School of Psychology and Global Brain Health Institute, Trinity College Dublin, Ireland
Figures
Figure 1
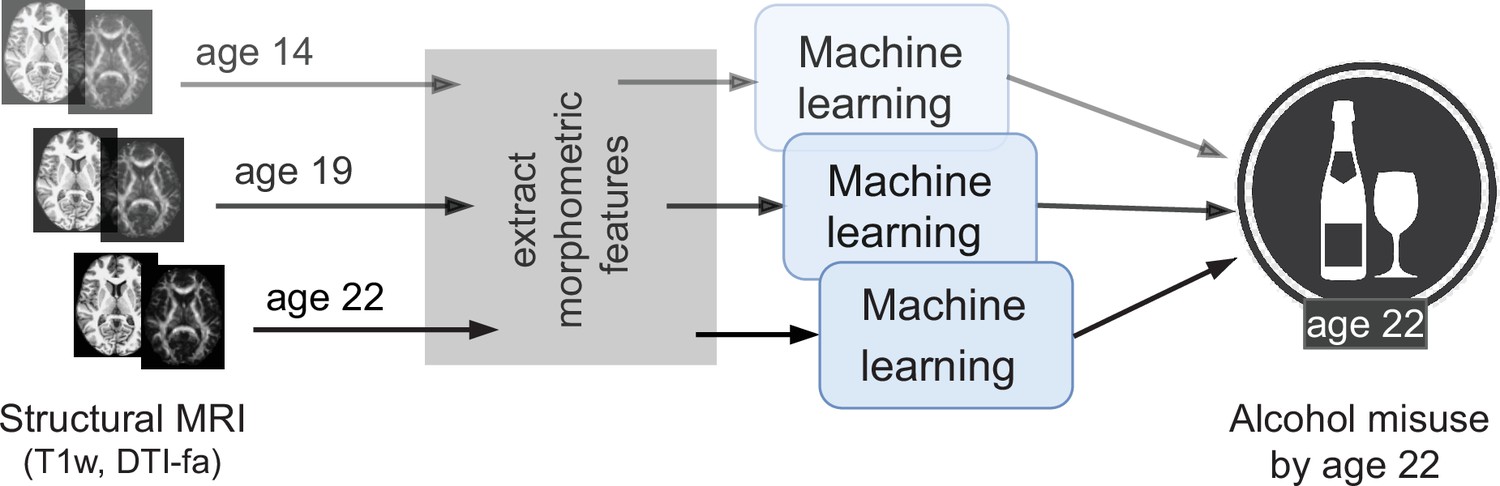
An overview of the analysis performed.
Morphometric features extracted from structural brain imaging are used to predict Adolescent Alcohol Misuse (AAM) developed by the age of 22 using machine learning. To understand the causal relationship between AAM and the brain, three separate analyses are performed by using imaging data collected at three stages of adolescence: age 14, age 19, and age 22.
Figure 2

Comparing confound correction techniques.
Five input-output settings are compared within each confound correction technique: , , , , and . (a) shows the results before any correction is performed, (b) shows the results of performing confound regression, and (c) and (d) show the results from counterbalancing by undersampling the majority class and oversampling the minority class, respectively. Statistical significance is obtained from 1,000 permutation tests and is shown with ** if , * if , and ‘n.s’ if .
Figure 3 with 1 supplement
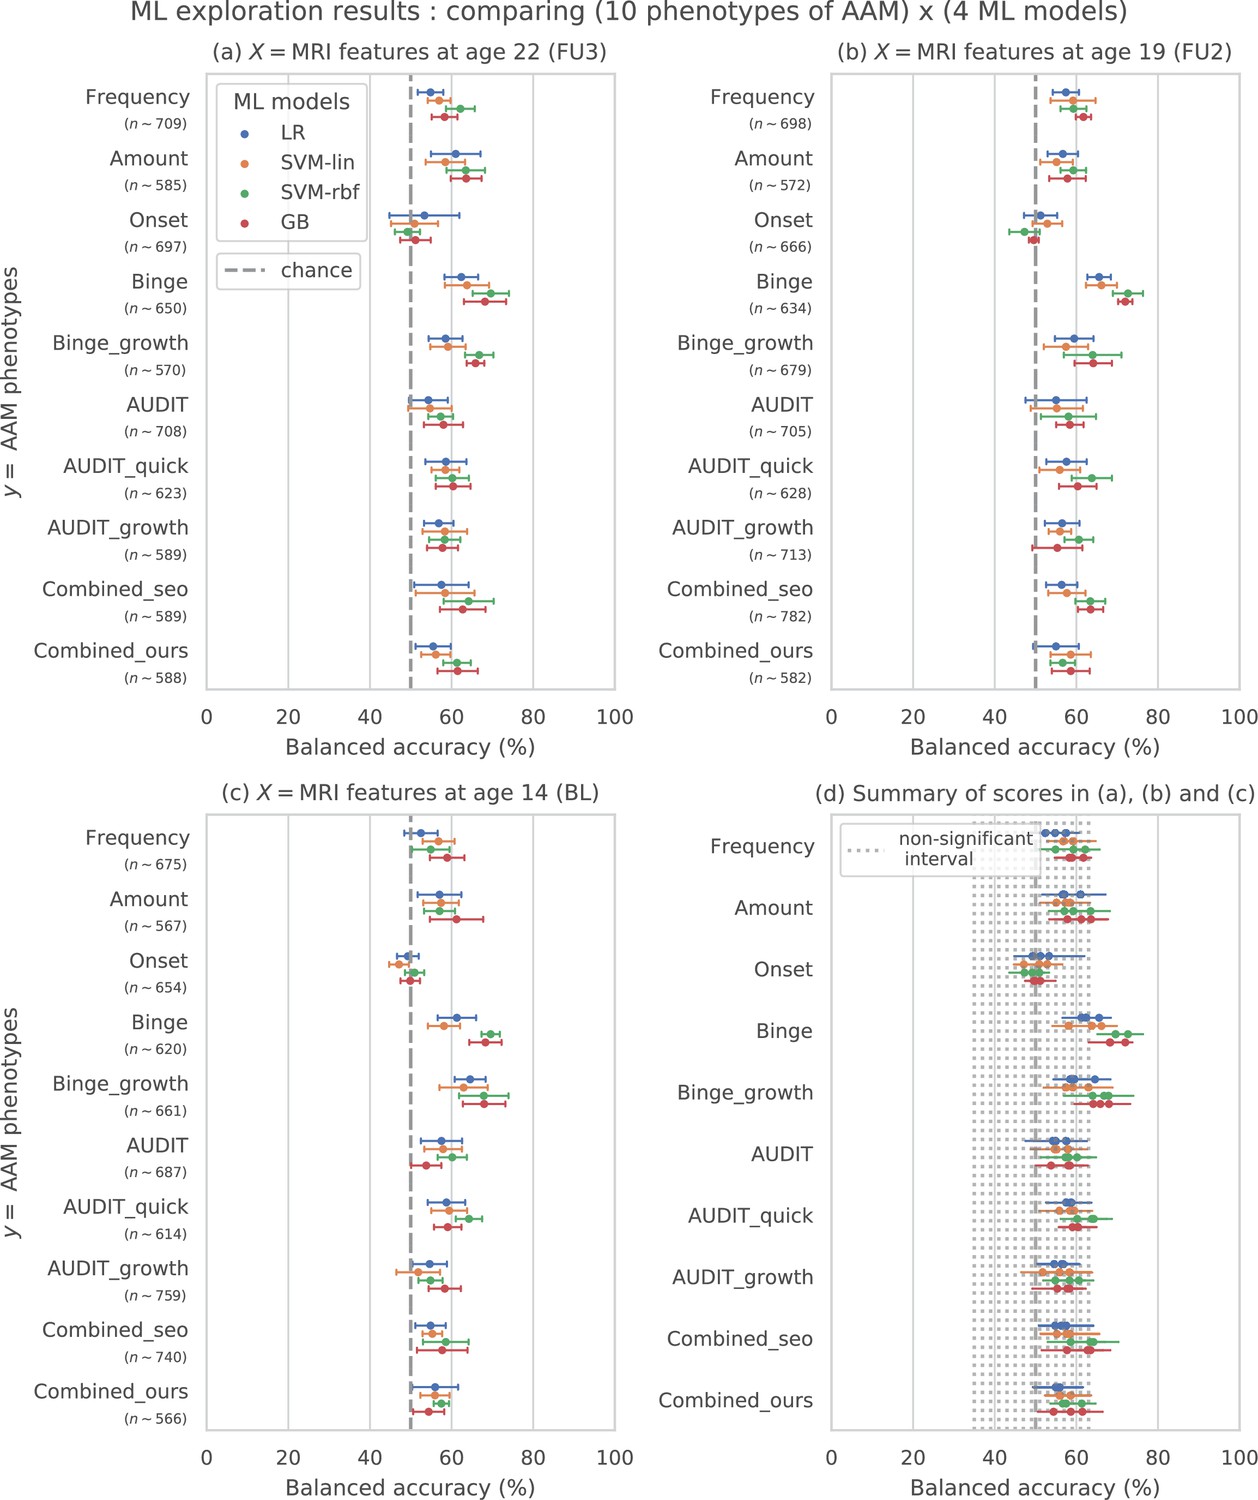
Results of the ML exploration experiments: The ten phenotypes of AAM tested are listed on the y-axis and the four ML models are represented with different color coding as shown in the legend of figure (a).
For a given AAM label and ML model, the point represents the mean balanced accuracy across the 7-fold CV and the bars represent its standard deviation. Figure (a) shows the results when the imaging data from age 22 (FU3) is used, figure (b) shows results for age 19 (FU2) and figure (c) for age 14. Figure (d) shows the results from all three time point analyses in a single plot along with the interval of the balanced accuracy that were non-significant () when tested with permutation tests.
Figure 3—figure supplement 1
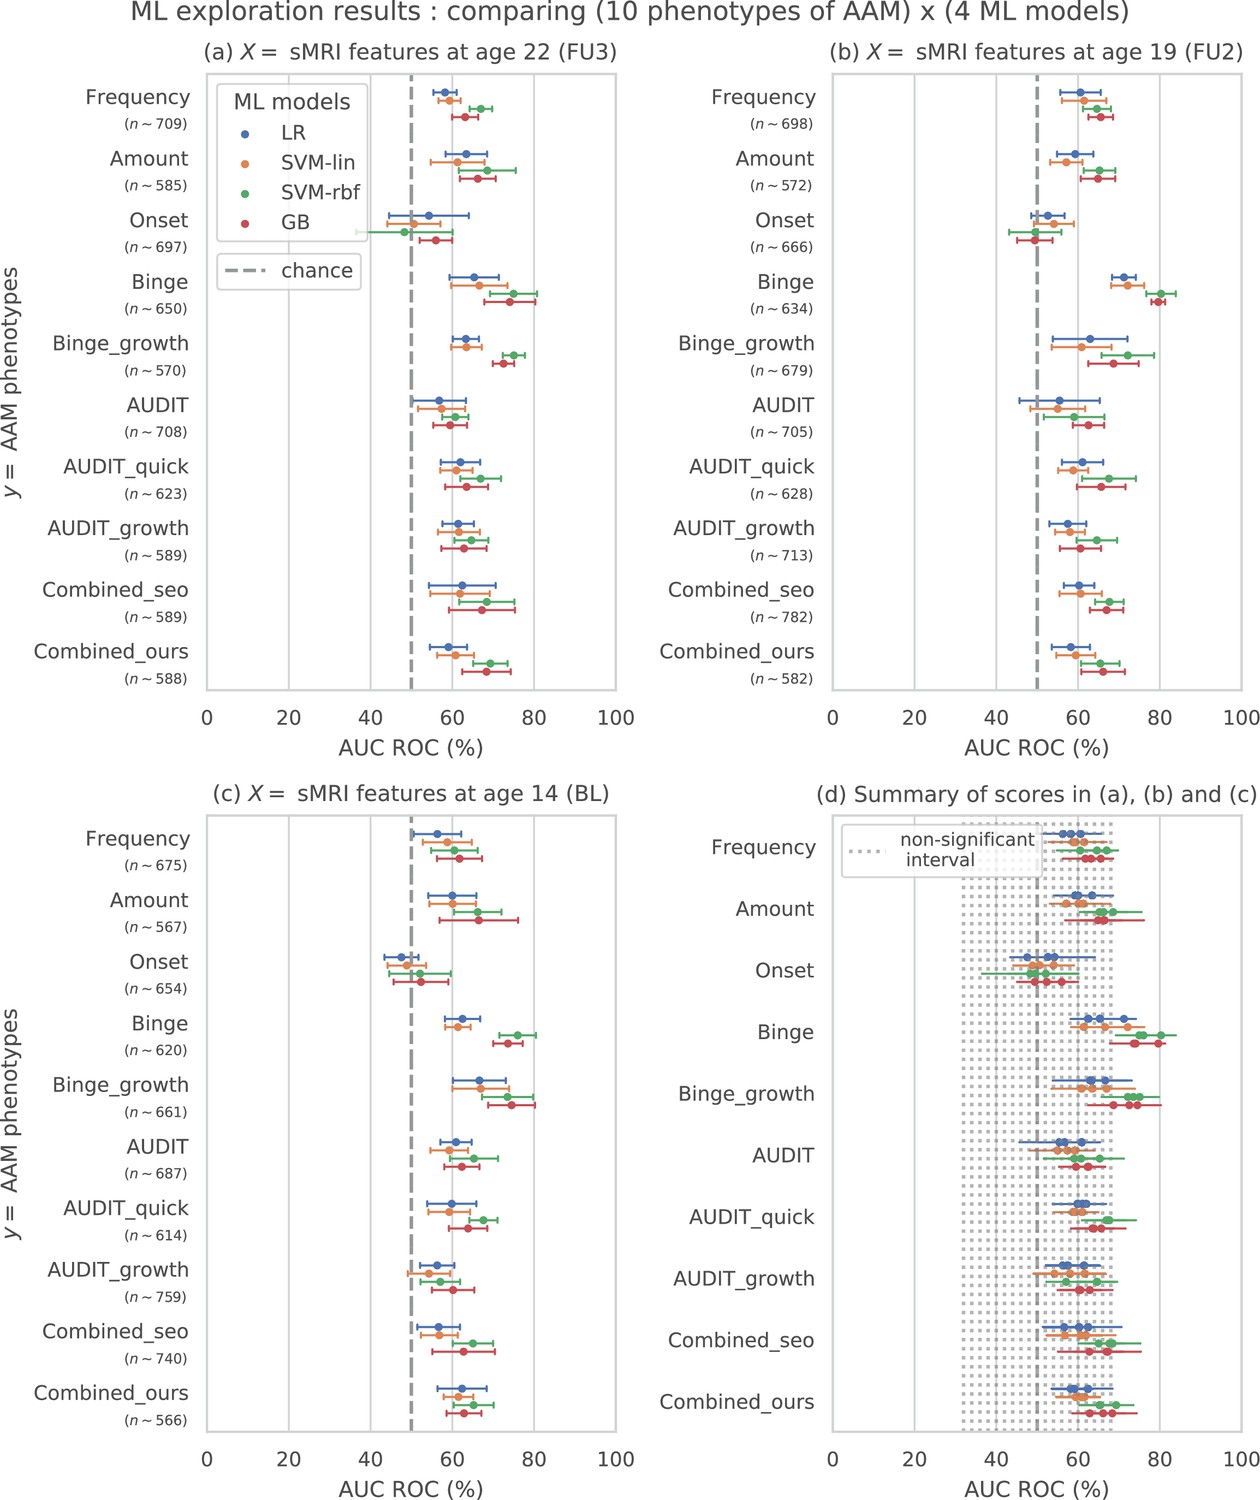
ML exploration results shown with AUC-ROC metric.
Figure 4 with 1 supplement
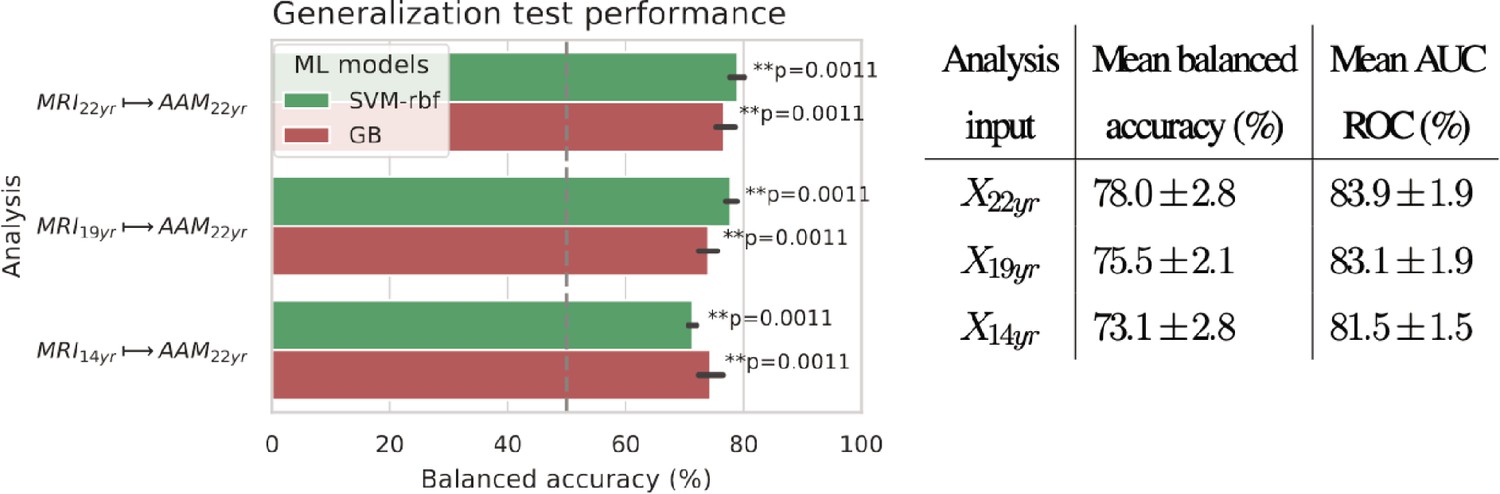
Final results for the three time point analyses on the ‘Binge’ drinking AAM phenotype obtained with the two non-linear ML models, kernel-based support vector machine (SVM-rbf) and gradient boosting (GB).
The figure shows the mean balanced accuracy achieved by each ML model within each analysis while the table lists the combined average scores for each analysis. The ML models are retrained seven times on data with different random seeds and evaluated on data to obtain an estimate of the accuracy with a standard deviation. Statistical significance is obtained from 1000 permutation tests and is shown with ** if , * if , and ‘n.s’ if .
Figure 4—figure supplement 1
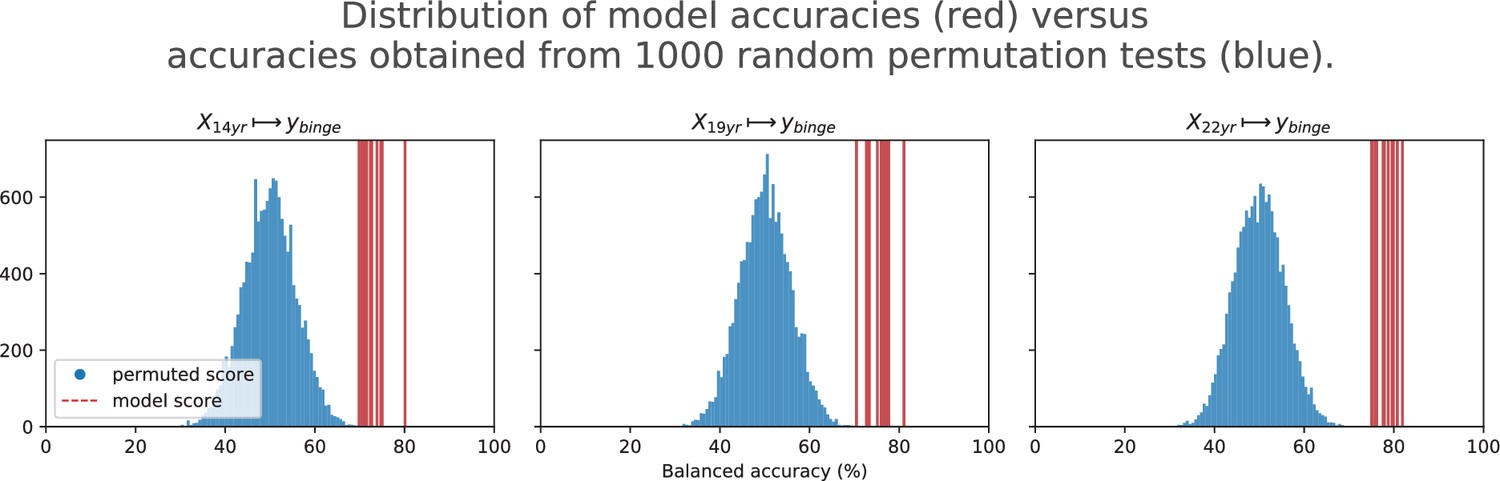
Visualization of the permutation test results.
Figure 5
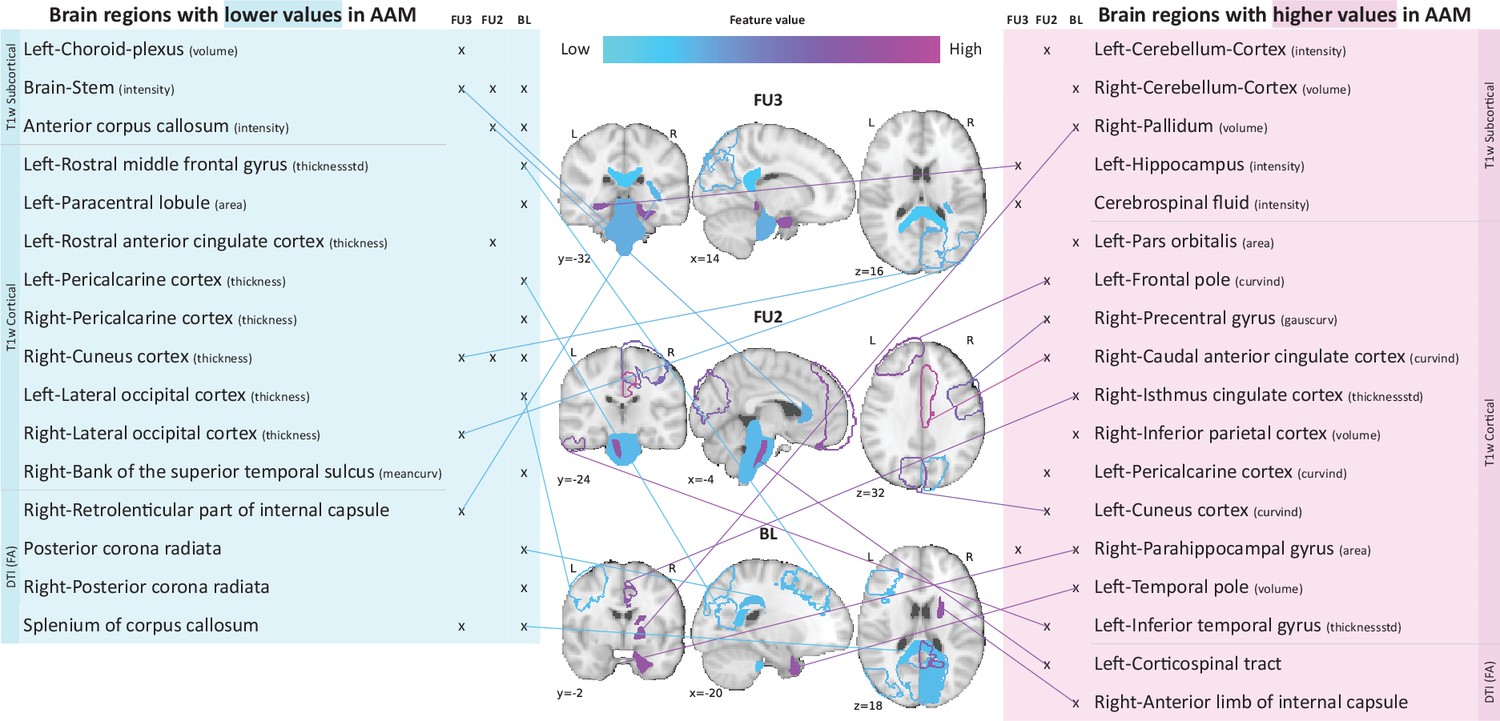
Most informative structural features for SVM-rbf model’s predictions on data .
Most important features are listed and their locations are shown on a template brain for a better intuition for each of the three time point analyses. The features are color coded to also display whether these features have lower-than-average or higher-than-average values when the model predicts alcohol misusers. This figure is only illustrative and an exhaustive list of all informative features with their corresponding SHAP values are given in the Appendix 1—table 3. (Acronyms:: AAM: adolescence alcohol misuse, area: surface area, volume: gray matter volume, thickness: average thickness, thicknessstd: standard deviation of thickness, intensity: mean intensity, meancurv: integrated rectified mean curvature, gauscurv: integrated rectified gaussian curvature, curvind: intrinsic curvature index).
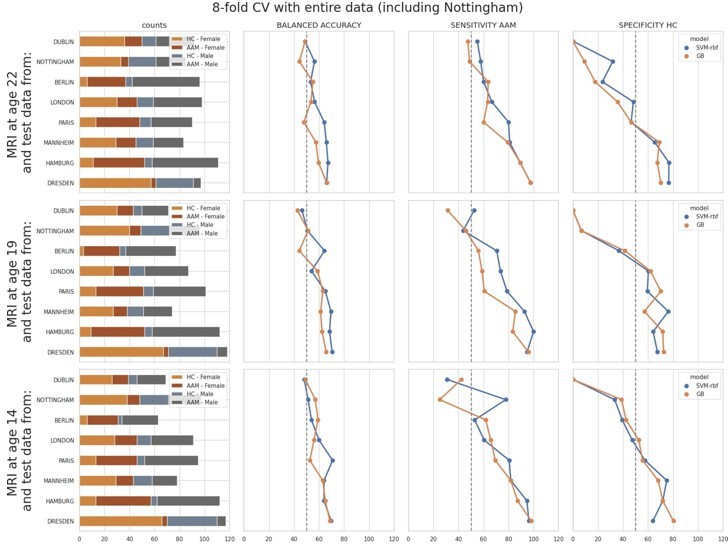
Figure 6
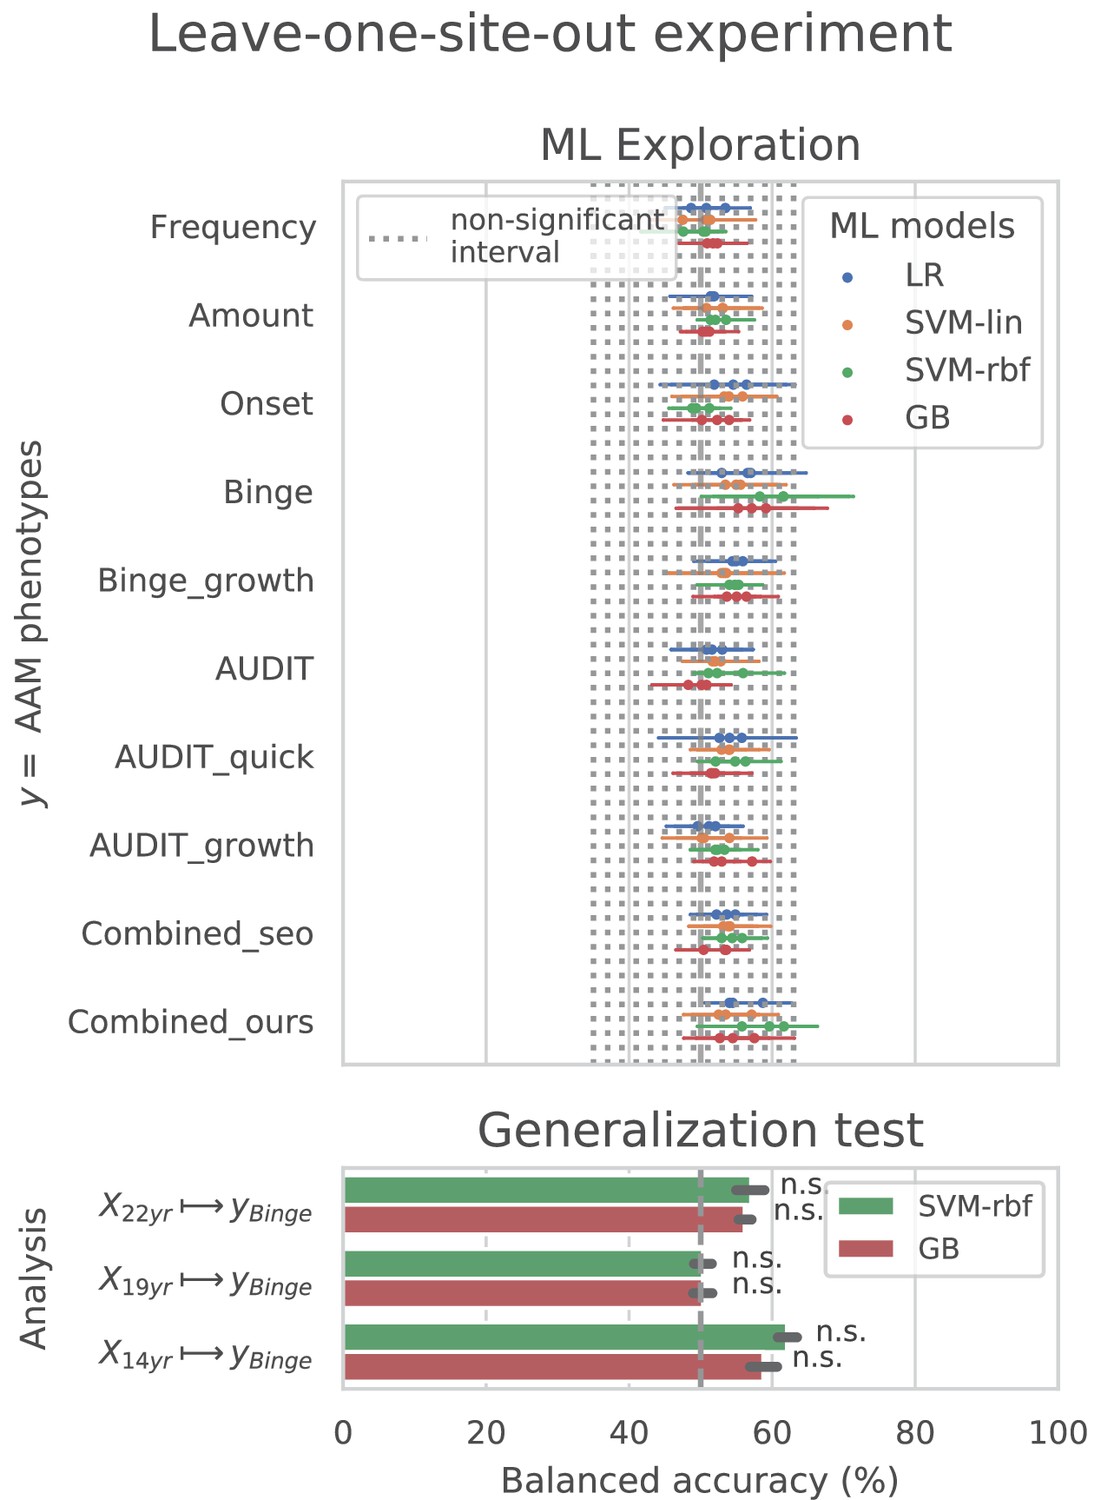
Analysis repeated with leave-one-site-out cross validations (CV).
Figure 7
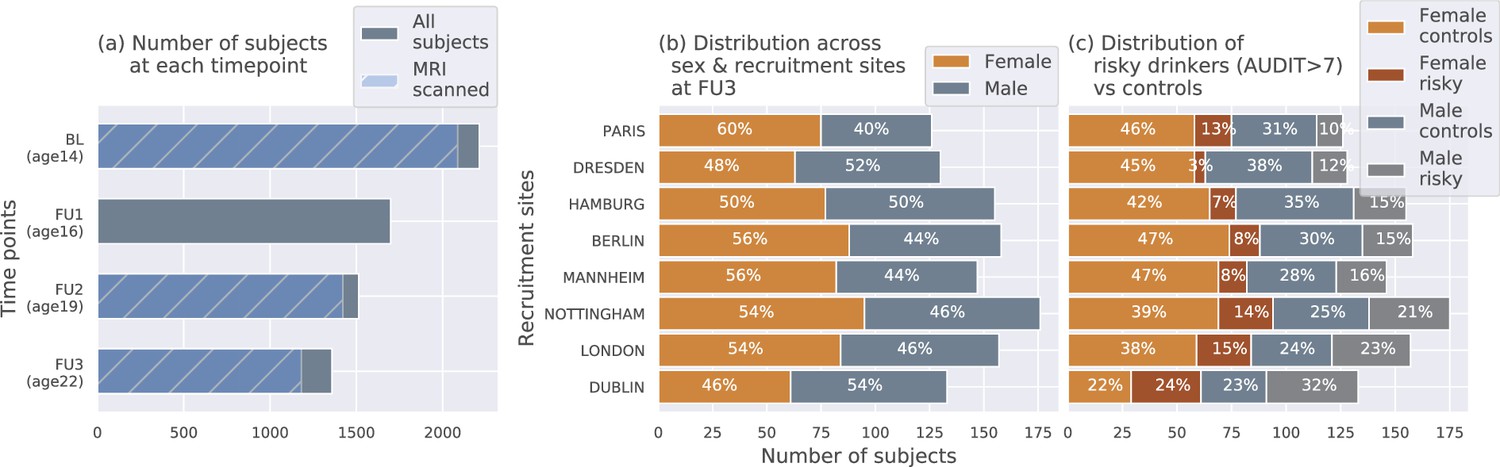
The IMAGEN dataset: (a) Data is collected longitudinally at 4 stages of adolescence - age 14 or baseline (BL), age 16 or follow-up 1 (FU1), age 19 or follow-up 2 (FU2) and, finally age 22 or follow-up 3 (FU3).
The blue bar shows the number of subjects with brain imaging data. (b) The distribution of subjects across sex and the site of recruitment, for the 1182 subjects that were scanned at FU3 (c) The same distribution across sex and site also showing the proportion of subjects that meet the AUDIT ’risky drinkers’ category at FU3.
Figure 8
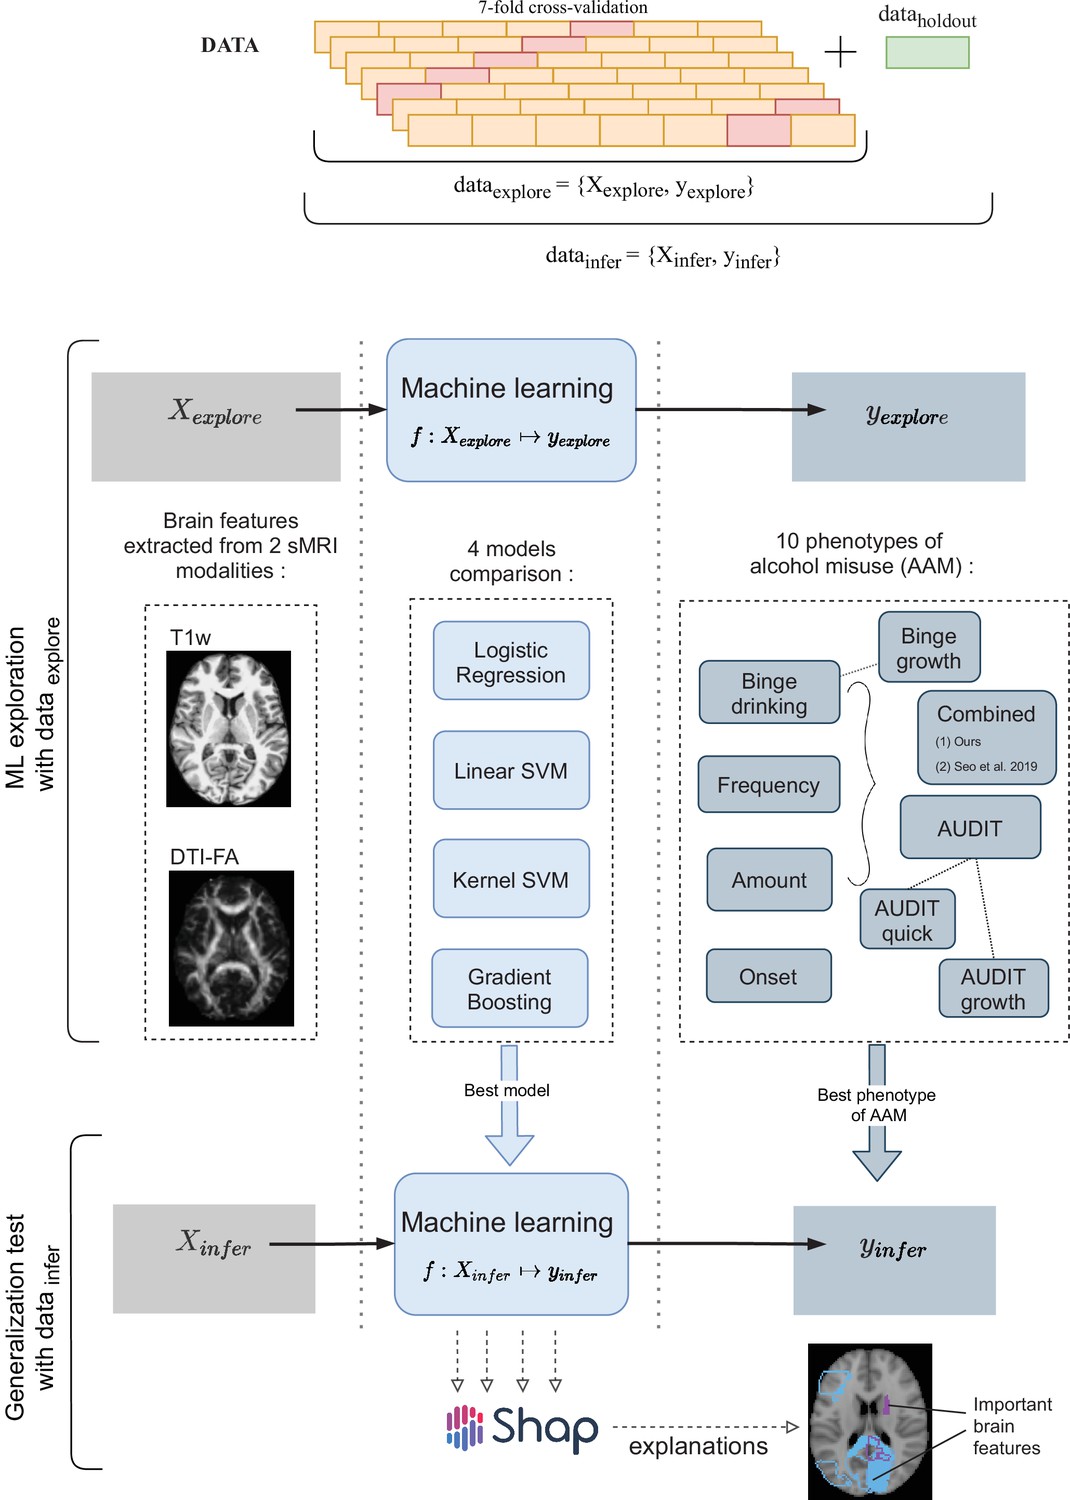
A schematic representation of the experimental procedure followed for all 3 time point analyses.
In the ML exploration stage, we experiment with four ML models and 10 phenotypes of AAM on 80% of the data (data ) using a sevenfold cross-validation scheme. Once the best ML model, the best phenotype of AAM, and the most appropriate confound-control technique are determined, the generalization test is performed on data by using the data subset as the test data. The result from the generalization test are reported as the final results and the informative brain features are determined at this stage using SHAP (Lundberg and Lee, 2017).
Appendix 1—figure 1

Visualizing AAM phenotype categorization: A qualitative comparison showing how the ten AAM phenotypes categorize the same subjects into the three alcohol user classes – risky alcohol users, moderate users, and safe or non-users.
Each color-coded vertical line in the diagram represents one subject, out of the total 1182 subjects. It can be observed that the Frequency, Onset, and Amount phenotypes categorize very differently from Binge, showing that they capture different factors of alcohol misuse. All AUDIT-derived phenotypes are similar to each other but are different from the Binge phenotype. Furthermore, sex and site-specific variations can be detected. For instance, more males appear on the ‘risky’ groups compared to females. Similarly, most subjects from Dublin are clustered on the risky side.
Appendix 1—figure 2
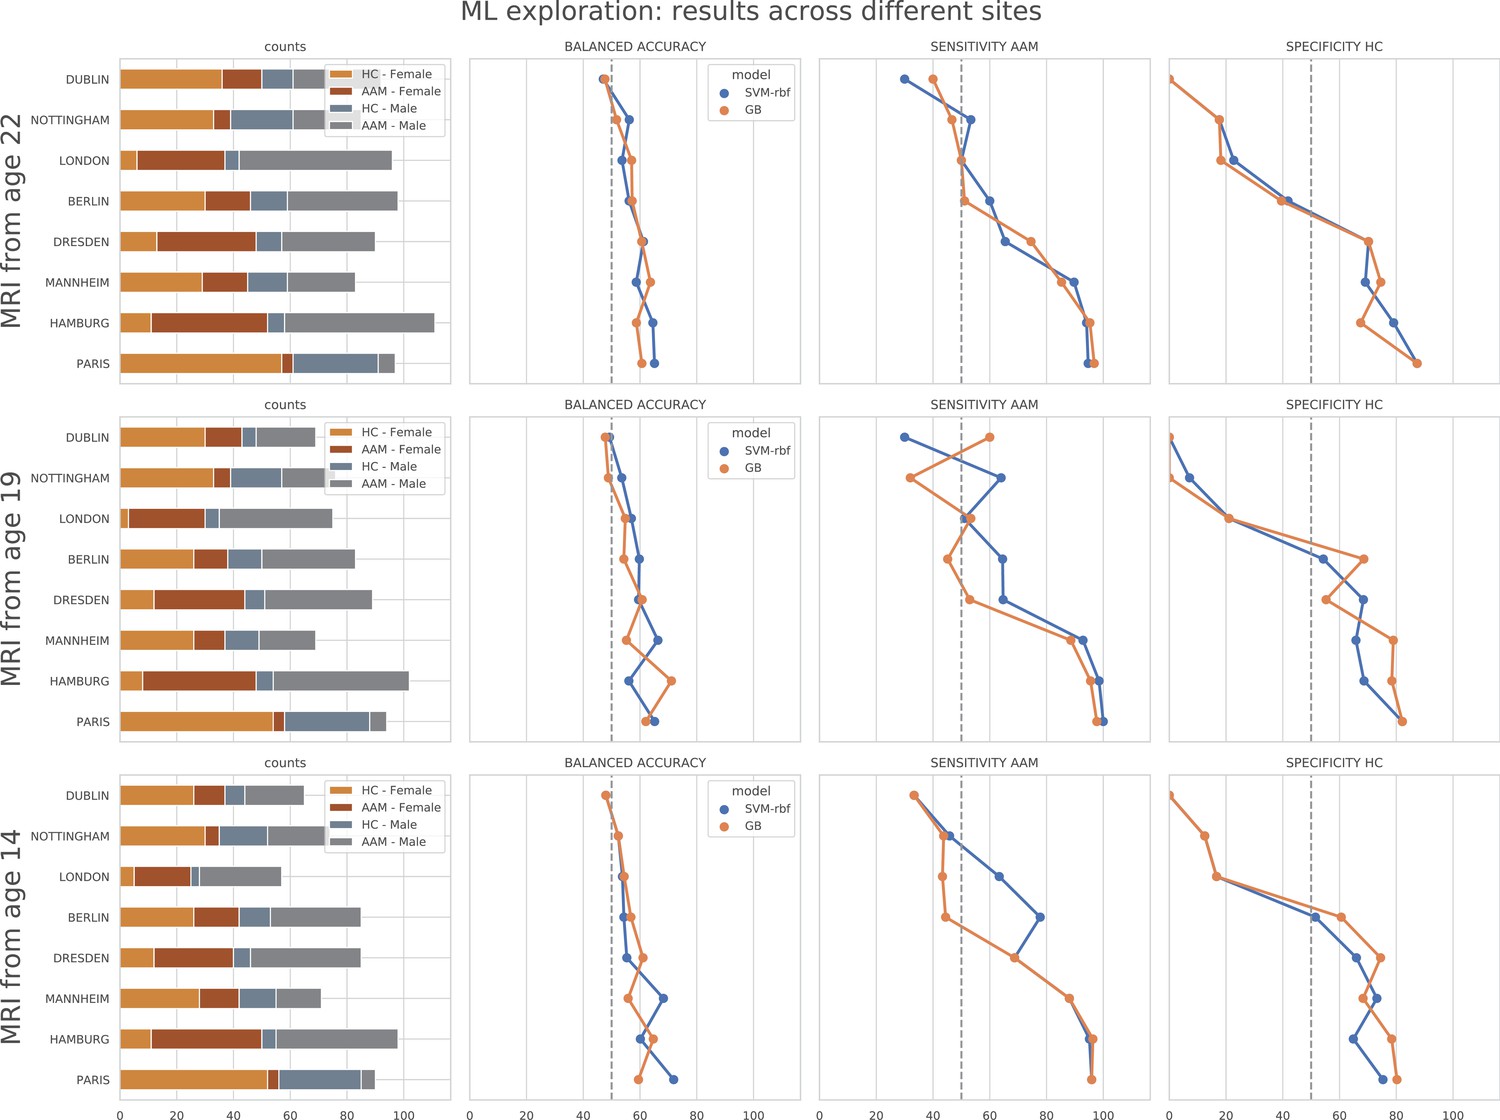
ML exploration results per site: Accuracy of the non-linear models per site in the main experiments.
The sites are ordered from low to high accuracy.
Appendix 1—figure 3
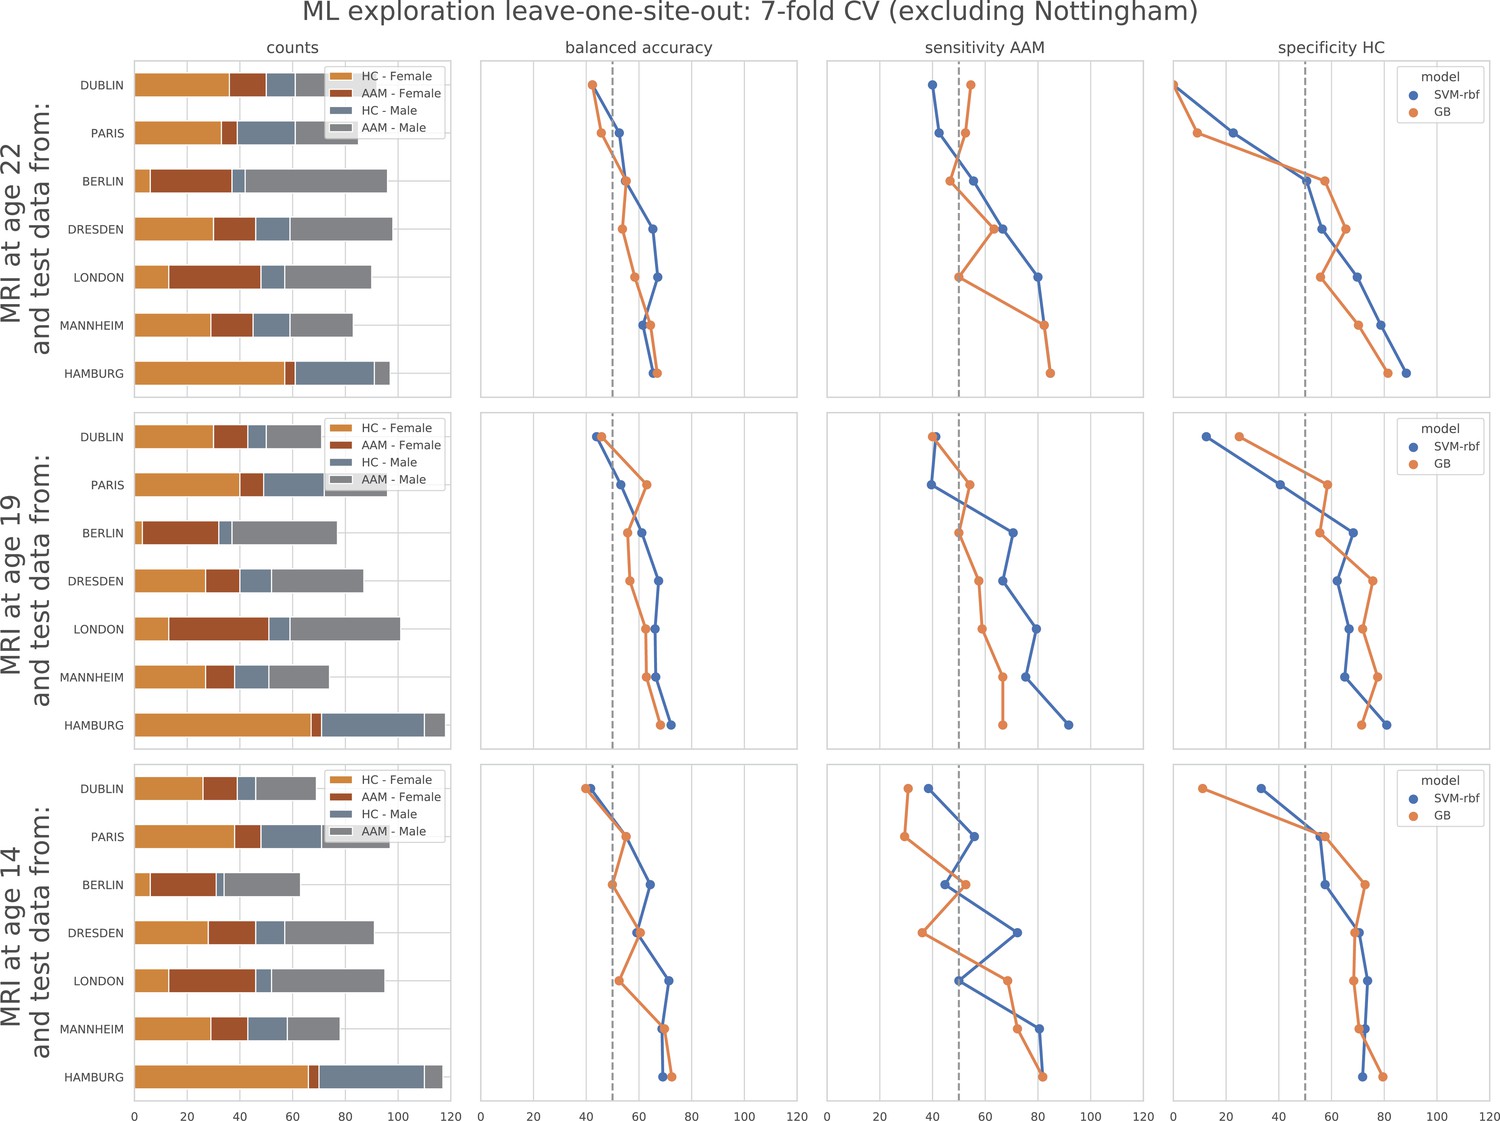
ML exploration results per site in leave-one-site-out: Accuracy of the non-linear models per site in the leave-one-site-out.
The sites are ordered from low to high accuracy.
Author response image 1
Author response image 2
Tables
Table 1
Literature review of studies that look into structural brain differences between adolescent alcohol misusers (AAMs) and control subjects.
The studies are sorted by the year of publication. For each study, the sample size ‘n’, the main analysis technique, and the main structural differences found in AAMs are listed.
| Study (year) | n | Analysis / method | Sructural differences in AAMs |
|---|---|---|---|
| De Bellis et al., 2000 | 36 | Statistically compare (univariate)regional brain volumes between groups | Lower hippocampal volume. |
| Nagel et al., 2005 | 31 | Statistically compare (univariate)regional brain volumes between groups | Lower volume only in left hippocampus aftercontrolling for other psychiatric comorbidities. |
| De Bellis et al., 2005 | 42 | Statistically compare (univariate)regional brain volumes between groups | Lower pFC, cerebellum volumes in malesbut AAMs had comorbid mental disorders. |
| McQueeny et al., 2009 | 28 | Mass-univariate analysis ofskeletonized FA voxels (DTI) | Binge drinkers had lower FA in18 white matter areas. |
| Squeglia et al., 2012 | 59 | Statistically compare (univariate) regional brain volumes between groups | No effect of binge drinking oncortical thickness and sex-specificdifferences among AAMs in left frontal cortex. |
| Jacobus et al., 2013 | 54 | Mass-univariate analysis of skeletonized FA voxels (DTI) | No effect in AAM-only group, but lowerFA in AAM and comorbid marijuana users. |
| Luciana et al., 2013 | 55 | Longitudinal mass-univariate analysis of cortical thickness, white matter extent, DTI-extracted FA and MD | Accelerated GM thinning in mid frontal gyrus, attenuated WM growth with lower FAin left caudate, thalamus. |
| Whelan et al., 2014 | 692 | Exploratory analysis using ML to find best predictors of AAM amongdemographic, psychosocial, genetic, cortical volumes, and fMRI variables | Current AAMs have lower GMVs in parts of frontal lobe and higher GMV in right putamen. Future AAMs have lower GMV in right parahippocampal gyrus and higher in left postcentral gyrus. |
| Squeglia et al., 2015 | 137 | Exploratory analysis using ML to find best predictors of AAM among demographic, neuropsychological, cortical thickness, and fMRI variables | Future AAM have thinner GM inprecuneus, lateral occipital, ACC, PCC, and frontal and temporal cortex. |
| Pfefferbaum et al., 2018 | 483 | Longitudinal mass-univariate analysisof GMV development | Accelerated GMV reduction in frontal brain regions. |
| Jones and Nagel, 2019 | 113 | Modeling the WM microstructure development (DTI) for each voxel | Altered frontostriatal WM microstructureis predictive of future AAM. |
| Kühn et al., 2019 | ≈1500 | Growth curve modeling ofGM volumes | Higher GMV in caudate nucleus and left cerebellum predicts future AAMs |
| Seo et al., 2019 | ≈1000 | ML analysis of cue-related brain region followed by mass-univariate analysis for identifying region importance | Current AAMs show reduced GMV inmedial-pFC, oFC, thalamus, bilateral ACC,left amygdala and anterior insular. |
| Sullivan et al., 2020 | 548 | Longitudinal mass-univariate (GLM)analysis of cerebellar region volumes | Cerebellum: accelerated GM decline in 2 sub-regions and accelerated expansion ofWM in one sub-region and CSF. |
| Robert et al., 2020 | 726 | Mass-univariate analyses of voxels, followed by analysis of the direction of causality using causal bayesian networks | Accelerated GM atrophy in parts of the temporal cortex and left prefrontal cortex. |
| Filippi et al., 2021 | 671 | ML analysis for predictors ofresilence towards polysubstance use | Adolescents resilient to PSU show larger GMV in the bilateral cingulate gyrus. |
-
Acronyms::: GM:grey matter; WM:white matter; CSF-cerebrospinal fluid; GMV:grey matter volume; pFC:prefrontal Cortex; oFC:orbitofrontal cortex; ACC:anterior cingulate cortex; PCC:posterior cingulate cortex; GLM:generalized linear models; ML:machine learning; DTI:Diffusion Tensor Imaging; FA:Fractional Anisotropy; MD:mean diffusivity.
Table 2
10 phenotypes of Adolescent Alcohol Misuse (AAM) are derived and compared in this analysis.
A description of each phenotype is provided here along with the link to the IMAGEN questionnaires ID used to generate the phenotype.
| No. | Phenotype | Description | Questionnaire |
|---|---|---|---|
| 1 | Frequency | Number of occasions drinking alcohol in last 12 months | ESPAD 8b. |
| 2 | Amount | Number of alcohol drinks consumed on atypical drinking occasion | ESPAD prev31,AUDIT q2. |
| 3 | Onset | Had one or more binge-drinking experiences by the age of 14 | ESPAD 29d |
| 4 | Binge | Total drunk episodes from binge-drinking in lifetime (by age 22) | ESPAD 19a,AUDIT q3. |
| 5 | Binge-growth | Longitudinal trajectory of binge-drinking experiences had per year | Growth curveof ESPAD 19b. |
| 6 | AUDIT | AUDIT screening test performed at the year of scan | AUDIT-total (q1-10). |
| 7 | AUDIT-quick | Only the first 3 questions of AUDIT screening test | AUDIT-freq (q1-3). |
| 8 | AUDIT-growth | Longitudinal changes in the AUDIT score measured over the years | Growth curve ofAUDIT-total. |
| 9 | Combined-seo | A combined risky-drinking phenotype from Seo et al., 2019 generated using amount, frequency, and binge-drinking data | ESPAD 8b, 17b, 19b,and TLFB alcohol2 |
| 10 | Combined-ours | A combined risky-drinking phenotype developed by clusteringamount, frequency, and binge-drinking trajectory | AUDIT q1, q2,ESPAD 19a, growthcurve of ESPAD 19b. |
Appendix 1—table 1
Hyperparameters: Each machine learning (ML) model has a set of hyperparameters that are tuned using an inner 5-fold cross-validation during the ML exploration stage.
For both and, higher values lead to overfitting and lower values can lead to underfitting. For gradient boosting, the maximum depth of the trees is set at, 5 the maximum numbers of estimators at, 100 and the subsampling of input features is disabled as counterbalancing is used. The remaining parameters are set at the default values as defined in the scikit-learn python package.
| Model | hyperparameter | values tested |
|---|---|---|
| Logistic regression | C: Inverse of L2 regularization strength | 1000, 100, 1.0, 0.001 |
| Linear support vector machine | C: Inverse of L2 regularization strength | 1000, 100, 1.0, 0.001 |
| Kernel-basedsupport vector machine | C: Inverse of L2 regularization strengthγ: kernel coefficient of RBF kernel | 1000, 100, 1.0, 0.001’auto’, ’scale’ |
| Gradient boosting | learning_rate | 0.05, 0.25 |
Appendix 1—table 2
AAM phenotype categorization: The table explains how the ten AAM phenotypes are derived from the respective IMAGEN questionnaire.
It lists the total values in that question and what range of values are used to categorize the subjects into safe users, moderate users and heavy users, respectively. For reference, the sample sizes () obtained at FU3 by using these value ranges are also shown in the brackets.
| Phenotype | IMAGEN questionnaire | Totalrange | Safe users range (n) | Moderate misusersrange (n) | Heavy misusers range (n) |
|---|---|---|---|---|---|
| Frequency | ESPAD 8b | 0-6 | 0-4 (397) | 5 (270) | 6 (372) |
| Amount | AUDIT q2 | 0-4 | 0 (413) | 1 (403) | 2-4 (219) |
| Onset | ESPAD 29d | 11-21 | 16-21 (531) | 14-15 (288) | 11-14 (216) |
| Binge | ESPAD 19a | 0-6 | 0-3 (299) | 4-5 (336) | 6 (400) |
| Binge-growth | Growth curveof ESPAD 19b | 0-9 | 0-2 (379) | 3-5 (420) | 6-9 (236) |
| AUDIT | AUDIT-total | 0-40 | 0-4 (443) | 5-7 (274) | 8-40 (318) |
| AUDIT-quick | AUDIT-freq | 0-12 | 0-3 (402) | 4-5 (359) | 6-12 (274) |
| AUDIT-growth | Growth curveof AUDIT-total | 0-6 | 0,3 (377) | 4 (404) | 2,5,6 (254) |
| Combined-seo | ESPAD 8b, 17b, 19b,and TLFB alcohol2 | 0-2 | 0 (345) | 1 (404) | 2 (286) |
| Combined-ours | AUDIT q1, q2,ESPAD 19a, growthcurve of ESPAD 19b | 0-3 | 0 (429) | 1 (403) | 2 (203) |
Appendix 1—table 3
Most informative sMRI features: An exhaustive list of the ‘most informative’ features in all three time point analyses provided along with their obtained SHAP values across seven repetitions.
SHAP values that didn’t surpass the threshold are shown in italic. (Acronyms: area: surface area, volume: gray matter volume, thickness: average thickness, thicknessstd: standard deviation of thickness, intensity: mean intensity, meancurv: integrated rectified mean curvature, gauscurv: integrated rectified gaussian curvature, curvind: intrinsic curvature index, foldind: folding index;)
| Feature | avg. | avg. | SHAP value | ||||||||||
|---|---|---|---|---|---|---|---|---|---|---|---|---|---|
| Modality | Region | Side | Name | Type | Feature value | SHAP value | run1 | run2 | run3 | run4 | run5 | run6 | run7 |
| FU3 (no. features = 21, threshold≥ 0.008743) | |||||||||||||
| DTI | Splenium of the corpus callosum | -0.87353 | 0.014433 | 0.014127 | 0.013667 | 0.015137 | 0.015569 | 0.016892 | 0.014402 | 0.0112 | |||
| T1w | Cortical | Right | Lateral occipital cortex | Thickness | -0.677426 | 0.013378 | 0.012873 | 0.011353 | 0.012539 | 0.014382 | 0.014206 | 0.017304 | 0.011 |
| T1w | Subcortical | Cerebrospinal fluid | Intensity | 0.7903 | 0.013244 | 0.015039 | 0.013902 | 0.014382 | 0.014225 | 0.014667 | 0.009284 | 0.0112 | |
| T1w | Cortical | Left | Caudal anterior cingulate cortex | Foldind | -0.61388 | 0.012721 | 0.011392 | 0.012186 | 0.014931 | 0.014588 | 0.011412 | 0.017284 | 0.0073 |
| T1w | Subcortical | Brain-Stem | Intensity | -0.59437 | 0.012637 | 0.011784 | 0.010304 | 0.013049 | 0.014657 | 0.017569 | 0.010069 | 0.011 | |
| T1w | Subcortical | Right | Amygdala | Volume | 0.664147 | 0.012564 | 0.017804 | 0.01148 | 0.015137 | 0.012049 | 0.013353 | 0.008324 | 0.0098 |
| T1w | Cortical | Right | Parahippocampal gyrus | Area | 0.770722 | 0.012542 | 0.012373 | 0.010137 | 0.01449 | 0.015745 | 0.010049 | 0.015265 | 0.0097 |
| T1w | Cortical | Right | Cuneus cortex | Thickness | -0.634456 | 0.012373 | 0.014275 | 0.012196 | 0.013461 | 0.01198 | 0.010049 | 0.012686 | 0.012 |
| T1w | Subcortical | Right | Hippocampus | Intensity | 0.623355 | 0.0122 | 0.015461 | 0.007725 | 0.010941 | 0.012794 | 0.013255 | 0.009765 | 0.0155 |
| T1w | Subcortical | Left | Hippocampus | Intensity | 0.663395 | 0.011909 | 0.014422 | 0.010049 | 0.011314 | 0.011843 | 0.011098 | 0.012098 | 0.0125 |
| T1w | Subcortical | Left | Choroid-plexus | Volume | -0.761621 | 0.011884 | 0.010059 | 0.009392 | 0.015353 | 0.012922 | 0.013667 | 0.010049 | 0.0117 |
| T1w | Cortical | Right | Rostral anterior cingulate cortex | Thickness | 0.636769 | 0.011794 | 0.011853 | 0.009108 | 0.015412 | 0.014863 | 0.013775 | 0.009451 | 0.0081 |
| T1w | Subcortical | Anterior corpus callosum | Intensity | -0.612797 | 0.01137 | 0.009333 | 0.010373 | 0.012843 | 0.006441 | 0.014314 | 0.017451 | 0.0088 | |
| T1w | Cortical | Left | Pericalcarine cortex | Meancurv | -0.724256 | 0.011364 | 0.012657 | 0.011157 | 0.014539 | 0.010422 | 0.01301 | 0.015637 | 0.0021 |
| T1w | Cortical | Right | Superior parietal cortex | Thickness | -0.630512 | 0.011321 | 0.01051 | 0.010608 | 0.011216 | 0.012647 | 0.013245 | 0.013833 | 0.0072 |
| T1w | Cortical | Right | Parahippocampal gyrus | Meancurv | -0.791755 | 0.010913 | 0.011686 | 0.013382 | 0.007471 | 0.011735 | 0.010373 | 0.010843 | 0.0109 |
| DTI | Right | Retrolenticular part of the internal capsule | -0.712437 | 0.010793 | 0.009843 | 0.009667 | 0.012775 | 0.011961 | 0.010137 | 0.010343 | 0.0108 | ||
| T1w | Cortical | Left | Lateral orbitofrontal cortex | Meancurv | 0.696262 | 0.010761 | 0.011951 | 0.01098 | 0.011627 | 0.004167 | 0.011157 | 0.01548 | 0.01 |
| T1w | Cortical | Left | Rostral anterior cingulate cortex | Thickness | -0.746005 | 0.010644 | 0.009824 | 0.01249 | 0.01049 | 0.010588 | 0.012235 | 0.012471 | 0.0064 |
| T1w | Cortical | Right | Supramarginal gyrus | Thickness | -0.808923 | 0.010111 | 0.009627 | 0.005529 | 0.009333 | 0.009245 | 0.012451 | 0.013186 | 0.0114 |
| DTI | Left | Hippocampal component of the cingulum | -0.727728 | 0.009451 | 0.010951 | 0.00901 | 0.009392 | 0.00902 | 0.011167 | 0.007373 | 0.0092 | ||
| FU2 (no. features = 32, threshold≥ 0.009865) | |||||||||||||
| T1w | Cortical | Right | Caudal anterior cingulate cortex | Curvind | 1.591756 | 0.019167 | 0.018951 | 0.018882 | 0.018324 | 0.018314 | 0.019235 | 0.021304 | 0.0192 |
| T1w | Cortical | Left | Caudal anterior cingulate cortex | Thicknessstd | -0.746035 | 0.01701 | 0.01849 | 0.013353 | 0.022441 | 0.017098 | 0.015265 | 0.017804 | 0.0146 |
| T1w | Cortical | Left | Cuneus cortex | Curvind | 0.462589 | 0.016139 | 0.017657 | 0.015353 | 0.015284 | 0.014755 | 0.016118 | 0.018186 | 0.0156 |
| T1w | Cortical | Right | Pars traingularis | Thicknessstd | -0.81719 | 0.015997 | 0.011755 | 0.013353 | 0.018539 | 0.023647 | 0.022029 | 0.007843 | 0.0148 |
| T1w | Cortical | Left | Pericalcarine | Curvind | 0.01016 | 0.015952 | 0.013755 | 0.017059 | 0.012667 | 0.017382 | 0.018863 | 0.015912 | 0.016 |
| T1w | Cortical | Right | Inferior temporal gyrus | Thicknessstd | -0.854132 | 0.015746 | 0.014696 | 0.013696 | 0.023922 | 0.015373 | 0.019108 | 0.016951 | 0.0065 |
| T1w | Subcortical | Anterior corpus callosum | Intensity | -0.642157 | 0.015396 | 0.018255 | 0.015137 | 0.015118 | 0.012314 | 0.016137 | 0.017559 | 0.0133 | |
| T1w | Cortical | Right | Cuneus cortex | Thickness | -0.72579 | 0.014955 | 0.010167 | 0.015471 | 0.018951 | 0.017706 | 0.015343 | 0.013118 | 0.0139 |
| T1w | Cortical | Left | Pars opercularis | Volume | -0.628446 | 0.014697 | 0.016353 | 0.019078 | 0.018431 | 0.012941 | 0.01851 | 0.011588 | 0.006 |
| DTI | Left | Corticospinal tract | 0.775736 | 0.014336 | 0.013892 | 0.014314 | 0.015265 | 0.015912 | 0.014304 | 0.015549 | 0.0111 | ||
| T1w | Subcortical | White matter | Intensity | -0.754712 | 0.01421 | 0.015765 | 0.015255 | 0.010118 | 0.015951 | 0.014853 | 0.015941 | 0.0116 | |
| T1w | Cortical | Right | Frontal pole | Thickness | 0.619691 | 0.014148 | 0.017647 | 0.013255 | 0.013608 | 0.017275 | 0.012696 | 0.016333 | 0.0082 |
| T1w | Cortical | Left | Pars opercularis | Area | -0.582627 | 0.014141 | 0.018157 | 0.01598 | 0.014745 | 0.013235 | 0.017412 | 0.011471 | 0.008 |
| T1w | Cortical | Left | Frontal pole | Curvind | 0.732718 | 0.014078 | 0.015412 | 0.016422 | 0.017882 | 0.015725 | 0.010412 | 0.010196 | 0.0125 |
| T1w | Subcortical | Left | Cerebellum cortex | Intensity | 0.610253 | 0.01399 | 0.012304 | 0.01652 | 0.016275 | 0.014392 | 0.014235 | 0.01251 | 0.0117 |
| T1w | Cortical | Right | Precentral gyrus | Gauscurv | 0.299008 | 0.013556 | 0.014127 | 0.011441 | 0.010725 | 0.013304 | 0.016206 | 0.01451 | 0.0146 |
| T1w | Cortical | Left | Rostral anterior cingulate cortex | Thickness | -0.916001 | 0.013268 | 0.010324 | 0.013882 | 0.01348 | 0.01351 | 0.01249 | 0.015892 | 0.0133 |
| T1w | Cortical | Left | Caudal anterior cingulate cortex | Meancurv | -0.704352 | 0.013246 | 0.010931 | 0.008147 | 0.020755 | 0.015137 | 0.014196 | 0.011843 | 0.0117 |
| T1w | Subcortical | Brain-Stem | Intensity | -0.736592 | 0.013246 | 0.0105 | 0.015314 | 0.014471 | 0.014127 | 0.015059 | 0.013 | 0.0103 | |
| T1w | Cortical | Left | Fusiform gyrus | Thicknessstd | 0.758297 | 0.013178 | 0.012922 | 0.009735 | 0.016853 | 0.01 | 0.015471 | 0.013049 | 0.0142 |
| T1w | Cortical | Left | Lingual gyrus | Thicknessstd | 0.725356 | 0.013094 | 0.011804 | 0.017461 | 0.006804 | 0.014157 | 0.01602 | 0.01299 | 0.0124 |
| T1w | Cortical | Left | Pars opercularsis | Meancurv | -0.7511 | 0.013024 | 0.010667 | 0.01552 | 0.014235 | 0.013314 | 0.018245 | 0.013098 | 0.0061 |
| T1w | Cortical | Left | Inferior temporal gyrus | Thicknessstd | 0.73171 | 0.013018 | 0.010529 | 0.010167 | 0.014961 | 0.017627 | 0.011363 | 0.014961 | 0.0115 |
| T1w | Cortical | Right | Banks of the superior temporal sulcus | Meancurv | -0.766809 | 0.012685 | 0.014314 | 0.011863 | 0.014951 | 0.012461 | 0.0145 | 0.013363 | 0.0073 |
| T1w | Subcortical | Right | Accumbens area | Intensity | 0.640973 | 0.01263 | 0.011108 | 0.012392 | 0.013255 | 0.014971 | 0.016147 | 0.011137 | 0.0094 |
| T1w | Cortical | Right | Inferior parietal cortex | Area | 0.844075 | 0.012417 | 0.015324 | 0.008647 | 0.011196 | 0.01401 | 0.011784 | 0.012951 | 0.013 |
| T1w | Cortical | Left | Pericalcarine cortex | Thickness | -0.738264 | 0.012266 | 0.010647 | 0.011167 | 0.014951 | 0.01648 | 0.011618 | 0.011922 | 0.0091 |
| T1w | Cortical | Right | Pars opercularis | Area | -0.562211 | 0.012139 | 0.010824 | 0.012941 | 0.013902 | 0.013304 | 0.015216 | 0.010029 | 0.0088 |
| T1w | Subcortical | Left | Cerebellum white matter | Intensity | 0.747148 | 0.012045 | 0.012363 | 0.01052 | 0.017598 | 0.015078 | 0.012284 | 0.011902 | 0.0046 |
| T1w | Cortical | Left | Superior parietal cortex | Thicknessstd | 0.725889 | 0.012003 | 0.011598 | 0.011794 | 0.011843 | 0.016029 | 0.010637 | 0.009363 | 0.0128 |
| T1w | Cortical | Right | Postcentral gyrus | Curvind | 0.84478 | 0.011399 | 0.008569 | 0.014353 | 0.012353 | 0.012971 | 0.010343 | 0.010392 | 0.0108 |
| T1w | Subcortical | Left | Inferior lateral ventricle | Volume | -0.602808 | 0.010917 | 0.014912 | 0.009882 | 0.01049 | 0.011059 | 0.01051 | 0.009441 | 0.0101 |
| BL (no. features = 46, threshold≥ 0.00993) | |||||||||||||
| T1w | Subcortical | Right | Pallidum | Volume | 0.775721 | 0.023244 | 0.020892 | 0.019804 | 0.018647 | 0.022333 | 0.025186 | 0.030343 | 0.0255 |
| T1w | Cortical | Left | Temporal pole | Volume | 0.777293 | 0.021441 | 0.019167 | 0.018696 | 0.019637 | 0.02052 | 0.02452 | 0.023716 | 0.0238 |
| T1w | Subcortical | Right | Cerebellum cortex | Volume | 0.830438 | 0.020328 | 0.023157 | 0.023118 | 0.018931 | 0.017265 | 0.019608 | 0.022049 | 0.0182 |
| T1w | Subcortical | Anterior corpus callosum | Intensity | -0.711844 | 0.01865 | 0.020873 | 0.021353 | 0.012127 | 0.019637 | 0.023373 | 0.012922 | 0.0203 | |
| T1w | Cortical | Left | Rostral middle frontal gyrus | Thicknessstd | -0.772379 | 0.018557 | 0.020049 | 0.016147 | 0.013402 | 0.02051 | 0.019088 | 0.019049 | 0.0217 |
| T1w | Cortical | Right | Parahippocampal gyrus | Area | 0.82387 | 0.018141 | 0.023725 | 0.012539 | 0.014431 | 0.021775 | 0.016961 | 0.017618 | 0.0199 |
| T1w | Cortical | Right | Inferior parietal cortex | Volume | 0.747201 | 0.018085 | 0.018373 | 0.018549 | 0.012686 | 0.020765 | 0.01851 | 0.019971 | 0.0177 |
| T1w | Cortical | Left | Lateral occipital cortex | Thickness | -0.733224 | 0.017517 | 0.017627 | 0.014441 | 0.014373 | 0.025794 | 0.018529 | 0.018667 | 0.0132 |
| T1w | Cortical | Right | Banks of the superior temporal sulcus | Meancurv | -0.7106 | 0.016707 | 0.019931 | 0.019559 | 0.015196 | 0.013127 | 0.01498 | 0.014706 | 0.0195 |
| T1w | Cortical | Right | Parahippocampal gyrus | Volume | 0.882348 | 0.016598 | 0.020588 | 0.013324 | 0.011706 | 0.020304 | 0.015363 | 0.017765 | 0.0171 |
| T1w | Cortical | Left | Pericalcarine cortex | Thickness | -0.693217 | 0.015763 | 0.015657 | 0.010235 | 0.013569 | 0.019176 | 0.016049 | 0.022069 | 0.0136 |
| DTI | Posterior corona radiata | -0.7244 | 0.015693 | 0.020441 | 0.015324 | 0.011775 | 0.018667 | 0.015873 | 0.015784 | 0.012 | |||
| T1w | Cortical | Right | Superior parietal cortex | Thicknessstd | 0.751469 | 0.015426 | 0.018333 | 0.017088 | 0.013176 | 0.020196 | 0.009814 | 0.016098 | 0.0133 |
| DTI | Right | Posterior corona radiata | -0.697344 | 0.015406 | 0.020461 | 0.016431 | 0.011333 | 0.012902 | 0.019804 | 0.012245 | 0.0147 | ||
| T1w | Cortical | Left | Paracentral lobule | Area | -0.695895 | 0.014994 | 0.012765 | 0.013294 | 0.013824 | 0.012775 | 0.01199 | 0.023284 | 0.017 |
| T1w | Cortical | Left | Pars orbitalis | Area | 0.756453 | 0.014944 | 0.015892 | 0.013441 | 0.011363 | 0.014167 | 0.014245 | 0.016922 | 0.0186 |
| T1w | Cortical | Left | Superior parietal cortex | Thicknessstd | 0.681101 | 0.014908 | 0.016196 | 0.01598 | 0.009784 | 0.012431 | 0.012775 | 0.022716 | 0.0145 |
| T1w | Cortical | Right | Cuneus cortex | Volume | -0.753021 | 0.014805 | 0.015284 | 0.014608 | 0.010255 | 0.012039 | 0.016402 | 0.017392 | 0.0177 |
| T1w | Cortical | Right | Pericalcarine cortex | Thickness | -0.599115 | 0.014742 | 0.016441 | 0.014245 | 0.013108 | 0.013588 | 0.016255 | 0.016108 | 0.0135 |
| T1w | Cortical | Left | Rostral anterior cingulate cortex | Curvind | 0.861164 | 0.014357 | 0.019578 | 0.017206 | 0.0125 | 0.013127 | 0.006725 | 0.011539 | 0.0198 |
| T1w | Cortical | Right | Inferior parietal cortex | Area | 0.778327 | 0.014151 | 0.016353 | 0.016559 | 0.007843 | 0.015961 | 0.015176 | 0.013078 | 0.0141 |
| T1w | Cortical | Right | Cuneus cortex | Thickness | -0.650155 | 0.014062 | 0.01401 | 0.012755 | 0.014706 | 0.012755 | 0.013451 | 0.018059 | 0.0127 |
| DTI | Right | Retrolenticular part of internal capsule | -0.715854 | 0.013992 | 0.011765 | 0.017833 | 0.00751 | 0.014333 | 0.016422 | 0.013725 | 0.0164 | ||
| T1w | Cortical | Right | Inferior parietal cortex | Thicknessstd | 0.710387 | 0.013828 | 0.014637 | 0.013706 | 0.014118 | 0.012402 | 0.008814 | 0.017324 | 0.0158 |
| T1w | Subcortical | Anterior corpus callosum | Volume | 0.828249 | 0.013824 | 0.014667 | 0.014951 | 0.014147 | 0.016588 | 0.012225 | 0.010637 | 0.0135 | |
| T1w | Cortical | Left | Medial orbitofrontal cortex | Thicknessstd | 0.75355 | 0.013815 | 0.018461 | 0.013059 | 0.011608 | 0.009706 | 0.01999 | 0.013627 | 0.0103 |
| T1w | Subcortical | Left | Cerebellum cortex | Volume | 0.815826 | 0.013696 | 0.014559 | 0.012245 | 0.015069 | 0.008245 | 0.01551 | 0.017686 | 0.0126 |
| T1w | Cortical | Right | Pars opercularis | Thickness | -0.752197 | 0.01369 | 0.015 | 0.015784 | 0.005745 | 0.01399 | 0.018029 | 0.013127 | 0.0142 |
| DTI | Right | Anterior limb of internal capsule | 0.776713 | 0.013662 | 0.010971 | 0.013343 | 0.013647 | 0.011853 | 0.015196 | 0.013559 | 0.0171 | ||
| T1w | Cortical | Right | Transveretemporal cortex | Thickness | 0.693202 | 0.013654 | 0.012941 | 0.014343 | 0.008676 | 0.018784 | 0.014314 | 0.01152 | 0.015 |
| T1w | Cortical | Right | Isthmus cingulate cortex | Thicknessstd | 0.654339 | 0.013653 | 0.014667 | 0.012931 | 0.011961 | 0.010461 | 0.019618 | 0.013275 | 0.0127 |
| T1w | Cortical | Right | Medial orbitofrontal cortex | Meancurv | 0.867091 | 0.013538 | 0.012412 | 0.010245 | 0.008775 | 0.018255 | 0.012078 | 0.01652 | 0.0165 |
| DTI | Left | Posterior corona radiata | -0.69722 | 0.013132 | 0.015314 | 0.011696 | 0.010088 | 0.017137 | 0.01102 | 0.017343 | 0.0093 | ||
| DTI | Left | Corticospinal tract | 0.823927 | 0.013063 | 0.017108 | 0.014441 | 0.011216 | 0.013373 | 0.013186 | 0.012765 | 0.0094 | ||
| T1w | Cortical | Left | Lateral orbitofrontal cortex | Meancurv | 0.771492 | 0.012777 | 0.010775 | 0.015059 | 0.006745 | 0.018373 | 0.014176 | 0.01202 | 0.0123 |
| T1w | Subcortical | Brain-Stem | Intensity | -0.791678 | 0.012619 | 0.015882 | 0.011539 | 0.010951 | 0.010461 | 0.011814 | 0.011667 | 0.016 | |
| DTI | Splenium of corpus callosum | -0.817257 | 0.012545 | 0.011627 | 0.010441 | 0.013176 | 0.014029 | 0.013196 | 0.015147 | 0.0102 | |||
| T1w | Cortical | Left | Medial orbitofrontal cortex | Area | -0.768057 | 0.012541 | 0.014549 | 0.012225 | 0.011353 | 0.011039 | 0.011059 | 0.011706 | 0.0159 |
| T1w | Cortical | Left | Paracentral lobule | Volume | -0.72805 | 0.012517 | 0.010078 | 0.010402 | 0.011431 | 0.012176 | 0.009196 | 0.020353 | 0.014 |
| T1w | Subcortical | Left | Inferior lateral ventricle | Volume | -0.541217 | 0.01238 | 0.013245 | 0.010324 | 0.013863 | 0.013676 | 0.010186 | 0.009676 | 0.0157 |
| T1w | Cortical | Right | Pericalcarine cortex | Volume | -0.62829 | 0.012329 | 0.011176 | 0.014784 | 0.010078 | 0.010451 | 0.011029 | 0.015794 | 0.013 |
| T1w | Cortical | Left | Isthmus cingulate cortex | Volume | 0.87903 | 0.012158 | 0.010794 | 0.011353 | 0.011186 | 0.011725 | 0.009412 | 0.013716 | 0.0169 |
| T1w | Cortical | Left | Temporal pole | Thicknessstd | -0.780085 | 0.011993 | 0.011049 | 0.011735 | 0.012118 | 0.015598 | 0.007608 | 0.012618 | 0.0132 |
| T1w | Cortical | Right | Isthmus cingulate cortex | Meancurv | 0.859662 | 0.011721 | 0.012039 | 0.015029 | 0.01152 | 0.012657 | 0.010284 | 0.010451 | 0.0101 |
| DTI | Retrorenticular part of internal capsule | -0.745934 | 0.010933 | 0.010765 | 0.010637 | 0.00401 | 0.013343 | 0.011833 | 0.014029 | 0.0119 | |||
| DTI | Left | Inferior fronto-occipital fasciculus | 0.914131 | 0.010721 | 0.010794 | 0.013069 | 0.005735 | 0.012745 | 0.010363 | 0.011108 | 0.0112 | ||
Additional files
Download links
A two-part list of links to download the article, or parts of the article, in various formats.
Downloads (link to download the article as PDF)
Open citations (links to open the citations from this article in various online reference manager services)
Cite this article (links to download the citations from this article in formats compatible with various reference manager tools)
Structural differences in adolescent brains can predict alcohol misuse
eLife 11:e77545.
https://doi.org/10.7554/eLife.77545


