Personality traits are consistently associated with blood mitochondrial DNA copy number estimated from genome sequences in two genetic cohort studies
- Translational Gerontology Branch, National Institute on Aging, United States
- Department of Geriatrics, Florida State University, United States
- Laboratory of Behavioral Neuroscience, National Institute on Aging, United States
- Division of Behavioral Medicine, Department of Psychiatry; Merritt Center and Columbia Translational Neuroscience initiative, Department of Neurology, Columbia University Irving Medical Center; New York State Psychiatric Institute, United States
- Laboratory of Genetics and Genomics, National Institute on Aging, United States
- Department of Behavioral Sciences and Social Medicine, College of Medicine, Florida State University, United States
- Istituto di Ricerca Genetica e Biomedica, Consiglio Nazionale delle Ricerche, Italy
- Neurodegenerative Diseases Research Unit, National Institute of Neurological Disorders and Stroke, United States
- Department of Neurology, Johns Hopkins University Medical Center, United States
- Laboratory of Neurogenetics, National Institute on Aging, United States
Figures
Figure 1
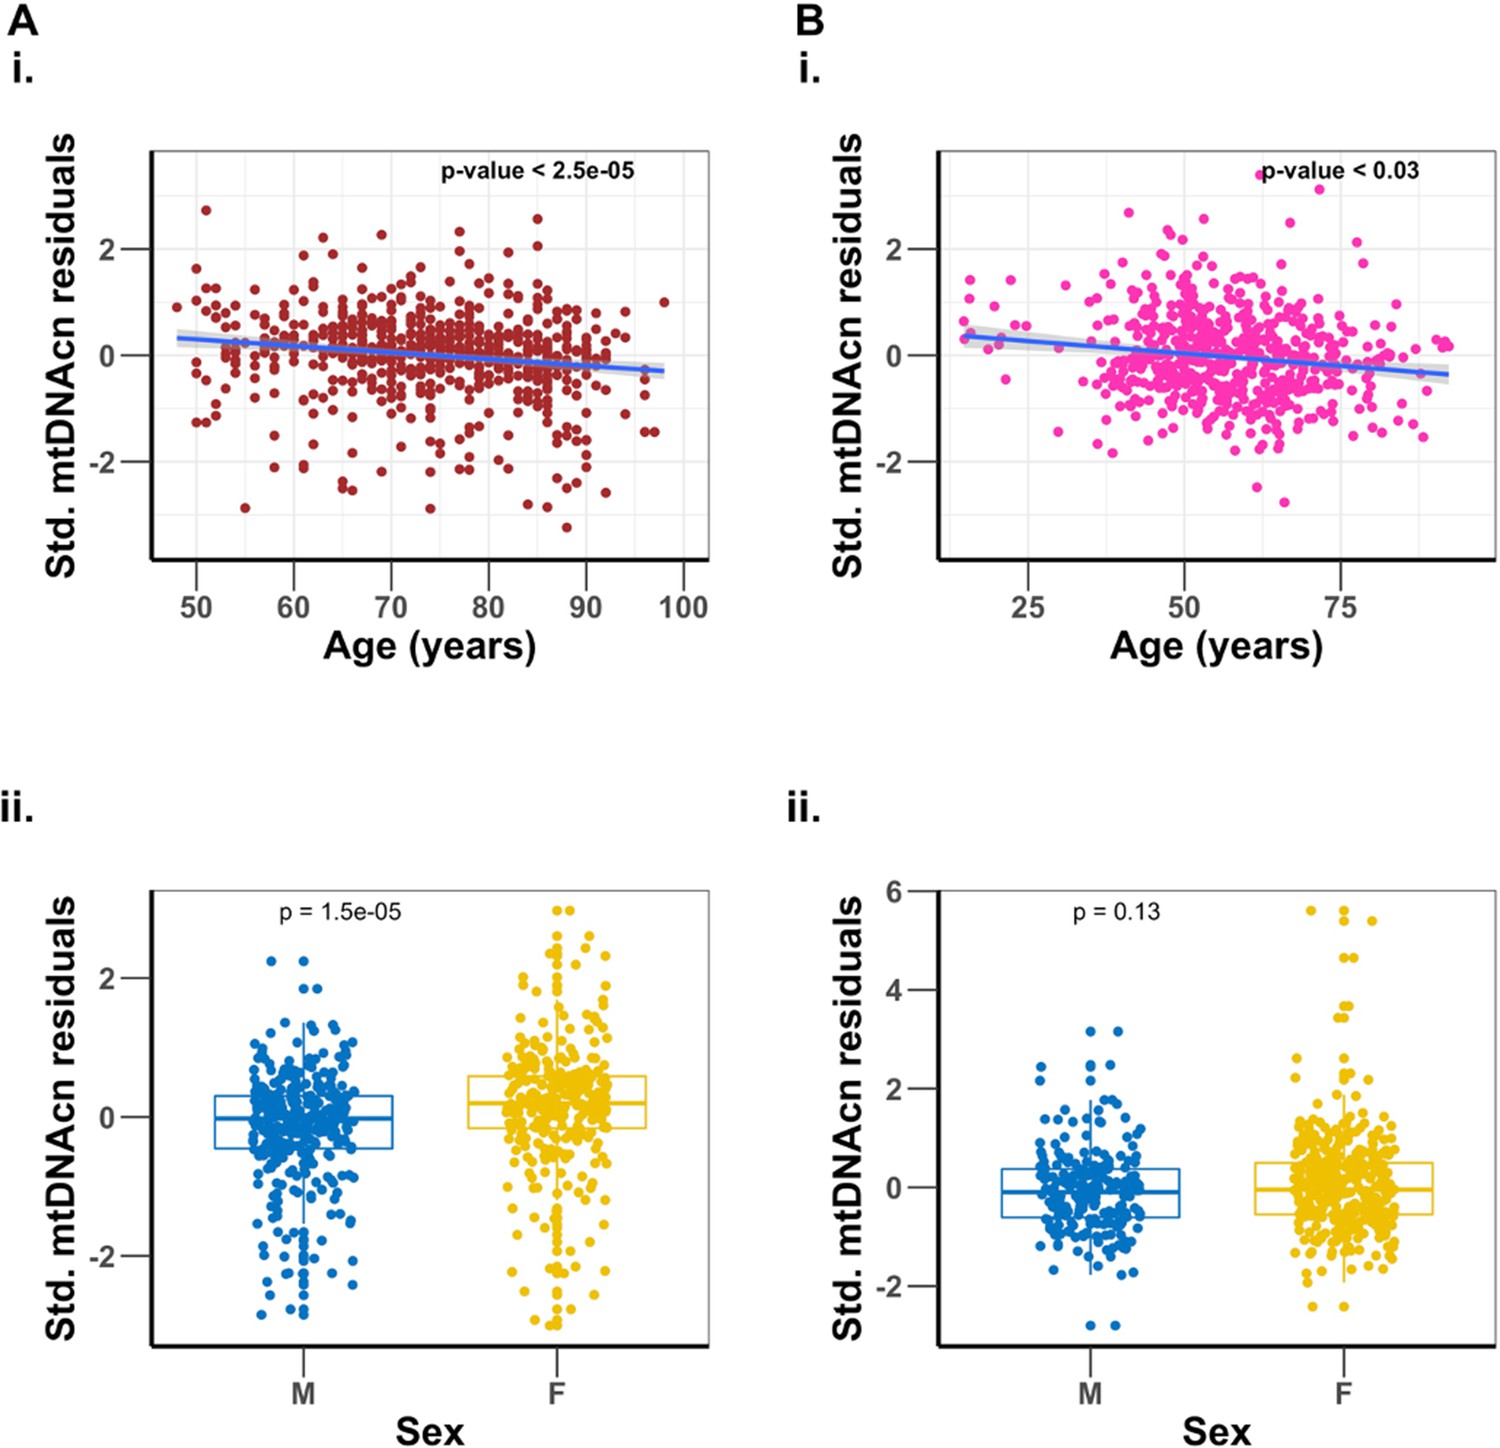
Association of mitochondrial DNA copy number (mtDNAcn) with age, and sex differences.
Panel (A) is the Baltimore Longitudinal Study of Aging (BLSA) cohort, and panel (B) is the SardiNIA cohort. Plots (i) are regression of mtDNAcn residuals on age after adjusting for sex, sequence coverage, platelets count, and white blood cell parameters. Plots (ii) are comparisons of mtDNAcn residuals after adjusting for age, sequence coverage, platelets count, and white blood cell parameters between males (M) and females (F), with t-test p-values shown.
Figure 2
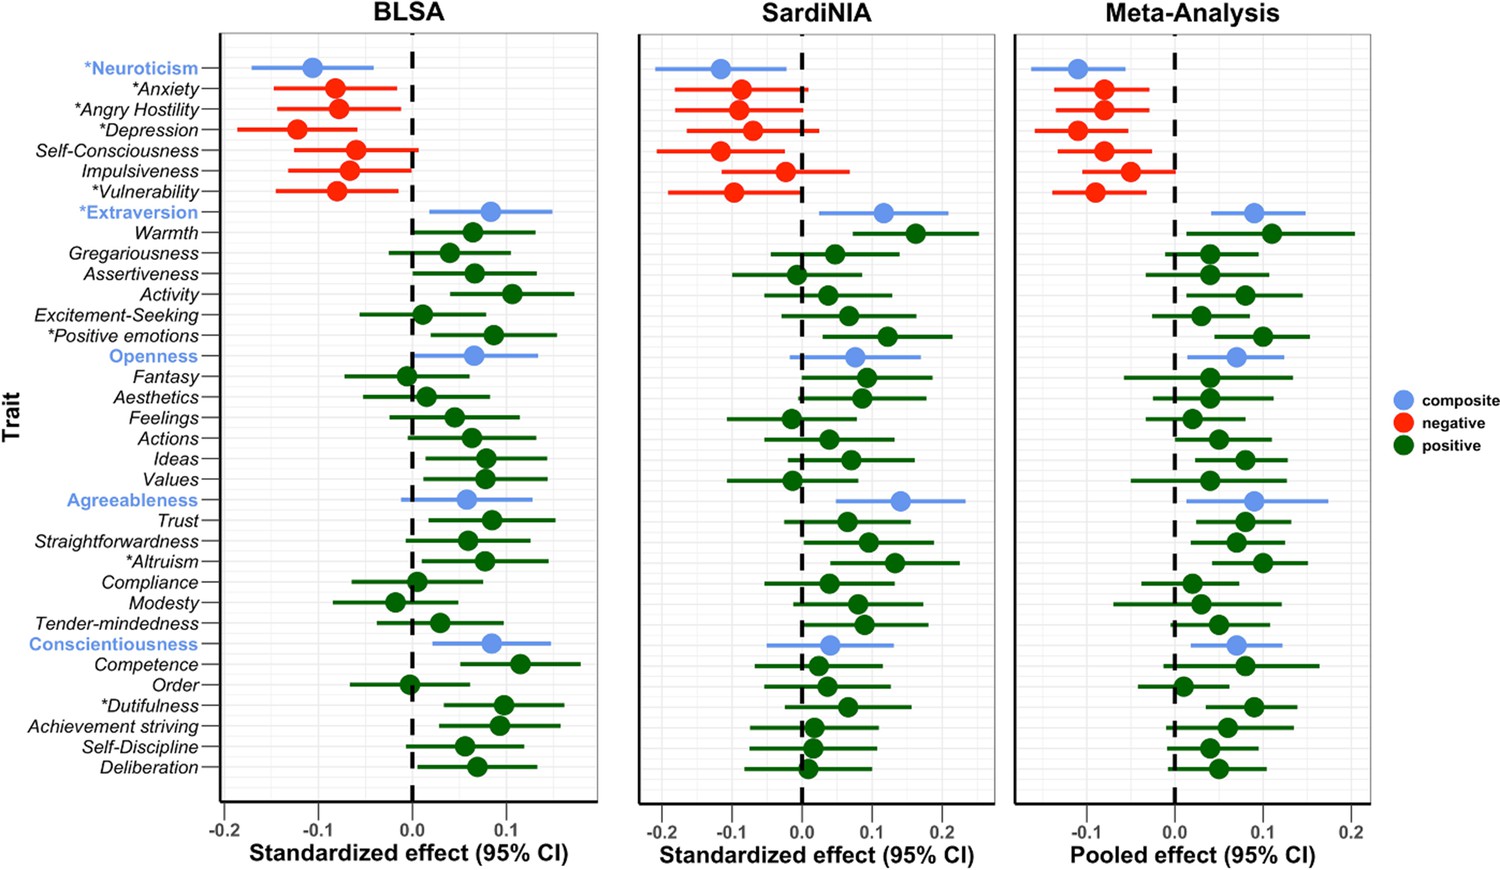
Association of Revised NEO Personality Inventory (NEO-PI-R) traits with mitochondrial DNA copy number (mtDNAcn).
Standardized/pooled effects with 95% CI of NEO-PI-R traits after adjusting for the effects of age, sex, sequence coverage, platelets count, and white blood cell parameters. Color coding is green for positive personality types, red for negative personality types, and blue for the composite scores for the big five NEO-PI-R domains. * Traits with false discovery rate (FDR)-corrected meta-analysis p-values≤0.01.
Figure 3
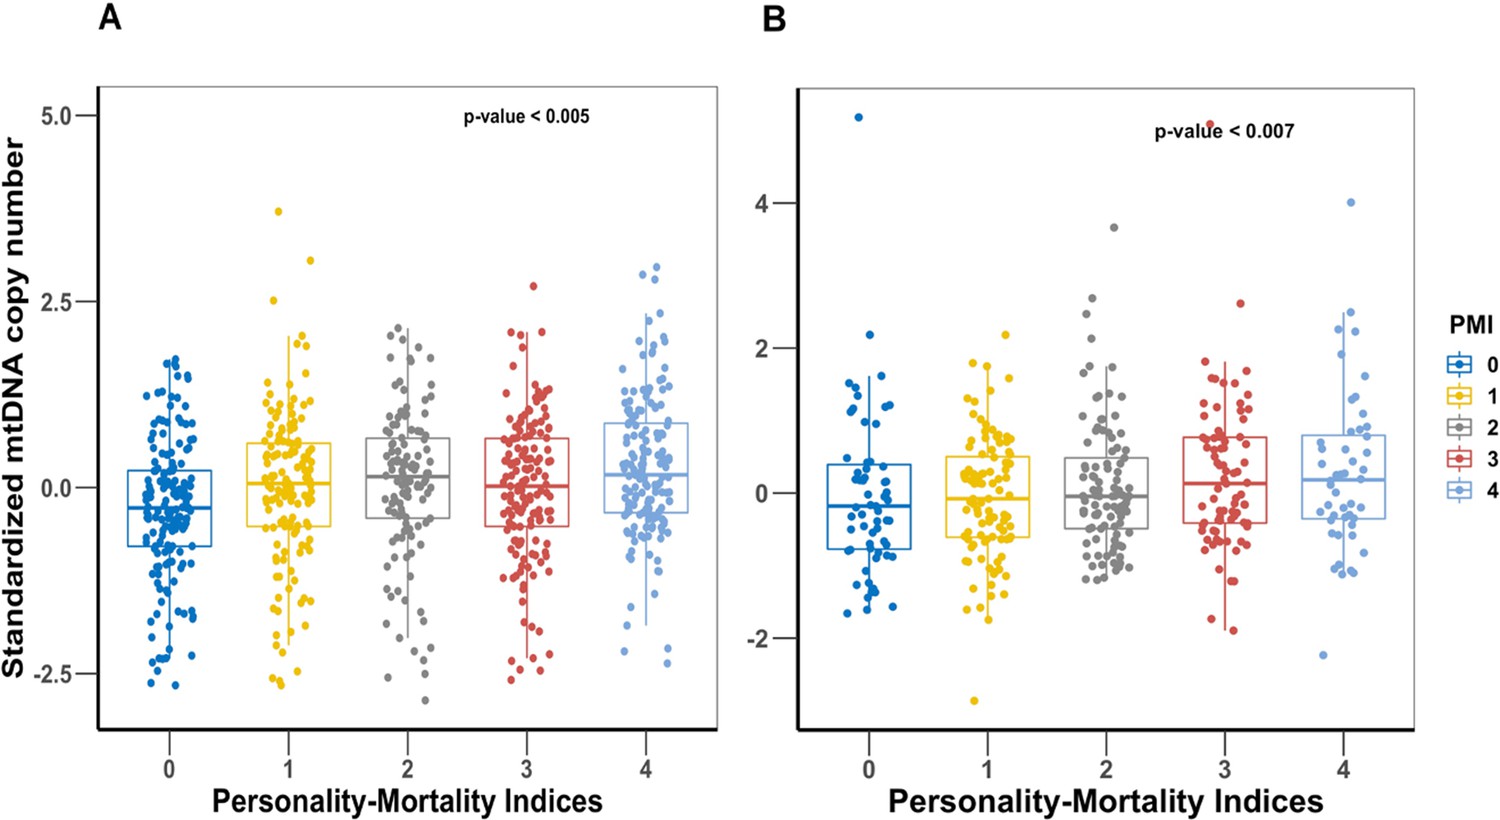
Comparison of mitochondrial DNA copy number (mtDNAcn) values among the five personality-mortality indices created from the vulnerability facet of Neuroticism, activity facet of Extraversion, and self-discipline and competence facets of Conscientiousness.
Panel (A) is Baltimore Longitudinal Study of Aging (BLSA) cohort, and panel (B) is SardiNIA cohort. The personality-mortality index with the lowest mortality risk is 4, and the index with the highest mortality risk is index 0. p-Values of linear regression of mtDNAcn and the personality-mortality index are shown on the plots.
Figure 4
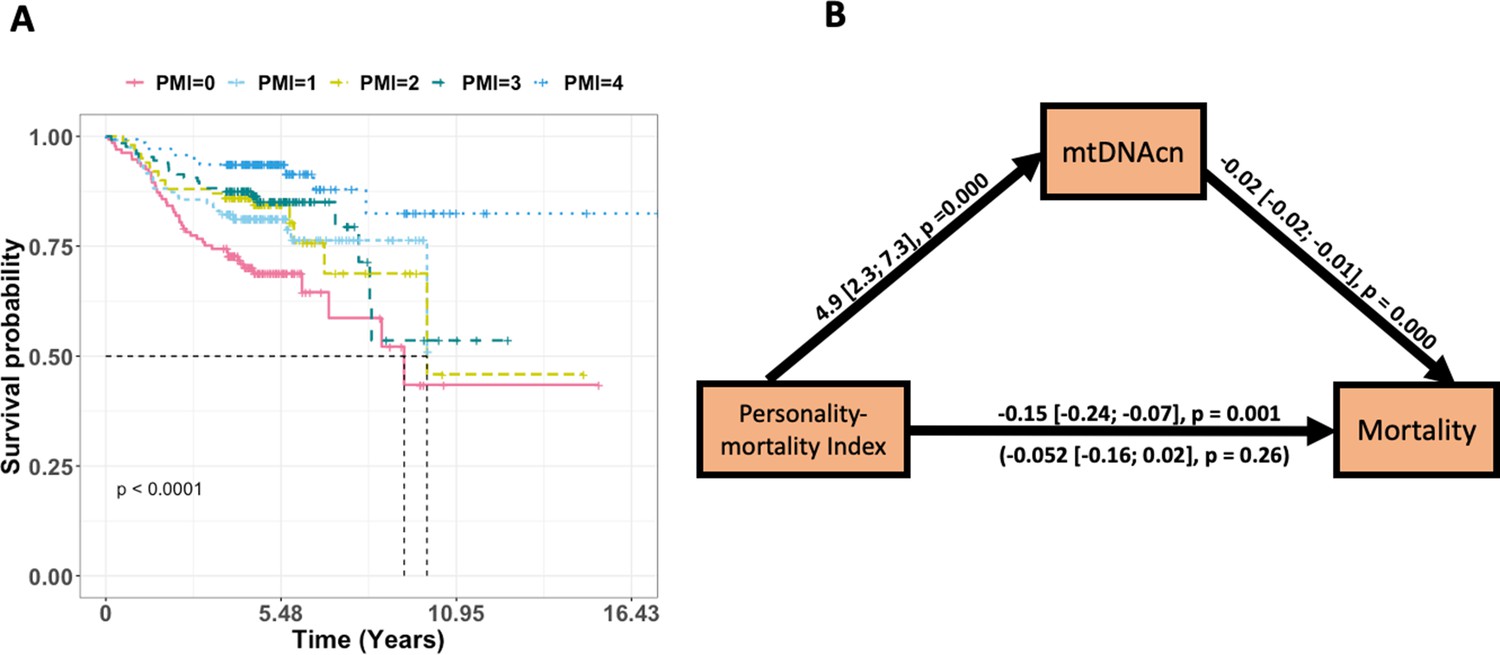
The effect of personality-mortality index (PMI) on mortality is significantly mediated via mitochondrial DNA copy number (mtDNAcn).
Panel (A) is a Kaplan–Meier plot of time to death of Baltimore Longitudinal Study of Aging (BLSA) participants in the five PMIs. Panel (B) shows the regression coefficients between PMI (predictor), mortality (outcome), and mtDNAcn (mediator) for the BLSA study. The effects of age and sex are adjusted for in the models. The indirect effect is (4.89) × (–0.02) = –0.097. We tested for the significance of the indirect effect using 5000 bootstrap samples and it was statistically significant (p-value=0.002). See Table 3 for more details.
Appendix 1—figure 1
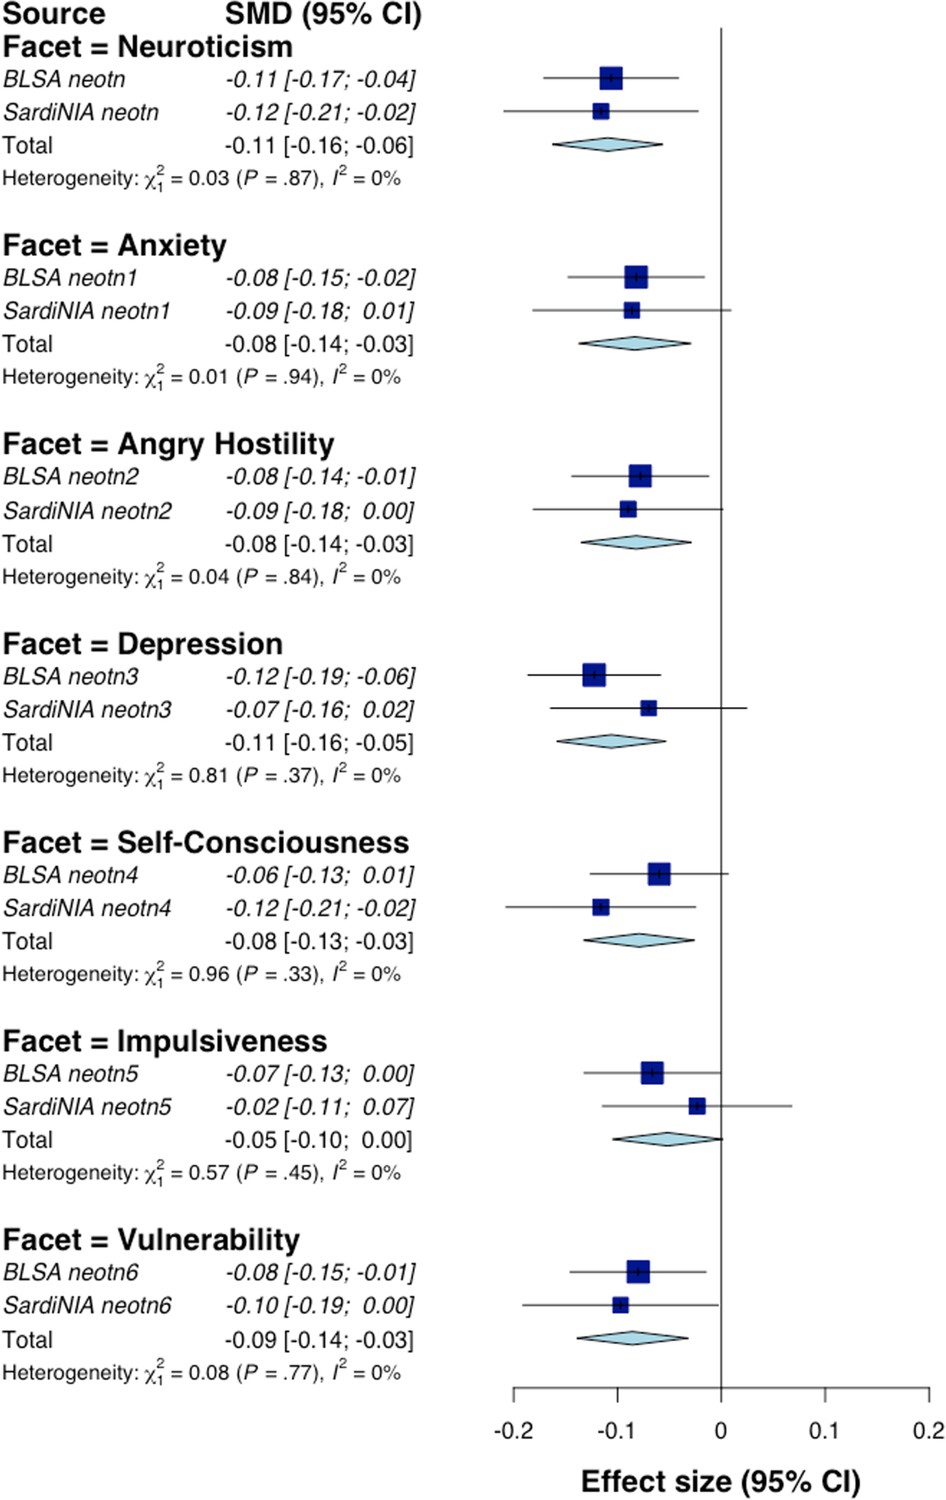
Random-effect meta-analysis of Neuroticism domain of Revised NEO Personality Inventory (NEO-PI-R).
Appendix 1—figure 2
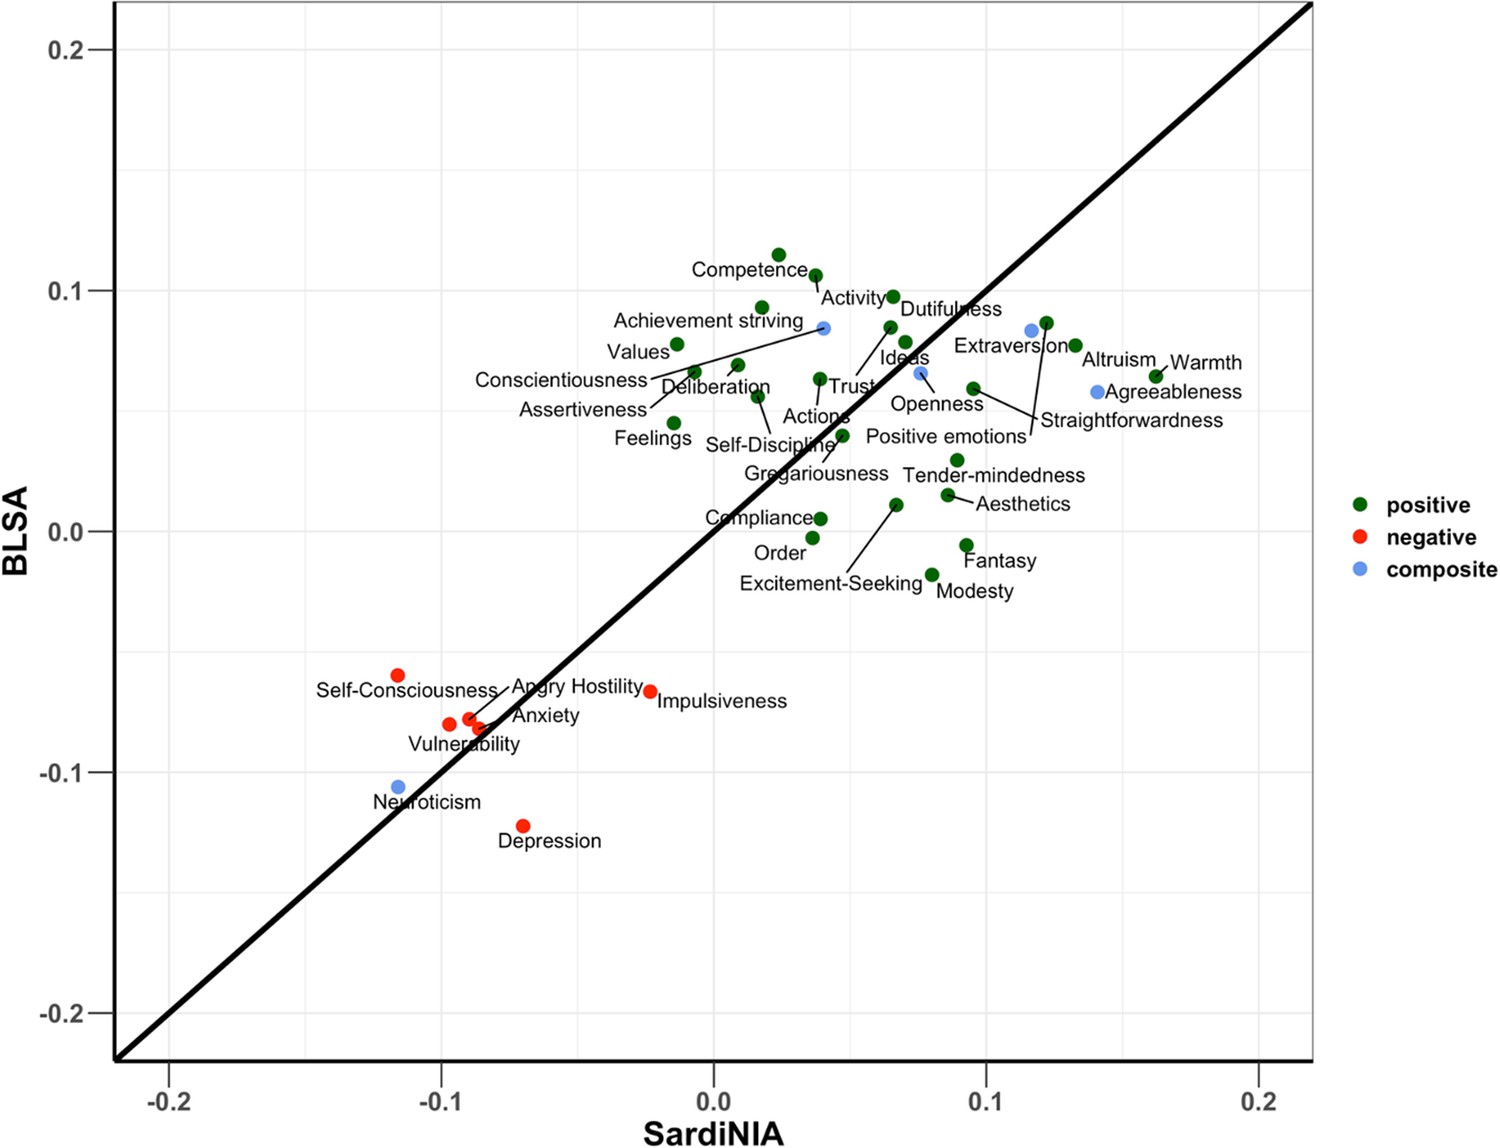
Comparison of effect sizes of Revised NEO Personality Inventory (NEO-PI-R) traits between the two cohorts.
Regression model adjusted for the effects of age, sex, sequence coverage, and white blood cell parameters. Color coding is green for positive personality types, red for negative personality types, and blue for the composite scores for the big five NEO-PI-R domains.
Appendix 1—figure 3
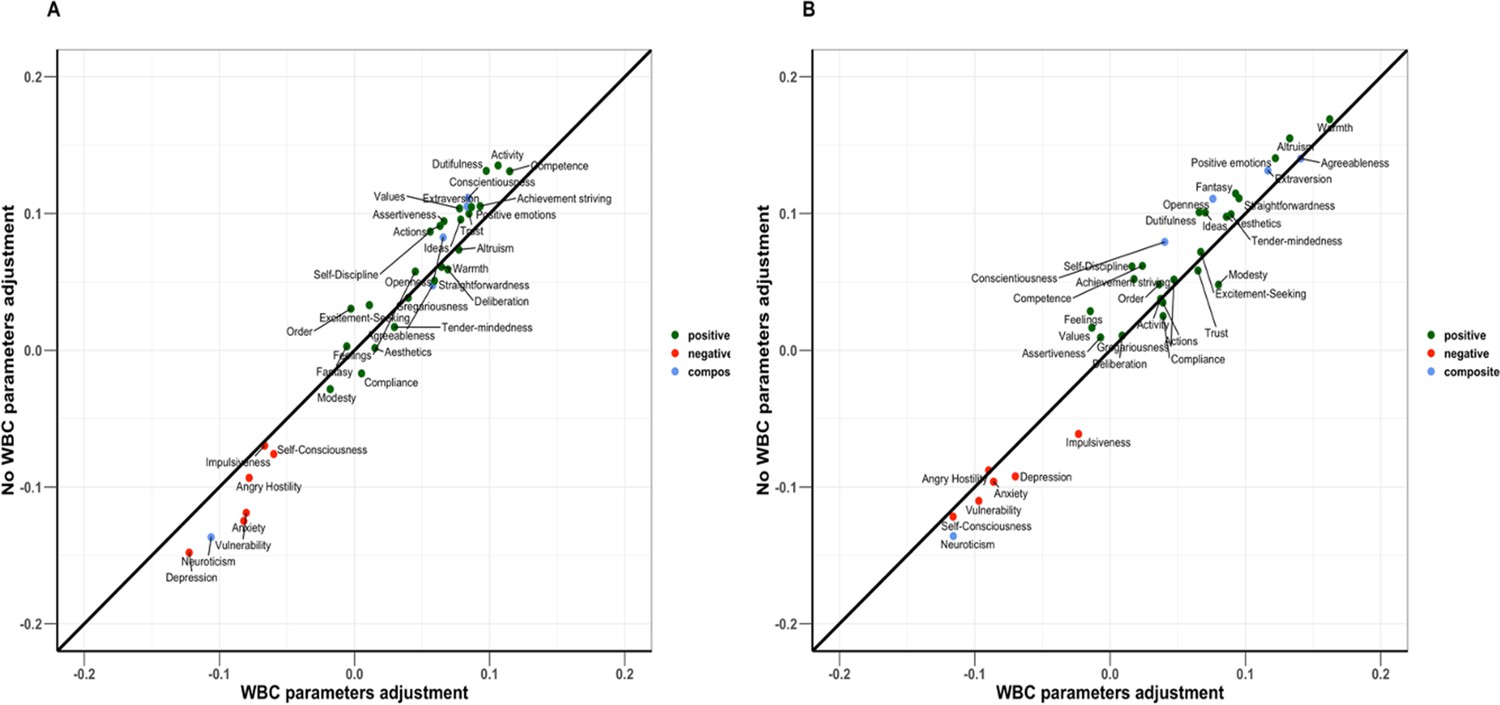
Comparison of effect sizes of Revised NEO Personality Inventory (NEO-PI-R) traits between models with white blood cell (WBC) parameters adjustments and with no adjustments.
Panel (A) is Baltimore Longitudinal Study of Aging (BLSA) cohort, and panel (B) is SardiNIA cohort. Color coding is green for positive personality types, red for negative personality types, and blue for the composite scores for the big five NEO-PI-R domains.
Appendix 1—figure 4
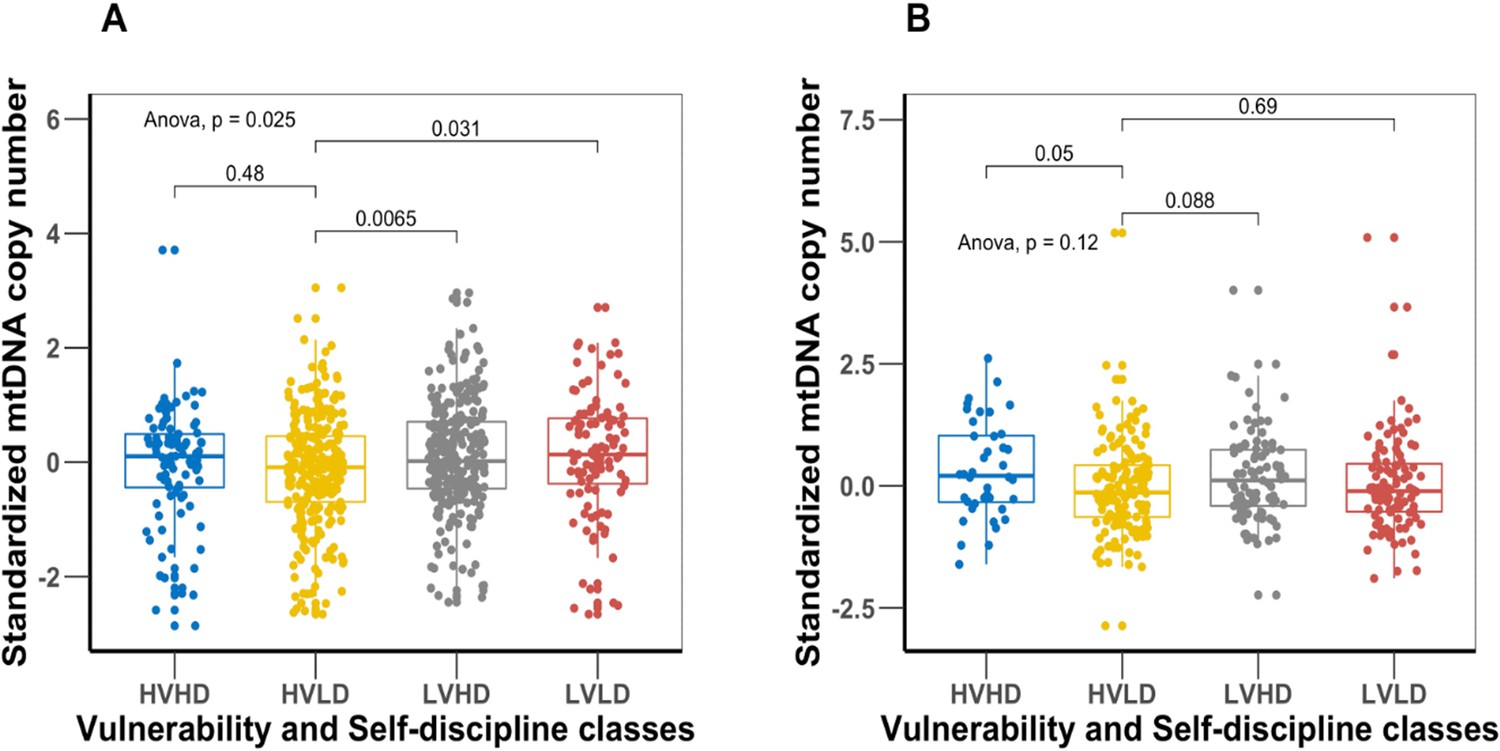
Comparison of mitochondrial DNA copy number (mtDNAcn) values among the four distinct personality types created from the vulnerability facet of Neuroticism and self-discipline facet of Conscientiousness.
Panel (A) is Baltimore Longitudinal Study of Aging (BLSA) cohort, and panel (B) is SardiNIA cohort. The personality type with lowest mortality risk (low vulnerability high self-discipline [LVHD]) has a significantly higher mean mtDNAcn value than the highest mortality risk type (high vulnerability low self-discipline [HVLD]).
Appendix 1—figure 5
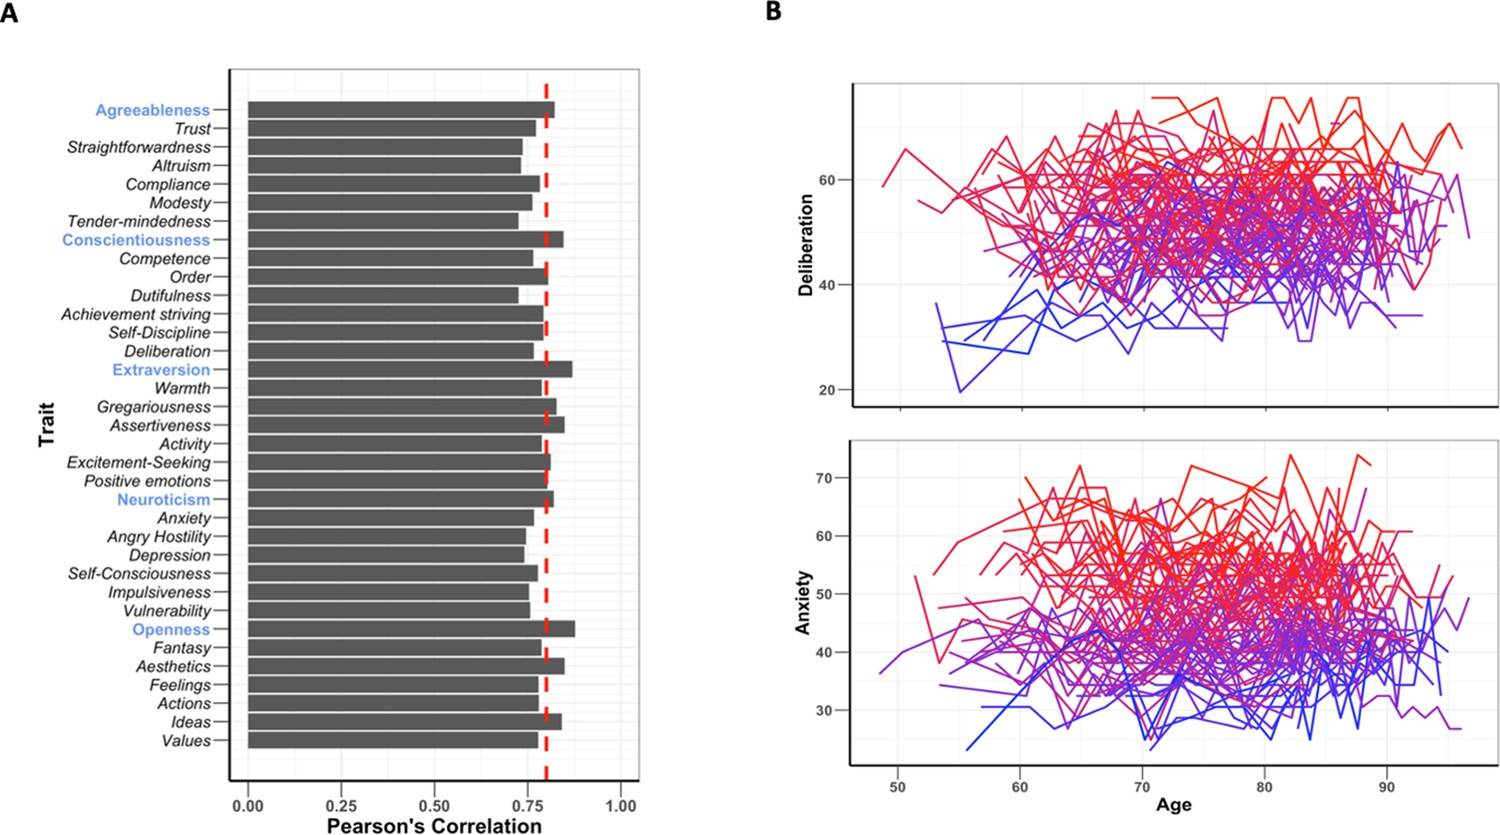
Stability of Revised NEO Personality Inventory (NEO-PI-R) traits across multiple visits.
(A) Test–retest stability of the NEO-PI-R traits. Red dash line is Pearson’s correlation of 0.8. All the traits have a high test–retest reliability. (B) The stability of two randomly selected personality traits (Deliberation and Activity) across multiple measurement visits. Plot color represents starting trait values; blue shows individual’s lower initial trait values, and red shows higher initial trait values. The plot shows that subsequent trait measurement tends to stabilize around the initial measurement values.
Appendix 1—figure 6
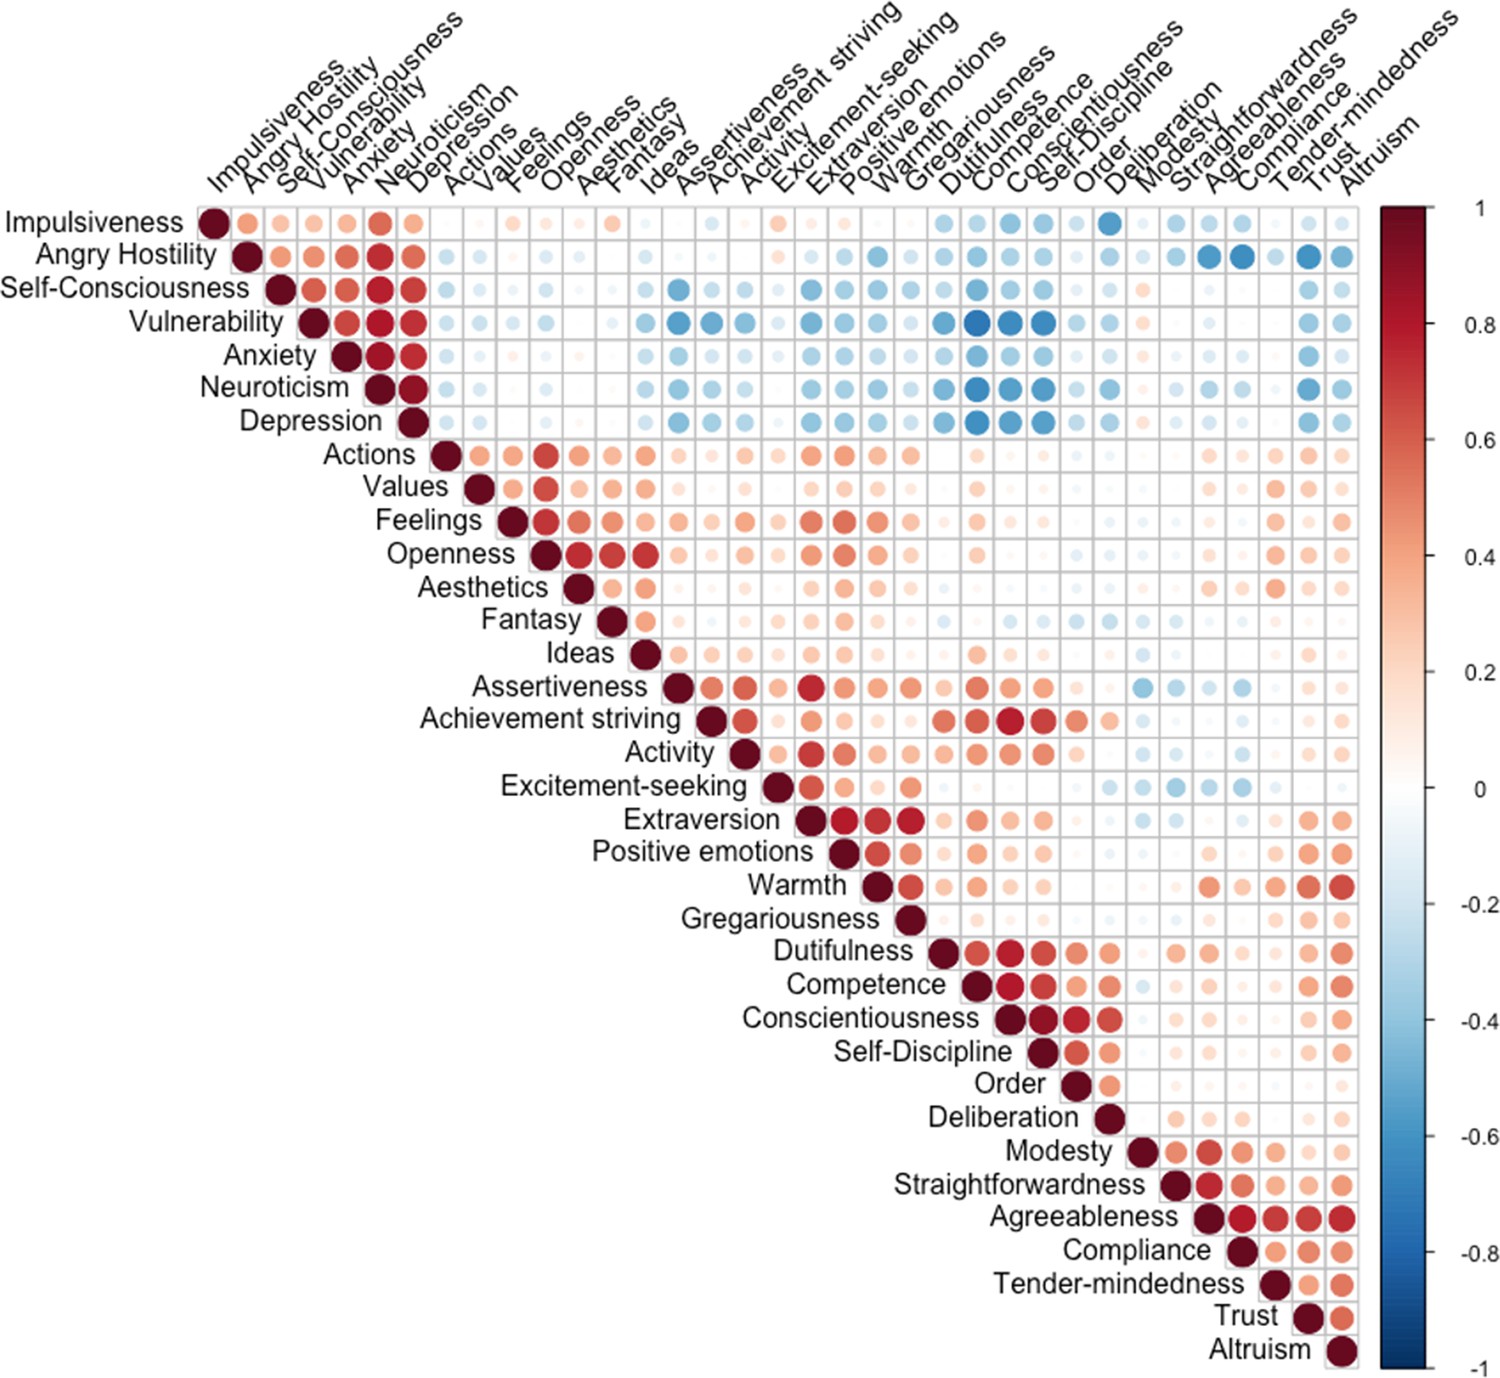
Correlation between Revised NEO Personality Inventory (NEO-PI-R) traits.
The color intensity and size of circles are indications of the size and significance of the correlation.
Appendix 1—figure 7
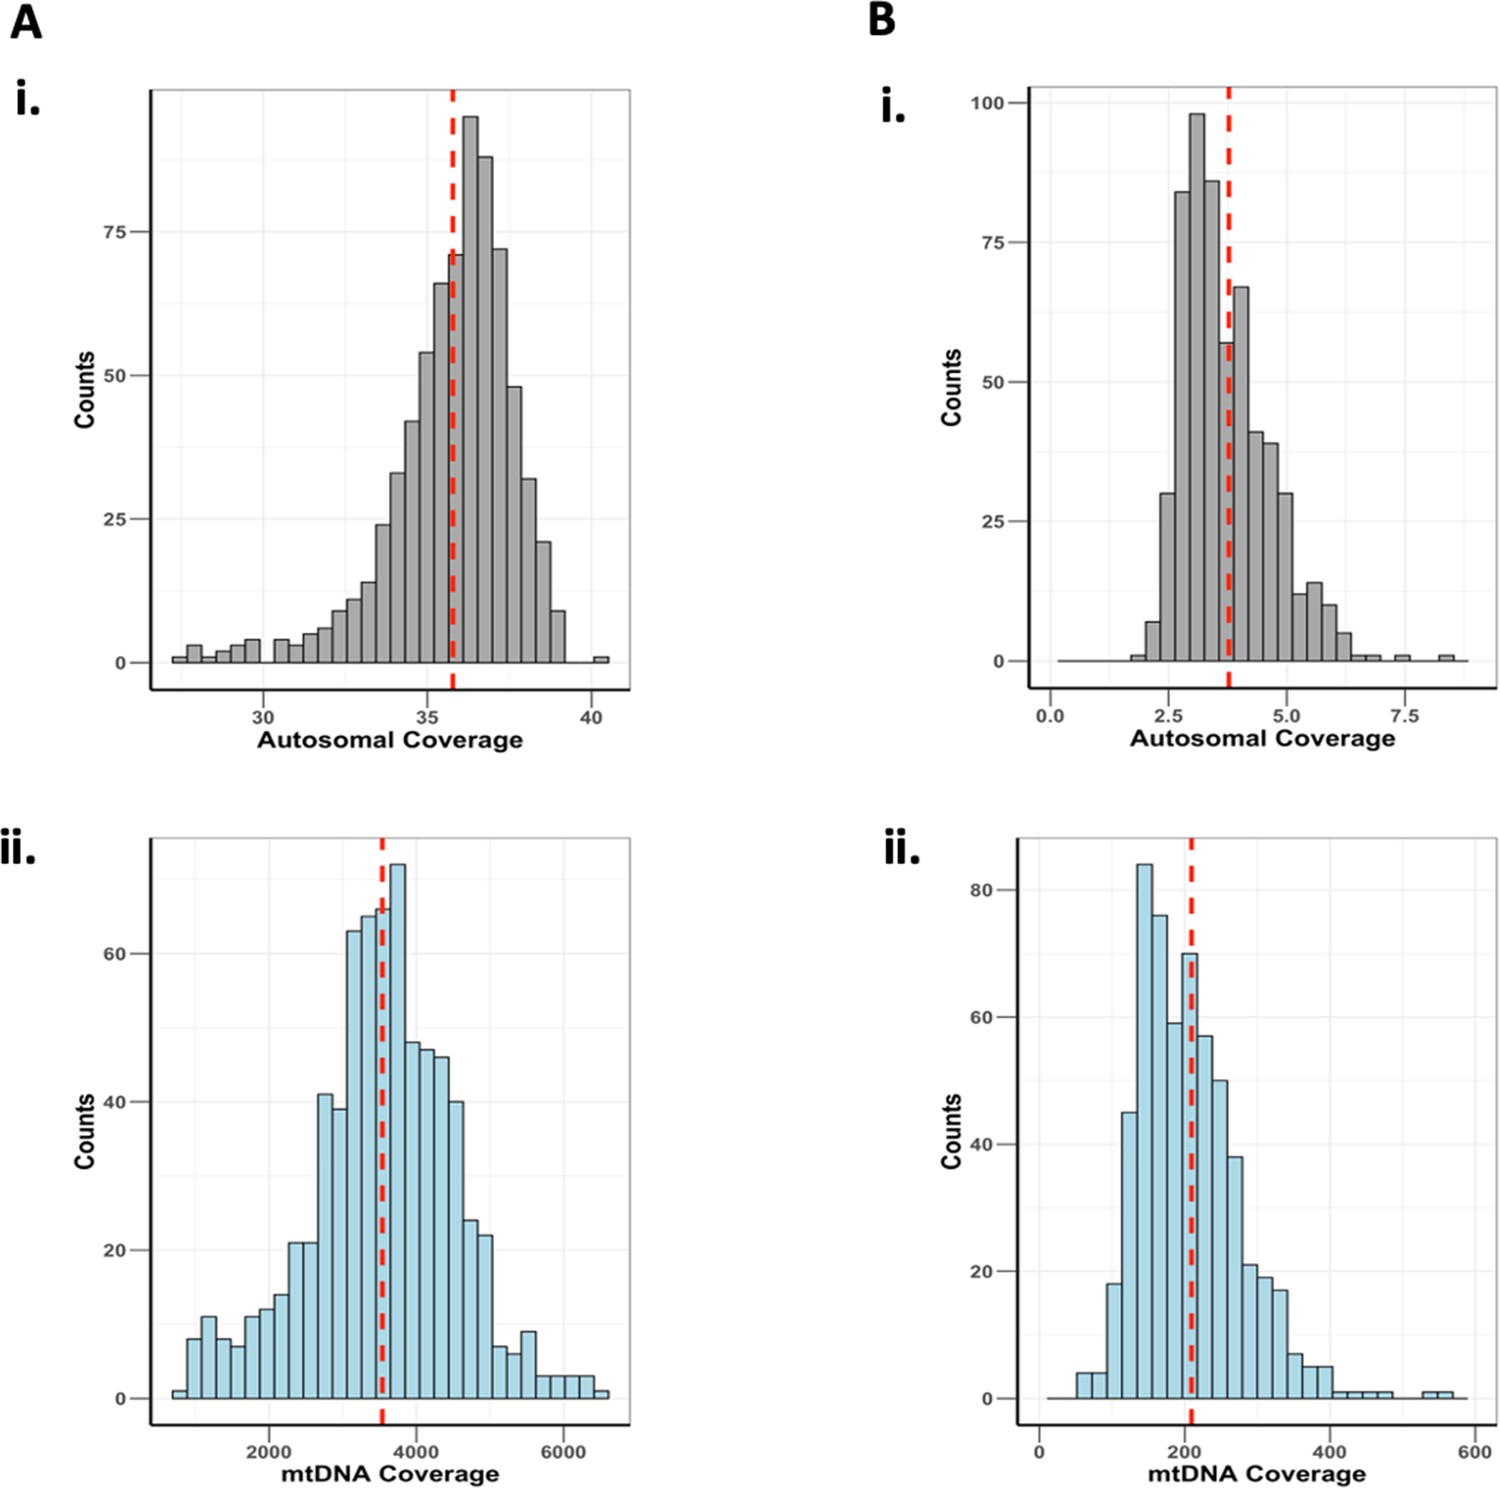
Histograms of autosomal and mitochondrial DNA (mtDNA) sequencing coverages for (A) Baltimore Longitudinal Study of Aging (BLSA) and (B) SardiNIA.
Appendix 1—figure 8

Four distinct personality types are created from the vulnerability facet of Neuroticism and the self-discipline facet of Conscientiousness.
Appendix 1—figure 9
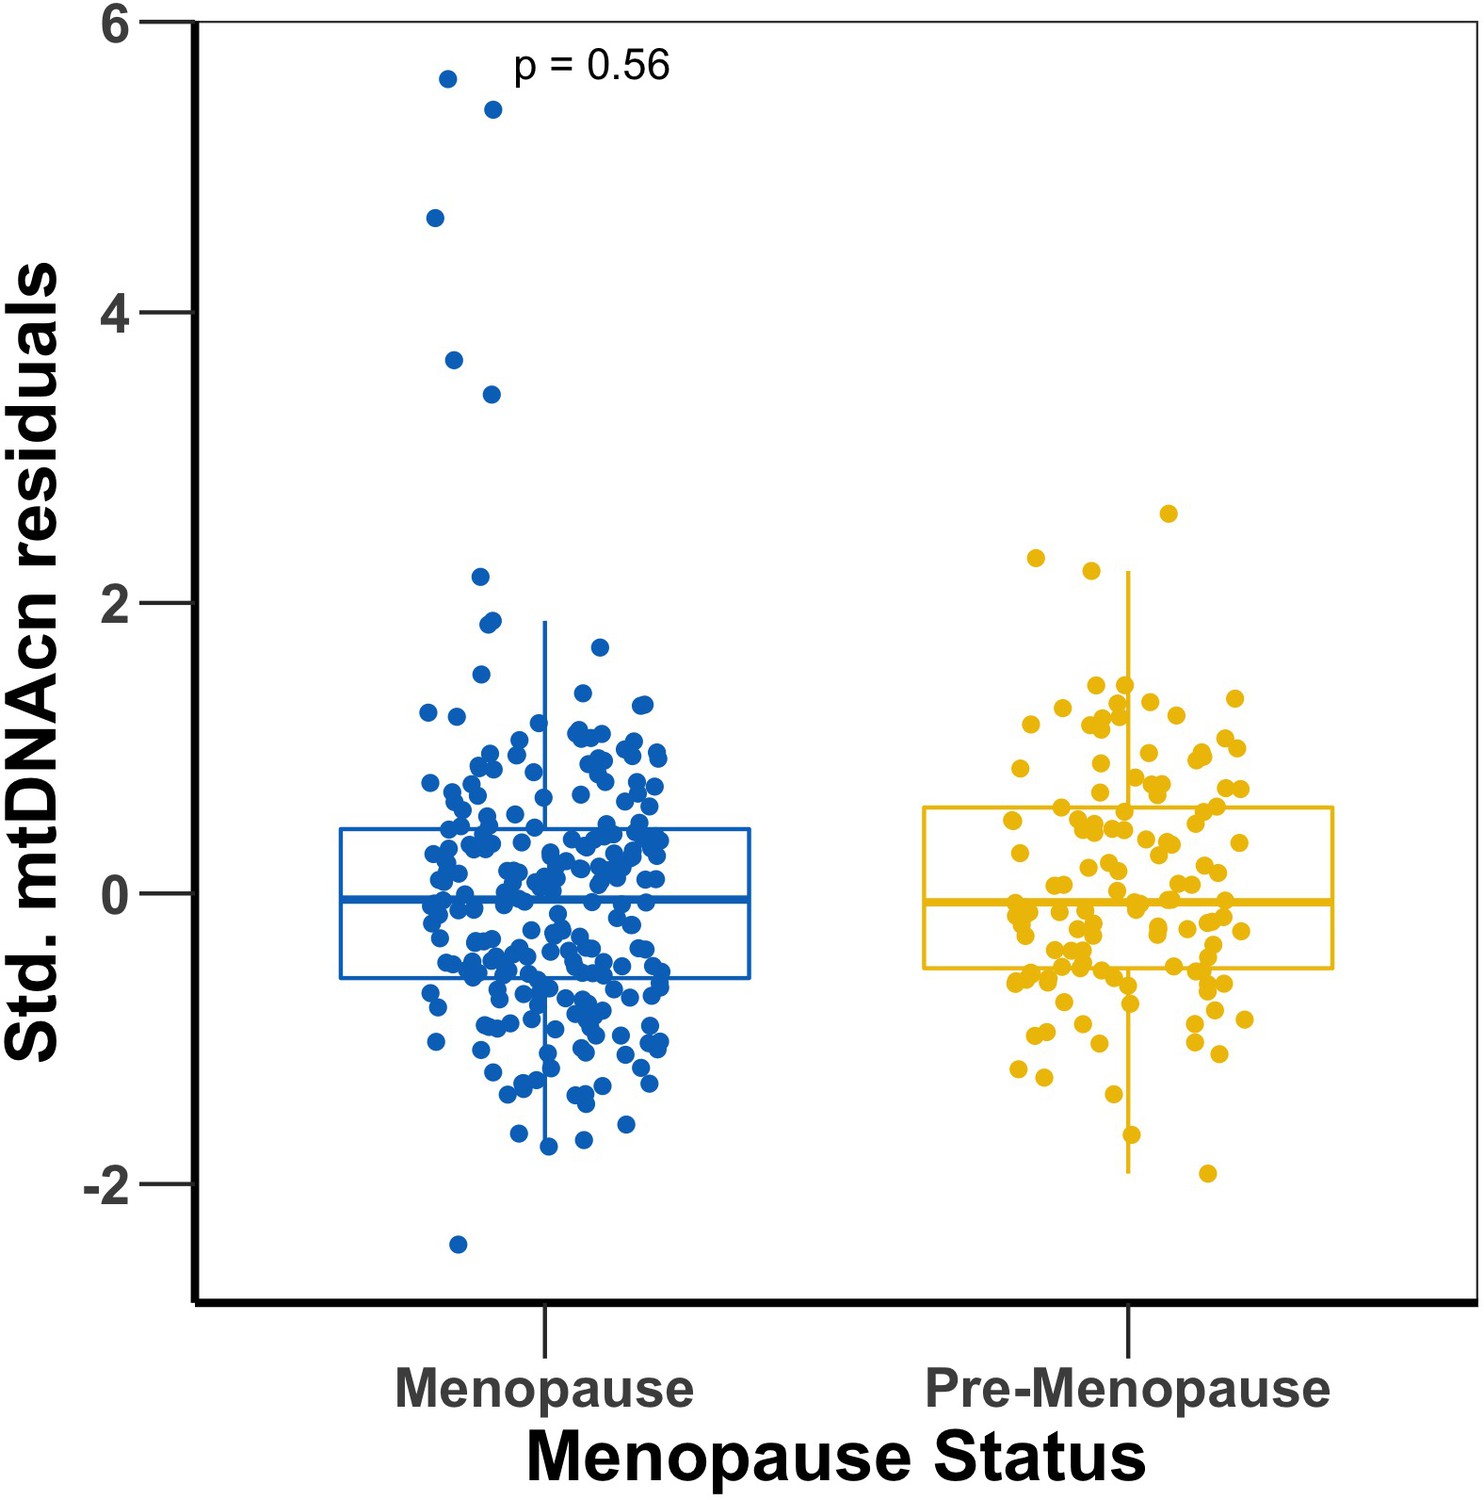
Mitochondrial DNA copy number (mtDNAcn) comparison between menopausal and premenopausal women in SardiNIA.
Appendix 1—figure 10
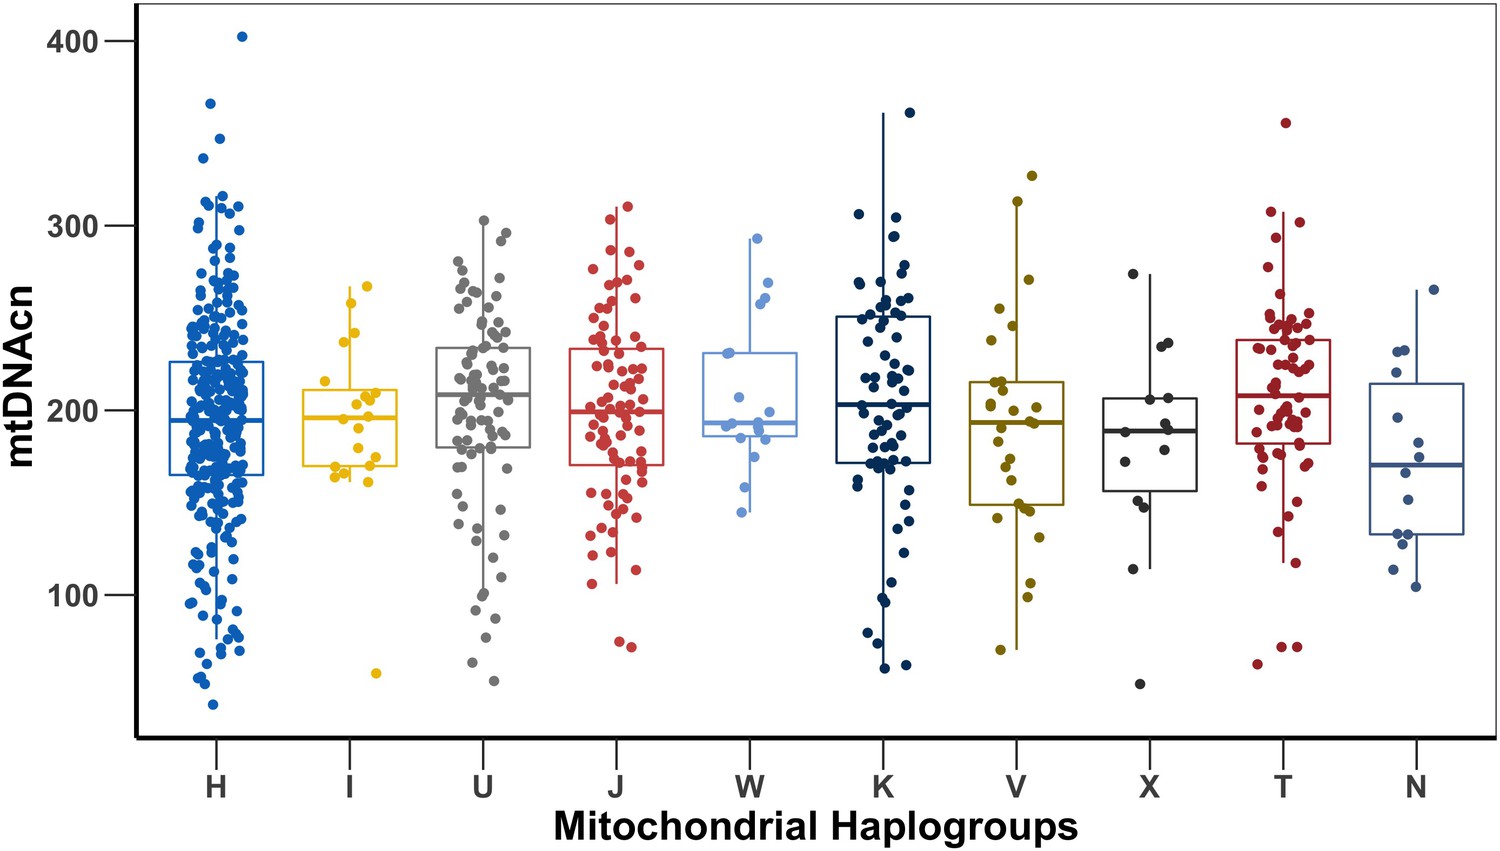
Mitochondrial DNA copy number (mtDNAcn) comparison between the major mitochondrial haplogroups present in more than five study participants.
Tables
Table 1
Demography of study cohorts.
| BLSA (n = 722) | SardiNIA (n = 587) | |
|---|---|---|
| n/%/mean (SD) | n/%/mean (SD) | |
| Female | 48.1% | 62.2% |
| Age (years) | 74.88 (10.86) | 57.28 (13.24) |
| Education (years) | 17.68 (2.50) | 7.33 (3.96) |
| Big five personality traits | ||
| Neuroticism | 45.35 (8.25) | 55.46 (8.36) |
| Extraversion | 50.60 (10.10) | 46.80 (8.04) |
| Openness | 52.59 (10.55) | 44.35 (9.08) |
| Agreeableness | 51.88 (9.51) | 47.55 (8.55) |
| Conscientiousness | 51.91 (9.31) | 49.20 (8.79) |
| Measures of depressive symptoms | ||
| CES-D continuous | 5.47 (5.66) | 11.66 (7.79) |
| CES-D binary cutoff 16 | 6.6% | 23.8% |
| CES-D binary cutoff 20 | 2.6% | 13.9% |
-
BLSA, Baltimore Longitudinal Study of Aging; CES-D, Center for Epidemiologic Studies Depression Scale.
Table 2
Association of Neuroticism domain with mitochondrial DNA copy number (mtDNAcn).
| Domain and facets | BLSA β (p-value) | SardiNIA β (p-value) | Pooled β (p-value)* | I2 % [p of Q] |
|---|---|---|---|---|
| Neuroticism | –0.106 (0.001) | –0.116 (0.01) | –0.11 (0.0015) | 0% [0.87] |
| Anxiety | –0.082 (0.01) | –0.086 (0.08) | –0.08 (0.010) | 0% [0.94] |
| Angry hostility | –0.078 (0.02) | –0.090 (0.054) | –0.08 (0.010) | 0% [0.84] |
| Depression | –0.122 (0.0002) | –0.070 (0.1) | –0.11 (0.0015) | 0% [0.37] |
| Self-consciousness | –0.060 (0.08) | –0.116 (0.01) | –0.08 (0.013) | 0% [0.33] |
| Impulsiveness | –0.067 (0.046) | –0.023 (0.6) | –0.05 (0.099) | 0% [0.45] |
| Vulnerability | –0.080 (0.02) | –0.097 (0.04) | –0.09 (0.0087) | 0% [0.77] |
| Measures of depressive symptoms | ||||
| CES-D continuous | –0.122 (0.0002) | –0.077 (0.13) | –0.11 (0.00008) | 0% [0.46] |
| CES-D binary cutoff 16 | –0.260 (0.051) | –0.180 (0.13) | –0.22 (0.015) | 0% [0.65] |
| CES-D binary cutoff 20 | –0.591 (0.005) | –0.343 (0.02) | –0.42 (0.0004) | 0% [0.34] |
| PMI | ||||
| Personality-mortality index | 0.092 (0.005) | 0.124 (0.007) | 0.10 (0.0001) | 0% [0.57] |
-
BLSA, Baltimore Longitudinal Study of Aging; CES-D, Center for Epidemiologic Studies Depression Scale; PMI, personality-mortality index; FDR, false discovery rate.
-
*
Pooled effect p-values of Neuroticism domain and facets are FDR-corrected for 35 tests for 35 personality traits. Information for other personality domains and facets are provided in Appendix 1—table 2.
Table 3
Testing the direct and indirect effects of personality-mortality index and mitochondrial DNA copy number (mtDNAcn) on mortality.
| BLSA (n = 721) | SardiNIA (n = 395) | |
|---|---|---|
| Total effect | Estimate (p-value) | Estimate (p-value) |
| Personality-mortality index | –0.149 (0.001) | –0.022 (0.808) |
| Full effects | ||
| Personality-mortality index | –0.052 (0.260) | –0.019 (0.895) |
| mtDNAcn | –0.020 (0.000) | –0.001 (0.966) |
| Indirect effect | Estimate [nonparametric bootstrap 95% CI] | Estimate [nonparametric bootstrap 95% CI] |
| mtDNAcn | –0.097 [–0.143; –0.03] | –0.004 [–0.169; 0.189] |
-
BLSA, Baltimore Longitudinal Study of Aging.
Appendix 1—table 1
Association of age, sex, and white blood cell (WBC) parameters with mitochondrial DNA copy number (mtDNAcn).
| β (p-value) of model adjusted | ||||
|---|---|---|---|---|
| No adjustment | Age, sex, coverage, and WBC parameters | |||
| Trait | BLSA | SardiNIA | BLSA | SardiNIA |
| Age | –0.025 (2.85e-13) | –0.0093 (0.003) | –0.014 (2.52e-5) | –0.0065 (0.028) |
| Sex | –0.61 (8.14e-17) | –0.25 (0.004) | –0.36 (1.21e-6) | –0.13 (0.11) |
| Platelet count | 0.004 (1.31e-7) | 0.0007 (0.30) | 0.003 (3.71e-6) | 0.001 (0.063) |
| WBC count | –0.13 (2.35e-10) | –0.14 (1.37e-8) | –0.097 (1.48e-6) | –0.08 (0.002) |
| Lymphocytes percent | 0.04 (5.5e-25) | 0.042 (5.19e-16) | –0.033 (0.23) | 0.073 (0.55) |
| Neutrophils percent | –0.041 (1.47e-28) | –0.041 (6.19e-18) | –0.063 (0.021) | 0.036 (0.77) |
| Eosinophils percent | 0.037 (0.031) | 0.043 (0.06) | –0.045 (0.16) | 0.076 (0.55) |
| Monocytes percent | 0.022 (0.082) | 0.062 (0.002) | –0.014 (0.57) | 0.082 (0.52) |
| Basophils percent | 0.44 (8.54e-5) | 0.11 (0.38) | 0.044 (0.69) | –0.076 (0.55) |
-
BLSA, Baltimore Longitudinal Study of Aging.
Appendix 1—table 2
Association of Revised NEO Personality Inventory (NEO-PI-R) domains with mitochondrial DNA copy number (mtDNAcn).
| NEO-PI-R domains | BLSA β (p-value) | SardiNIA β (p-value) | Meta-analysis | |||
|---|---|---|---|---|---|---|
| Pooled β | Raw p-value | FDR adj. p* | I2 % [p of Q] | |||
| Neuroticism | –0.106 (0.001) | –0.116 (0.01) | –0.11 | 0.00006 | 0.0015 | 0% [0.87] |
| Anxiety | –0.082 (0.01) | –0.086 (0.08) | –0.08 | 0.002 | 0.010 | 0% [0.94] |
| Angry hostility | –0.078 (0.02) | –0.090 (0.054) | –0.08 | 0.003 | 0.010 | 0% [0.84] |
| Depression | –0.122 (0.0002) | –0.070 (0.1) | –0.11 | 0.00008 | 0.0015 | 0% [0.37] |
| Self-consciousness | –0.060 (0.08) | –0.116 (0.01) | –0.08 | 0.004 | 0.013 | 0% [0.33] |
| Impulsiveness | –0.067 (0.046) | –0.023 (0.6) | –0.05 | 0.06 | 0.099 | 0% [0.45] |
| Vulnerability | –0.080 (0.02) | –0.097 (0.04) | –0.09 | 0.002 | 0.0087 | 0% [0.77] |
| Extraversion | 0.083 (0.01) | 0.117 (0.01) | 0.09 | 0.0005 | 0.0036 | 0% [0.56] |
| Warmth | 0.064 (0.06) | 0.162 (0.0004) | 0.11 | 0.03 | 0.051 | 66% [0.09] |
| Gregariousness | 0.040 (0.2) | 0.047 (0.3) | 0.04 | 0.1 | 0.16 | 0% [0.90] |
| Assertiveness | 0.066 (0.048) | –0.007 (0.9) | 0.04 | 0.3 | 0.36 | 38% [0.21] |
| Activity | 0.106 (0.002) | 0.037 (0.4) | 0.08 | 0.02 | 0.040 | 30% [0.23] |
| Excitement seeking | 0.011 (0.7) | 0.067 (0.2) | 0.03 | 0.3 | 0.36 | 0% [0.35] |
| Positive emotions | 0.087 (0.01) | 0.122 (0.01) | 0.10 | 0.0004 | 0.0036 | 0% [0.54] |
| Openness | 0.066 (0.06) | 0.076 (0.1) | 0.07 | 0.01 | 0.032 | 0% [0.86] |
| Fantasy | –0.006 (0.9) | 0.093 (0.051) | 0.04 | 0.4 | 0.48 | 65% [0.09] |
| Aesthetics | 0.015 (0.7) | 0.086 (0.06) | 0.04 | 0.2 | 0.27 | 34% [0.22] |
| Feelings | 0.045 (0.2) | –0.015 (0.8) | 0.02 | 0.4 | 0.47 | 2% [0.31] |
| Actions | 0.063 (0.07) | 0.039 (0.4) | 0.05 | 0.051 | 0.094 | 0% [0.68] |
| Ideas | 0.079 (0.02) | 0.070 (0.1) | 0.08 | 0.005 | 0.014 | 0% [0.88] |
| Values | 0.078 (0.02) | –0.014 (0.8) | 0.04 | 0.4 | 0.46 | 59% [0.12] |
| Agreeableness | 0.058 (0.1) | 0.141 (0.003) | 0.09 | 0.02 | 0.047 | 49% [0.16] |
| Trust | 0.085 (0.014) | 0.065 (0.2) | 0.08 | 0.005 | 0.014 | 0% [0.73] |
| Straightforwardness | 0.059 (0.08) | 0.095 (0.04) | 0.07 | 0.009 | 0.024 | 0% [0.54] |
| Altruism | 0.077 (0.02) | 0.133 (0.005) | 0.10 | 0.0005 | 0.0036 | 0% [0.34] |
| Compliance | 0.005 (0.9) | 0.039 (0.4) | 0.02 | 0.5 | 0.57 | 0% [0.57] |
| Modesty | –0.018 (0.6) | 0.080 (0.09) | 0.03 | 0.6 | 0.62 | 65% [0.09] |
| Tendermindedness | 0.030 (0.4) | 0.089 (0.053) | 0.05 | 0.07 | 0.12 | 7% [0.30] |
| Conscientiousness | 0.084 (0.009) | 0.040 (0.4) | 0.07 | 0.008 | 0.022 | 0% [0.43] |
| Competence | 0.115 (0.0004) | 0.024 (0.6) | 0.08 | 0.09 | 0.14 | 61% [0.11] |
| Order | –0.003 (0.9) | 0.036 (0.4) | 0.01 | 0.7 | 0.69 | 0% [0.49] |
| Dutifulness | 0.097 (0.003) | 0.066 (0.2) | 0.09 | 0.001 | 0.0064 | 0% [0.57] |
| Achievement striving | 0.093 (0.005) | 0.018 (0.7) | 0.06 | 0.09 | 0.14 | 42% [0.19] |
| Self-discipline | 0.056 (0.08) | 0.016 (0.7) | 0.04 | 0.1 | 0.14 | 0% [0.48] |
| Deliberation | 0.069 (0.03) | 0.009 (0.8) | 0.05 | 0.09 | 0.14 | 11% [0.29] |
| Personality and mortality | BLSA Md (p-value) | SardiNIA Md (p-value) | Pooled Md | Raw p-value | FDR adj. p | I2 % [p of Q] |
| HVLD vs. LVHD | 0.234 (0.006) | 0.209 (0.09) | 0.226 | 0.0013 | - | 0% [0.87] |
-
BLSA, Baltimore Longitudinal Study of Aging; HVLD, high vulnerability low self-discipline; LVHD, low vulnerability high self-discipline; FDR, false discovery rate.
-
*
Entries with FDR-corrected p-values≤0.01 are labeled as bold.
Appendix 1—table 3
Cox proportional hazards analysis of four Revised NEO Personality Inventory (NEO-PI-R) traits used to compute personality-mortality index (PMI).
Models adjusted for the effect of age and sex.
| Coefficient | Hazard ratio | p-Value | |
|---|---|---|---|
| Vulnerability | 0.037 | 1.038 | 0.0006 |
| Activity | –0.036 | 0.946 | 0.0004 |
| Self-discipline | –0.028 | 0.972 | 0.002 |
| Competence | –0.041 | 0.959 | 2.28e-5 |
Appendix 1—table 4
Testing the direct and indirect effects of mitochondrial DNA copy number (mtDNAcn) and personality-mortality index (PMI) on mortality.
| BLSA (n = 721) | SardiNIA (n = 395) | |
|---|---|---|
| Total effect | Estimate (p-value) | Estimate (p-value) |
| mtDNAcn | –0.010 (0.001) | 0.003 (0.574) |
| Full effects | ||
| mtDNAcn | –0.010 (0.000) | 0.003 (0.673) |
| PMI | –0.118 (0.340) | –0.028 (0.959) |
| Indirect effect | Estimate (nonparametric bootstrap p-value) | Estimate (nonparametric bootstrap p-value) |
| PMI | 0.000 (0.355) | 0.000 (0.963) |
-
BLSA, Baltimore Longitudinal Study of Aging.
Appendix 1—table 5
Association of Revised NEO Personality Inventory (NEO-PI-R) domains with mitochondrial DNA copy number (mtDNAcn) in SardiNIA women, with and without adjustment for menopause status.
Both models adjusted for the effect of age, sequence coverage, white blood cell (WBC), platelet count, and percentages of major leukocytes.
| β (p-value) of model | ||
|---|---|---|
| NEO-PI-R domains | Not adjusted for menopause status | Adjusted for menopause status |
| Neuroticism | –0.013 (0.074) | –0.013 (0.077) |
| Anxiety | –0.007 (0.316) | –0.007 (0.323) |
| Angry hostility | –0.010 (0.123) | –0.010 (0.127) |
| Depression | –0.008 (0.236) | –0.008 (0.240) |
| Self-consciousness | –0.012 (0.056) | –0.012 (0.056) |
| Impulsiveness | 0.002 (0.794) | 0.002 (0.802) |
| Vulnerability | –0.011 (0.059) | –0.011 (0.063) |
| Extraversion | 0.017 (0.022) | 0.017 (0.021) |
| Warmth | 0.021 (0.0004) | 0.021 (0.0004) |
| Gregariousness | 0.005 (0.483) | 0.005 (0.476) |
| Assertiveness | 0.002 (0.828) | 0.001 (0.862) |
| Activity | 0.001 (0.857) | 0.001 (0.864) |
| Excitement seeking | 0.010 (0.183) | 0.010 (0.165) |
| Positive emotions | 0.014 (0.020) | 0.015 (0.017) |
| Openness | 0.014 (0.035) | 0.014 (0.036) |
| Fantasy | 0.017 (0.016) | 0.017 (0.016) |
| Aesthetics | 0.011 (0.098) | 0.011 (0.102) |
| Feelings | 0.007 (0.319) | 0.007 (0.312) |
| Actions | 0.008 (0.195) | 0.008 (0.192) |
| Ideas | 0.009 (0.189) | 0.009 (0.186) |
| Values | 0.001 (0.887) | 0.001 (0.910) |
| Agreeableness | 0.017 (0.010) | 0.017 (0.011) |
| Trust | 0.006 (0.313) | 0.006 (0.321) |
| Straightforwardness | 0.012 (0.050) | 0.012 (0.055) |
| Altruism | 0.012 (0.042) | 0.012 (0.041) |
| Compliance | 0.008 (0.175) | 0.008 (0.179) |
| Modesty | 0.005 (0.471) | 0.005 (0.499) |
| Tendermindedness | 0.013 (0.025) | 0.013 (0.024) |
| Conscientiousness | 0.006 (0.409) | 0.005 (0.428) |
| Competence | 0.001 (0.846) | 0.001 (0.857) |
| Order | 0.003 (0.606) | 0.003 (0.637) |
| Dutifulness | 0.006 (0.325) | 0.006 (0.346) |
| Achievement striving | 0.005 (0.471) | 0.005 (0.442) |
| Self-discipline | 0.001 (0.854) | 0.001 (0.908) |
| Deliberation | 0.005 (0.414) | 0.005 (0.417) |
Appendix 1—table 6
Effect of mitochondrial haplogroups on mitochondrial DNA copy number (mtDNAcn).
| Haplogroups | Frequency (%) | Beta | SE | p-Value |
|---|---|---|---|---|
| N | 1.94 | –0.45 | 0.27 | 0.095 |
| H | 41.83 | –0.12 | 0.08 | 0.103 |
| T | 9.42 | 0.20 | 0.13 | 0.122 |
| X | 1.94 | –0.31 | 0.27 | 0.258 |
| K | 9.70 | 0.12 | 0.13 | 0.361 |
| W | 2.49 | 0.19 | 0.24 | 0.418 |
| V | 3.88 | –0.13 | 0.19 | 0.500 |
| U | 12.60 | 0.07 | 0.11 | 0.504 |
| I | 2.77 | –0.09 | 0.23 | 0.703 |
| J | 11.50 | 0.03 | 0.12 | 0.795 |
Additional files
-
Transparent reporting form
- https://cdn.elifesciences.org/articles/77806/elife-77806-transrepform1-v1.docx
-
Reporting standard 1
A checklist of items that should be included in reports of observational studies.
- https://cdn.elifesciences.org/articles/77806/elife-77806-repstand1-v1.docx
-
Source code 1
R code for the analysis on mtDNAcn and personality.
- https://cdn.elifesciences.org/articles/77806/elife-77806-code1-v1.zip
Download links
A two-part list of links to download the article, or parts of the article, in various formats.
Downloads (link to download the article as PDF)
Open citations (links to open the citations from this article in various online reference manager services)
Cite this article (links to download the citations from this article in formats compatible with various reference manager tools)
Personality traits are consistently associated with blood mitochondrial DNA copy number estimated from genome sequences in two genetic cohort studies
eLife 11:e77806.
https://doi.org/10.7554/eLife.77806


