Closely related type II-C Cas9 orthologs recognize diverse PAMs
- State Key Laboratory of Genetic Engineering, School of Life Sciences, Zhongshan Hospital, Fudan University, China
- State Key Laboratory of Oncology in South China, Collaborative Innovation Center for Cancer Medicine, Sun Yat-sen University Cancer Center, China
- Children’s Hospital of Fudan University, National Children’s Medical Center, China
- Shanghai Engineering Research Center of Industrial Microorganisms, China
Figures
Figure 1 with 5 supplements
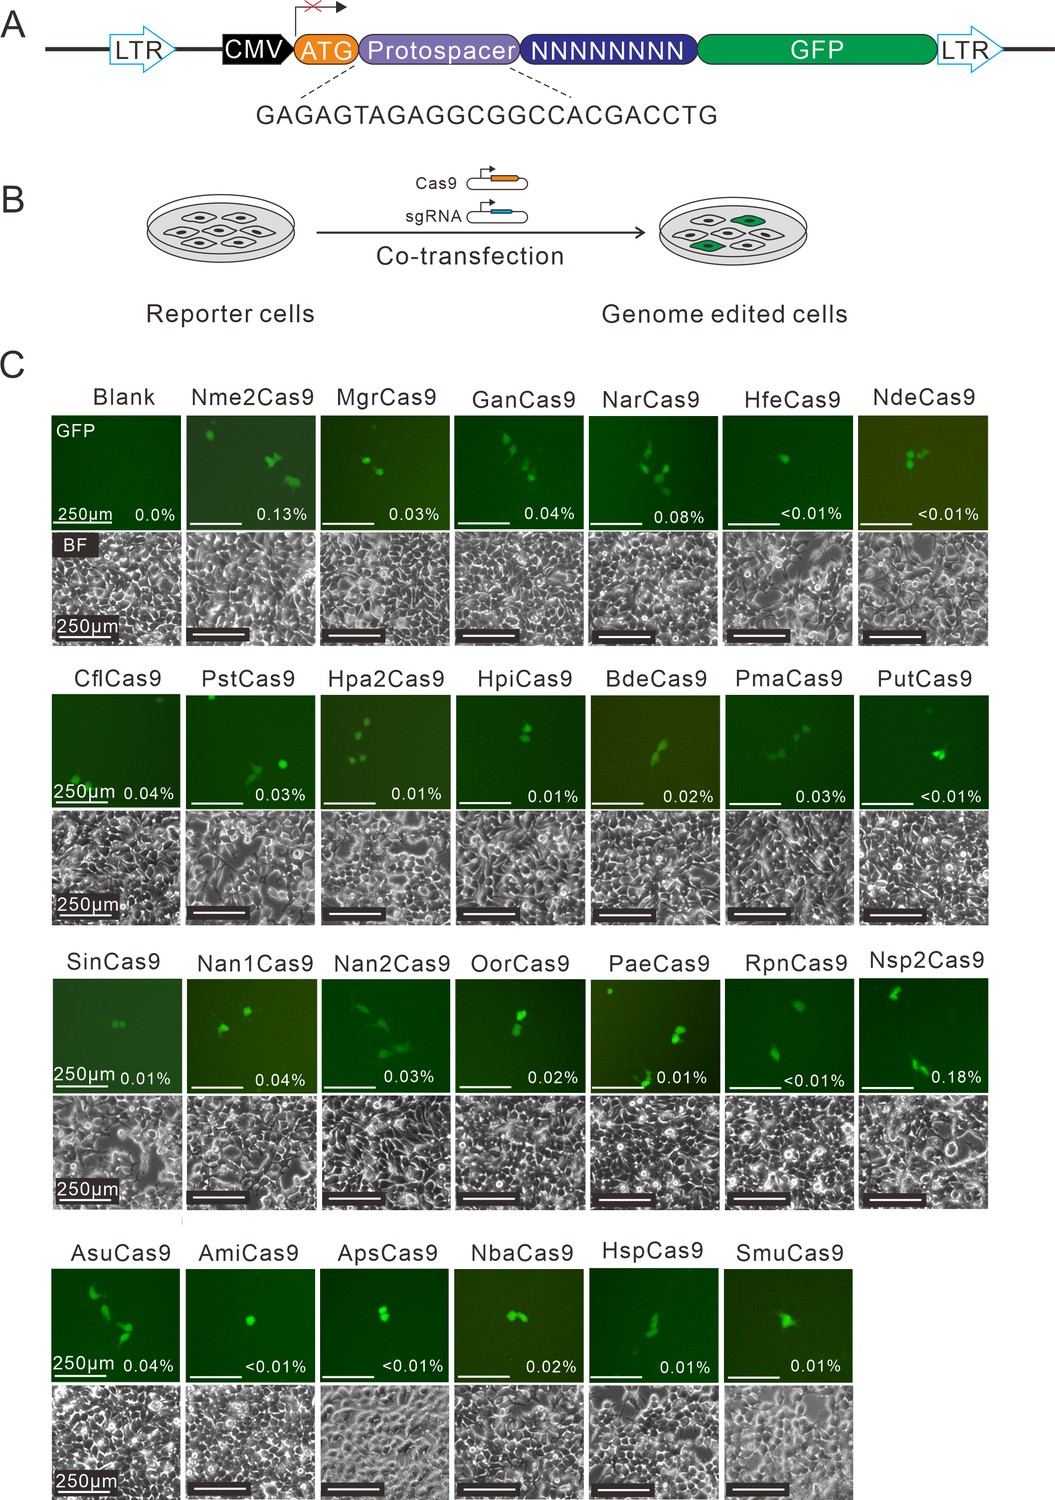
Screening of Nme1Cas9 orthologs activities through a GFP- activation assay.
(A) Schematic of the GFP-activation assay. A protospacer flanked by an 8 bp random sequence is inserted between the ATG start codon and GFP-coding sequence, resulting in a frameshift mutation. The library DNA is stably integrated into HEK293T cells via lentivirus infection. Genome editing can lead to in-frame mutation. The protospacer sequence is shown below. (B) The procedure of the GFP-activation assay. Cas9 and sgRNA expression plasmids were co-transfected into the reporter cells. GFP-positive cells could be observed if the protospacer is edited. (C) Twenty-five out of 29 Nme1Cas9 orthologs could induce GFP expression. The percentage of GFP-positive cells is shown. Reporter cells without Cas9 transfection are used as a negative control. Scale bar: 250 μm.
-
Figure 1—source data 1
The maps of all plasmids used in the study for Figure 1.
- https://cdn.elifesciences.org/articles/77825/elife-77825-fig1-data1-v2.zip
Figure 1—figure supplement 1
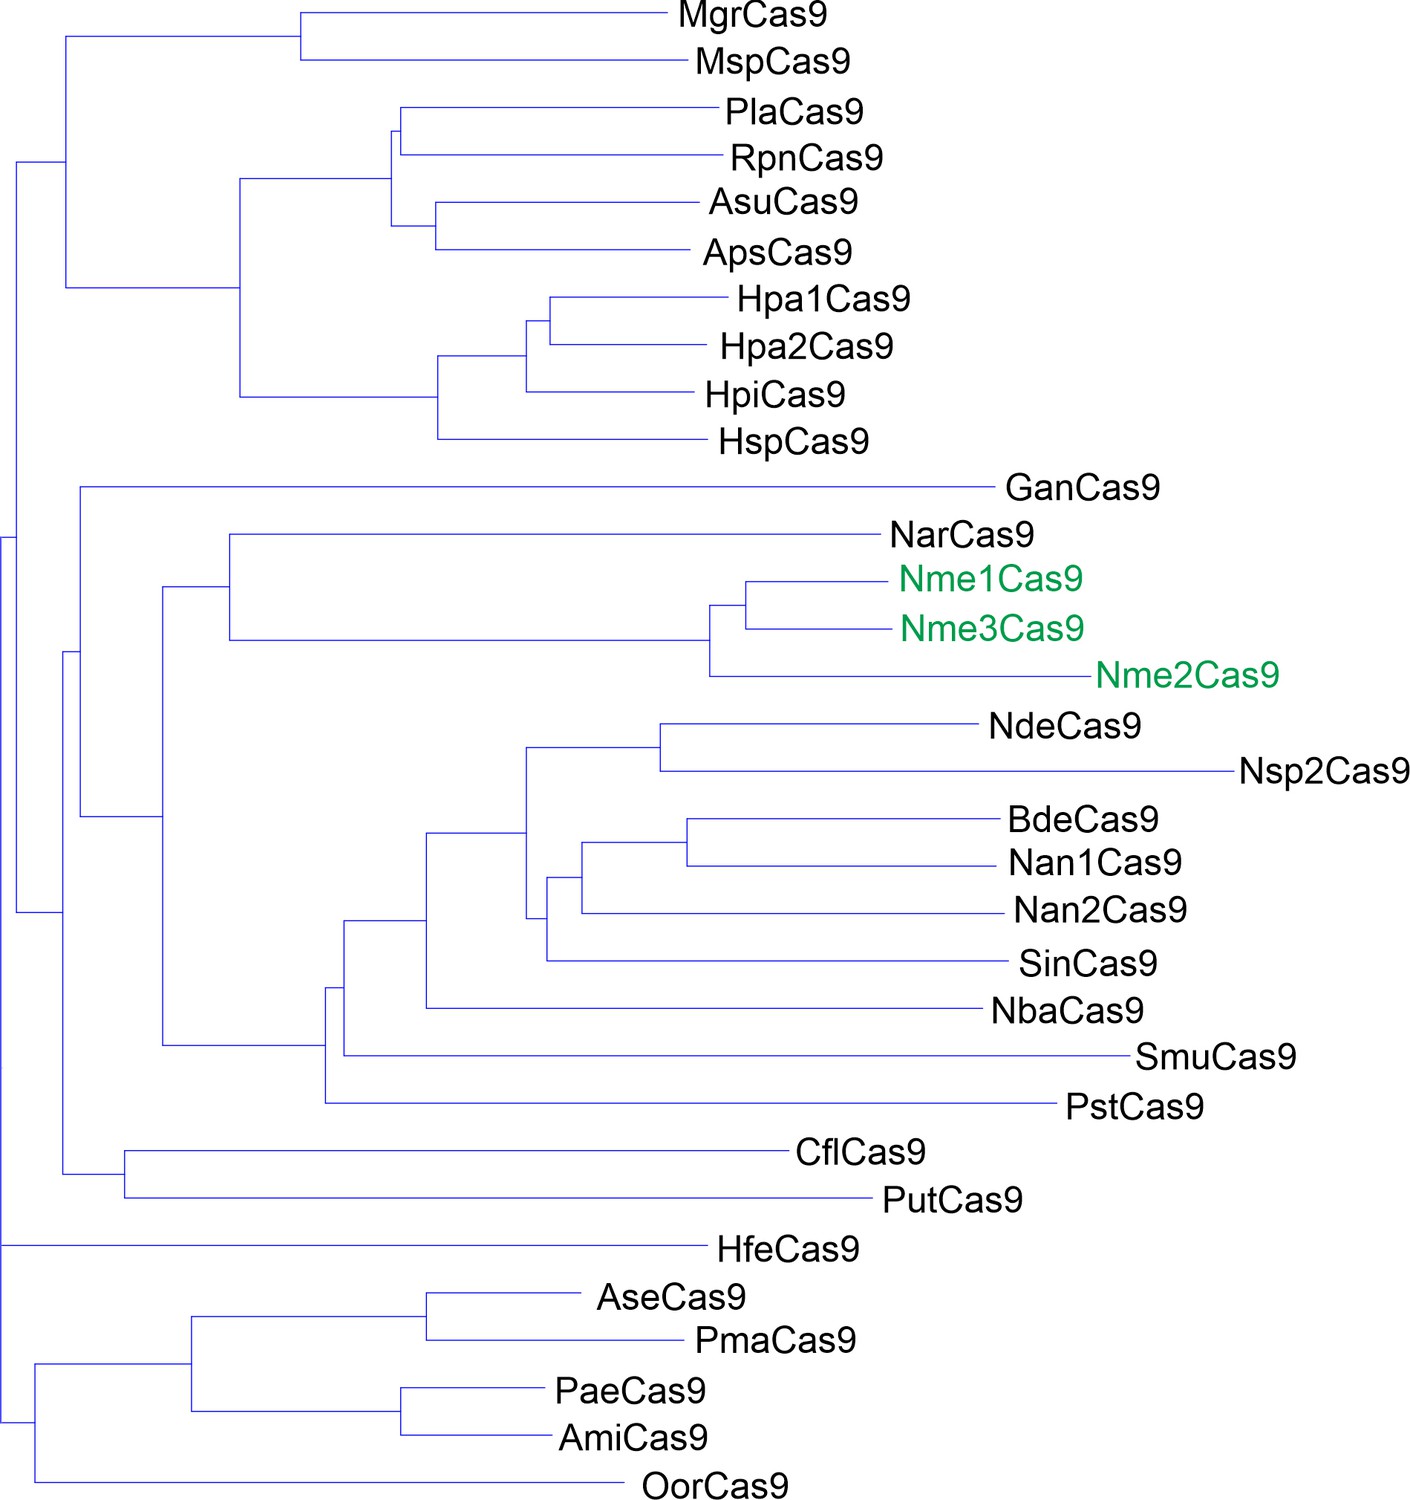
Phylogenetic tree of the selected Nme1Cas9 orthologs.
The amino acid sequences of 29 selected Nme1Cas9 orthologs were aligned by Vector NTI. Nme1Cas9, Nme2Cas9, and Nme3Cas9 were used as reference and shown in green.
Figure 1—figure supplement 2
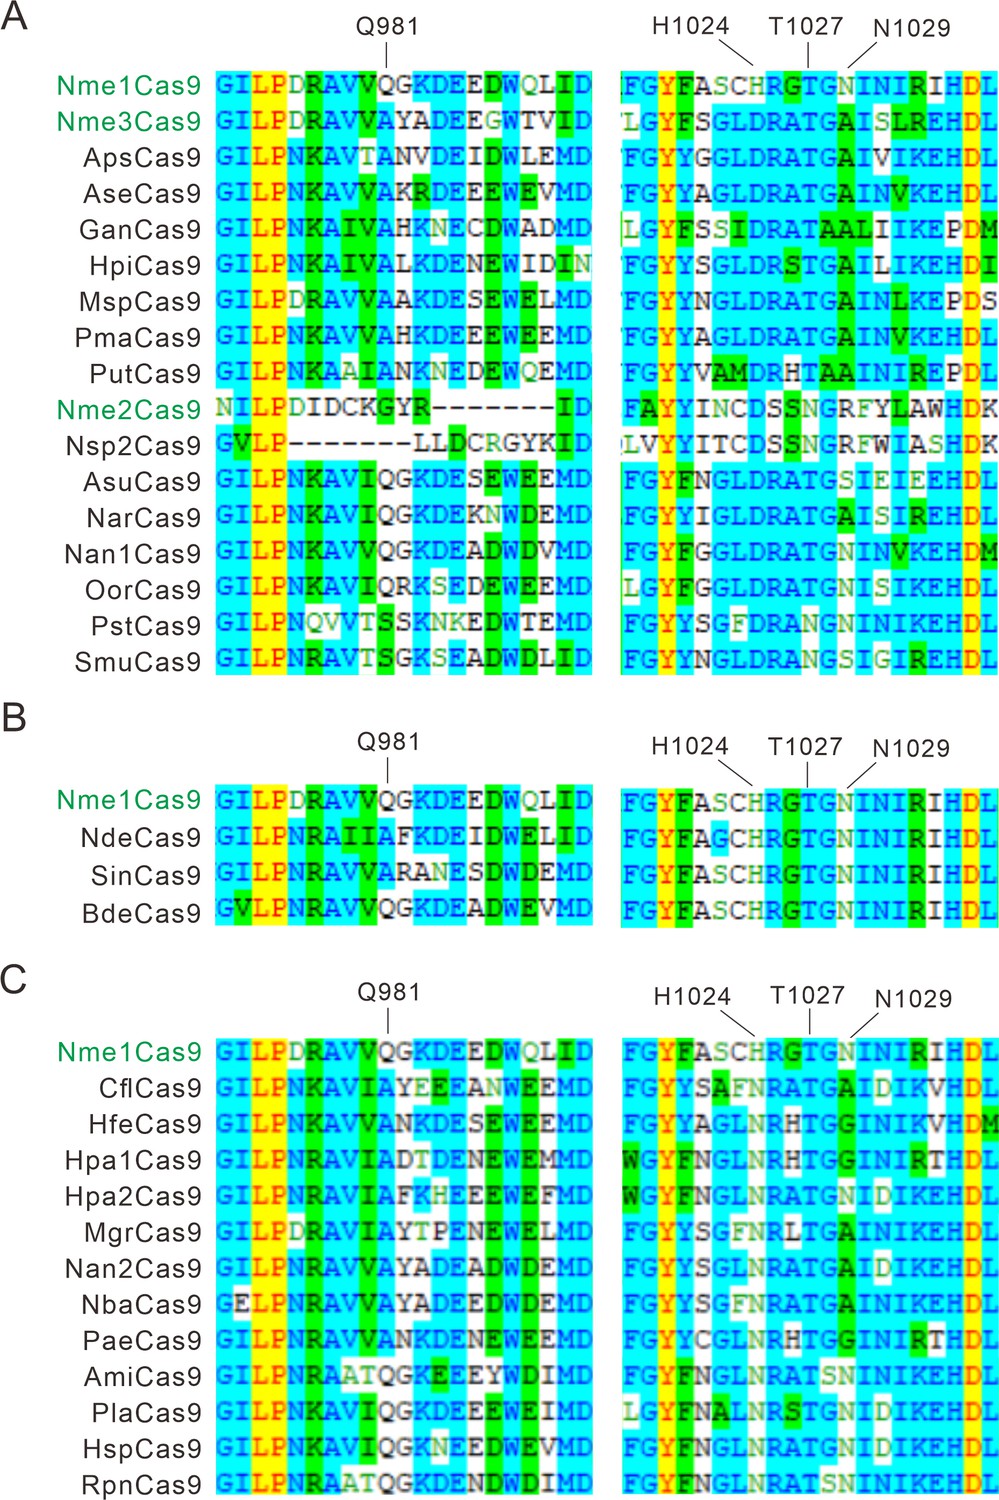
Alignment of the PI domain of Nme1Cas9 orthologs.
The Nme1Cas9 orthologs contained aspartate (A), histidine (B), or asparagine (C) residues corresponding to the Nme1Cas9 H1024. The PI domains were aligned by Vector NTI. Amino acids crucial for PAM recognition are shown above. Nme1Cas9, Nme2Cas9, and Nme3Cas9 were used as reference and shown in green.
Figure 1—figure supplement 3

The alignment of direct repeats and tracrRNAs of Nme1Cas9 orthologs.
(A) Alignment of direct repeat sequences for Nme1Cas9 orthologs is shown. (B) Alignment of tracrRNAs for Nme1Cas9 orthologs. Sequence alignment revealed that direct repeats and the 5’ end of tracrRNAs were conserved among Nme1Cas9 orthologs. Strict identical residues are highlighted with the red background and conserved mutations are highlighted with an outline and red font.
Figure 1—figure supplement 4
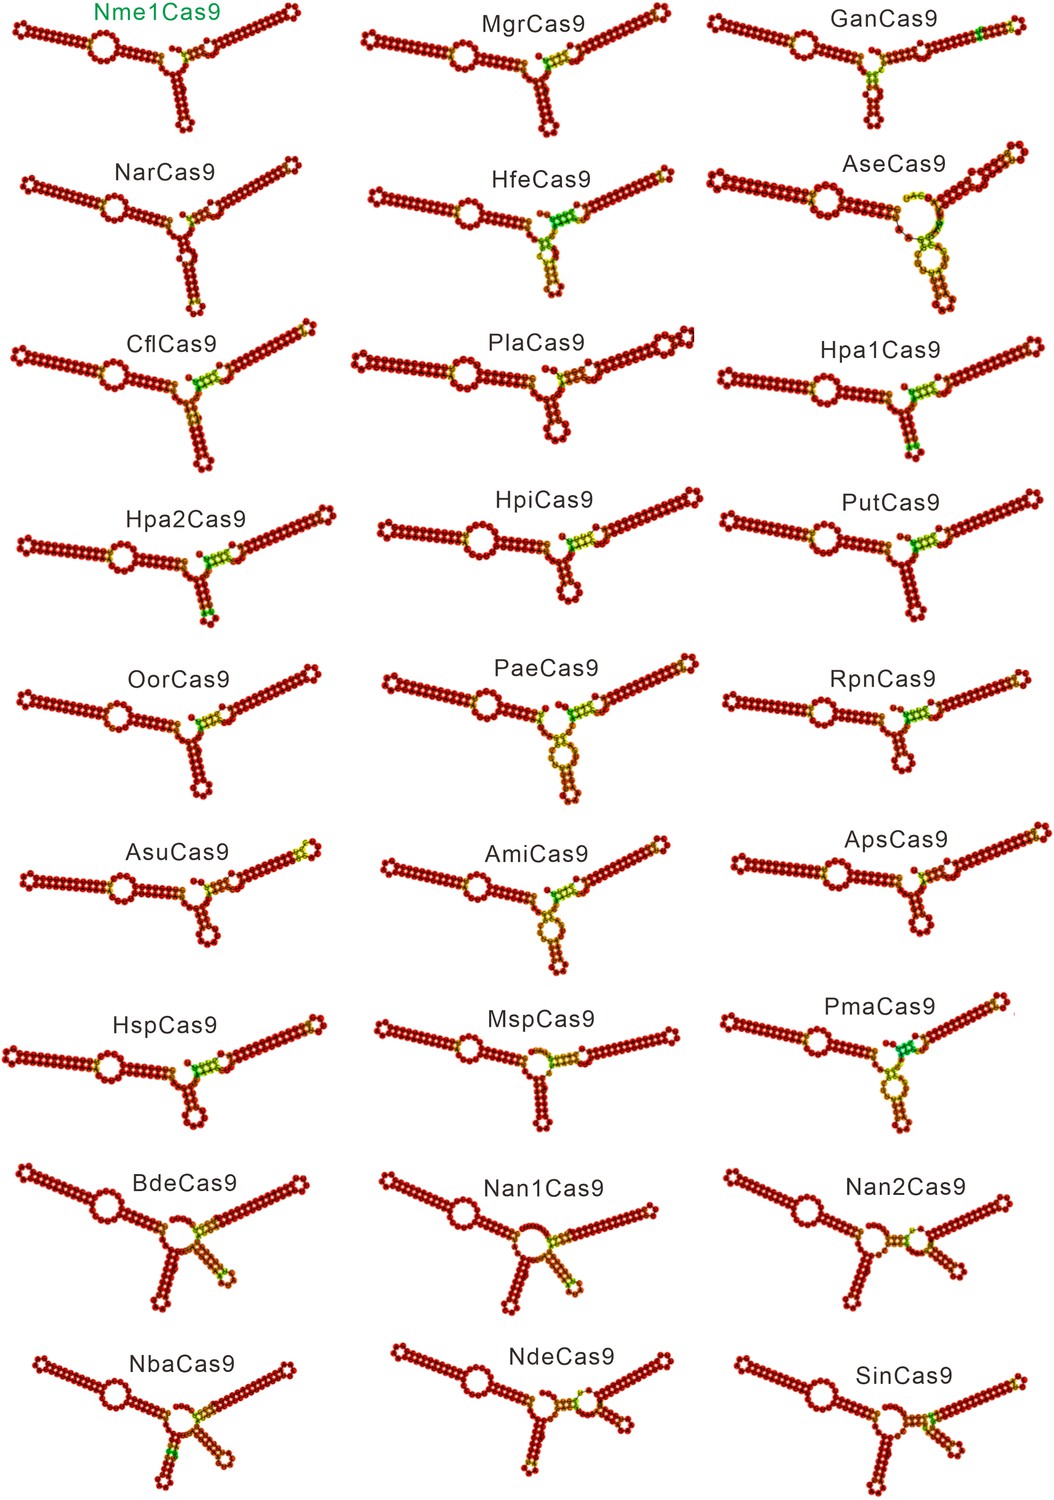
Single-guide RNA (sgRNA) scaffolds of Nme1Cas9 orthologs.
In silico co-folding of the crRNA direct repeat and putative tracrRNA shows stable secondary structure and complementarity between the two RNAs.
Figure 1—figure supplement 5
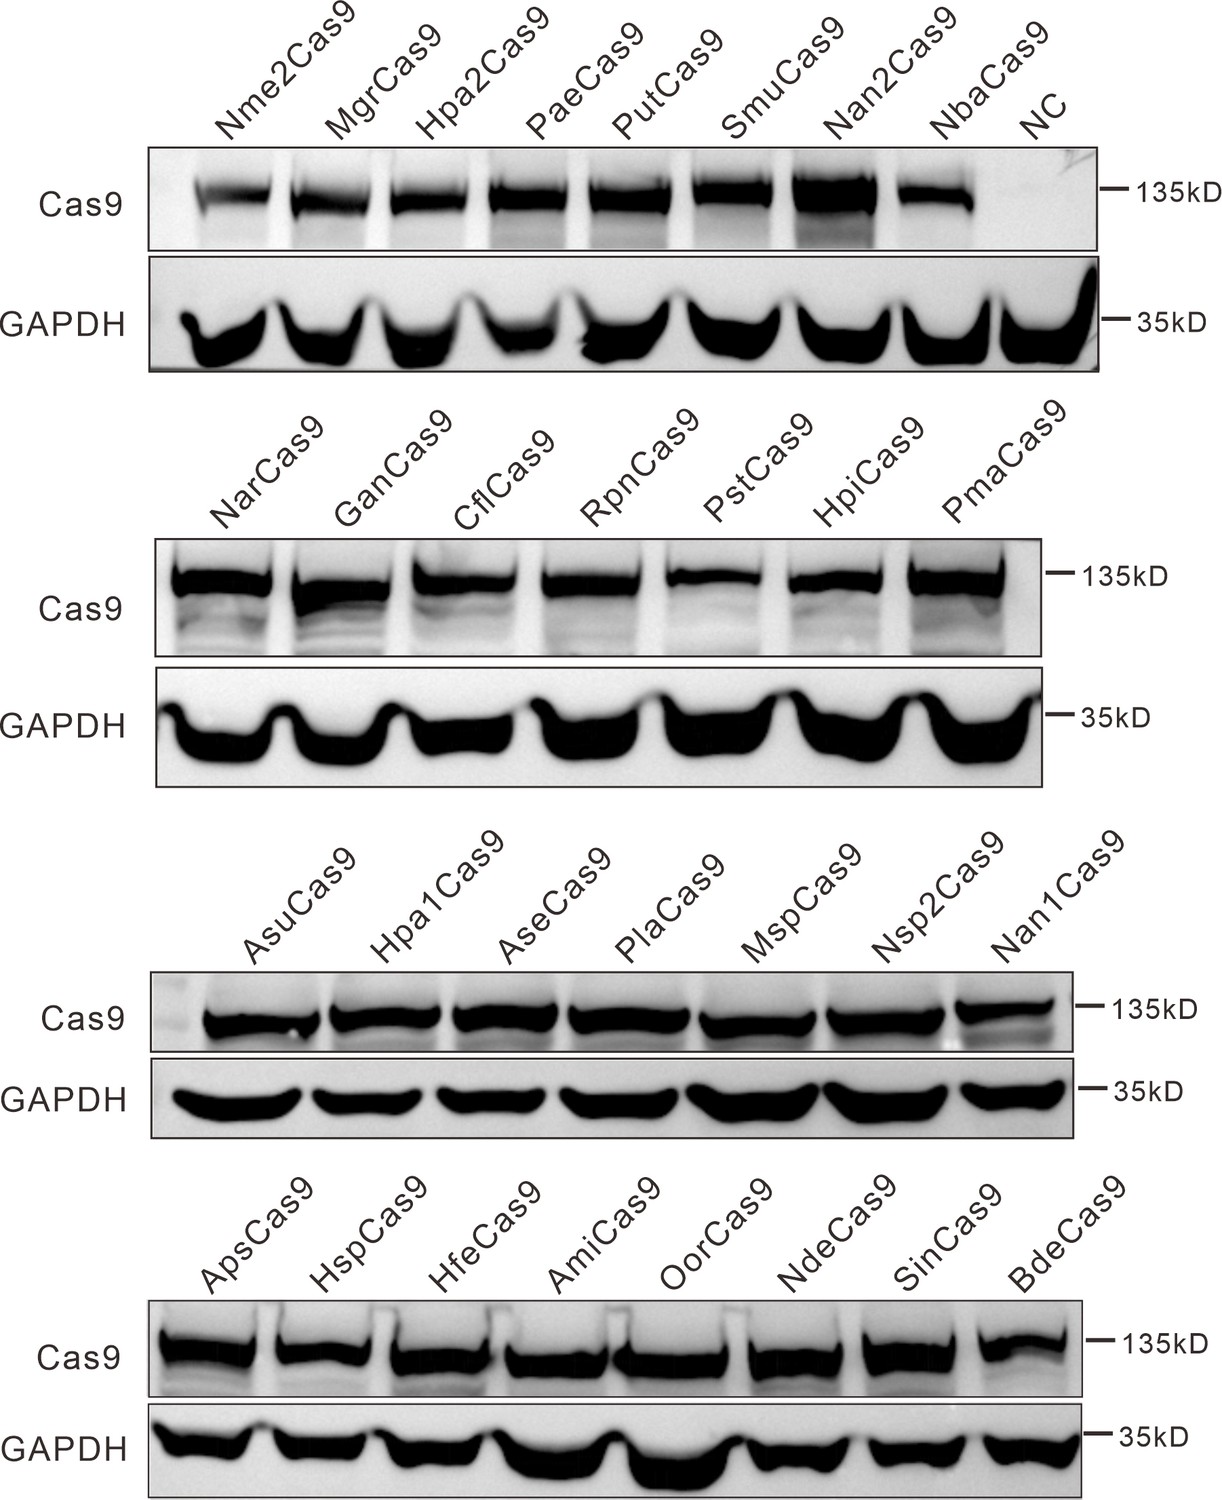
Protein expression levels of Nme2Cas9 orthologs were analyzed by western blot.
HEK293T cells without Cas9 transfection were used as a negative control (NC).
-
Figure 1—figure supplement 5—source data 1
Source data for Figure 1—figure supplement 5.
- https://cdn.elifesciences.org/articles/77825/elife-77825-fig1-figsupp5-data1-v2.zip
Figure 2 with 2 supplements
PAM analysis for each Cas9 nuclease.
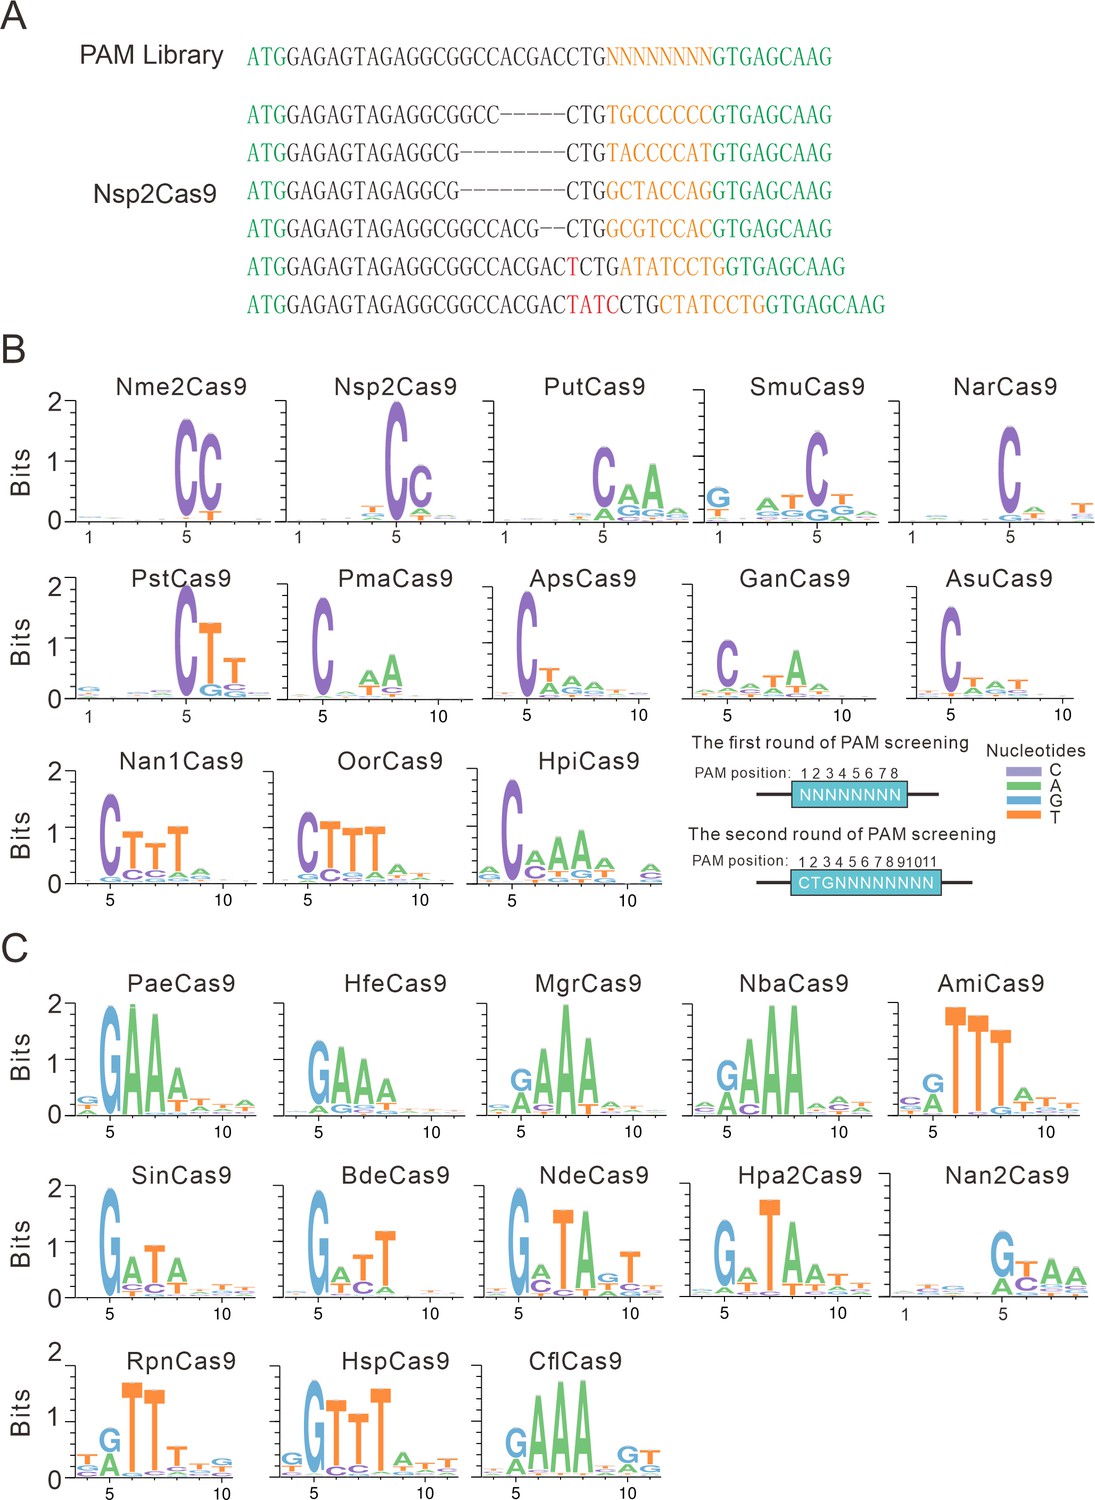
(A) Example of indel sequences measured by deep sequencing for Nsp2Cas9. The GFP coding sequences are shown in green; an 8 bp random sequence is shown in orange; black dashes indicate deleted bases; red bases indicate insertion mutations. (B) The PAM WebLogos for Nme1Cas9 orthologs containing an aspartate residue corresponding to the Nme1Cas9 H1024. PAM positions for each WebLogo are shown below. The PAM WebLogos for Nme2Cas9, Nsp2Cas9, PutCas9, SmuCas9, NarCas9, PstCas9 are generated from the first round of PAM screening and the PAM WebLogos for others are generated from the second round of PAM screening. PAM positions in the screening assay are shown on the bottom right. (C) The PAM WebLogos for Nme1Cas9 orthologs containing histidine, or asparagine residues corresponding to the Nme1Cas9 H1024. PAM positions for each WebLogo are shown below. The PAM WebLogo for Nan2Cas9 is generated from the first round of PAM screening and the PAM WebLogos for others are generated from the second round of PAM screening.
-
Figure 2—source data 1
The number of unique PAM sequences and the median coverage of every individual PAM variant for the Figure 2B and C.
- https://cdn.elifesciences.org/articles/77825/elife-77825-fig2-data1-v2.xlsx
Figure 2—figure supplement 1
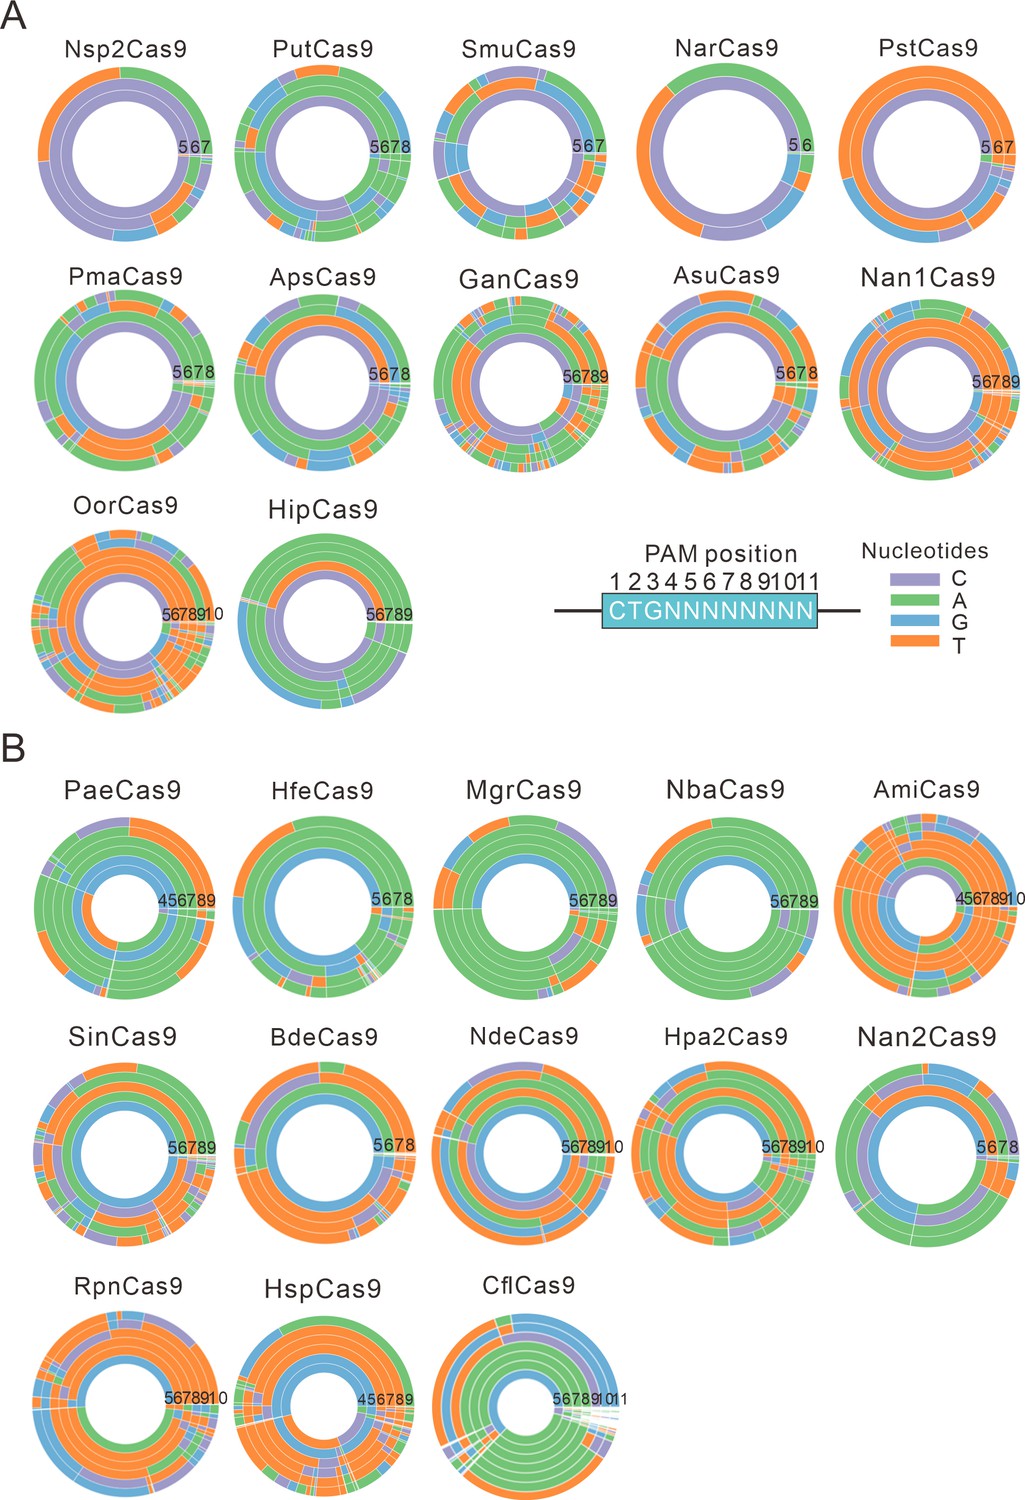
PAM wheels for Nme1Cas9 orthologs.
(A) PAM wheels for Nme1Cas9 orthologs containing an aspartate residue corresponding to the Nme1Cas9 H1024. PAM positions in the screening assay are shown on the bottom right. (B) PAM wheels for Nme1Cas9 orthologs containing histidine, or asparagine residues corresponding to the Nme1Cas9 H1024. PAM wheels start in the middle of the wheel for the first 5’ base exhibiting sequence information.
Figure 2—figure supplement 2
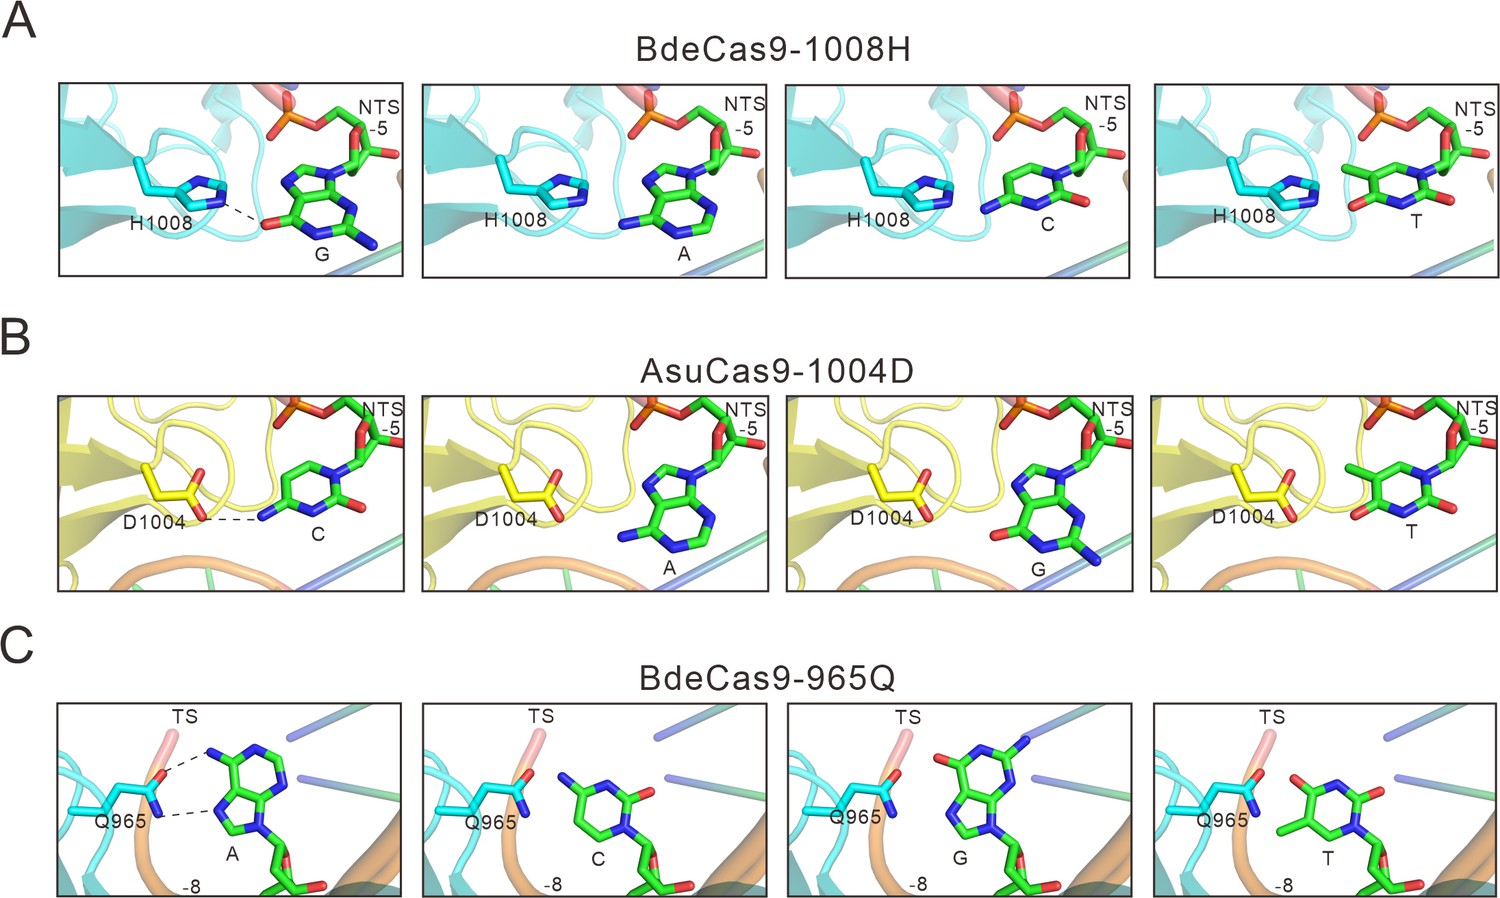
The specificity between amino acids and bases in calculated structural models.
(A) Calculated structural model of Bdecas9. The amino acid near the 5 position of the NTS is histidine. Histidine’s side chain forms a potential hydrogen bond with the 6-hydroxyl group of guanine, if the guanine is other bases, this hydrogen bond would be not formed because of the too close distance (cytosine or thymine) or the lack of a hydroxyl group (adenine). (B) Calculated structural model of Asucas9. The amino acid near the 5 position of NTS is aspartic, and it forms a potential hydrogen bond with the 4-amine group of the cytosine. if the cytosine is replaced by other bases, this hydrogen bond would be abolished because of increased distance (adenine or guanine) or the lack of an amine group (thymine). (C) Calculated structural model of Bdecas9. The amino acid near the 8 position of TS is glutamine, and it forms a potential hydrogen bond with the 6-amine group of the adenine on the TS. If the cytosine is replaced by other bases, this hydrogen bond would be not formed because of too close distance (cytosine or thymine) or the lack of an amine group (guanine). TS: target strand, NTS: non-target strand.
Figure 3 with 4 supplements
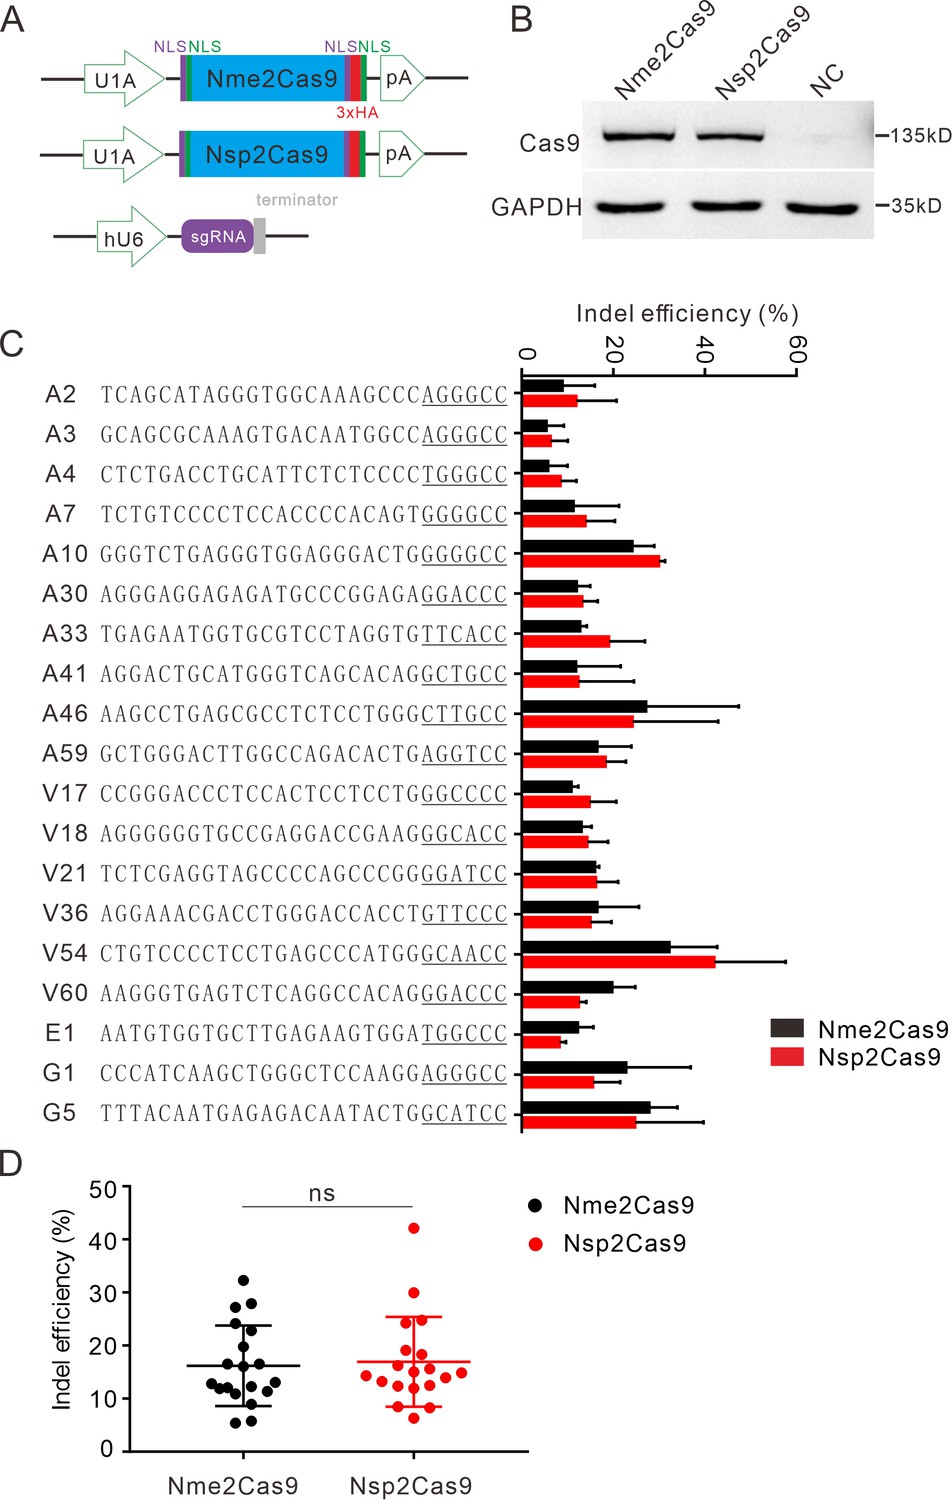
Nsp2Cas9 enables editing in HEK293T cells.
(A) Schematic of Cas9 and sgRNA expression constructs. U1A: U1A promoter; pA: polyA; NLS: nuclear localization signal; HA: HA tag. (B) Protein expression levels of Nsp2Cas9 and Nme2Cas9 were analyzed by Western blot. HEK293T cells without Cas9 transfection were used as negative control (NC). (C) Comparison of Nsp2Cas9 and Nme2Cas9 editing efficiencies at 19 endogenous loci in HEK293T cells. Data represent mean ± SD for n=3 biologically independent experiments. (D) Quantification of the indel efficiencies for Nsp2Cas9 and Nme2Cas9. Each dot represents an average efficiency for an individual locus. Data represent mean ± SD for n=3 biologically independent experiments. P values were determined using a two-sided Student’s t test. P=0.7486 (P>0.05), ns stands for not significant.
-
Figure 3—source data 1
Source data for Figure 3C and D.
- https://cdn.elifesciences.org/articles/77825/elife-77825-fig3-data1-v2.xlsx
-
Figure 3—source data 2
Source data for Figure 2B.
- https://cdn.elifesciences.org/articles/77825/elife-77825-fig3-data2-v2.zip
Figure 3—figure supplement 1
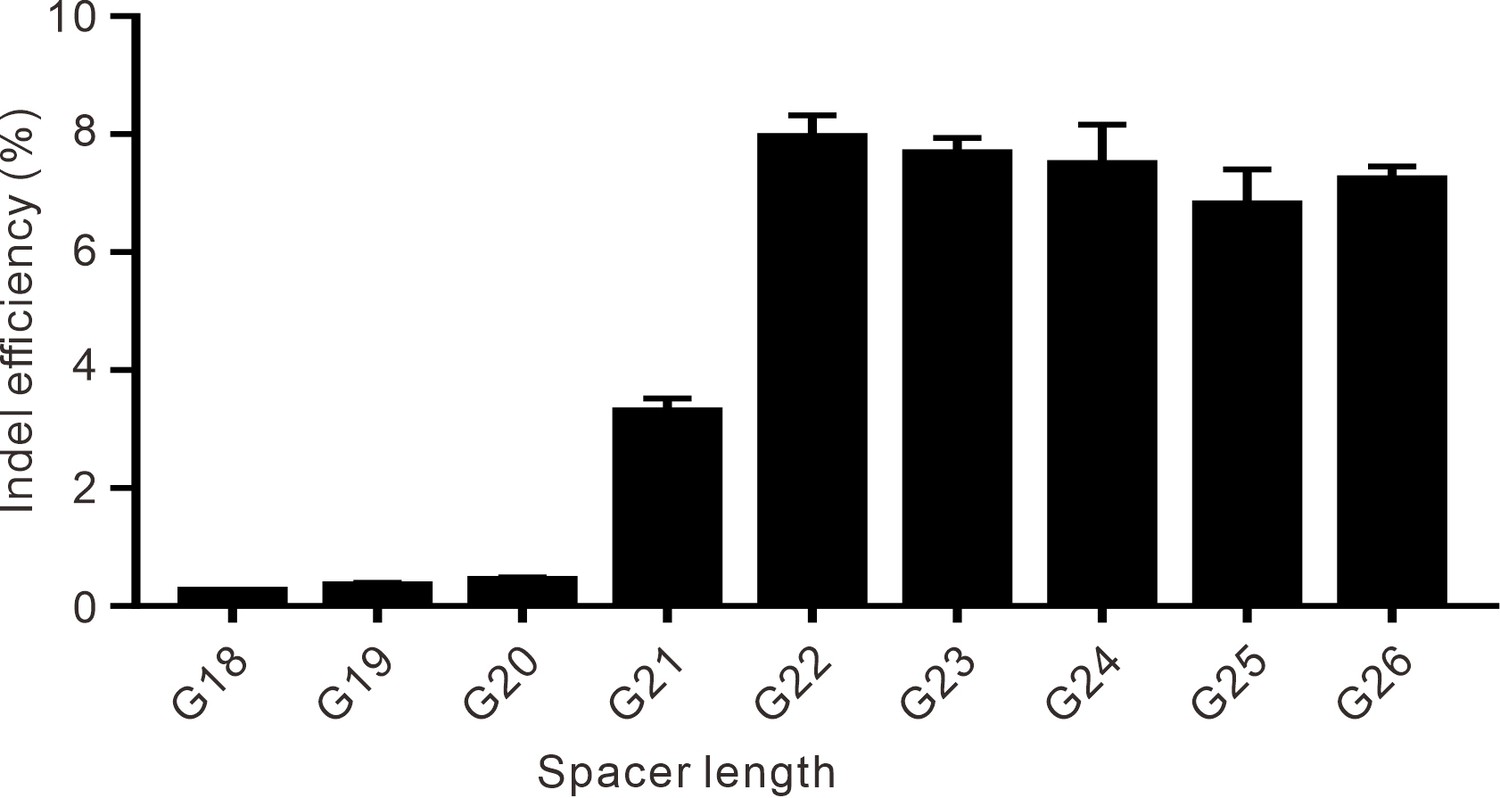
The effect of spacer length on the efficiency of Nsp2Cas9 editing.
A single G5 site on the GRIN2B gene was targeted by sgRNAs with spacer lengths varying from 18 to 26 nt.
-
Figure 3—figure supplement 1—source data 1
Source data for Figure 3—figure supplement 1.
- https://cdn.elifesciences.org/articles/77825/elife-77825-fig3-figsupp1-data1-v2.xlsx
Figure 3—figure supplement 2
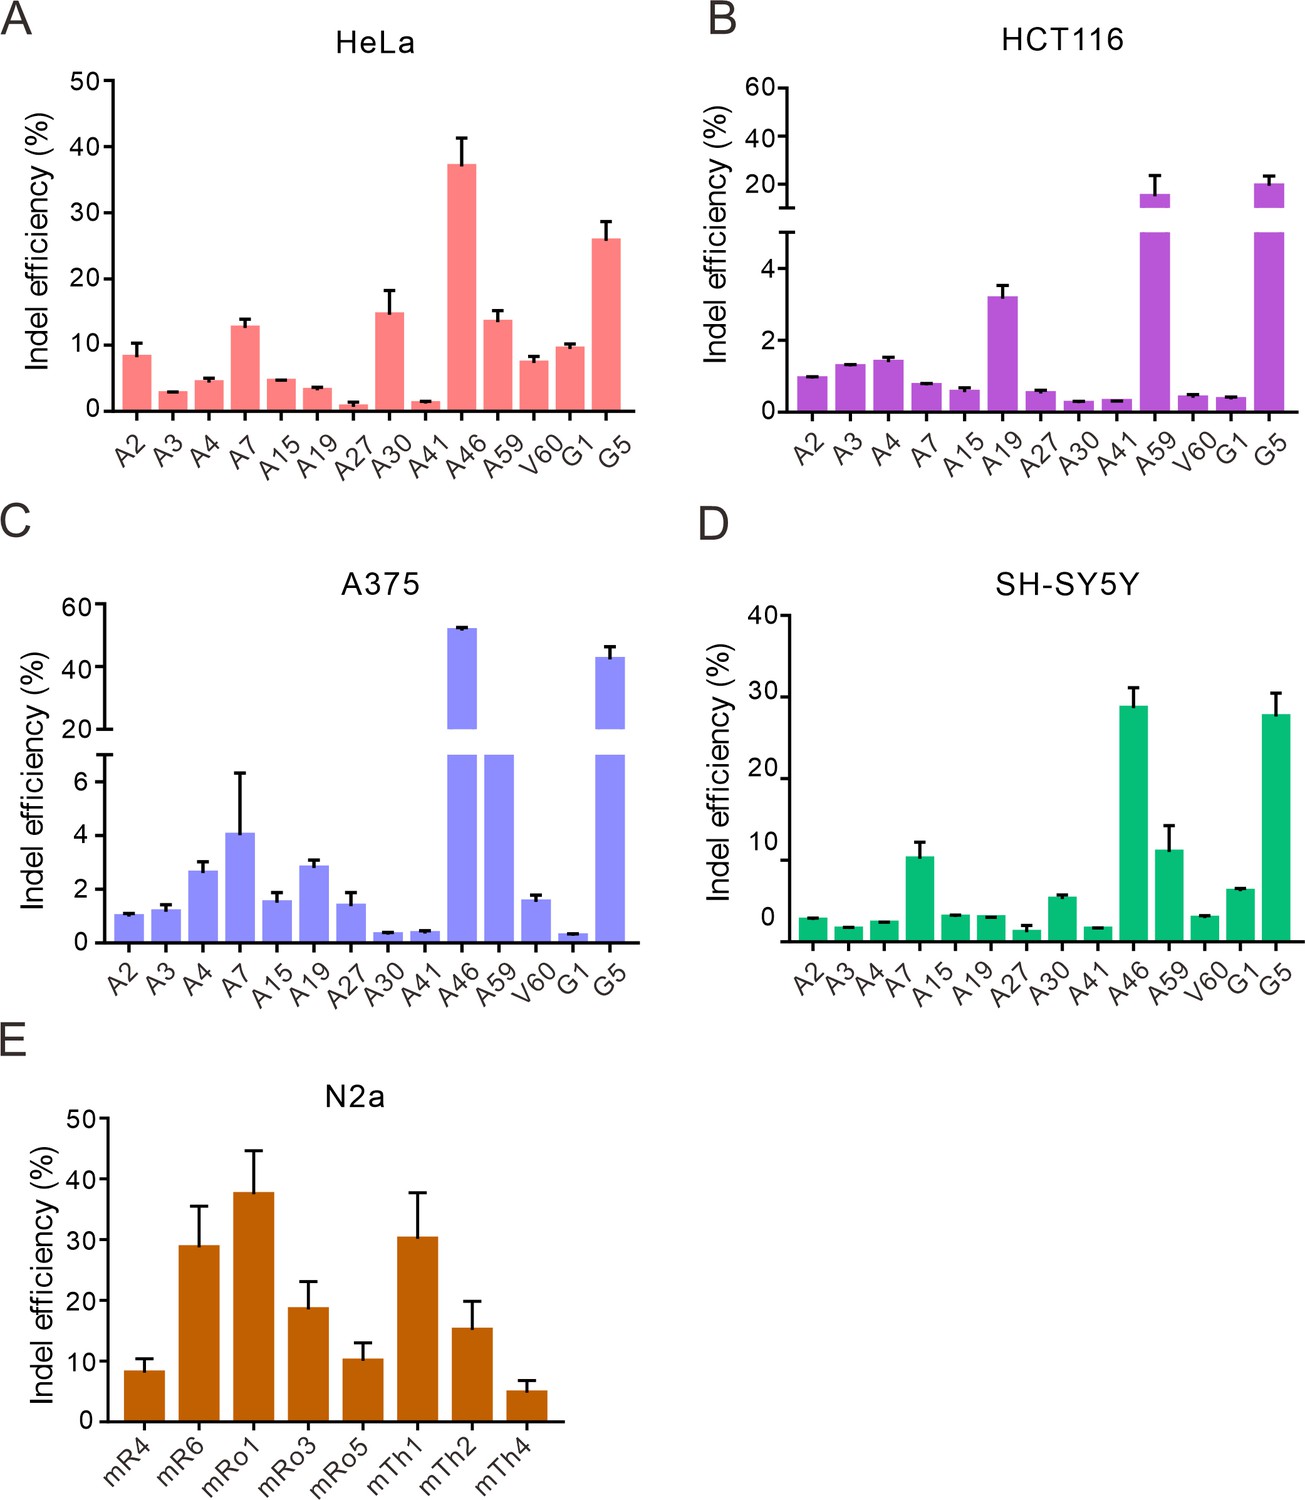
Nsp2Cas9 enables editing in different mammalian cells.
Nsp2Cas9 enables editing in HeLa (A), HCT116 (B), A375 (C), SH-SY5Y (D) and mouse N2a cells (E). Data represent mean ± SD (n=3).
-
Figure 3—figure supplement 2—source data 1
Source data for Figure 3—figure supplement 2A-D.
- https://cdn.elifesciences.org/articles/77825/elife-77825-fig3-figsupp2-data1-v2.xlsx
Figure 3—figure supplement 3

Rational engineering of Nsp2Cas9.
(A) Schematic of the GFP-activation reporter construct for testing engineered Nsp2Cas9 activity. The protospacer sequence is shown below. (B) GFP-positive cells induced by the engineered Nsp2Cas9 variants. Data represent mean ± SD (n=3).
-
Figure 3—figure supplement 3—source data 1
Source data for Figure 3—figure supplement 3B.
- https://cdn.elifesciences.org/articles/77825/elife-77825-fig3-figsupp3-data1-v2.xlsx
Figure 3—figure supplement 4
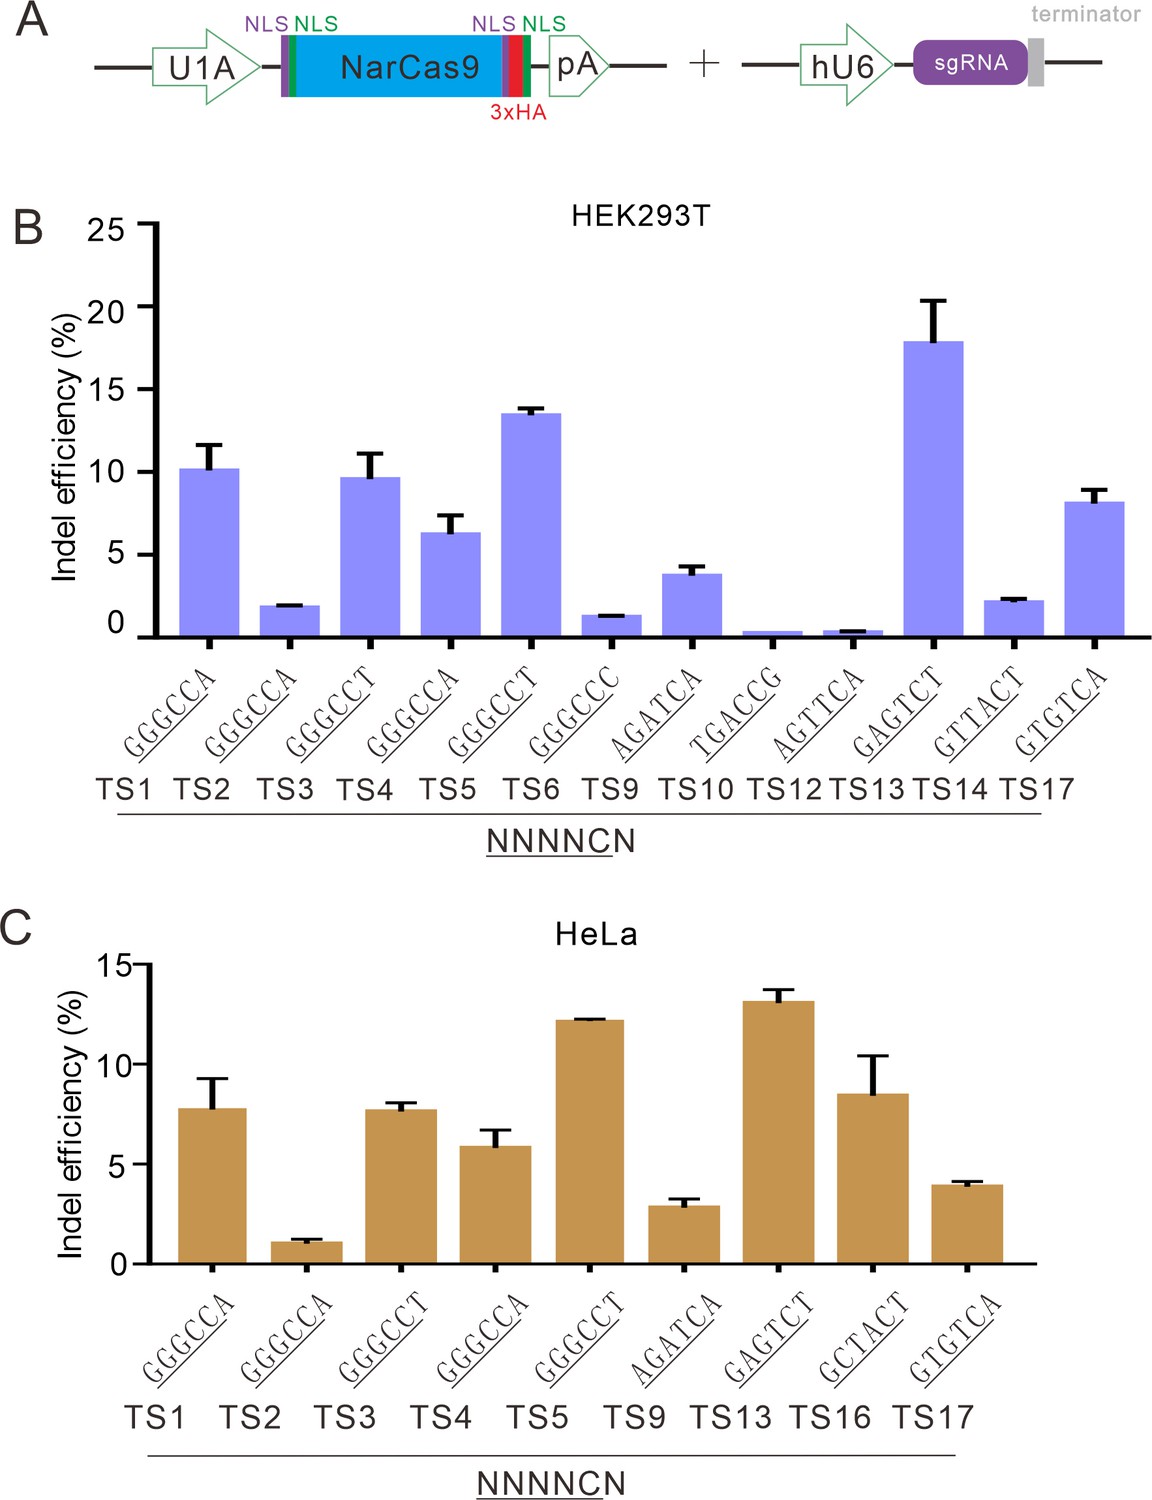
NarCas9 enables genome editing in mammalian cells.
(A) Schematic of Cas9 and sgRNA expression constructs. U1A: U1A promoter; pA: polyA; NLS: nuclear localization signal; HA: HA tag. (B) NarCas9 enables genome editing in HEK293T cells. Data represent mean ± SD (n=3). (C) NarCas9 enables genome editing in HeLa cells. Data represent mean ± SD (n=3).
-
Figure 3—figure supplement 4—source data 1
Source data for Figure 3—figure supplement 4B.
- https://cdn.elifesciences.org/articles/77825/elife-77825-fig3-figsupp4-data1-v2.xlsx
-
Figure 3—figure supplement 4—source data 2
Source data for Figure 3—figure supplement 4C.
- https://cdn.elifesciences.org/articles/77825/elife-77825-fig3-figsupp4-data2-v2.xlsx
Figure 4 with 3 supplements

Characterization of Nsp2-SmuCas9 for genome editing.
(A) Schematic diagram of chimeric Cas9 nucleases based on Nsp2Cas9. PI domain of Nsp2Cas9 was replaced with the PI domain of SmuCas9. (B) Sequence logos and (C) PAM wheel diagrams indicate that Nsp2-SmuCas9 recognizes an N4C PAM. (D) Nsp2-SmuCas9 generated indels at endogenous sites with N4C PAMs in HEK293T cells. Indel efficiencies were determined by targeted deep sequencing. NarCas9 is used as a control. Data represent mean ± SD for n=3 biologically independent experiments. (E) Quantification of the indel efficiencies for Nsp2-SmuCas9 and NarCas9. Each dot represents an average efficiency for an individual locus. Data represent mean ± SD for n=3 biologically independent experiments. p values were determined using a two-sided Student’s t test. *p=0.0148 (0.01<p < 0.05).
-
Figure 4—source data 1
Source data for Figure 4D and E.
- https://cdn.elifesciences.org/articles/77825/elife-77825-fig4-data1-v2.xlsx
Figure 4—figure supplement 1
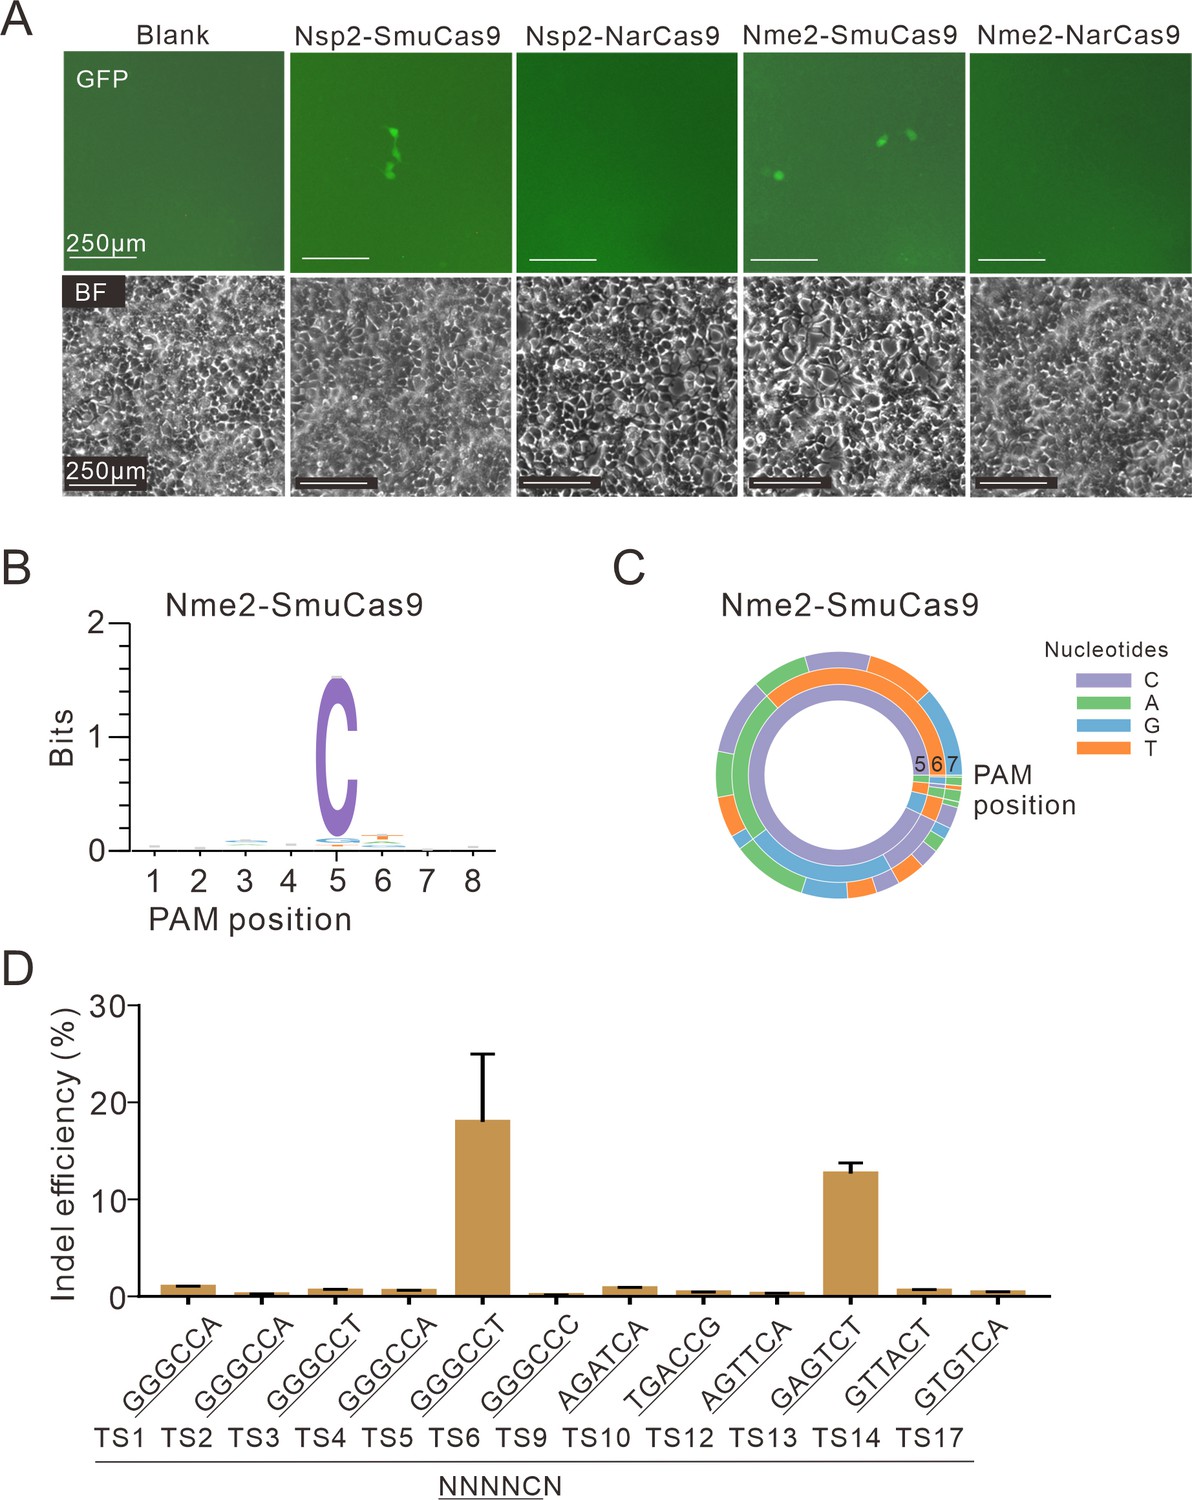
Test of 4 chimeric Cas9 activity through a GFP-activation assay.
(A) Nsp2-SmuCas9 and Nme2-SmuCas9 could induce GFP expression. Reporter cells without Cas9 transfection are used as a negative control. Scale bar: 250 μm. (B) Sequence logo and (C) PAM wheel diagram indicate that Nme2-SmuCas9 recognizes an N4C PAM. (D) Nme2-SmuCas9 generated indels at endogenous sites with N4C PAMs in HEK293T cells. Indel efficiencies were determined by targeted deep sequencing. Data represent mean ± SD for n=3 biologically independent experiments.
-
Figure 4—figure supplement 1—source data 1
Source data for Figure 4—figure supplement 1D.
- https://cdn.elifesciences.org/articles/77825/elife-77825-fig4-figsupp1-data1-v2.xlsx
Figure 4—figure supplement 2
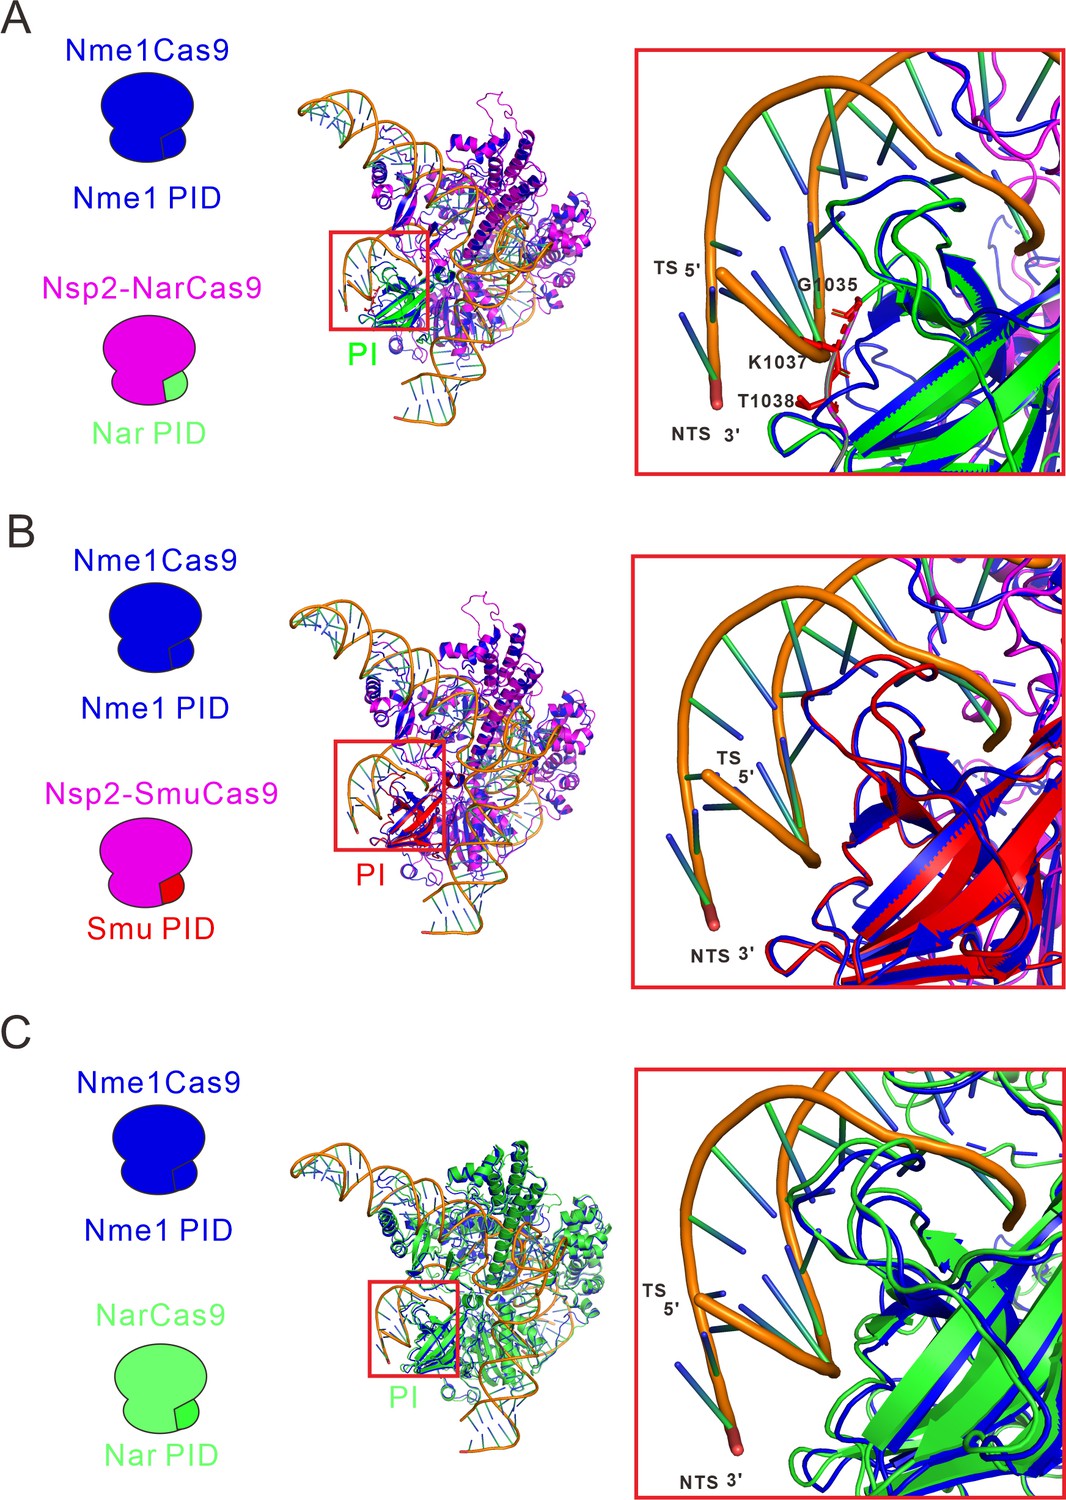
Structure of the fully complementary Cas9-sgRNA-dsDNA complex in a catalytic state.
(A) An alignment of the protein tertiary structures of Nsp2-NarCas9 and Nme1Cas9-sgRNA-dsDNA complexes. Blue represents the Nme1Cas9 protein, and green represents the PI domain of NarCas9, PID: PAM identify domain. (B) Align of Nme1Cas9 and Nsp2-SmuCas9. Blue represents the Nme1Cas9 protein, orange represents the Nsp2Cas9 protein, and red represents the PI domain of SmuCas9. (C) Align of Nme1Cas9 and NarCas9. The green represents the NarCas9 protein. TS: target strand, NTS: non-target strand.
Figure 4—figure supplement 3
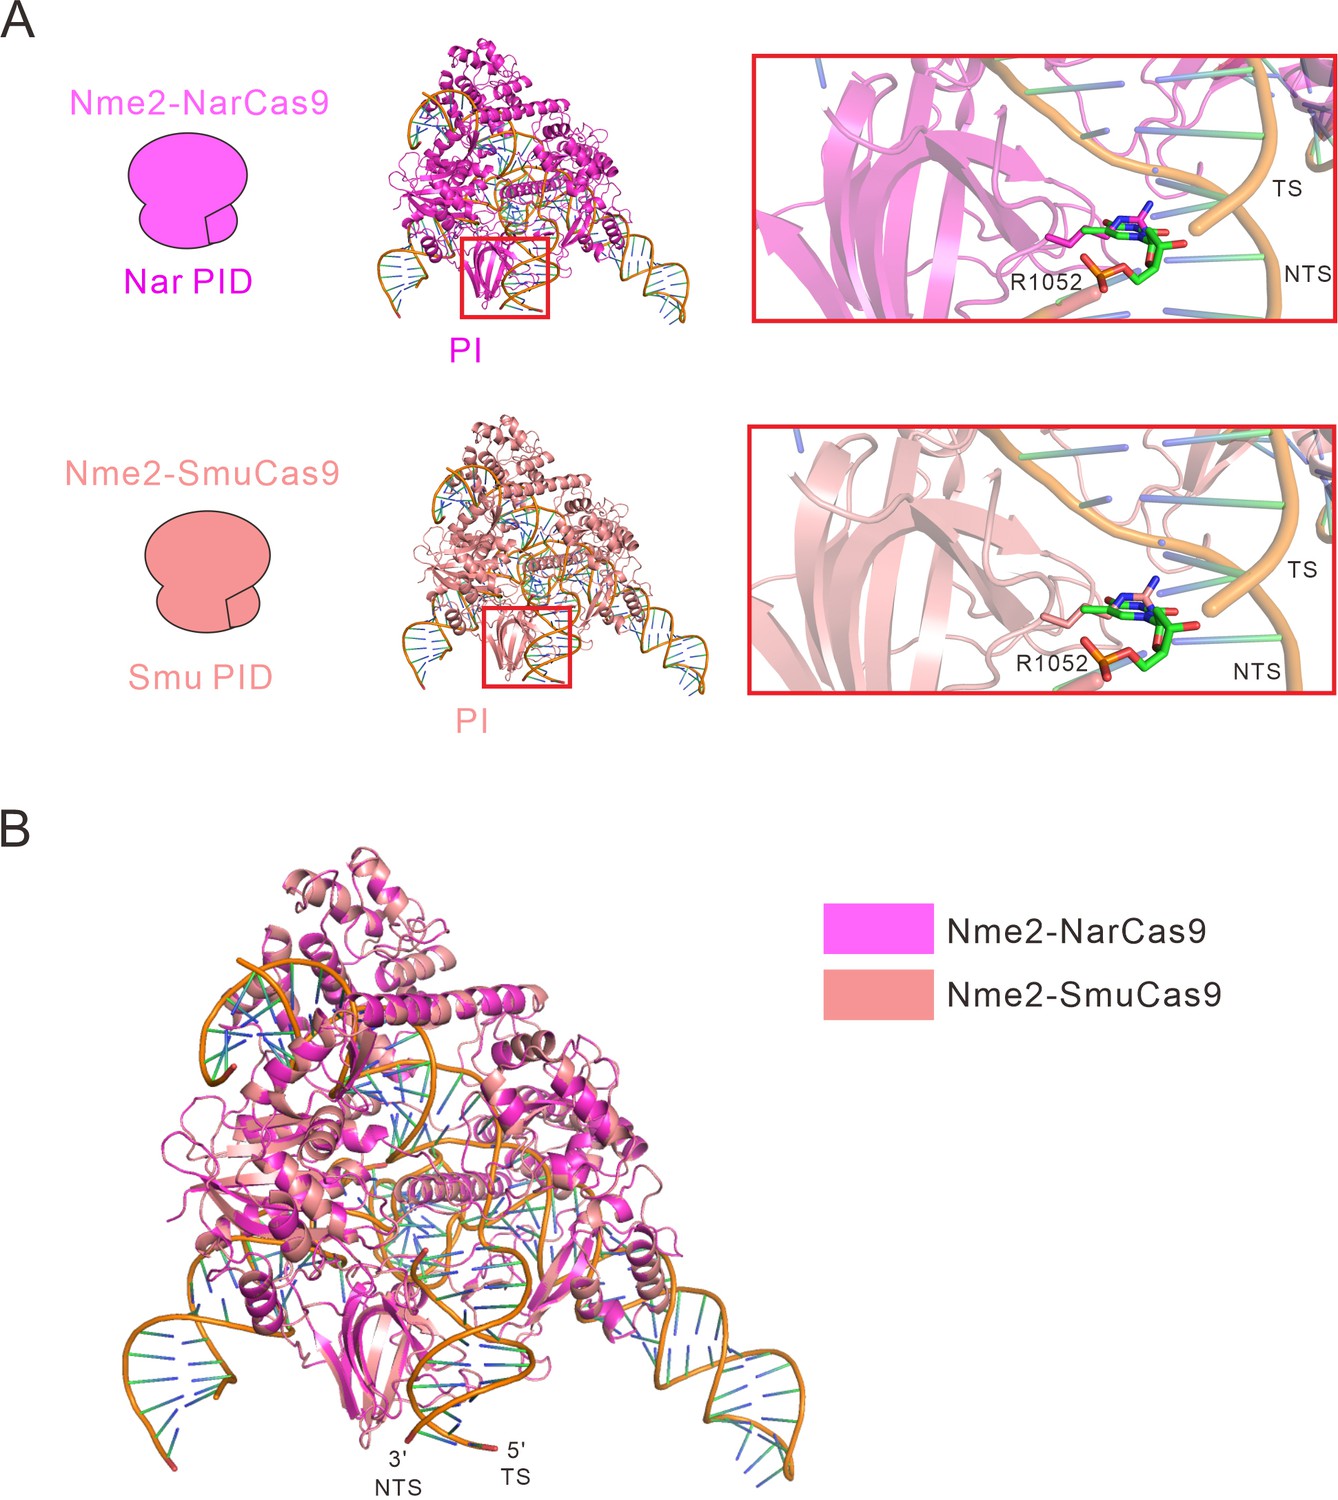
Calculated structural models of Nme2-NarCas9 and Nme2-SmuCas9 chimeras.
(A) Calculated structural models of Nme2-NarCas9 and Nme2-SmuCas9 chimeras. In the inactive Nme2-NarCas9 chimera (magenta), R1052 will crash with the DNA strand, leading to a failure of binding with DNA. In the active Nme2-SmuCas9 chimera (salmon), R1052 will also crash with the DNA strand. (B) Overall calculated structures of Nme2-NarCas9 (magenta) and Nme2-SmuCas9 (salmon) chimeras with sgRNA and dsDNA. TS: target strand, NTS: non-target strand.
Figure 5
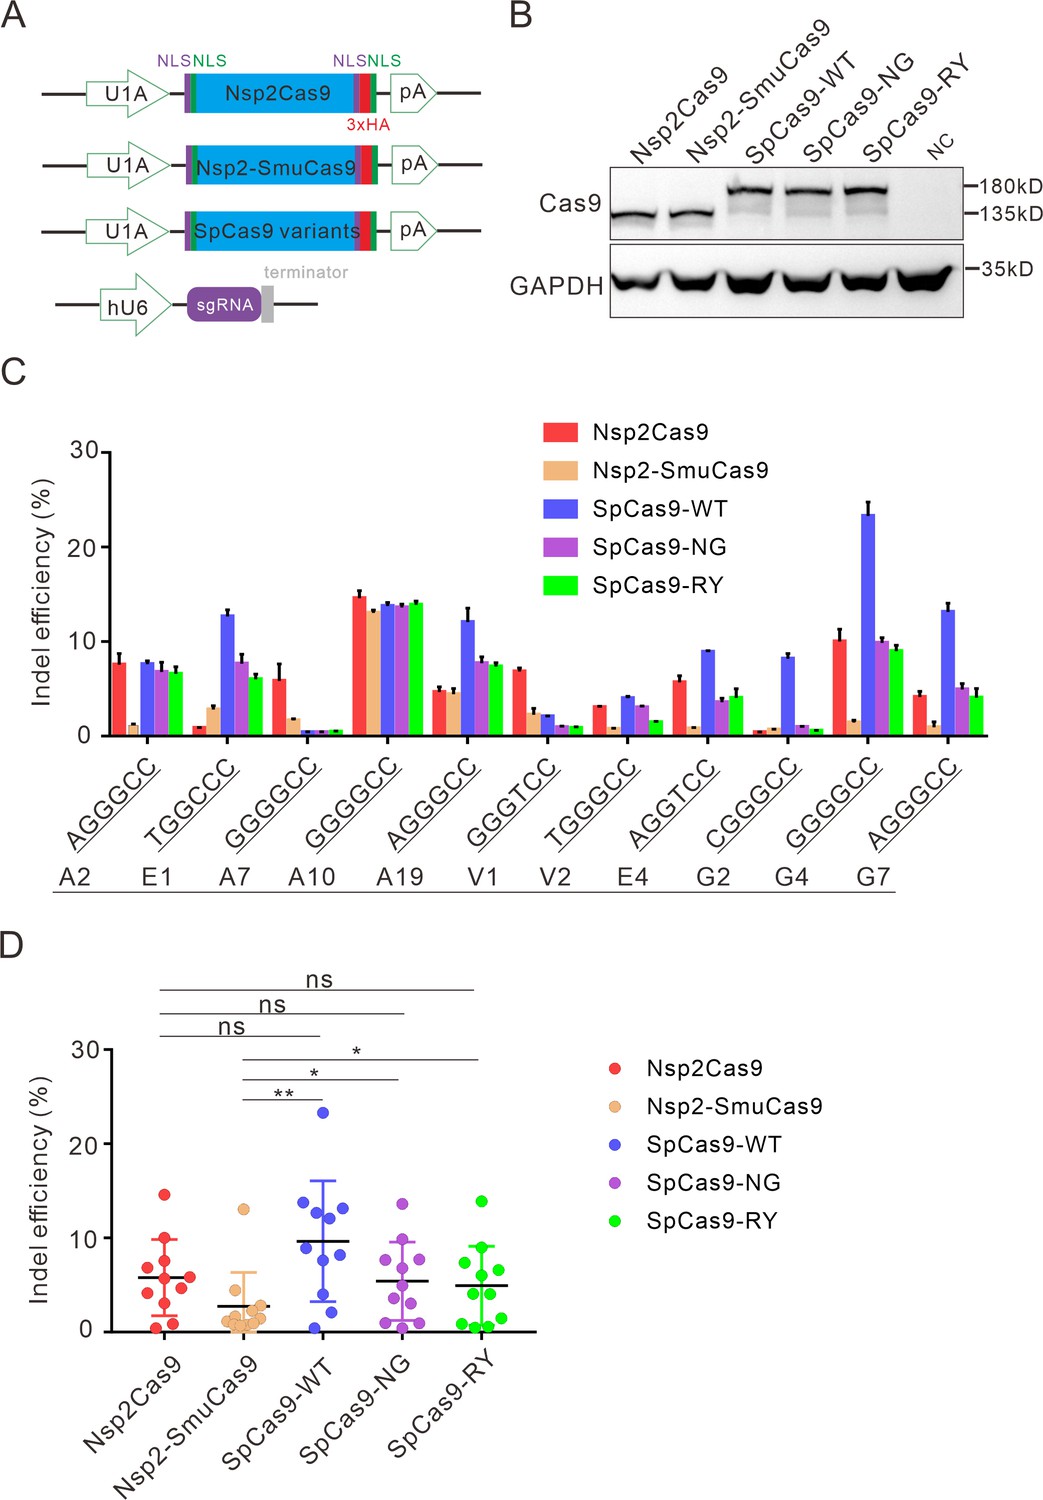
Comparison of indel efficiency between Nsp2Cas9, Nsp2-SmuCas9, and SpCas9.
(A) Schematic of Cas9 and sgRNA expression constructs. U1A: U1A promoter; pA: polyA; NLS: nuclear localization signal; HA: HA tag. (B) Protein expression levels of Nsp2Cas9, Nsp2-SmuCas9, and SpCas9 were analyzed by western blot. HEK293T cells without Cas9 transfection were used as a negative control (NC). (C) The editing efficiencies of Nsp2Cas9, Nsp2-SmuCas9, and SpCas9 varied depending on the target sites. The PAM sequences (NGGNCC) were shown below. Data represent mean ± SD for n=3 biologically independent experiments. (D) Quantification of the indel efficiencies for Nsp2Cas9, Nsp2-SmuCas9, and SpCas9. Each dot represents an average efficiency for an individual locus. Data represent mean ± SD for n=3 biologically independent experiments. p values were determined using a two-sided Student’s t test. p=0.3883, p=0.7316, p=0.0741 (p>0.05), ns stands for not significant. *p=0.0247, *p=0.0144, (0.01<p < 0.05), * stands for significant. **p=0.0058 (p<0.01), ** stands for significant.
-
Figure 5—source data 1
Source data for Figure 5B.
- https://cdn.elifesciences.org/articles/77825/elife-77825-fig5-data1-v2.zip
-
Figure 5—source data 2
Source data for the Figure 5C and D.
- https://cdn.elifesciences.org/articles/77825/elife-77825-fig5-data2-v2.xlsx
Figure 6
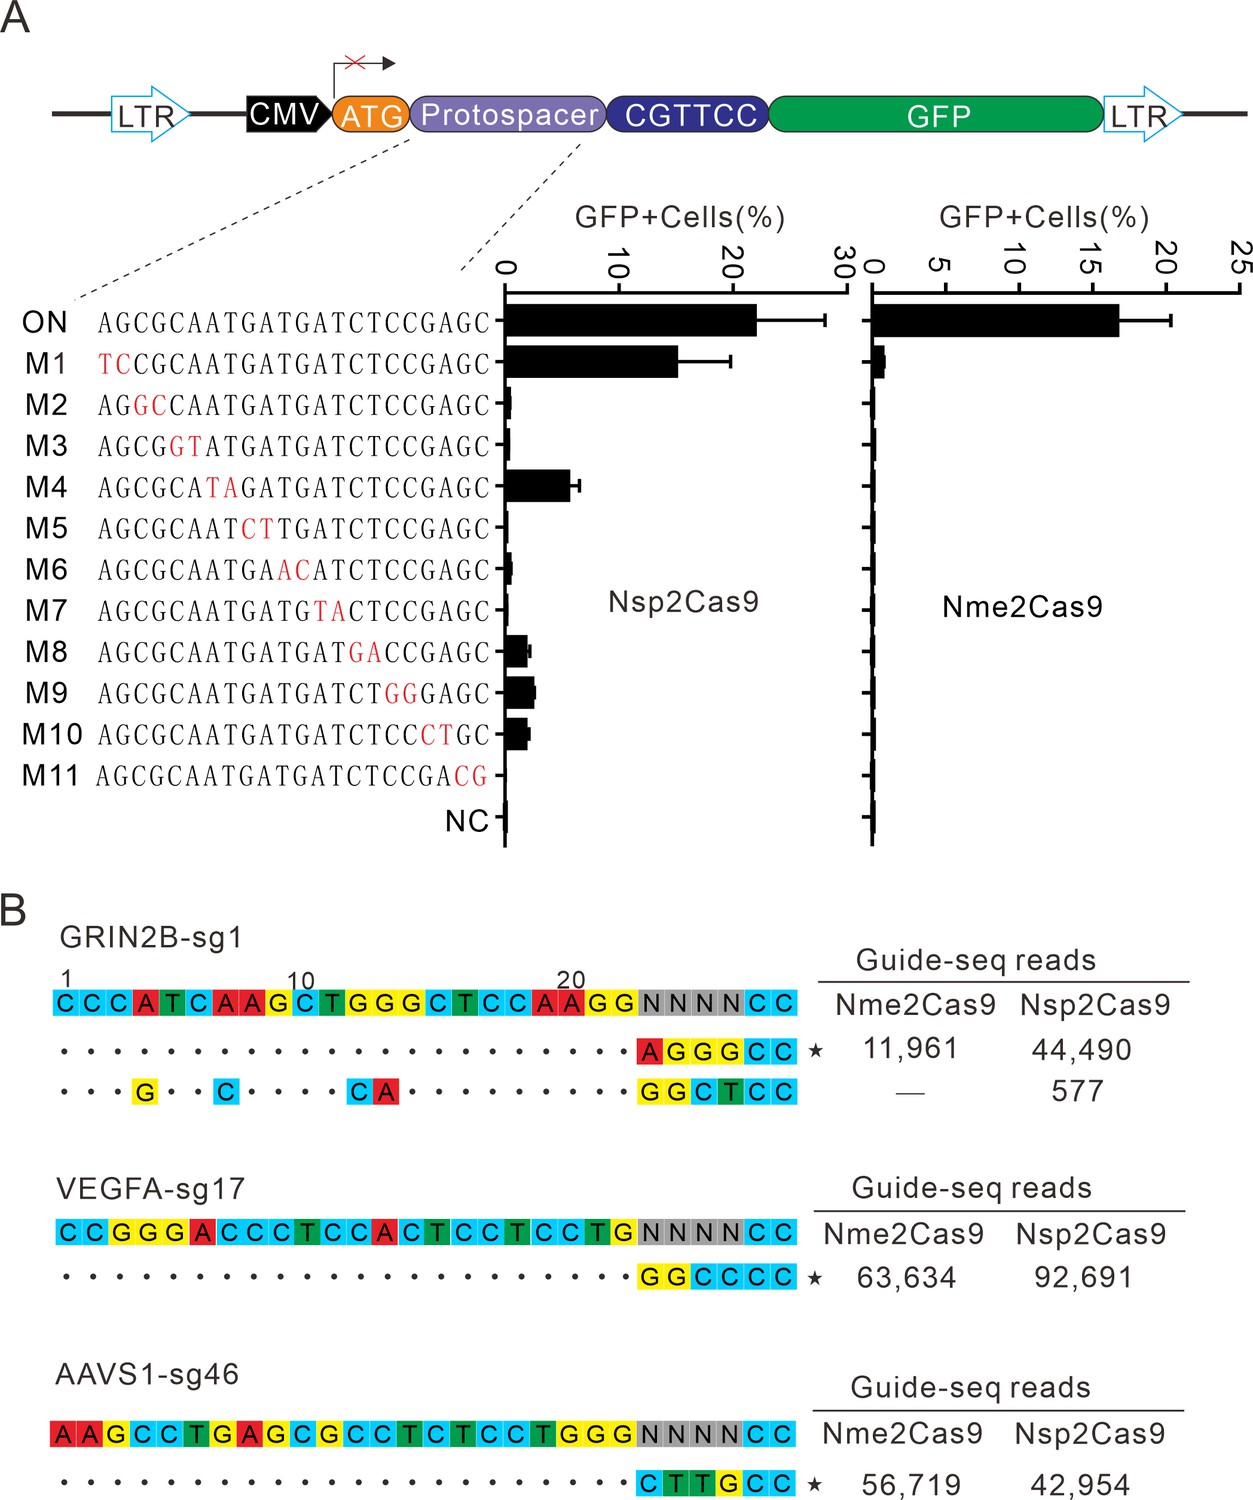
Analysis of Nsp2Cas9 specificity.
(A) Analysis of Nsp2Cas9 and Nme2Cas9 specificity with a GFP-activation assay. A panel of sgRNAs with dinucleotide mutations (red) is shown below. The editing efficiencies reflected by ratio of GFP-positive cells are shown. Data represent mean ± SD for n=3 biologically independent experiments. (B) GUIDE-seq was performed to analyze the genome-wide off-target effects of Nsp2Cas9 and Nme2Cas9. On-target (indicated by stars) and off-target sequences are shown on the left. Read numbers are shown on the right. Mismatches compared to the on-target site are shown and highlighted in color.
-
Figure 6—source data 1
Source data for the Figure 6A.
- https://cdn.elifesciences.org/articles/77825/elife-77825-fig6-data1-v2.xlsx
Figure 7
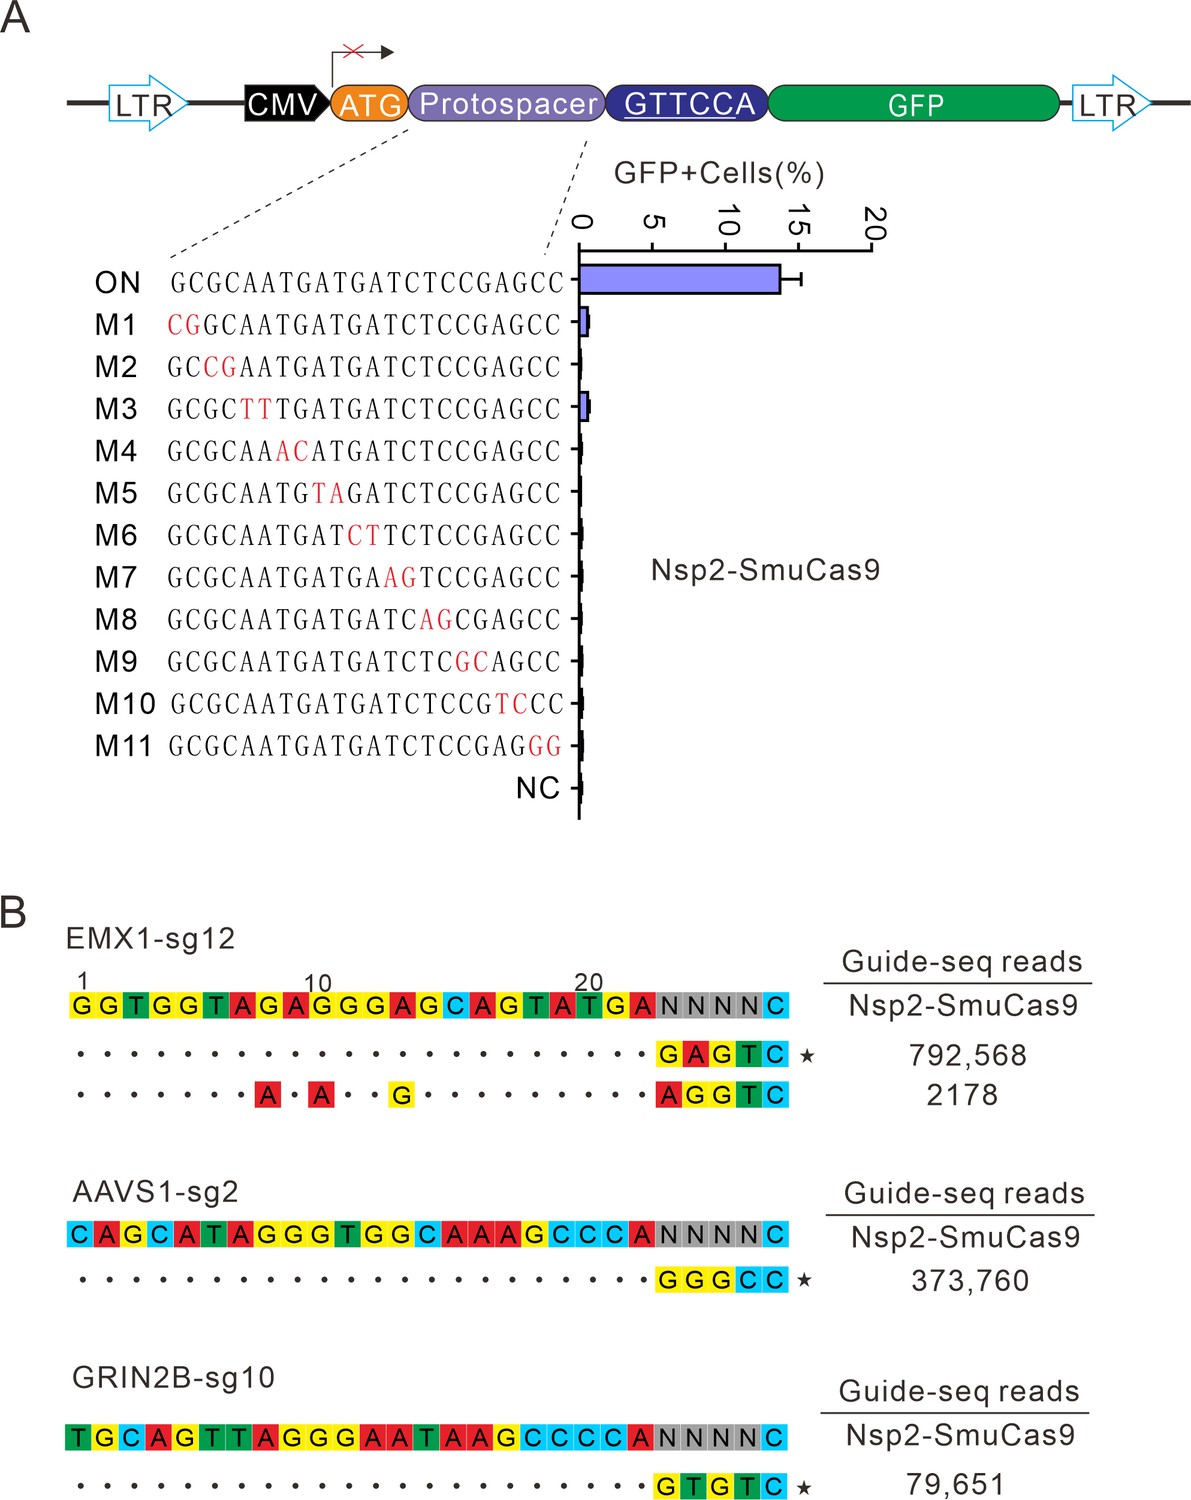
Analysis of Nsp2-SmuCas9 specificity.
(A) Analysis of Nsp2-SmuCas9 specificity with a GFP-activation assay. A panel of sgRNAs with dinucleotide mutations (red) is shown below. The editing efficiencies reflected by ratio of GFP-positive cells are shown. Data represent mean ± SD for n=3 biologically independent experiments. (B) GUIDE-seq was performed to analyze the genome-wide off-target effects of Nsp2-SmuCas9. On-target (indicated by stars) and off-target sequences are shown on the left. Read numbers are shown on the right. Mismatches compared to the on-target site are shown and highlighted in color.
-
Figure 7—source data 1
Source data for the Figure 7A.
- https://cdn.elifesciences.org/articles/77825/elife-77825-fig7-data1-v2.xlsx
Tables
Table 1
Nme1Cas9 orthologs selected from the UniProt database.
| UniProt ID | Host strain | Name | Length (aa) | Identity toNme1Cas9 (%) |
|---|---|---|---|---|
| A0A011P7F8 | Mannheimia granulomatis | MgrCas9 | 1,049 | 65.5 |
| A0A0A2YBT2 | Gallibacterium anatis IPDH697-78 | GanCas9 | 1,035 | 59.7 |
| A0A0J0YQ19 | Neisseria arctica | NarCas9 | 1,070 | 70.4 |
| A0A1T0B6J6 | [Haemophilus felis] | HfeCas9 | 1,058 | 65.3 |
| A0A1X3DFB7 | Neisseria dentiae | NdeCas9 | 1,074 | 66.4 |
| A0A263HCH5 | Actinobacillus seminis | AseCas9 | 1,059 | 66 |
| A0A2M8S290 | Conservatibacter flavescens | CflCas9 | 1,063 | 64.2 |
| A0A2U0SK41 | Pasteurella langaaensis DSM 22999 | PlaCas9 | 1,056 | 63.9 |
| A0A356E7S3 | Pasteurellaceae bacterium | PstCas9 | 1,076 | 63 |
| A0A369Z1C7 | Haemophilus parainfluenzae | Hpa1Cas9 | 1,056 | 64.8 |
| A0A369Z3K3 | Haemophilus parainfluenzae | Hpa2Cas9 | 1,054 | 65.2 |
| A0A377J007 | Haemophilus pittmaniae | HpiCas9 | 1,053 | 65.2 |
| A0A378UFN0 | Bergeriella denitrificans (Neisseria denitrificans) | BdeCas9 | 1,069 | 68.8 |
| A0A379B6M0 | Pasteurella mairii | PmaCas9 | 1,061 | 63.1 |
| A0A379CB86 | Phocoenobacter uteri | PutCas9 | 1,059 | 63 |
| A0A380MYP0 | Suttonella indologenes | SinCas9 | 1,071 | 67.8 |
| A0A3N3EE71 | Neisseria animalis | Nan1Cas9 | 1,074 | 66.6 |
| A0A3S4XT82 | Neisseria animaloris | Nan2Cas9 | 1,078 | 65.4 |
| A0A420XER8 | Otariodibacter oris | OorCas9 | 1,058 | 64.4 |
| A0A448K7T0 | Pasteurella aerogenes | PaeCas9 | 1,056 | 68.2 |
| A0A4S2QB06 | Rodentibacter pneumotropicus | RpnCas9 | 1,055 | 63.7 |
| A0A4Y9GBC9 | Neisseria sp. WF04 | Nsp2Cas9 | 1,067 | 59.6 |
| A6VLA7 | Actinobacillus succinogenes (strain ATCC 55618/DSM 22257/130Z) | AsuCas9 | 1,062 | 64.6 |
| C5S1N0 | Actinobacillus minor NM305 | AmiCas9 | 1,056 | 67.7 |
| E0F2V7 | Actinobacillus pleuropneumoniae serovar 10 str. D13039 | ApsCas9 | 1,054 | 65.4 |
| F2B8K0 | Neisseria bacilliformis ATCC BAA-1200 | NbaCas9 | 1,077 | 66.5 |
| J4KDT3 | Haemophilus sputorum | HspCas9 | 1,052 | 65.2 |
| V9H606 | Simonsiella muelleri ATCC 29453 | SmuCas9 | 1,063 | 62.2 |
| W0Q6X6 | Mannheimia sp. USDA-ARS-USMARC-1261 | MspCas9 | 1,047 | 65.7 |
Key resources table
| Reagent type (species) or resource | Designation | Source or reference | Identifiers | Additional information |
|---|---|---|---|---|
| Gene (Homo sapiens) | AAVS1 | GenBank | HGNC:HGNC:22 | |
| Gene (Homo sapiens) | VEGFA | GenBank | HGNC:HGNC:12680 | |
| Gene (Homo sapiens) | EMX1 | GenBank | HGNC:HGNC:3340 | |
| Gene (Homo sapiens) | GRIN2B | GenBank | HGNC:HGNC:4586 | |
| Recombinant DNA reagent | Instant Sticky-end Ligase Master Mix | NEB | Catalog #: M0370S | |
| Recombinant DNA reagent | T4 DNA ligase | NEB | Catalog #: M0202S | |
| Cell line (Homo-sapiens) | HEK293T (normal, Adult) | ATCC | CRL-3216 | |
| Cell line (Homo-sapiens) | HeLa | ATCC | CRM-CCL-2 | |
| Cell line (Homo-sapiens) | SH-SY5Y | ATCC | CRL-2266 | |
| Cell line (Homo-sapiens) | A375 (normal, Adult) | ATCC | CRL-1619 | |
| Cell line (Homo-sapiens) | HCT116 (adult male) | ATCC | CCL-247 | |
| Cell line (Mus musculus) | N2a cells (mouse neuroblasts) | ATCC | CCL-131 | |
| Antibody | Anti-HA (rabbit polyclonal) | abcom | abcam: ab137838; RRID:AB_262051 | (1:1000) |
| Antibody | Anti-GAPDH (rabbit polyclonal) | Cell Signaling | Cell Signaling:#3683; RRID:AB_307275 | (1:1000) |
| Sequence-based reagent | dsODN-F | This paper | dsODN oligo primer | 5ʹ- P-G*T*TTAATTGAGTTGTCATATGTTAATAACGGT*A*T - 3ʹ |
| Sequence-based reagent | dsODN-R | This paper | dsODN oligo primer | 5ʹ- P-A*T*ACCGTTATTAACATATGACAACTCAATTAA*A*C –3ʹ |
| Sequence-based reagent | P5_index_F | This paper | PCR primers | AATGATACGGCGACCACCGAGATCTACACTGAACCTTA CACTCTTTCCCTACACGAC |
| Sequence-based reagent | Nuclease_off_+_G SP | This paper | PCR primers | GGATCTCGACGCTCTCCCTATACCGTTATTAACATATGACA |
| Sequence-based reagent | Nuclease_off_- _GSP1 | This paper | PCR primers | GGATCTCGACGCTCTCCCTGTTTAATTGAGTTGTCATATGTTAATAAC |
| Sequence-based reagent | P5_2 | This paper | PCR primers | AATGATACGGCGACCACCGAGATCTACAC |
| Sequence-based reagent | Nuclease_off _+_GSP2 | This paper | PCR primers | CAAGCAGAAGACGGCATACGAGATTCGCCTTAGTGACTGGAGT TCAGACGTGTGCTCTTCCGATCTACATATGACAACTCAATTAAAC |
| Sequence-based reagent | Nuclease_off _- _GSP2 | This paper | PCR primers | CAAGCAGAAGACGGCATACGAGATCTAGTACGGTGAC TGGAGTCCTCTCTATGGGCAGTCGGTGATTTGAGTTG TCATATGTTAATAACGGTA |
| Software, algorithm | FlowJo software | FlowJo VX | ||
| Software, algorithm | CorelDRAW 2020 software | CorelDRAW 2020 | ||
| Software, algorithm | Vector NTI software | Vector NTI | ||
| Software, algorithm | GraphPad Prism software | GraphPad Prism 7 (https://graphpad.com) | RRID:SCR_015807 | Version 7.0.0 |
| Chemical compound, drug | SYBR Gold nucleic acid stain | Thermo Fisher Scientific | Thermo Fisher Scientific: S11494 |
Additional files
-
Supplementary file 1
The Cas9 ID and human codon–optimized Cas9 gene.
The file contains the Cas9 ID, tracrRNA, and amino acid sequences of Nme1Cas9 orthologs used in this study. The human codon-optimized Cas9 genes were synthesized. The primers used for the chimera’s construction were also listed in this file.
- https://cdn.elifesciences.org/articles/77825/elife-77825-supp1-v2.xlsx
-
Supplementary file 2
The single-guide RNA sequence.
The single-guide RNA sequence for Nme1Cas9 orthologs and chimeras used in this study.
- https://cdn.elifesciences.org/articles/77825/elife-77825-supp2-v2.xlsx
-
Supplementary file 3
Primers used in this study.
A list of oligonucleotide pairs and primers used for deep sequencing.
- https://cdn.elifesciences.org/articles/77825/elife-77825-supp3-v2.xlsx
-
Supplementary file 4
Target sites used in this study.
A list of the endogenous target sites of human and mouse and their downstream PAM. PAM, protospacer adjacent motif.
- https://cdn.elifesciences.org/articles/77825/elife-77825-supp4-v2.xlsx
-
Supplementary file 5
Underlying values for all reported summary statistics.
Raw data from all reported summary statistics.
- https://cdn.elifesciences.org/articles/77825/elife-77825-supp5-v2.xlsx
-
Transparent reporting form
- https://cdn.elifesciences.org/articles/77825/elife-77825-transrepform1-v2.docx
Download links
A two-part list of links to download the article, or parts of the article, in various formats.
Downloads (link to download the article as PDF)
Open citations (links to open the citations from this article in various online reference manager services)
Cite this article (links to download the citations from this article in formats compatible with various reference manager tools)
Closely related type II-C Cas9 orthologs recognize diverse PAMs
eLife 11:e77825.
https://doi.org/10.7554/eLife.77825


