Decoding mechanism of action and sensitivity to drug candidates from integrated transcriptome and chromatin state
- Department of Pharmaceutical and Pharmacological Sciences, University of Padova, Italy
- Systems Medicine, Deutsches Zentrum für Neurodegenerative Erkrankungen (DZNE) e.V., Germany
- Genomics and Immunoregulation, Life & Medical Sciences (LIMES) Institute, University of Bonn, Germany
- Institute of Organic Chemistry, Justus Liebig University Giessen, Germany
- PRECISE Platform for Genomics and Epigenomics, Deutsches Zentrum für Neurodegenerative Erkrankungen (DZNE) e.V. and University of Bonn, Germany
- Institute of Human Genetics, University of Lübeck, Germany
- Statistics and Machine Learning, Deutsches Zentrum für Neurodegenerative Erkrankungen (DZNE) e.V., Germany
- MRC Biostatistics Unit, University of Cambridge, United Kingdom
- Department of Internal Medicine and Radboud Center for Infectious Diseases (RCI), Radboud University Medical Center, Netherlands
Figures
Figure 1 with 1 supplement
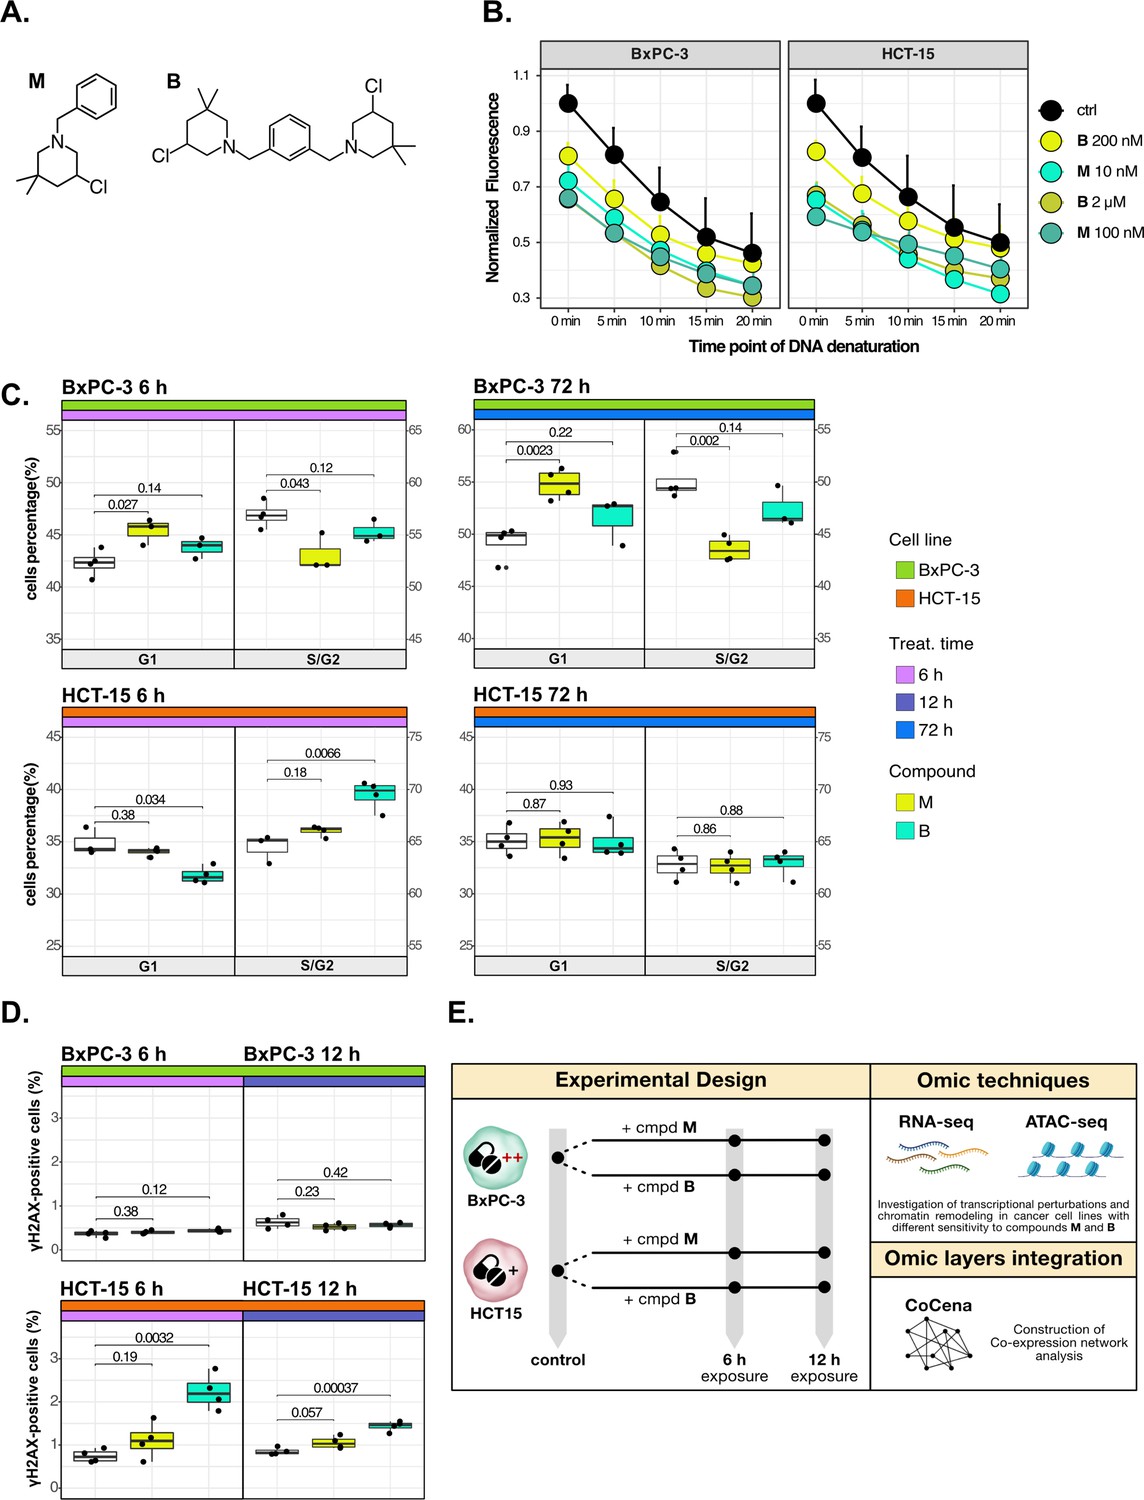
Cancer tropism of 3-chloropiperidines (3-CePs) is not explained by DNA damage.
(A) Chemical structure of the analyzed 3-CePs (M=monofunctional and B=bifunctional). (B) Quantification of genomic DNA damage in BxPC-3 and HCT-15 cells treated with M (10 nM and 100 nM), B (200 nM and 2 µM), or DMSO (dimethyl sulfoxide) 0.5% (ctrl) for 6 hr and analyzed by the fast micromethod single-strand-break assay: alkaline denaturation of DNA is followed in time up to 20 min by monitoring the fluorescence of the dsDNA-specific PicoGreen dye. (C) Cell cycle distribution (accumulation in G1 vs G2/S phases) of BxPC-3 and HCT-15 cells treated with M (10 nM), B (200 nM), or DMSO 0.5% for 6 hr and 72 hr analyzed by FACS (Fluorescence Activated Cell Sorting). At least three biological replicates were obtained per condition and unpaired two-tailed Student’s t-test was performed to assess statistical significance (p<0.05). (D) Analysis of H2AX phosphorylation in BxPC-3 and HCT-15 cells treated with M (10 nM), B (200 nM), or DMSO 0.5% for 6 hr and 12 hr analyzed by FACS. At least three biological replicates were obtained per condition, and unpaired two-tailed Student’s t-test was performed to assess statistical significance (p<0.05). (E) Schematic representation of the adopted omic-based approach.
Figure 1—figure supplement 1
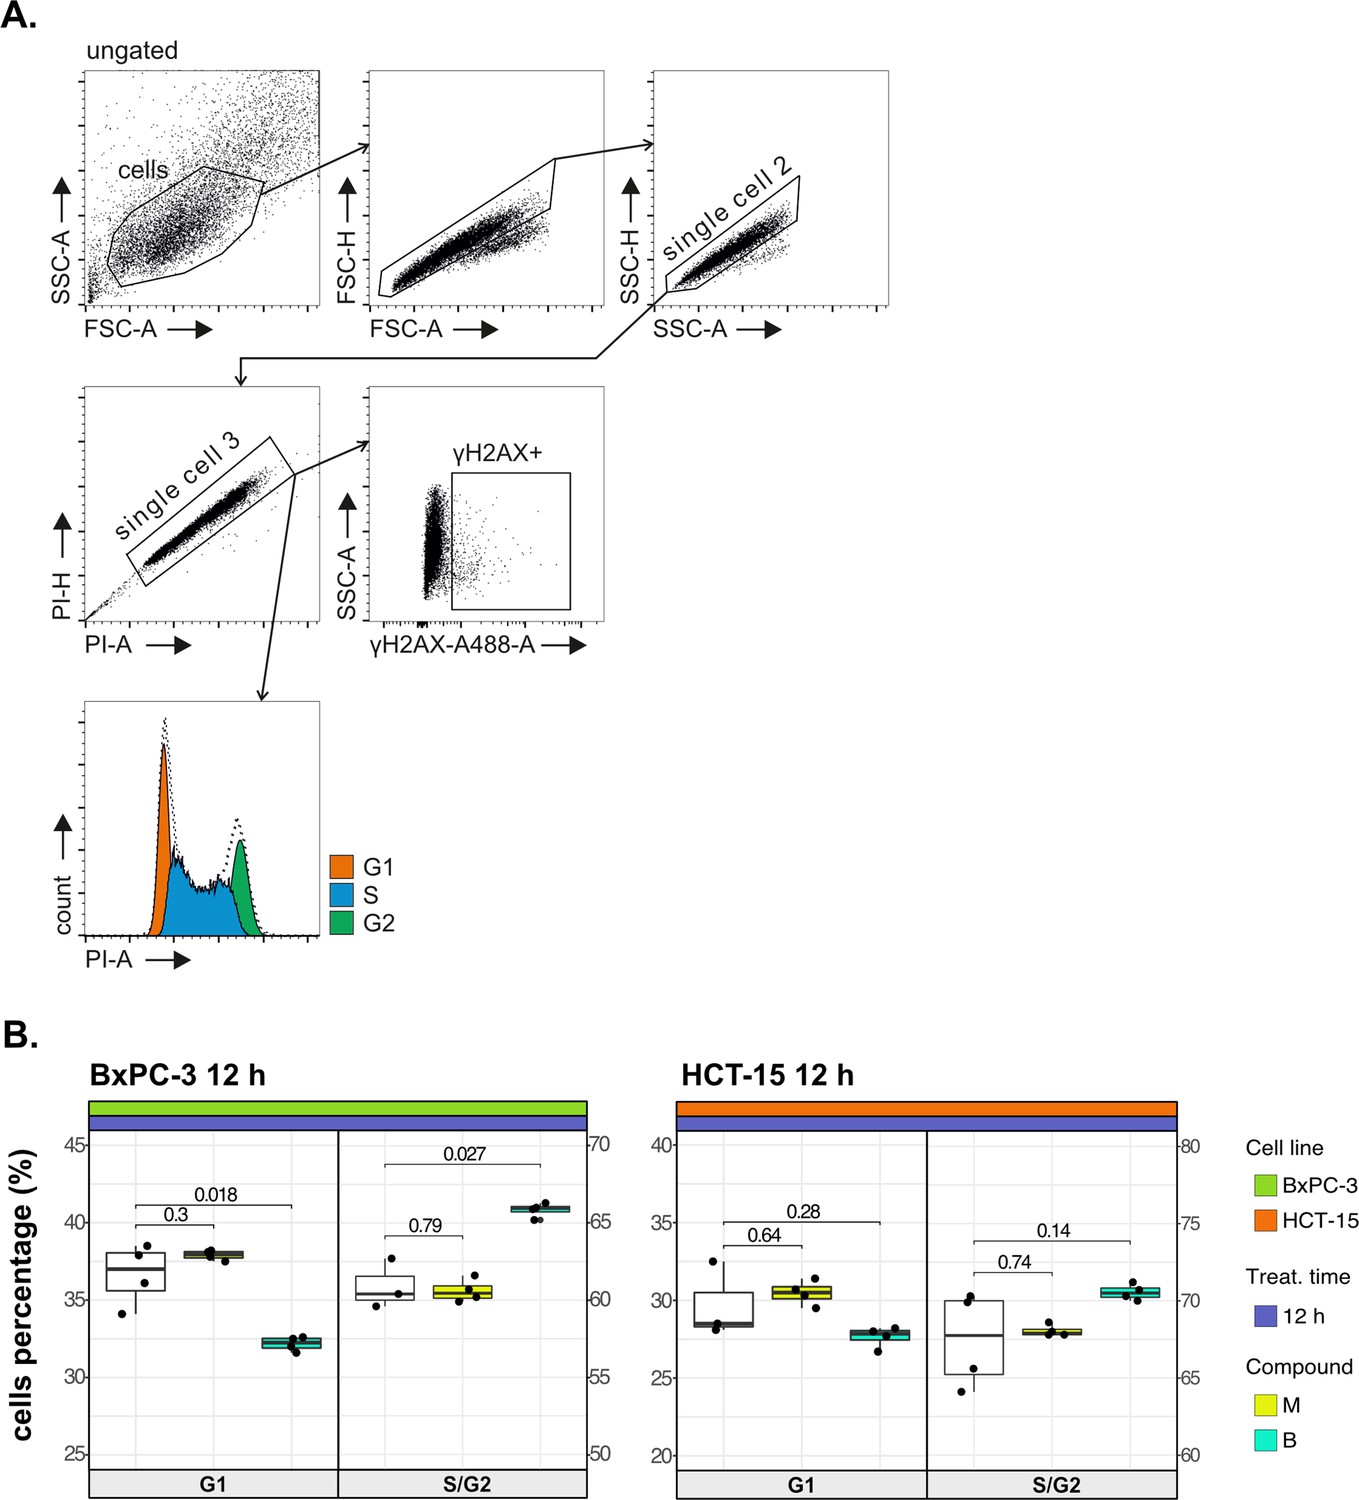
Cancer tropism of 3-CePs is not explained by DNA damage—supporting data.
(A) Flow cytometry gating strategy for the cell cycle analysis and γH2AX induction. (B) Cell cycle distribution (accumulation in G1 vs G2/S phases) of BxPC-3 and HCT-15 cells treated with M (10 nM), B (200 nM), or DMSO 0.5% for 12 hr analyzed by FACS. At least three biological replicates were obtained per condition, and unpaired two-tailed Student’s t-test was performed to assess statistical significance (p<0.05).
Figure 2 with 2 supplements

Treatments elicit cell-specific transcriptional changes.
(A) An overview of the applied workflow for the RNA-seq analysis. (B) Number of up- (red) and down-regulated (blue) differential expression (DE) genes in BxPC-3 and HCT-15 cells after treatment with M (10 nM), B (200 nM), or DMSO 0.5% (ctrl) for 6 hr and 12 hr (adjusted p threshold = 0.05, shrinkage = TRUE, and multiple testing method = independent hypothesis weighting [IHW]). (C) Gene ontology (GO) database functional enrichment gene set enrichment analysis (GSEA) on cell-specific and shared up- and down-regulated DE genes. For each identified biological process, enrichments in terms of count and p-value of representative terms are reported (p<0.05). (D) Expression level of cell-specific 6 hr DE genes across test conditions. GSEA was performed on modules with similar regulation identified by hierarchical clustering: for each cluster, representative GO terms and genes of the associated load are reported.
Figure 2—figure supplement 1

Treatments elicit cell-specific transcriptional changes—supporting data.
(A) Scheme of the applied workflow for the RNA-seq analyses. (B) Principal component analysis (PCA) post surrogate variable analysis (SVA) batch correction of RNA-seq data: PC1 vs PC2 showed sample separation by cell line, PC2 vs PC3 (cell lines depicted separately) showed treatment and time point separation. (C) Volcano plots reporting up- and down-regulated differential expression (DE) genes in all treated vs control comparisons (adjusted p<0.05). (D) Venn plot reporting the number of specific and shared up- and down-regulated DE genes between BxPC-3 and HCT-15 cells (union of DE genes in all treated vs control comparisons). (E) Enriched gene ontology (GO) terms (p<0.05) derived from gene set enrichment analysis (GSEA) on BxPC-3 and HCT-15 DE genes (union of DE genes in all treated vs control comparisons) and on shared DE genes (up- and down-regulated separately). (F) Schematic representation of enrichment map-based selection of representative GO terms to be reported in Figure 2C.
Figure 2—figure supplement 2

Treatments elicit cell-specific transcriptional changes—supporting data 2.
(A) Expression level of cell-specific 12 hr differential expression (DE) genes across test conditions. Gene set enrichment analysis (GSEA) was performed on modules with similar regulation identified by hierarchical clustering: for each cluster, representative gene ontology (GO) terms and genes of the associated load are reported. (B) GO database functional enrichment (GSEA) obtained from log2FC ranks in all treated vs control comparison both in BxPC-3 and HCT-15 cells. For each identified biological process, enrichments in terms of absolute normalized enrichment score (abs[NES]) and -log(p) of representative terms are reported (p<0.05).
Figure 3 with 1 supplement
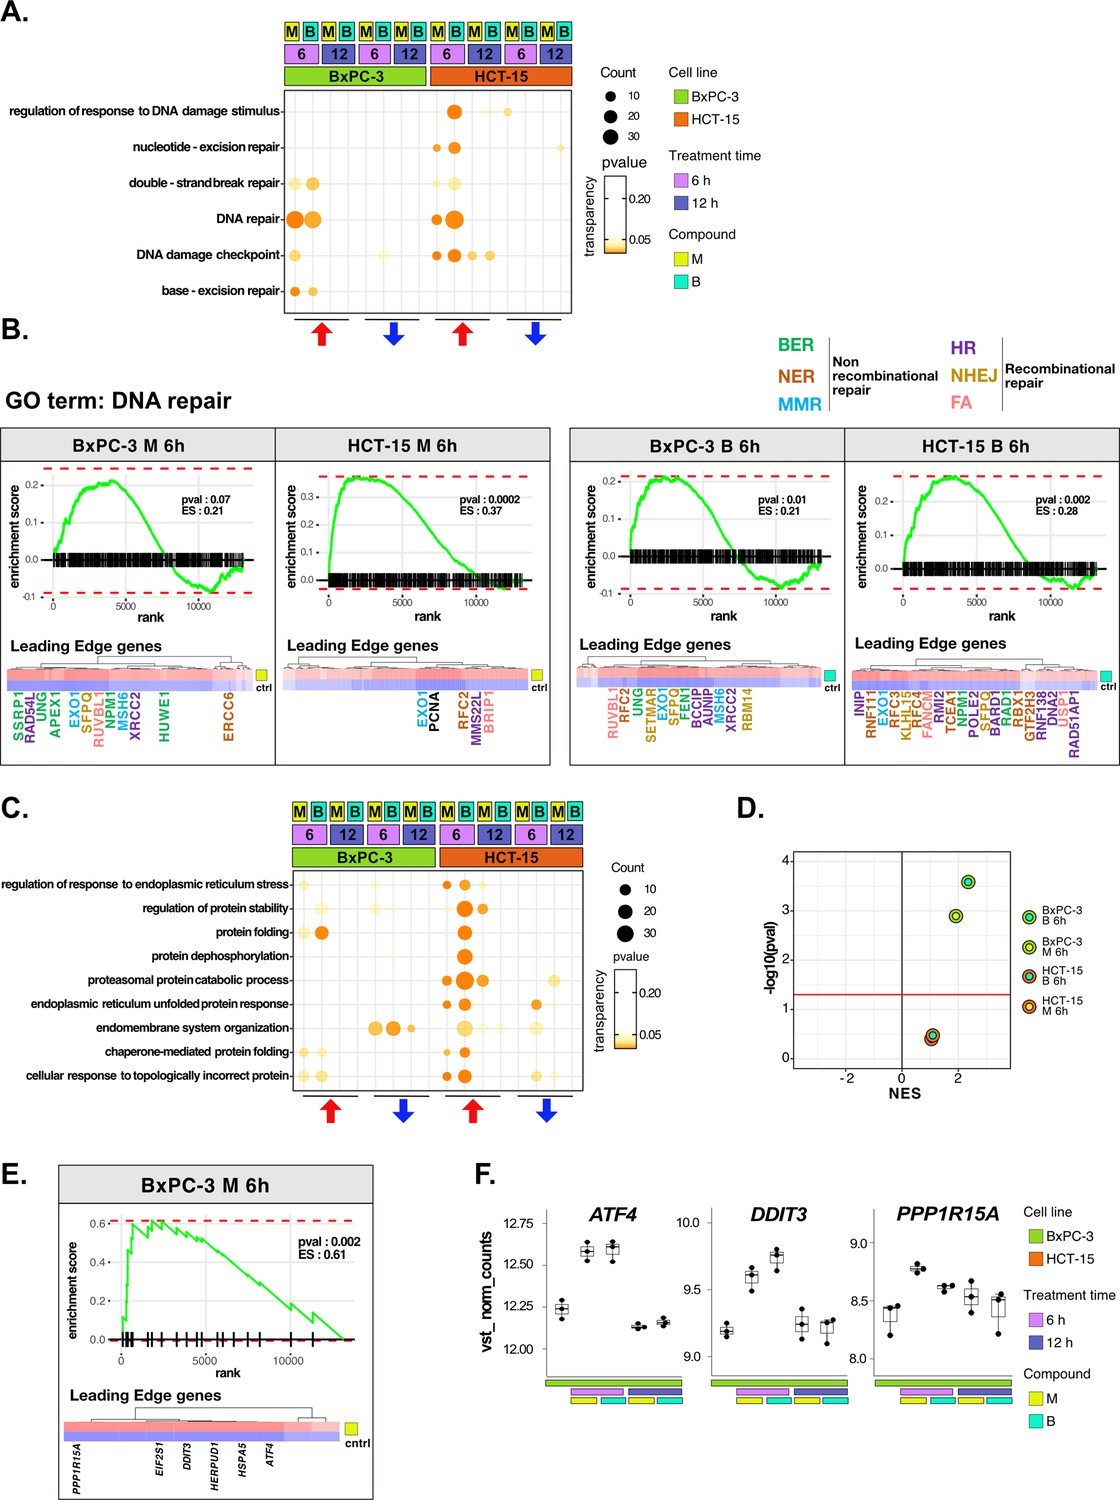
DNA repair and proteostasis are key modulators of the response to 3-chloropiperidines (3-CePs).
(A) Gene set enrichment analysis (GSEA) for terms related to DNA damage and repair performed on differential expression (DE) genes detected in each of the considered treated vs control comparisons. For each gene ontology (GO) term (p<0.05), enrichments in terms of count and p-value are reported. (B) GSEA enrichment plots for the DNA repair pathway obtained from log2FC ranks for each of the considered treated vs control comparisons. The expression of leading edge genes is also shown, where key DE genes are reported with the same color of their associated DNA repair pathways (BER = base excision repair, NER = nucleotide-excision repair, MMR = mismatch repair, HR = homologous recombination, NHEJ = non-homologous end joining, and FA = Fanconi anemia pathway) (Cantor et al., 2001; Charles Richard et al., 2016; Ferretti et al., 2016; Fortini et al., 2003; Fousteri and Mullenders, 2008; Jaafar et al., 2017; Johnson et al., 1999; Kunkel and Erie, 2005; Liu and Kong, 2021; Li and Jin, 2012; Li et al., 2009a; Lou et al., 2017; Lu et al., 2007; Mazin et al., 2010; McVey et al., 2016; Nijman et al., 2005; Niraj et al., 2019; Overmeer et al., 2010; Parsons et al., 2009; Pascucci et al., 2018; Piwko et al., 2016; Poletto et al., 2014; Poulsen et al., 2013; Prasad et al., 2000; Rajendra et al., 2014; Satoh and Hanawalt, 1996; Smirnova et al., 2005; Tellier and Chalmers, 2019; Westermark et al., 2003; Xu et al., 2008; Yard et al., 2016). (C) GSEA for terms related to protein stability and endoplasmic reticulum (ER) load performed on DE genes detected in each comparison. For each GO term, enrichments in terms of count and p-value are reported. (D) NES (normalized enrichment score) and -log10 pval for the log2FC rank-based GSEA enrichment of the GO term PERK-mediated unfolded protein response (UPR) in treated vs control comparisons. (E) GSEA enrichment plot for the PERK-mediated UPR pathway obtained from log2FC rank in the M 6 hr vs control comparison in BxPC-3 cells. The expression of leading edge genes is also shown, where key DE genes of the mentioned pathway are reported. (F) Boxplots showing the expression level of ATF4, DDIT3, and PPP1R15A (vst-transformed normalized counts) in BxPC-3 cells (n=3).
Figure 3—figure supplement 1
DNA repair and proteostasis are key modulators of the response to 3-chloropiperidines (3-CePs)—supporting data.
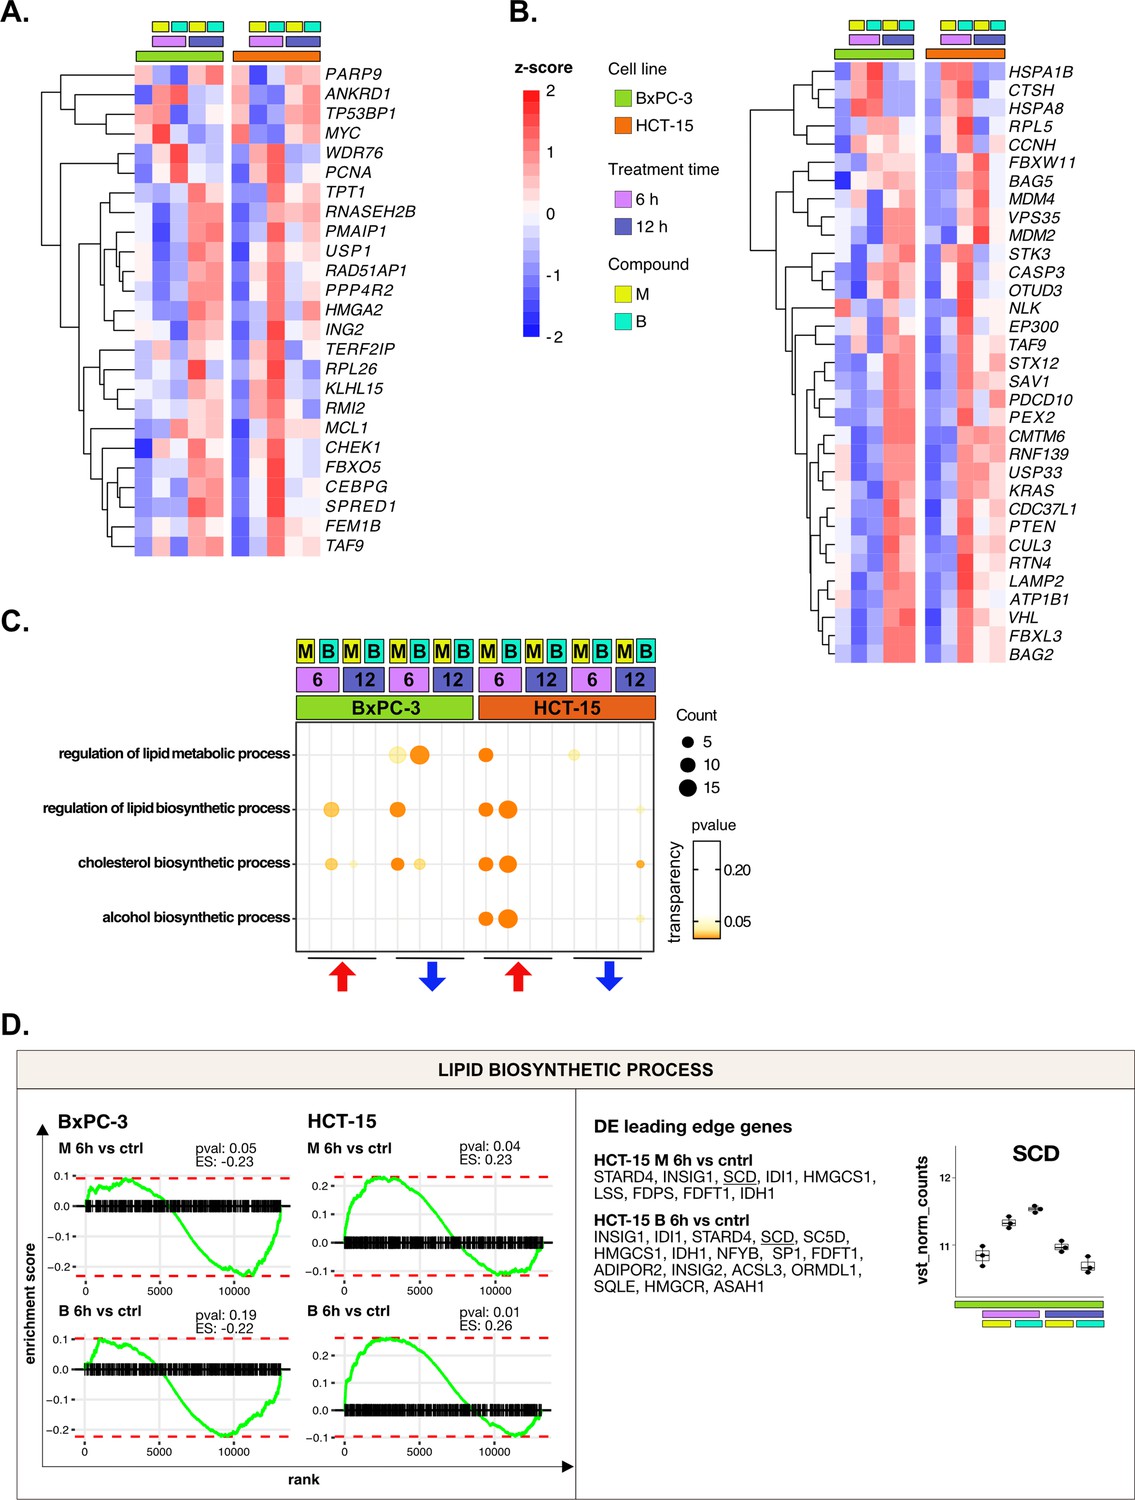
(A) Expression level of differential expression (DE) genes included in the load of the gene ontology (GO) term regulation of response to DNA damage stimulus (HCT-15 cells, p<0.05) in BxPC-3 and HCT-15 cells. (B) Expression level of DE genes included in the load of the GO term proteasomal protein catabolic process (HCT-15 cells, p<0.05) in BxPC-3 and HCT-15 cells. (C) Gene set enrichment analysis (GSEA) for terms related to lipid metabolism performed on DE genes detected in each of the considered treated vs control comparisons. For each GO term (p<0.05), enrichments in terms of count and p-value are reported. (D) GSEA enrichment plots for the DNA repair pathway obtained from log2FC ranks for each of the considered treated vs control comparisons. Key DE genes from the leading edge are reported, together with the expression of SCD in HCT-15 cells (normalized vst-transformed batch corrected counts, n=3).
Figure 4 with 2 supplements
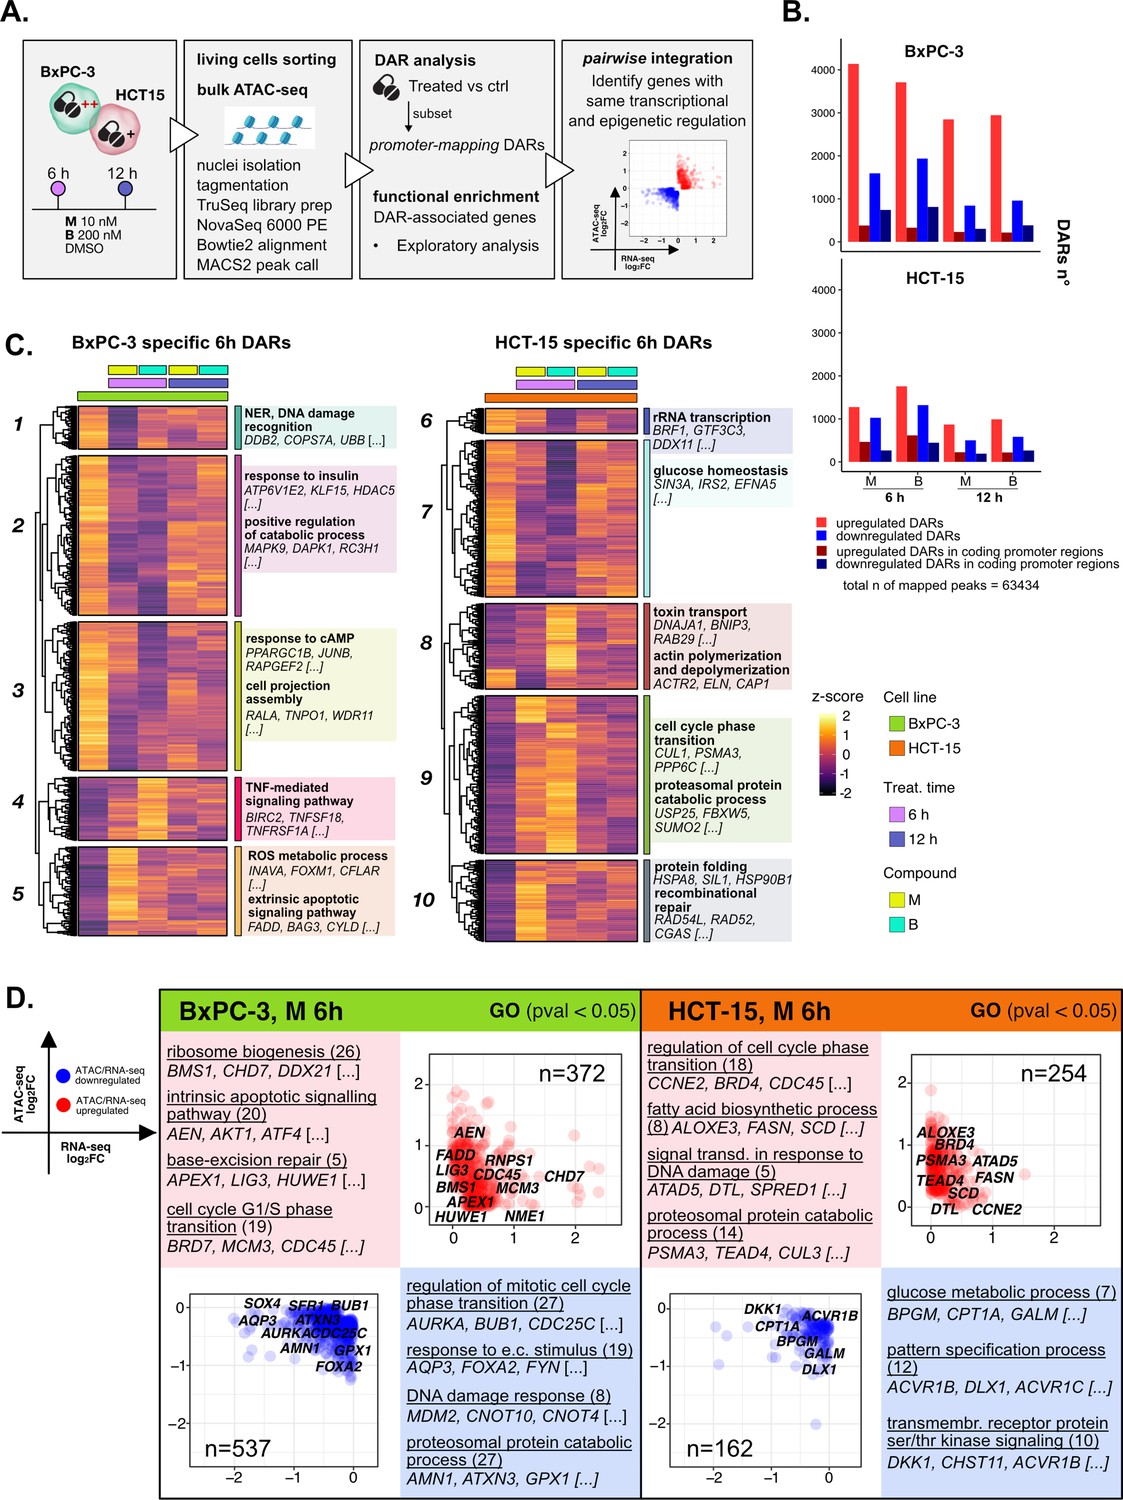
The response to 3-chloropiperidines (3-CePs) is further regulated at the chromatin level.
(A) An overview of the applied workflow for the ATAC-seq analysis. (B) Number of up- (red) and down-regulated (blue) differentially accessible regions (DARs) in BxPC-3 and HCT-15 cells after treatment with M (10 nM), B (200 nM), or DMSO 0.5% (ctrl) for 6 hr and 12 hr (p-value threshold = 0.05, shrinkage = TRUE). Light blue/red = all detected DARs, dark blue/red = protein coding DARs mapping in promoter regions. (C) Accessibility level of cell-specific 6 hr DARs across test conditions. Gene set enrichment analysis (GSEA) was performed on genes associated with DARs with similar regulation, grouped in modules identified by hierarchical clustering: for each cluster, representative gene ontology (GO) terms and genes of the associated load are reported. (D) Pairwise integration: ratio-ratio plots report the RNA- and ATAC-seq log2FCs of genes showing the same direction of transcriptional and chromatin accessibility regulation and their GSEA. Integration was performed not only at the same time point of 6 hr in both omic layers. For each GO term (p<0.05), enrichments in terms of count and p-value are reported.
Figure 4—figure supplement 1
The response to 3-chloropiperidines (3-CePs) is further regulated at the chromatin level—supporting data.
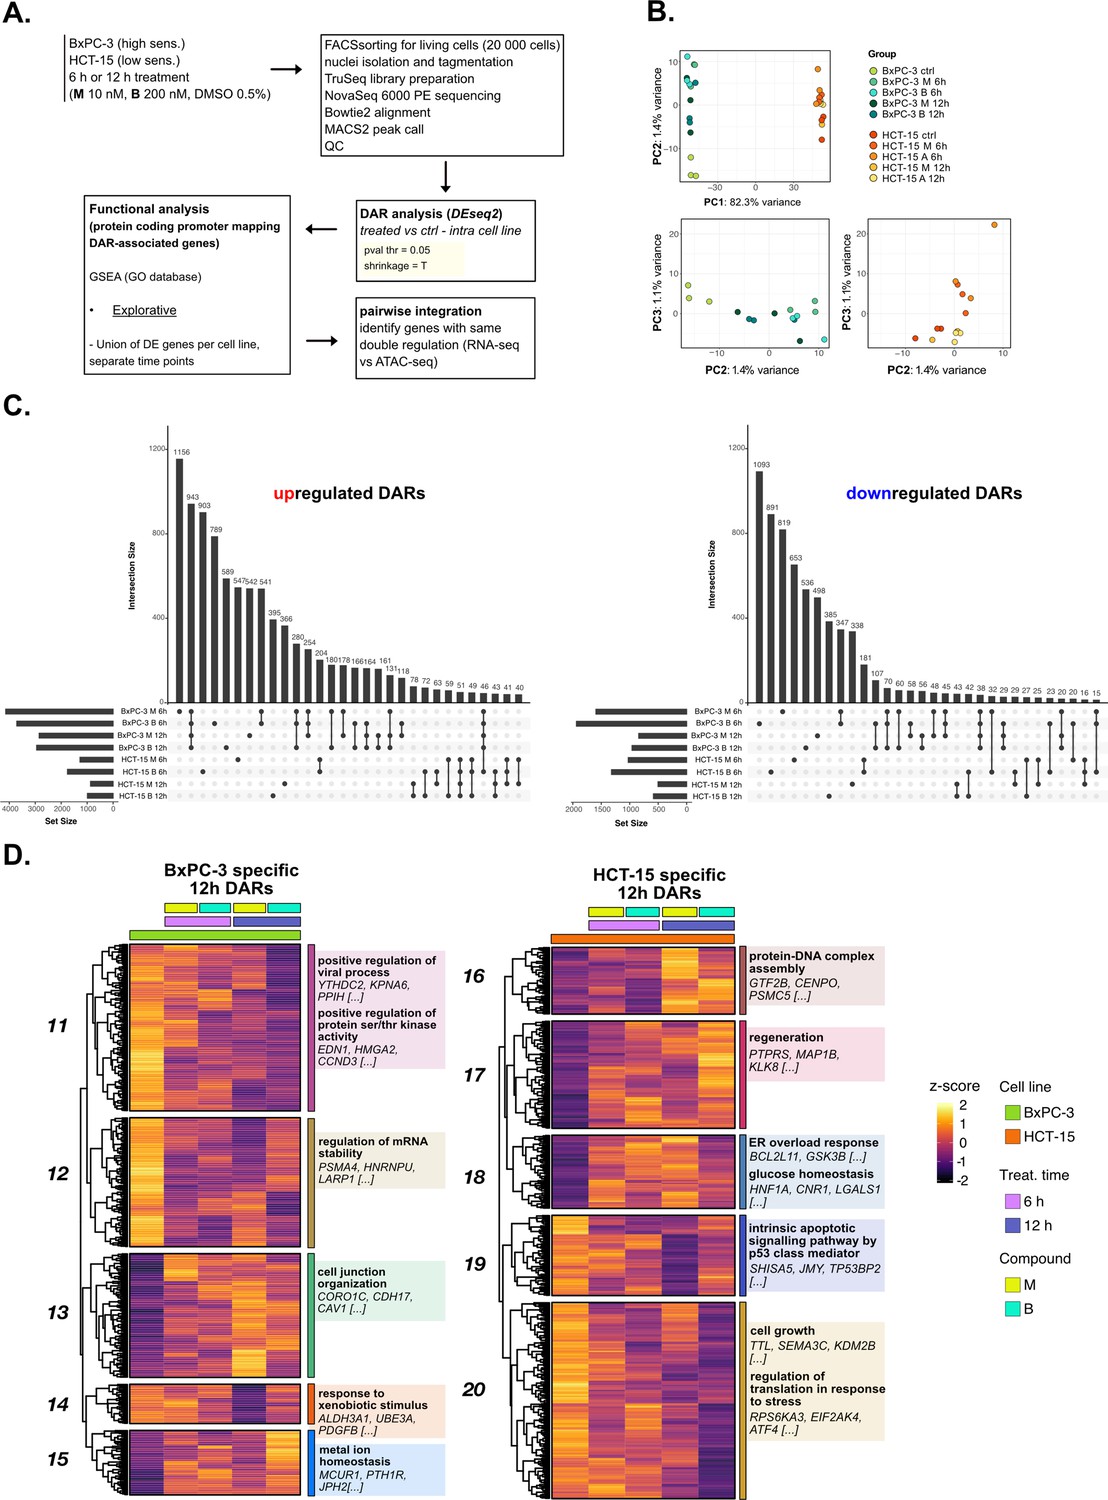
(A) Scheme of the applied workflow for the ATAC-seq analyses. (B) Principal component analysis (PCA) of ATAC-seq data: PC1 vs PC2 showed samples separation by cell line and PC2 vs PC3 (cell lines depicted separately) showed treatment and time point separation. (C) Upset plots reporting up- and down-regulated differentially accessible regions (DARs) (p<0.05) and their overlap between all treated and control comparisons in both cell lines. (D) Accessibility level of cell-specific 12 hr DARs across test conditions. Gene set enrichment analysis (GSEA) was performed on genes associated with DARs with similar regulation, grouped in modules identified by hierarchical clustering: for each cluster, representative gene ontology (GO) terms and genes of the associated load are reported.
Figure 4—figure supplement 2

The response to 3-chloropiperidines (3-CePs) is further regulated at the chromatin level—supporting data 2.
(A) Pairwise integration: ratio-ratio plots report the RNA- and ATAC-seq log2FCs of genes showing the same direction of transcriptional and chromatin accessibility regulation. Integration was performed not at the same time point of 6 hr in both omic layers for compound B. Associated key gene set enrichment analysis (GSEA) terms with p<0.05 are also reported. (B) Pairwise integration performed at the same time point of 12 hr in both omic layers in response to M and B. Associated key GSEA terms with p<0.05 are also reported. (C) The integration was also performed between chromatin changes at 6 hr and transcriptional responses at 12 hr. Associated key GSEA terms with p<0.05 are also reported.
Figure 5 with 1 supplement
Crosswise integration expedites the comprehension of multi-omic data.
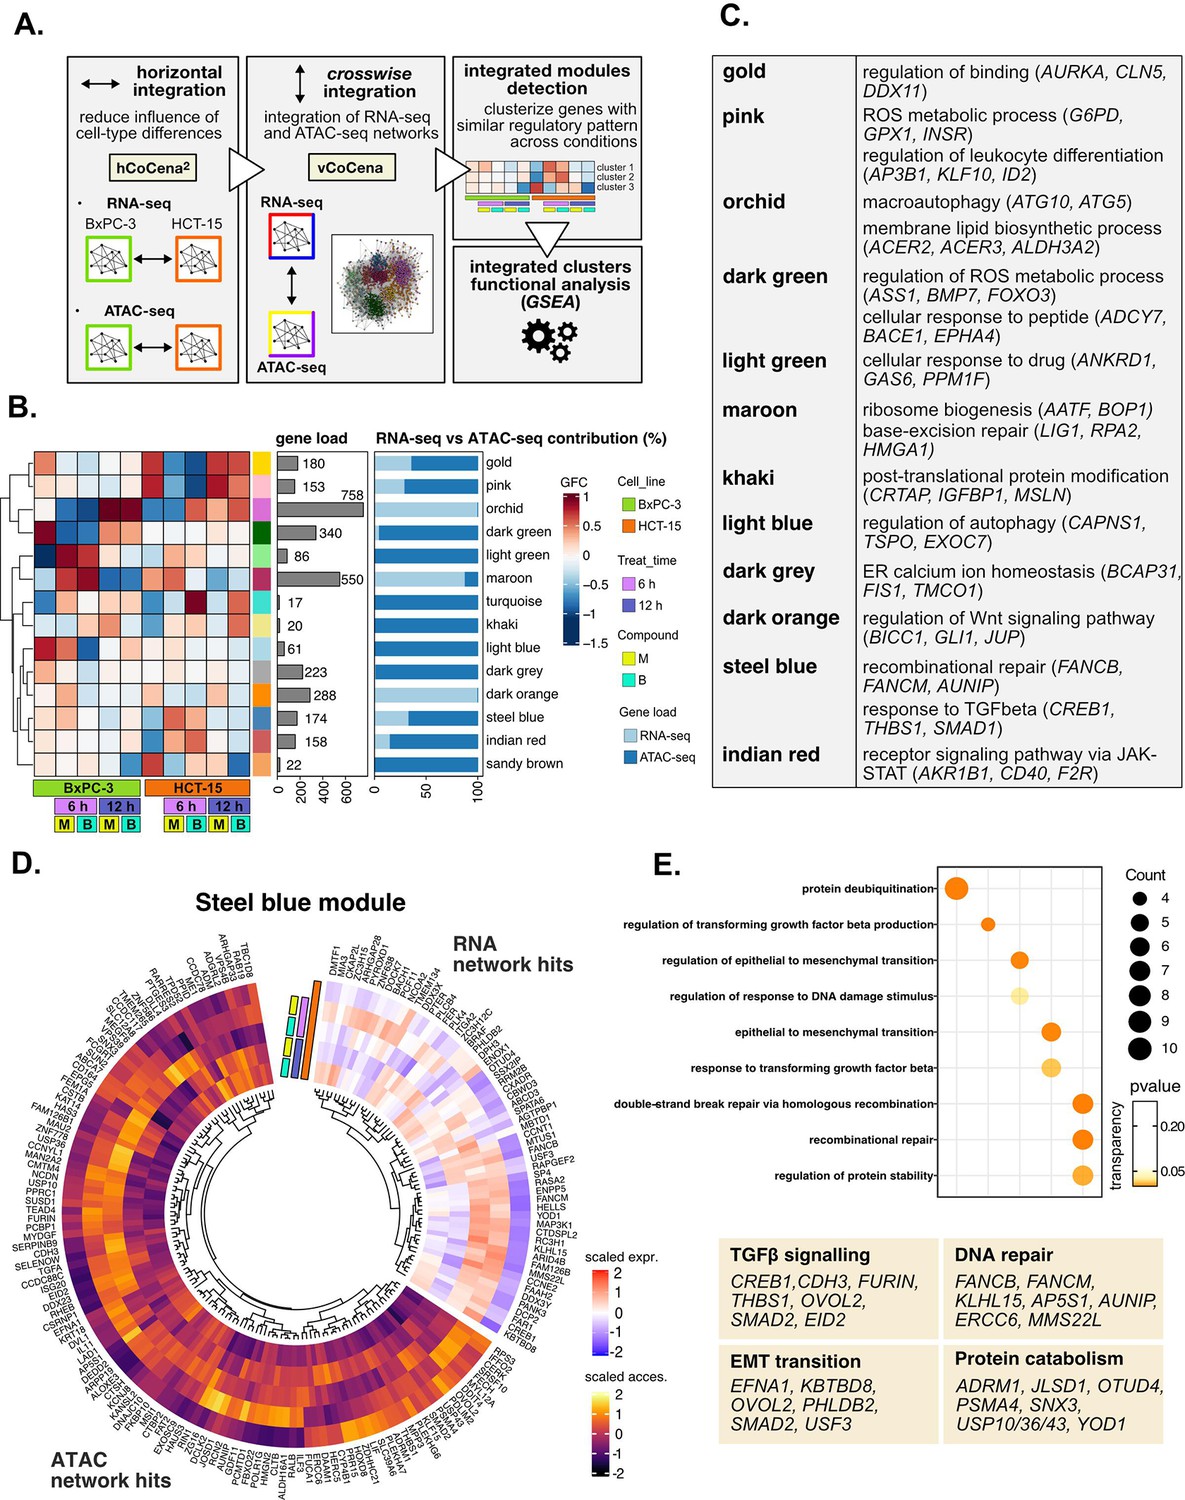
(A) Overview of the applied workflow for the crosswise integration analysis. (B) Integrated modules of genes from the RNA- and ATAC-seq layers obtained with vertical construction of co-expression network analysis (vCoCena) and associated group fold change (GFC) pattern of regulation across conditions. The relative contribution of hits from the RNA- or ATAC-seq layers is also reported for each module. (C) Representative gene ontology (GO) terms (p<0.05) for the most relevant modules of genes, identified by gene set enrichment analysis (GSEA). Enrichments in terms of count and p-value are reported. (D) Expression and chromatin accessibility levels in HCT-15 cells of genes included in the steelblue module (nodes can come from the RNA- or ATAC-seq layer). (E) Most representative GO terms from GSEA on genes of the steelblue module (key areas: EMT (Epithelial-Mesenchymal Transition), protein catabolism, TGF β signaling, and DNA repair). For each GO term (p<0.05), enrichments in terms of count and p-value are reported.
Figure 5—figure supplement 1
Crosswise integration expedites the comprehension of multi-omic data—supporting data.
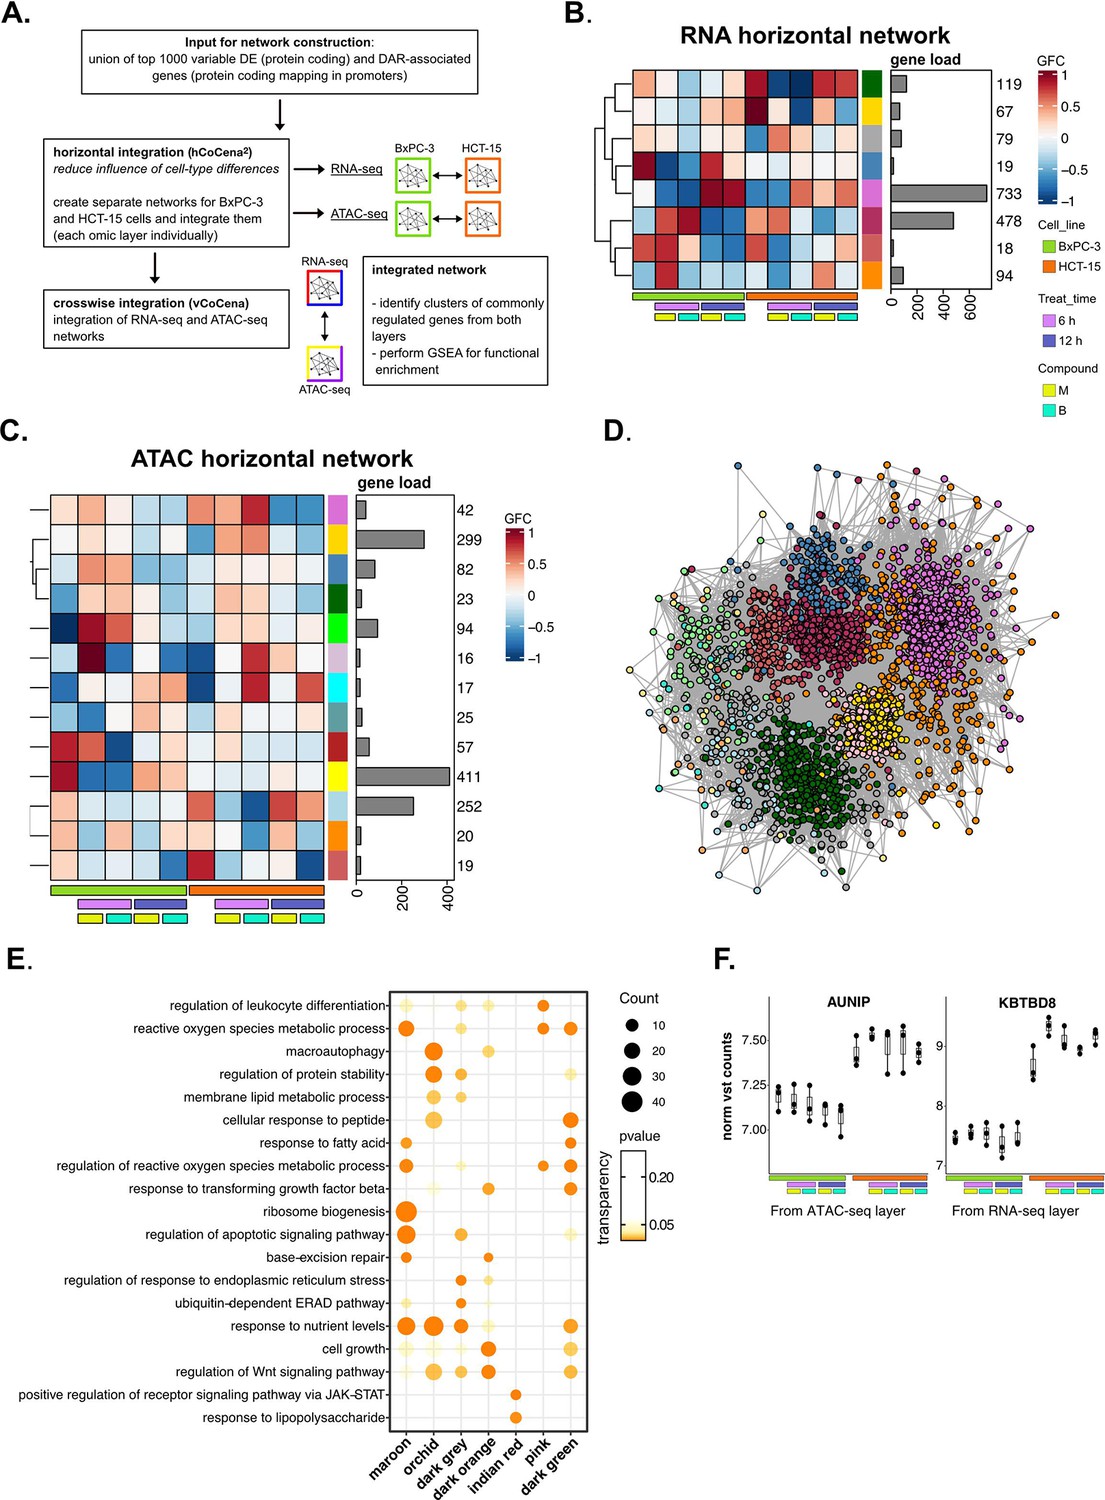
(A) Scheme of the applied workflow for the crosswise integration analysis. (B) Horizontally integrated modules of genes from the RNA-seq layer and associated group fold change (GFC) pattern of regulation across conditions. (C) Horizontally integrated modules of genes from the ATAC-seq layer and associated GFC pattern of regulation across conditions. (D) Crosswise integrated vertical construction of co-expression network analysis (vCoCena) network. (E) Most representative gene ontology (GO) terms from gene set enrichment analysis (GSEA) on genes of the maroon, orchid, dark orange, dark grey, indian red, pink, and dark green modules. For each GO term (p<0.05), enrichments in terms of count and p-value are reported. (F) Boxplots showing the expression level of AUNIP and KBTBD8 (vst-transformed normalized counts, batch corrected in RNA-seq, n=3) in BxPC-3 and HCT-15 cells.
Figure 6 with 2 supplements
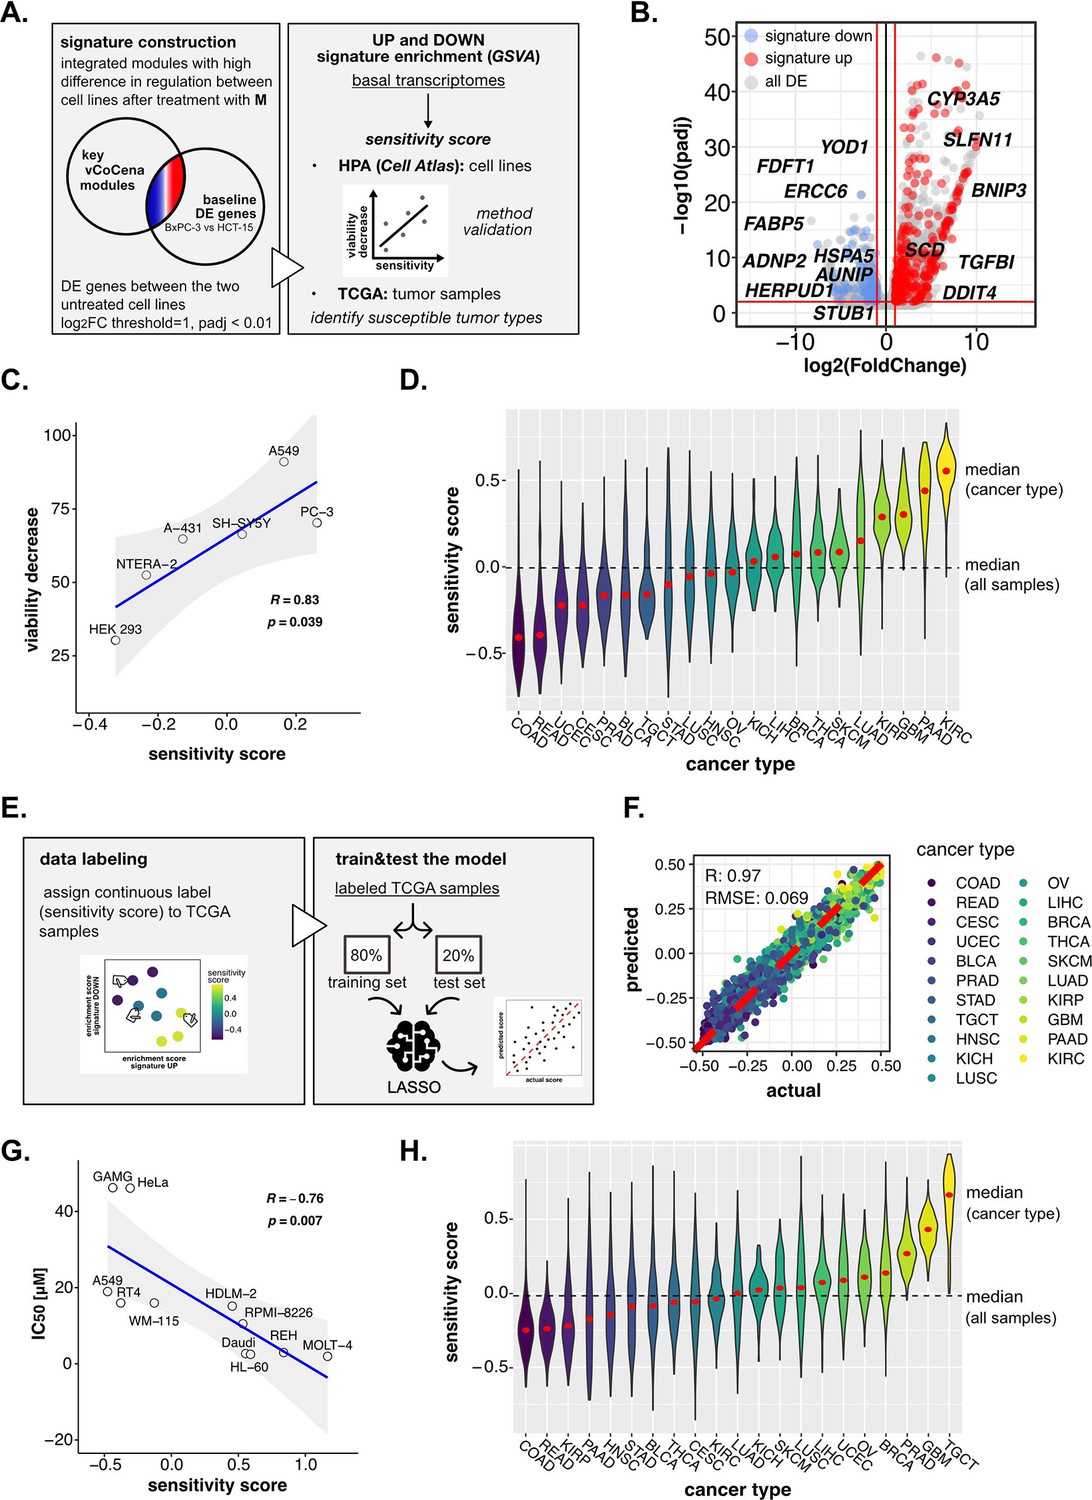
Perturbation-informed basal signatures efficiently predict sensitivity to our candidate drugs.
(A) Overview of the applied workflow for the sensitivity signature construction and associated drug susceptibility prediction. (B) M sensitivity signature genes (red = signature up and blue = signature down) pinpointed from all differential expression (DE) genes in the BxPC-3 vs HCT-15 baseline comparison. (C) Pearson correlation between predicted sensitivity score and viability decrease in a subset of human protein atlas (HPA) (cell atlas) cell lines (validation set). (D) Sensitivity scores predicted from gene set variation analysis (GSVA) enrichment of our up and down signatures in RNA-seq profiles of TCGA tumor samples. Median values for all sample scores and within each tumor type are reported. (E) Overview of the applied workflow for the LASSO-based ML setup. (F) Predictive outcome of the trained model (Pearson correlation R and RMSE (root-mean-square error) are reported). (G) Pearson correlation between predicted cisplatin sensitivity score and IC50 in a subset of HPA (cell atlas) cell lines (validation set). (H) Cisplatin sensitivity scores predicted from GSVA enrichment of our up and down signatures in RNA-seq profiles of TCGA tumor samples. Median values for all sample scores and within each tumor type are reported.
Figure 6—figure supplement 1
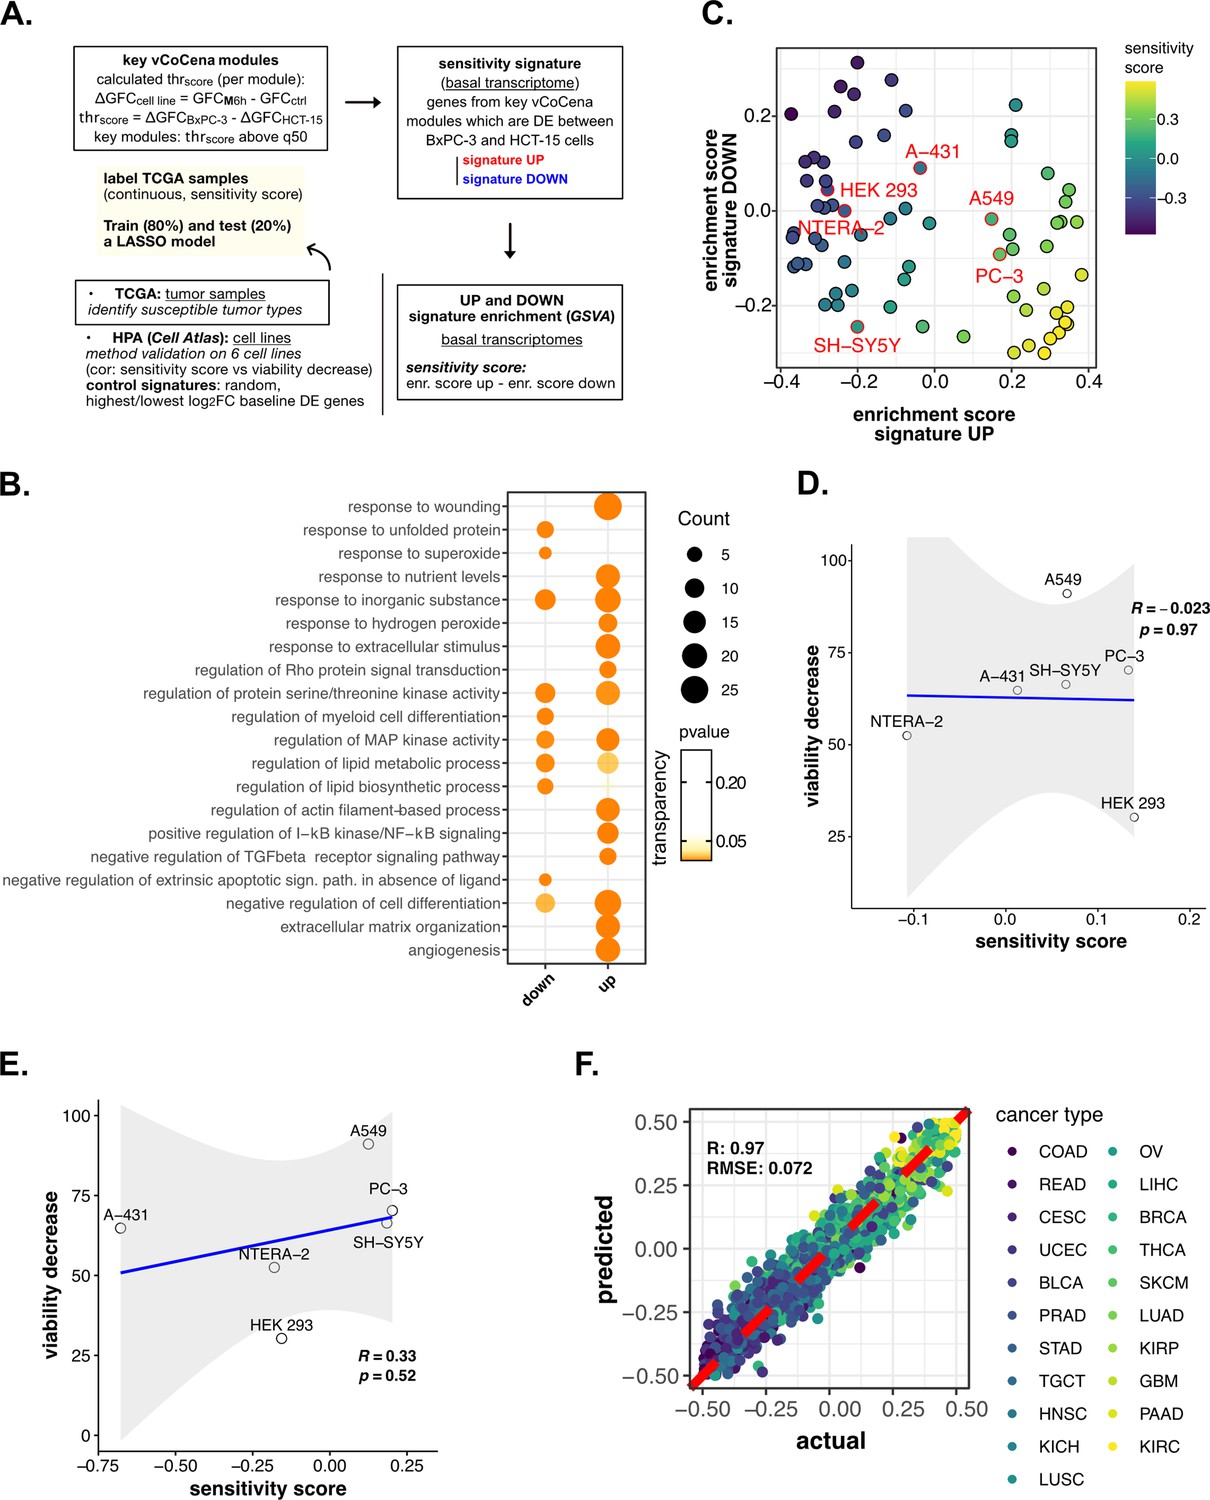
Perturbation-informed basal signatures efficiently predict sensitivity to our candidate drugs—supporting data.
(A) Scheme of the applied workflow for the sensitivity signature construction and associated drug susceptibility prediction. (B) Representative gene ontology (GO) terms (p<0.05) for genes of the M sensitivity signature (up and down), identified by gene set enrichment analysis (GSEA). Enrichments in terms of count and p-value are reported. (C) Human protein atlas (HPA) (cell atlas) cell lines separation based on gene set variation analysis (GSVA) enrichment of our newly constructed up vs down signatures of sensitivity to M. Color scale reflects samples predicted sensitivity score (up signature enrichment - down signature enrichment). (D) Pearson correlation between predicted sensitivity score and viability decrease in a subset of HPA (cell atlas) cell lines (validation set) using a random signature. (E) Pearson correlation between predicted sensitivity score and viability decrease in a subset of HPA (cell atlas) cell lines (validation set) using a control signature composed by differential expression (DE) genes with top up and down log2FC. (F) Predictive performance after the exclusion of genes belonging to our signature from training and test set transcriptomes (Pearson correlation R and RMSE are reported).
Figure 6—figure supplement 2
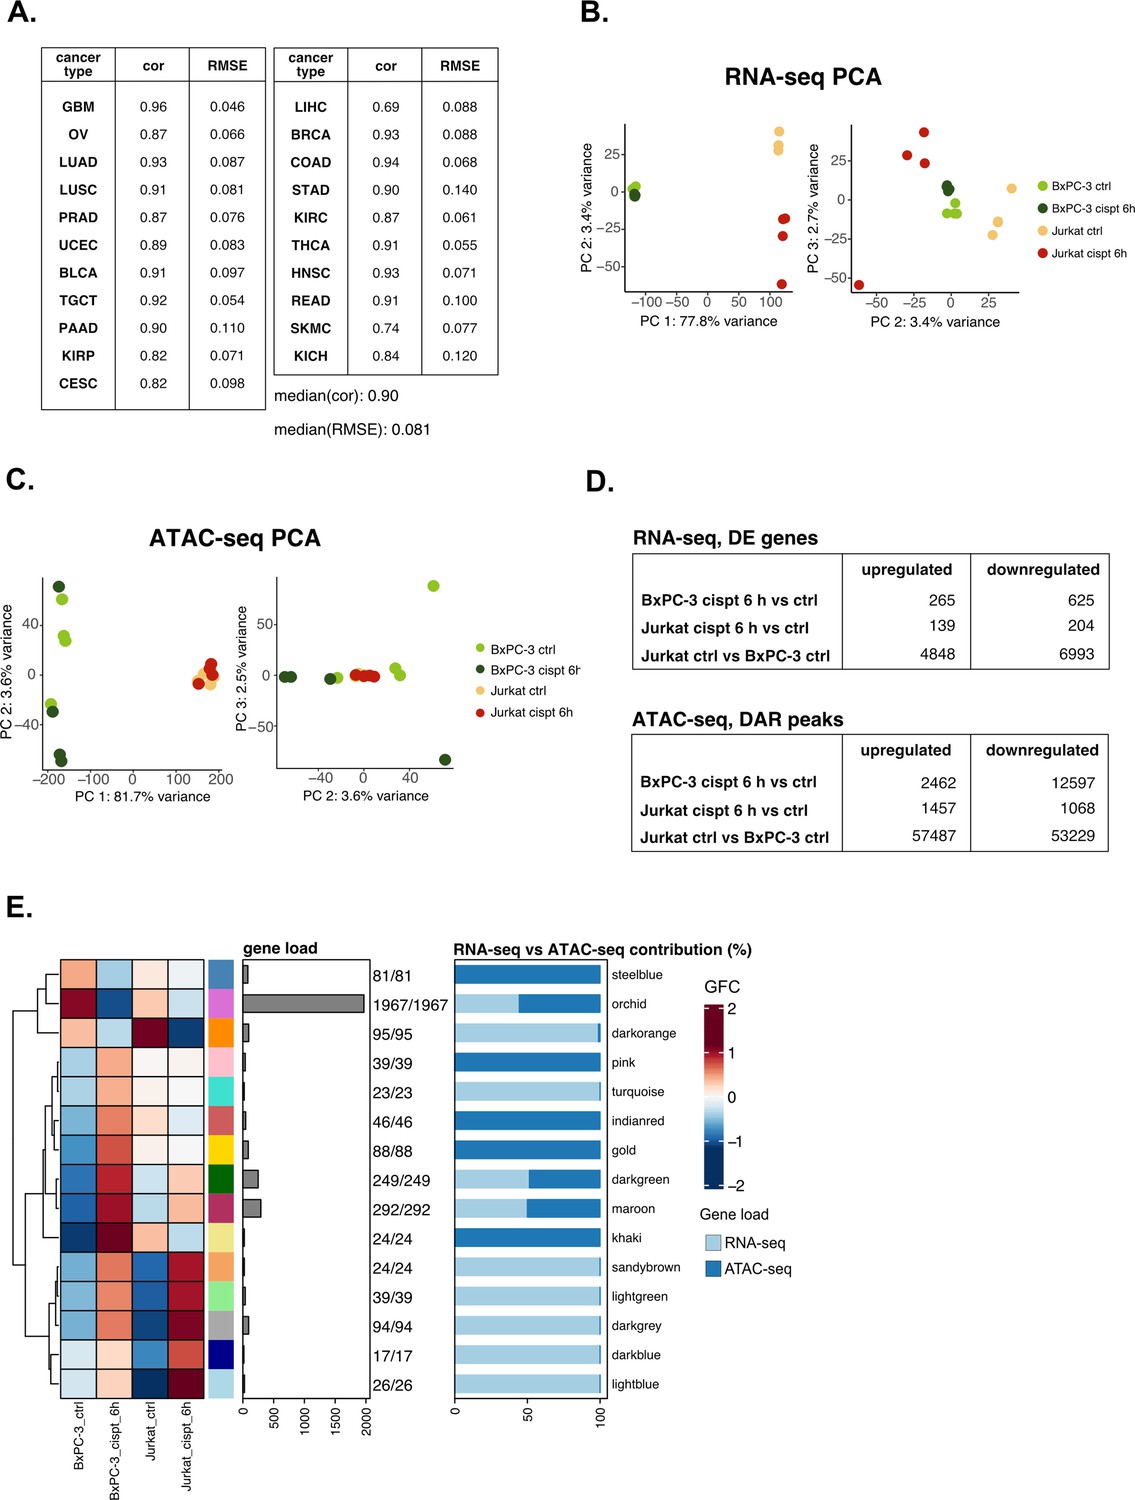
Validation analysis on cisplatin sensitivity confirms the versatility of the pipeline.
(A) Predicting performance of our model on tumor-specific subtypes (Pearson’s correlation and RMSE are reported). (B) RNA-seq principal component analysis (PCA) (PCs 1 vs 2 and 2 vs 3) for the cisplatin dataset. (C) ATAC-seq PCA (PCs 1 vs 2 and 2 vs 3) for the cisplatin dataset. (D) Identified number of differential expression (DE) and differentially accessible regions (DARs) in all comparisons for the cisplatin datasets using parameters described in Methods section. (E) Crosswise integrated cisplatin vertical construction of co-expression network analysis (vCoCena) network.
Author response image 1
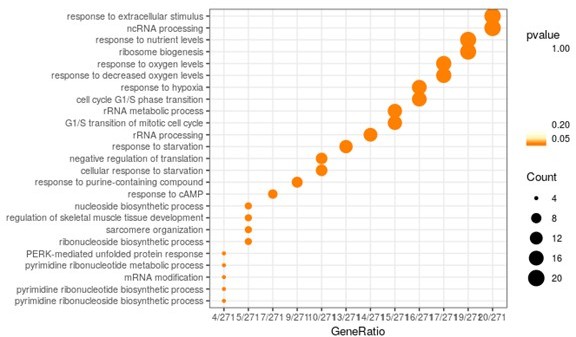
GSEA analysis on the whole overlap (300 genes) between DE genes from the baseline comparison (BxPC-3 ctrl vs HCT-15 ctrl) and those from the 6 h M treatment comparison, in the sensitive cell line (BxPC-3 M 6 h vs BxPC-3 ctrl).
Gene ratio is defined as the count of genes belonging to the specific GO term over the whole DE genes input.
Tables
Key resources table
| Reagent type (species) or resource | Designation | Source or reference | Identifiers | Additional information |
|---|---|---|---|---|
| Cell line (Homo-sapiens) | HCT-15 | ATCC | #CCL-225 | |
| Cell line (Homo-sapiens) | BxPC-3 | ATCC | #CRL-1687 | |
| Cell line (Homo-sapiens) | A549 | ATCC | #CRM-CCL-185 | |
| Cell line (Homo-sapiens) | HEK-293 | ATCC | #CRL-1573 | |
| Cell line (Homo-sapiens) | Jurkat | ATCC | #TIB-152 | |
| Cell line (Homo-sapiens) | PC-3 | Others (see Cell lines culturing) | ||
| Cell line (Homo-sapiens) | NTERA-2 | Others (see Cell lines culturing) | ||
| Cell line (Homo-sapiens) | SH-SY5Y | Others (see Cell lines culturing) | ||
| Cell line (Homo-sapiens) | A-431 | Others (see Cell lines culturing) | ||
| Antibody | Anti-human H2A.X, (mouse monoclonal, clone 2F3) | Biolegend | #613405 | (FC = 1:25) |
| Peptide, recombinant protein | Tn5 | In-house | ||
| Commercial assay or kit | Foxp3 Transcription Factor Staining Buffer Set | eBioscience | #00-5523-00 | |
| Commercial assay or kit | miRNeasy mini kit | QIAGEN | ||
| Commercial assay or kit | TruSeq stranded total RNA kit | Illumina | ||
| Chemical compound, drug | Pico488 dsDNA quantification reagent | Lumiprobe | ||
| Chemical compound, drug | Propidium Iodide | Sigma | #P4864 | |
| Chemical compound, drug | LIVE/DEAD Near-IR fixable dye | Invitrogen | ||
| Chemical compound, drug | M, B | Carraro et al., 2019; Zuravka et al., 2014 | ||
| Chemical compound, drug | cisplatin | Sigma | ||
| Software, algorithm | FlowJo | BD | ||
| Software, algorithm | bcl2fastq2 | Illumina | ||
| Software, algorithm | STAR | Dobin et al., 2013 | ||
| Software, algorithm | R | https://www.r-project.org/ | ||
| Software, algorithm | DESeq2 | Bioconductor | ||
| Software, algorithm | clusterProfiler | Bioconductor | ||
| Software, algorithm | Trimmomatic | Bolger et al., 2014 | ||
| Software, algorithm | bowtie2 | Langmead and Salzberg, 2012 | ||
| Software, algorithm | Picard | http://broadinstitute.github.io/picard | ||
| Software, algorithm | deeptools | Ramírez et al., 2014 | ||
| Software, algorithm | samtools | Ernst et al., 2009 | ||
| Software, algorithm | MACS2 | Lawrence et al., 2013 | ||
| Software, algorithm | GenomicRanges | Zhang et al., 2008 | ||
| Software, algorithm | GenomicAlignments | Zhang et al., 2008 | ||
| Software, algorithm | ChIPseeker | Bioconductor | ||
| Software, algorithm | hCoCena | https://github.com/MarieOestreich/hCoCena; Oestreich, 2022 | ||
| Software, algorithm | vCoCena | This publication | ||
| Software, algorithm | glmnet | Friedman et al., 2010 |
Additional files
-
Supplementary file 1
Gene ontology (GO) enrichment results for differential expression (DE) genes sets reported in Figure 2C (BxPC-3 specific upregulated, HCT-15 specific upregulated, shared upregulated, BxPC-3 specific downregulated, HCT-15 specific downregulated, shared downregulated).
- https://cdn.elifesciences.org/articles/78012/elife-78012-supp1-v1.xlsx
-
Supplementary file 2
Gene ontology (GO) enrichment results for genes belonging to the specified heatmap clusters reported in Figure 2D (BxPC-3 and HCT-15 cells DE genes after 6 hr of treatment) and Figure 2—figure supplement 2A (BxPC-3 and HCT-15 cells differential expression DE genes after 12 hr of treatment).
- https://cdn.elifesciences.org/articles/78012/elife-78012-supp2-v1.xlsx
-
Supplementary file 3
Gene ontology (GO) enrichment results for differentially accessible region (DAR)-associated genes belonging to the specified heatmap clusters reported in Figure 4C (BxPC-3 and HCT-15 cells DAR genes after 6 hr of treatment) and Figure 4—figure supplement 1D (BxPC-3 and HCT-15 cells DAR-associated genes after 12 hr of treatment).
- https://cdn.elifesciences.org/articles/78012/elife-78012-supp3-v1.xlsx
-
Supplementary file 4
Gene ontology (GO) enrichment results for detected vertical construction of co-expression network analysis (vCoCena) modules reported in Figure 5B.
- https://cdn.elifesciences.org/articles/78012/elife-78012-supp4-v1.xlsx
-
Supplementary file 5
Up and down sensitivity signature gene list for compound M.
- https://cdn.elifesciences.org/articles/78012/elife-78012-supp5-v1.xlsx
-
Supplementary file 6
Average viability decrease in cell lines treated with M 10 nM for 72 hr with associated SD.
For each cell line, predicted sensitivity scores based on our perturbation-informed signature (signature SS), a random one (random SS), a control one based on top up and down log2FC differential expression (DE) genes between BxPC-3 and HCT-15 (topFC SS) were also reported.
- https://cdn.elifesciences.org/articles/78012/elife-78012-supp6-v1.xlsx
-
Supplementary file 7
Top up and down log2FC control sensitivity signature gene list used as control.
- https://cdn.elifesciences.org/articles/78012/elife-78012-supp7-v1.xlsx
-
Supplementary file 8
Up and down sensitivity signature gene list for cisplatin.
- https://cdn.elifesciences.org/articles/78012/elife-78012-supp8-v1.xlsx
-
Supplementary file 9
Reported IC50 for cell lines treated with cisplatin (Genomics of Drug Sensitivity in Cancer database).
For each cell line, predicted sensitivity scores based on our perturbation-informed signature are reported (signature SS).
- https://cdn.elifesciences.org/articles/78012/elife-78012-supp9-v1.xlsx
-
Supplementary file 10
Enrichment maps obtained for each group of genes depicted in the Figure 2C dotplot.
- https://cdn.elifesciences.org/articles/78012/elife-78012-supp10-v1.pdf
-
Transparent reporting form
- https://cdn.elifesciences.org/articles/78012/elife-78012-transrepform1-v1.docx
Download links
A two-part list of links to download the article, or parts of the article, in various formats.
Downloads (link to download the article as PDF)
Open citations (links to open the citations from this article in various online reference manager services)
Cite this article (links to download the citations from this article in formats compatible with various reference manager tools)
Decoding mechanism of action and sensitivity to drug candidates from integrated transcriptome and chromatin state
eLife 11:e78012.
https://doi.org/10.7554/eLife.78012


